
INTRODUCTION
Hepatocellular carcinoma (HCC) is one of the most common malignancies worldwide, for which the prognosis remains poor, particularly for those with advanced disease [1]. The recent approval of sorafenib as the first effective oral drug for HCC marks a significant milestone in the treatment of this disease [2]. Sorafenib is a multitargeted, small molecule tyrosine kinase inhibitor with multiple antitumor effects, including antiangiogenic, antiproliferative, and pro-apoptotic effects via inhibition of vascular endothelial growth factor receptor (VEGFR)-1, -2 and -3, platelet-derived growth factor receptor (PDGFR) β, Raf-1, B-Raf, and C-Raf [3]. Large randomized phase III studies indicate that sorafenib treatment improves the survival of patients with advanced HCC [4–6]. However, the response rate of sorafenib is quite low, and not all patients respond equally well to sorafenib treatment [4, 5], for reasons that are not entirely clear.
A variety of studies have shown that the inactivation of Ras/Raf/extracellular signal-regulated kinase (ERK) pathway and the activation of the phosphoinositide 3-kinase (PI3K)/protein kinase B (Akt)/mammalian target of rapamycin (mTOR) pathway in tumors play a critical role in the resistance to sorafenib [7–14]. Thus, these pathways may provide biomarkers to assess sorafenib-resistance before and throughout the course of treatment.
Currently, tumor tissues obtained by an excisional or needle biopsy are used for detection of drug targets. However, needle aspiration often fails to locate measurable objectives or obtain sufficient tumor samples, and only a small proportion of patients are eligible for surgical excision at diagnosis. Furthermore, invasive sampling is potentially harmful and expensive, and cannot be performed repeatedly. The collection of circulating tumor cells (CTCs) provides a viable alternative. CTCs are cancer cells shed from either the primary tumor or its metastases that circulate in the peripheral blood, which thus are available noninvasively and can be obtained repeatedly for a readily accessible real-time “liquid biopsy” of tumors [15]. Molecular characterization of CTCs has been used in the development of personalized targeted therapies in breast, lung, prostate, and colorectal cancer [16–21]. It is worth noting that there have been a considerable number of studies which investigated phospho-proteins expressed in CTCs and revealed their biological significance, such as pAkt [22], pSRC [23], pEGFR [24, 25], pFAK and pPI3K [26]. Also, pAkt and pERK have been widely studied in HCC tissues over a period of years [7–14, 27]. Thus, we utilized CTCs to evaluate the activation (phosphorylation) of ERK and Akt with sorafenib for treatment of HCC, and to determine if pERK/pAkt phenotyping of CTCs can be used as a viable diagnostic biomarker for sorafenib efficacy.
RESULTS
Classification of HCC patients via pERK/pAkt expression patterns in CTCs
CTC counts ranged from 0–137 per 5 mL of blood, and were detected in 101/109 (92.7%) patients with advanced HCC (52 ± 23 CTCs/5 mL). Immunofluorescence staining revealed specific and heterogeneous cytoplasmic expression of pERK and pAkt in CTCs (Fig. 1A); 25/101 (24.8%) patients had pERK+ CTCs, and 81/101 (80.2%) had pAkt+ CTCs. Generally, CTCs with various patterns of pERK/pAkt expression were found within blood samples from the same patient (Fig. 1B), some of which even contained all four possible phenotypes (pERK+/pAkt+, pERK+/pAkt−, pERK−/pAkt+, and pERK−/pAkt−). Patients were defined as pERK or pAkt positive based on the presence of pERK+ or pAkt+ CTCs, and then classified into four subsets according to the combination of pERK and pAkt positivity (Supplementary Table S1).
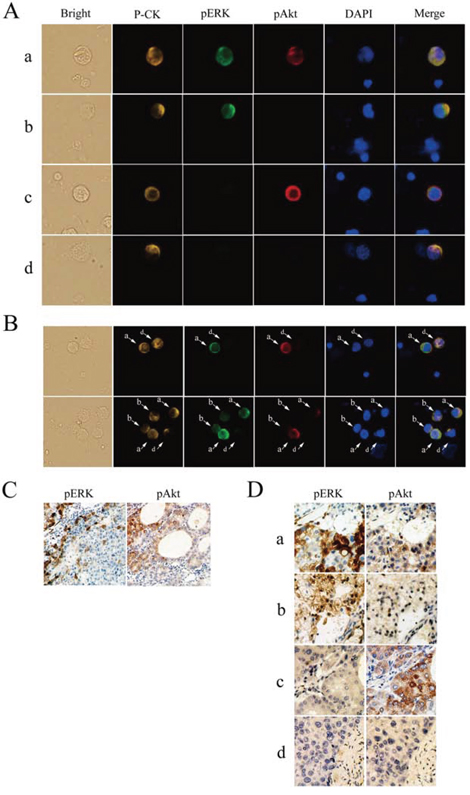
Figure 1: Detection of phosphorylated extracellular signal-regulated kinase (pERK) and protein kinase B (pAkt) in hepatocellular carcinoma. A. Circulating tumor cells (CTCs) stained for pan-cytokeratin (P-CK) (yellow), pERK (green), pAkt (red), and costained with 4’,6-diamidino-2-phenylindole (DAPI) (blue) (400× magnification). B. Coexistence of CTCs with various patterns of pERK/pAkt in the same field of view detected by multicolor immunofluorescence staining (200×). C. Immunohistochemical staining for pERK and pAkt in an individual cancer tissue (100×). D. Immunohistochemical staining for pERK and pAkt in serial sections of hepatocellular carcinoma tissues (200×); a, pERK+/pAkt+; b, pERK+/pAkt−; c, pERK−/pAkt+; d, pERK−/pAkt−.
Concordance of pERK/pAkt expression in CTCs and tumor tissues
pERK and pAkt were detected in tumor tissue specimens, but the expression was not uniform throughout (Fig. 1C). According to positivity-defining criteria as previously described [9], 7/32 (21.9%) tumors were classified as pERK+ and 27/32 (84.4%) were pAkt+, which were similar to the 24.8% and 80.2%, respectively, determined from CTC analyses. In addition, all four phenotype patterns of pERK/pAkt expression were observed in tissue specimens (Fig. 1D). The molecular classification based on analysis of both tumor tissues and CTCs in 32 patients is summarized in Table 1. CTCs were detected in 30/32 patients from whom tissue specimens were obtained, and molecular classification of CTC and tissue was concordant in 27/30 (90.0%) patients.
Table 1: pERK/pAkt phenotyping of tumor tissues and circulating tumor cells (CTCs) in patients with hepatocellular carcinoma, n = 32
Tumor tissues |
CTCs |
|||||
|---|---|---|---|---|---|---|
pERK+/pAkt+ |
pERK+/pAkt− |
pERK−/pAkt+ |
pERK−/pAkt− |
Not detected |
Total |
|
pERK+/pAkt+ |
4 |
0 |
0 |
0 |
0 |
4 |
pERK+/pAkt− |
1 |
2 |
0 |
0 |
0 |
3 |
pERK−/pAkt+ |
1 |
0 |
20 |
0 |
2 |
23 |
pERK−/pAkt− |
0 |
1 |
0 |
1 |
0 |
2 |
Total |
6 |
3 |
20 |
1 |
2 |
32 |
Note: Total concordance is 90% (27/30).
Distribution and percentage of pERK/pAkt phenotypes in CTCs
The molecular classification of all 101 patients with HCC that were categorized according to pERK or pAkt positivity in CTCs is presented in Table 2. The distribution and percentage of CTC phenotypes varied among individuals, even individuals within the same subset, and multiple phenotypes could be found within an individual.
Table 2: Molecular classification of hepatocellular carcinoma based on pERK/pAkt phenotypes of circulating tumor cells (CTCs), n = 101
Patient classification |
CTC phenotypes |
Patients (n) |
Total (n) |
|---|---|---|---|
PP |
PP |
1 |
16 |
PP, PN |
2 |
||
PP, NP |
0 |
||
PP, NN |
2 |
||
PN, NP |
2 |
||
PP, PN, NP |
2 |
||
PP, PN, NN |
1 |
||
PP, NP, NN |
1 |
||
PN, NP, NN |
3 |
||
PP, PN, NP, NN |
2 |
||
PN |
PN |
4 |
9 |
PN, NN |
5 |
||
NP |
NP |
16 |
65 |
NP, NN |
49 |
||
NN |
NN |
11 |
11 |
Abbreviations: NN, pERK−/pAkt−; NP, pERK−/pAkt+; PN, pERK+/pAkt−; PP, pERK+/pAkt+.
Sorafenib response correlates with pERK+/pAkt− CTCs in HCC Patients
A total of 64 patients received sorafenib monotherapy, which was interrupted in five due to intolerable adverse reactions, including hand-foot syndrome (n = 2), diarrhea (n = 2), and vomiting (n = 1). Therefore, 59 patients were included in evaluation of sorafenib efficacy. All patients suffered varying rates of decline in CTC counts after two weeks of treatment, from 56 ± 20 to 41 ± 18 CTCs/5 mL of blood. Pretreatment percentages of different CTC subtypes in at least one patient randomly selected from each subgroup with varied CTCs subtypes are shown in Fig. 2A. As shown in Fig. 2B, pERK+/pAkt− (n = 2) and pERK+/pAkt+ (n = 9) classified patients suffered a severe decrease in CTC counts; and particularly patients with pERK+/pAkt− CTCs (n = 8). CTC counts pre- and post-treatment with sorafenib in each subset of patients were listed in Supplementary Table S2. Further analysis indicated that the decline in CTC counts in patients with pERK+/pAkt− CTCs (n = 15) was 53.0 ± 17.1% (range: 30.2–83.3%), which was significantly higher than in those without (n = 44), for whom CTC counts declined 17.9 ± 6.7% (range: 3.4–32.6%) (P < 0.01) (Fig. 2C).
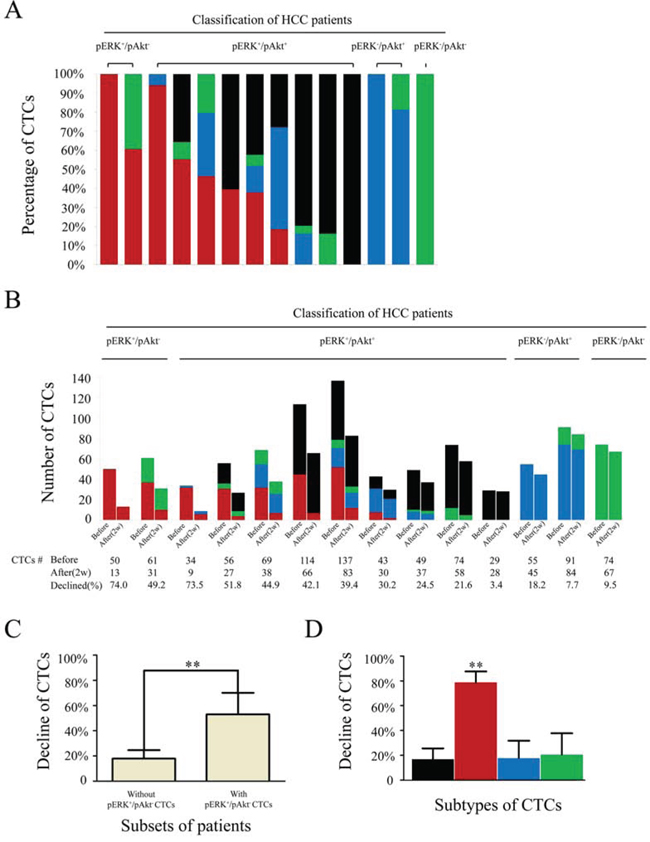
Figure 2: Numbers and percentages of circulating tumor cell (CTC) subtypes/total in hepatocellular carcinoma patients receiving sorafenib treatment. A. Percentages of CTC subtypes before treatment in 14 randomly selected patients from each subgroup. B. CTC counts in 14 patients before and after receiving sorafenib treatment. C. Changes in total CTCs after sorafenib treatment in patients with (n = 15) compared to those without (n = 44) pERK+/pAkt− CTCs. D. Changes in CTC subtypes in 59 patients receiving sorafenib treatment; black, pERK+/pAkt+; red, pERK+/pAkt−; blue, pERK−/pAkt+; green, pERK−/pAkt− CTCs.
In all 59 patients, the decline in pERK+/pAkt− CTCs (78.7 ± 8.9%) was significantly greater than in pERK+/pAkt+ (16.9 ± 8.7%), pERK−/pAkt+ (17.6 ± 14.2%), and pERK−/pAkt− (20.5 ± 17.3%) CTCs (P < 0.01) (Fig. 2D).
mRECIST evaluation revealed no significant correlations of tumor response with clinical characteristics (Table 3). CR, PR, SD, and PD was observed in 1/59 (1.7%), 11/59 (18.6%), 12/59 (20.3%) and 35/59 (59.3%) patients, respectively, resulting in a total DCR of 40.7%. The decline in CTC counts in patients with DCR (n = 24) was 39.5 ± 21.4% (range: 17.5–83.3%), which was significantly higher (P < 0.01) than 18.2 ± 9.1% (range: 3.4–42.1%) in patients with PD (n = 35). In the patients with pERK+/pAkt− CTCs, the DCR was 73.3%, while this number was only 29.5% in those without (P = 0.003). Further analysis showed no significant positive correlation of tumor response with CTC phenotypes other than pERK+/pAkt− CTCs (Table 3). An example of tumor response to sorafenib is shown in a 59-year-old man with recurrent HCC, who only possessed pERK+/pAkt− CTCs and had several tumor nodules with gadolinium-DTPA enhancement located in both the left and right lobes; after treatment with sorafenib for 8 mo, these tumors were shrunken or had completely disappeared as evidenced by dynamic contrast-enhanced MRI (Fig. 3A).
Table 3: Disease control rates (DCR) and clinical characteristics of 59 patients with hepatocellular carcinoma receiving sorafenib monotherapy
Variable |
Patients (n) |
DCR(%) |
P |
||||
|---|---|---|---|---|---|---|---|
Total |
CR |
PR |
SD |
PD |
|||
Sex |
|||||||
Male |
44 |
1 |
9 |
10 |
24 |
45.5 |
0.201 |
Female |
15 |
0 |
2 |
2 |
11 |
26.7 |
|
Age, y |
|||||||
> 50 |
40 |
1 |
8 |
10 |
21 |
47.5 |
0.122 |
≤ 50 |
19 |
0 |
3 |
2 |
14 |
26.3 |
|
HBV |
|||||||
Positive |
50 |
1 |
10 |
10 |
29 |
42.0 |
0.626 |
Negative |
9 |
0 |
1 |
2 |
6 |
33.3 |
|
Maximum tumor size, cm |
|||||||
> 3 |
34 |
1 |
7 |
6 |
20 |
41.2 |
0.928 |
≤ 3 |
25 |
0 |
4 |
6 |
15 |
40.0 |
|
AFP level, ng/mL |
|||||||
< 400 |
37 |
1 |
9 |
6 |
21 |
43.2 |
0.603 |
≥ 400 |
22 |
0 |
2 |
6 |
14 |
36.4 |
|
ECOG PS |
|||||||
0 |
14 |
0 |
3 |
5 |
6 |
57.1 |
0.151 |
1 or 2 |
45 |
1 |
8 |
7 |
29 |
35.6 |
|
Child–Pugh class |
|||||||
A |
42 |
1 |
8 |
10 |
23 |
45.2 |
0.262 |
B |
17 |
0 |
3 |
2 |
12 |
29.4 |
|
Portal vein thrombus |
|||||||
Positive |
48 |
1 |
8 |
9 |
30 |
37.5 |
0.299 |
Negative |
11 |
0 |
3 |
3 |
5 |
54.5 |
|
TNM staging |
|||||||
III |
46 |
1 |
9 |
11 |
25 |
45.7 |
0.143 |
IV |
13 |
0 |
2 |
1 |
10 |
23.1 |
|
Number of CTCs |
|||||||
≤ 53a |
31 |
1 |
8 |
7 |
15 |
51.6 |
0.072 |
> 53 |
28 |
0 |
3 |
5 |
20 |
28.6 |
|
pERK+/pAkt+ CTCs |
|||||||
Present |
8 |
0 |
1 |
2 |
5 |
37.5 |
0.844 |
Absent |
51 |
1 |
10 |
10 |
30 |
41.2 |
|
pERK+/pAkt− CTCs |
|||||||
Present |
15 |
1 |
7 |
3 |
4 |
73.3 |
0.003 |
Absent |
44 |
0 |
4 |
9 |
31 |
29.5 |
|
pERK−/pAkt+ CTCs |
|||||||
Present |
40 |
0 |
4 |
9 |
27 |
32.5 |
0.064 |
Absent |
19 |
1 |
7 |
3 |
8 |
57.9 |
|
pERK−/pAkt− CTCs |
|||||||
Present |
44 |
0 |
7 |
11 |
26 |
40.9 |
0.951 |
Absent |
15 |
1 |
4 |
1 |
9 |
40.0 |
|
Abbreviations: AFP, alpha-fetoprotein; CR, complete response; CTC, circulating tumor cell; HBV, hepatitis B virus; PD, progressive disease; PR, partial response; PS, performance status; SD, stable disease; TNM, tumor-node-metastasis stage.
Note: a53 was the median number of CTCs detected in 59 HCC patients.
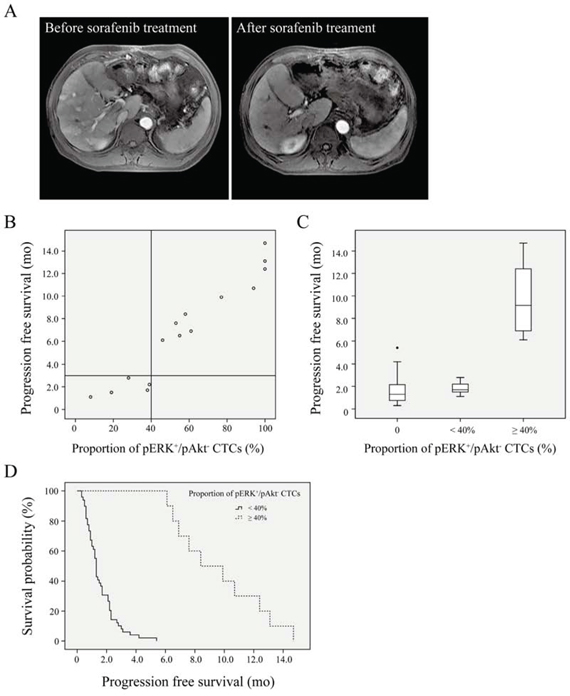
Figure 3: Survival curves for hepatocellular carcinoma patients. A. Dynamic contrast-enhanced magnetic resonance imaging. Several tumor nodules with gadolinium-DTPA enhancement located in both the left and right lobes were shrunken or had completely disappeared after sorafenib treatment in a patient who only exhibited pERK+/pAkt− CTCs. B. Progression-free survival after sorafenib treatment in patients (n = 15) according to (pERK+/pAkt−)/total circulating tumor cells (CTCs). C. Progression-free survival in patients with ≥ 40% (n = 10) or < 40% (n = 5) of CTCs identified as pERK+/pAkt−, and those without pERK+/pAkt− CTCs (n = 44). D. Survival curves of patients with ≥ 40% (n = 10) or < 40% (n = 49) of CTCs identified as pERK+/pAkt−.
Proportion of pERK+/pAkt− CTCs as a potential predictive factor of HCC patients treated with sorafenib
Univariate analysis of predictive factors for PFS indicated that pERK+/pAkt− CTCs but not other types of CTCs was significantly associated with PFS (Table 4). The multivariate analysis using both significant and near-significant variables (up to P = 0.1 in the univariate analysis) showed that pERK+/pAkt− CTCs remained an independent factor associated with a good prognosis (hazard ratio = 9.389, P < 0.01). CTC phenotypes and PFS for 15 patients with pERK+/pAkt− CTCs are listed in Supplementary Table S3. Spearman rank correlation analysis showed that PFS was correlated with the proportion of CTCs identified as pERK+/pAkt− (r = 0.968; P < 0.01), but not with the number of pERK+/pAkt− CTCs (r = 0.491). Moreover, patients with a ≥ 40% proportion of pERK+/pAkt− CTCs (n = 10) had a longer PFS than those with < 40% (n = 49) (Fig. 3B, 3C), which was confirmed by Kaplan-Meier analysis and log-rank test (median PFS: 8.4 [95% CI: 4.8–12.0] vs. 1.3 [95% CI: 1.2–1.4] mo) (Fig. 3D).
Table 4: Univariate and multivariate analysis of predictive factors for progression-free survival
Factors |
Progression-free survival |
|||
|---|---|---|---|---|
Univariate |
Multivariate |
|||
P value |
HR |
95% CI |
P value |
|
Sex: male vs. female |
0.648 |
NA |
||
Age: > 50 vs. ≤ 50 years |
0.277 |
NA |
||
HBV: positive vs. negative |
0.378 |
NA |
||
Maximum tumor size: > 3 vs. ≤ 3 cm |
0.298 |
NA |
||
AFP level: < 400 vs. ≥ 400 ng/mL |
0.449 |
NA |
||
ECOG PS: 0 vs. 1–2 |
0.586 |
NA |
||
Child-Pugh class: A vs. B |
0.065 |
1.024 |
0.551–1.902 |
0.941 |
Portal vein thrombus:positive vs. negative |
0.828 |
NA |
||
TNM staging: III vs. IV |
0.066 |
0.609 |
0.296–1.253 |
0.178 |
Number of CTCs: > 53 vs. ≤ 53a |
0.275 |
NA |
||
pERK+/pAkt+ CTCs: present vs. absent |
0.647 |
NA |
||
pERK+/pAkt− CTCs: present vs. absent |
< 0.001 |
9.389 |
3.242–27.192 |
< 0.001 |
pERK−/pAkt+ CTCs: present vs. absent |
0.061 |
1.129 |
0.523–2.437 |
0.757 |
pERK−/pAkt− CTCs: present vs. absent |
0.132 |
NA |
||
Abbreviations: AFP, alpha-fetoprotein; CTC, circulating tumor cell; HBV, hepatitis B virus; TNM, tumor-node-metastasis stage; HR, hazard ratio; CI, confidence interval; NA, not adopted.
Note: a53 was the median number of CTCs detected in 59 HCC patients.
pERK+/pAkt− CTCs Are most sensitive to sorafenib in vitro
An independent validation set of 20 HCC patients with similar clinical features was used to evaluate CTC sensitivity to sorafenib, including ten with < 40% pERK+/pAkt− CTCs and ten with ≥ 40%. Fig. 4A shows two examples of sorafenib sensitivity tests where CTCs from two patients formed spheroids at day 7 in 3D culture with or without sorafenib. All 20 patients showed a decline in the number of spheroids formed when sorafenib was added to the culture medium. However, samples comprised of ≥ 40% pERK+/pAkt− CTCs showed a larger decline (Fig. 4B) and had a significantly higher inhibition rate than those with < 40% (68.0 vs. 31.3%; P < 0.01) (Fig. 4C).
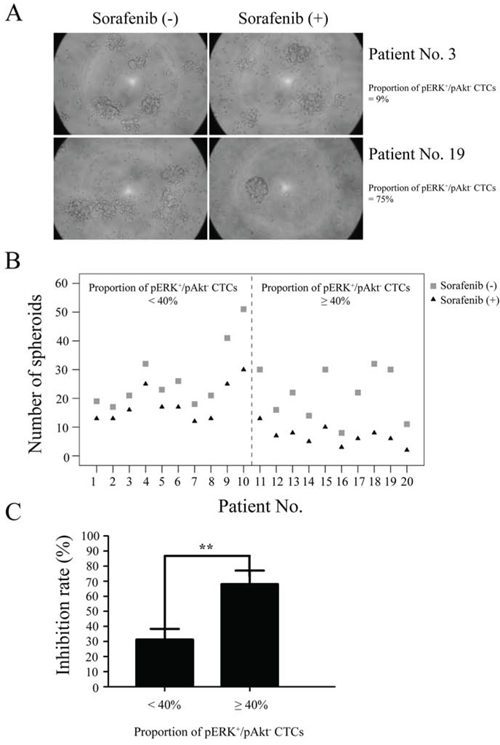
Figure 4: Sensitivity of circulating tumor cells (CTCs) to sorafenib. CTCs isolated from hepatocellular carcinoma patients (n = 20) were tested by spheroid formation assay. A. CTCs from two patients formed spheroids at day 7 in culture with or without sorafenib. B. Formation of spheroids of CTCs treated with or without sorafenib. C. Spheroid formation inhibition rates from patients with ≥ 40% or < 40% of CTCs identified as pERK+/pAkt−.
DISCUSSION
Several studies have attempted to utilize serum biomarkers to predict response to sorafenib. Ten plasma biomarkers were prospectively evaluated in the SHARP trial, but failed to predict response to sorafenib [28]. Miyahara et al [29] analyzed nine serum cytokines in 30 HCC patients treated with sorafenib and observed that high levels of serum cytokines at baseline correlated with poor treatment response. However, the treatment response deteriorated as the number of cytokines at a high level increased. Disease progression was only seen in 25% patients with 0–2 high biomarkers and 33.3% with 3–5. Two recent independent studies by Gyöngyösi et al [30] and Vaira et al [31] suggested that microRNAs in HCC tissues could be used to assess expected survival of patients treated with sorafenib. The prognostic impact of microRNAs in response to sorafenib may be non-specific, as bioinformatics analysis did not identify any interaction between the microRNA gene targets and sorafenib activity or metabolism [31]. Other molecular markers such as Mcl-1 [32] and CD44 [33] may also have similar impact on response to sorafenib.
Although inhibition of VEGFR- or PDGFR-regulated intracellular kinase pathways in endothelial cells or pericytes is only one of multiple mechanisms of sorafenib action, expression levels of these growth factors or relevant receptors in HCC tissues have been evaluated to predict the clinical outcome of patients receiving sorafenib [34–39]. Moreover, a few studies have evaluated pERK expression before treatment in tissue biopsies or cell lines and found a positive correlation with a more favorable response to sorafenib [7, 8, 27].
Our results show concordance between CTCs and tumor tissues regarding pERK/pAkt phenotype status, with expression in CTCs similar to those reported in liver cancer tissues [7–14]. These data led us to believe that it is necessary to conduct target detection before the administration of sorafenib, and CTCs represent an effective, noninvasive method to collect samples. pERK/pAkt phenotyping in individual CTCs eliminates the interference from a large number of various components in the tissue, and more accurately reflects the true nature of a tumor. Analysis of CTCs provides comprehensive details concerning the specific phenotypes expressed and their proportions, which is unachievable when tumor tissues are used for detection.
We further investigated whether such quantitative information could be used to predict response to sorafenib in patients with HCC to personalize this therapeutic approach. All patients showed a decrease in CTC counts after two weeks of sorafenib monotherapy. The greatest decrease occurred in patients with a high proportion of pERK+/pAkt− CTCs, suggesting that this phenotype is most sensitive to sorafenib, and likely the reason for the clinical efficacy of sorafenib treatment. The slight decrease in other CTC phenotypes probably resulted from a tumor burden reduction by antiangiogenic or other mechanisms of sorafenib.
As HCC is a hypervascular cancer, it was theorized that the efficacy of sorafenib is primarily attributable to its inhibition of tumor angiogenesis by targeting VEGFR and PDGFR, and partly to the inhibition of Raf [40]. Indeed, several angiogenesis inhibitors (sunitinib, linifanib and brivanib) targeting similar pathways have been compared with sorafenib in Phase III trials, however these drugs failed to demonstrate superior efficacy in patients with HCC compared with the standard treatment [41–44]. Notably, a study in an orthotopic HCC mouse model demonstrated that sorafenib had a pro-metastasis effect in HCC through downregulation of tumor suppressor HTATIP2, which is associated with inhibition of angiogenesis [45]. Therefore, we speculate that targeting HCC cells by inhibiting the Ras/Raf/ERK signaling pathway, rather than targeting endothelial cells by inhibiting angiogenesis, is probably the primary contribution to the anti-tumor efficacy of sorafenib. Moreover, the resistance to sorafenib determined by specific molecular features of HCC cells in most patients will decrease its overall clinical efficacy, as shown by our study and others [4, 5, 7–13].
Importantly, our study demonstrates that therapeutic response to sorafenib, as well as PFS, only correlate with the proportion of pERK+/pAkt− CTCs, particularly when the proportion is ≥ 40%. This result was somewhat inconsistent with the present knowledge of CTCs, which indicates that patients with a higher CTC count have a higher tumor burden, higher tumor stage, and demonstrate poorer therapeutic efficacy. However, our data are supported by the observation that sorafenib significantly inhibited spheroid formation of pERK+/pAkt− CTCs. Previous reports have shown that overall survival is paradoxically prolonged for patients who receive a half-dose of sorafenib for 70% of the treatment period compared to those who maintained full dosing or had a dose reduced for < 70% of the treatment period [4, 46]. It is possible that the cumulative dose was increased in patients who underwent a dose reduction due to fewer side effects, better tolerance, and prolonged treatment exposure. Indeed, in the study by Iavarone et al [46] the dose of sorafenib was only reduced as required by intolerance or side effects, which typically denote better susceptibility to the drug. Thus, the efficacy of a drug could be higher in a patient that experiences side effects, regardless of dose reduction. This implies that targeted drugs may not follow the therapeutic paradigm of cytotoxic anticancer drugs, for which clinical activity correlates with dosing and achievement of clinically effective blood levels [47]. This may also explain why sorafenib response did not correlate with clinical characteristics or total CTC count in our study. The response was mainly dependent on inherent sensitivity or resistance to sorafenib. On the other hand, a higher number but a lower percentage of pERK+/pAkt− CTCs in a single patient indicates that more tumor cells are resistant to sorafenib, thus generating poor clinical effectiveness, whereas a patient with a low number but higher percentage of pERK+/pAkt− CTCs may achieve a better outcome after sorafenib treatment.
In summary, this study presents a unique platform to provide quantitative information concerning sorafenib-related targets in CTCs, define the molecular subtypes of HCC to identify patients particularly susceptible to sorafenib, predict drug response and efficacy, and select patients most likely to benefit. Thus, CTC pERK/pAkt phenotyping will ultimately increase the success of sorafenib treatment, while preventing unnecessary treatments, serious side effects, and high costs. However, further large-scale clinical prospective investigations are needed to confirm and verify the clinical significance indicated by our study.
MATERIALS AND METHODS
Patients and sample collection
The study enrolled 109 patients with advanced HCC who were candidates for sorafenib treatment, including newly diagnosed patients (n = 50) and patients with recurrent HCC after surgical resection, transcatheter arterial chemoembolization or radiofrequency ablation (n = 59). Clinical characteristics of all patients are presented in Supplementary Table S4. Serial tissue sections were obtained from 32 patients who underwent surgical resection. Peripheral blood (5 mL) was collected in polyethylene tubes containing EDTA (Greiner Bio-One GmbH, Frickenhausen, Germany) after discarding the first 5 mL of blood. The study was approved by the Biomedical Ethics Committee of Eastern Hepatobiliary Surgery Hospital (Shanghai, China) and informed written consent was obtained from all patients.
Immunohistochemistry
Serial tissue sections were incubated with either mouse anti-human pAkt1/2/3 (1:100 dilution, Thr308/Thr309/Thr305; Santa Cruz Biotechnology, Dallas, TX, USA) or rabbit anti-human pERK1/2 (1:200 dilution, Thr202/Tyr204; Cell Signaling Technology, Danvers, MA, USA) monoclonal antibody at 4°C overnight, and then incubated with a horseradish peroxidase-conjugated secondary antibody (Maixin-Bio, Fuzhou, China) at room temperature for 45 min. The immunoreactivity was visualized using diaminobenzidine substrate (Maixin-Bio). The positivity was determined independently by three liver pathologists considering both intensity and subcellular localization as reported (9).
CTC enrichment and multicolor immunofluorescence staining
CTC enrichment of whole blood samples was conducted according to the method previously described [48]. Briefly, following density gradient centrifugation, CTCs were enriched by extracting CD45-expressing leukocytes with magnetically labeled anti-CD45 monoclonal antibody according to the instructions. The remaining cells were cytocentrifuged on polylysine-coated slides. Slides prepared from blood samples were co-incubated with pAkt1/2/3 and pERK1/2 antibody at 37°C for 1 h, followed by Alexa Fluor 647-conjugated goat anti-mouse and FITC-conjugated goat anti-rabbit IgG antibody (1:500 dilution, Beyotime, Shanghai, China). Slides were subsequently stained with Alexa Fluor 555-conjugated pan-cytokeratin (P-CK) mouse monoclonal antibody (1:50 dilution, Cell Signaling Technology) and costained with 4’,6-diamidino-2-phenylindole (DAPI). As controls, slides prepared with PLC/PRF/5, Hep3B, HepG2, Huh7, MHCC-97H and -97L HCC cell lines were stained with primary antibodies or isotype control antibodies according to the method previously described [48].
Identification and enumeration of CTCs with different phenotypes
Stained slides were viewed through a fluorescence microscope (IX71; Olympus, Tokyo, Japan), and images were captured from positively stained CTCs and control slides with the same gain and exposure time. P-CK and DAPI-stained cells that met morphologic features of malignant cells (large cellular size, high nuclear to cytoplasmic ratio, and visible nucleoli) were scored as CTCs. pAkt1/2/3 and pERK1/2 expression was examined in P-CK-positive CTCs. Cell counts are expressed as the number of cells per 5 mL of blood.
Sorafenib-sensitivity testing
The sensitivity of CTCs to sorafenib was assessed using a three-dimensional (3D) cancer model for drug evaluation that mimics in vivo responses to drugs [49]. Briefly, CTCs isolated from 5 mL peripheral blood were resuspended in 150 μL DMEM containing sorafenib pre-dissolved in DMSO. Matrigel (Becton, Dickinson, and Company, Franklin Lakes, NJ, USA) was thawed and mixed equally with the CTC-containing DMEM. The prepared mixture was then incubated in a 24-well plate for 30 min at 37°C. Then, 500 μL of DMEM with sorafenib was added on top of the gel to give a final concentration of 10 μM sorafenib in 0.4% DMSO. The final concentration was estimated by sorafenib sensitivity tests for HCC cell lines to be the optimal concentration. Spheroid formation was observed every day and counted on day 7. A spheroid was defined as 3D cell structure > 100 μm in diameter.
Sorafenib treatment
The final clinical decision for sorafenib treatment, and as a monotherapy or combined, was made by physicians blind to the CTC detection results. Patient inclusion criteria included: proven diagnosis either by histological or characteristic radiologic or serologic findings; ineligibility for or progression after surgical resection; Child-Pugh liver function class A or B; Eastern Cooperative Oncology Group (ECOG) performance status 0–2; adequate hematological functions (white blood cells > 4 × 10⁹/L or absolute neutrophil count > 1.5 × 10⁹/L, platelets > 100 × 109/L, hemoglobin > 10 g/dL); and preserved organ functions (serum creatinine level < 1.5 mg/dL, serum alanine and aspartate aminotransferase levels < 5 times the upper limit of the normal range). An initial dose of 400 mg sorafenib b.i.d. (Nexavar; Bayer HealthCare Pharmaceuticals, Leverkusen, Germany) was administered, and treatment was interrupted or dosage was reduced for drug-related adverse effects. Sorafenib administration was continued until intolerable toxicity or disease progression occurred.
Outcomes and assessments
A total of 59 patients were included for efficacy assessments. An additional 5 mL sample of peripheral blood was collected two weeks after sorafenib administration and processed as described above. Tumor sizes were measured at baseline and every 4–8 weeks during treatment by dynamic contrast-enhanced CT or MRI. Response to sorafenib in patients was evaluated using the modified Response Evaluation Criteria in Solid Tumors (mRECIST) and classified as complete response (CR), partial response (PR), stable disease (SD), or progressive disease (PD). Disease control rate (DCR) was defined as the percentage of cases showing CR, PR, or SD. Progression-free survival (PFS) was calculated as the time from the first cycle of sorafenib to radiologic or serologic progression or death from any cause. Survival was censored if a change in therapy occurred.
Statistical analysis
The statistical analyses were performed using SPSS software (version 17.0; SPSS Inc., Chicago, IL, USA) and a two-sided P ≤ 0.05 was considered statistically significant. Comparison of categorical variables was performed using the χ2 test. Independent predictive significance of risk factors identified by univariate analysis was computed by the Cox regression model. Spearman rank correlation analysis was used for nonparametric correlations. The progression-free survival was estimated using the Kaplan-Meier method, and comparison of survival rates among groups was conducted using the log-rank test. Data are expressed as mean ± standard deviation or as a percentage.
ACKNOWLEDGMENTS
This work was supported by grants from the China National Key Projects for Infectious Disease (No. 2012ZX10002012-10) and the National Nature Science Foundation of China (No. 81172207, 81272669, and 81201721).
CONFLICTS OF INTEREST
The authors declared no potential conflicts of interest.
REFERENCES
1. Llovet JM, Burroughs A, Bruix J. Hepatocellular carcinoma. Lancet. 2003; 362:1907–1917.
2. Les L. FDA approves sorafenib for patients with inoperable liver cancer. Gastroenterology. 2008; 134:379.
3. Gauthier A, Ho M. Role of sorafenib in the treatment of advanced hepatocellular carcinoma: An update. Hepatol Res. 2013; 43:147–154.
4. Llovet JM, Ricci S, Mazzaferro V, Hilgard P, Gane E, Blanc JF, de Oliveira AC, Santoro A, Raoul JL, Forner A, Schwartz M, Porta C, Zeuzem S, et al. Sorafenib in advanced hepatocellular carcinoma. N Engl J Med. 2008; 359:378–390.
5. Cheng AL, Kang YK, Chen Z, Tsao CJ, Qin S, Kim JS, Luo R, Feng J, Ye S, Yang TS, Xu J, Sun Y, Liang H, et al. Efficacy and safety of sorafenib in patients in the Asia-Pacific region with advanced hepatocellular carcinoma: a phase III randomised, double-blind, placebo controlled trial. Lancet Oncol. 2009; 10:25–34.
6. Marrero J, Lencioni R, Ye SL, Kudo M, Bronowicki J, Chen XP. Final analysis of GIDEON (Global investigation of therapeutic decisions in hepatocellular carcinoma [HCC] and of its treatment with sorafenib [Sor]) in >300 Sor-treated patients (pts): clinical findings in pts with liver dysfunction. J Clin Oncol. 2013; 13. (Suppl, abstr 4.126).
7. Abou-Alfa GK, Schwartz L, Ricci S, Amadori D, Santoro A, Figer A, De Greve J, Douillard JY, Lathia C, Schwartz B, Taylor I, Moscovici M, Saltz LB. Phase II study of sorafenib in patients with advanced hepatocellular carcinoma. J Clin Oncol. 2006; 24:4293–4300.
8. Zhang Z, Zhou X, Shen H, Wang D, Wang Y. Phosphorylated ERK is a potential predictor of sensitivity to sorafenib when treating hepatocellular carcinoma: evidence from an in vitro study. BMC Med. 2009; 7:41.
9. Newell P, Toffanin S, Villanueva A, Chiang DY, Minguez B, Cabellos L, Savic R, Hoshida Y, Lim KH, Melgar-Lesmes P, Yea S, Peix J, Deniz K, et al. Ras pathway activation in hepatocellular carcinoma and anti-tumoral effect of combined sorafenib and rapamycin in vivo. J Hepatol. 2009; 51:725–733.
10. Chen KF, Chen HL, Tai WT, Feng WC, Hsu CH, Chen PJ, Cheng AL. Activation of phosphatidylinositol 3-kinase/Akt signaling pathway mediates acquired resistance to sorafenib in hepatocellular carcinoma cells. J Pharmacol Exp Ther. 2011; 337:155–161.
11. De Luca A, Maiello MR, D’Alessio A, Pergameno M, Normanno N. The RAS/RAF/MEK/ERK and the PI3K/AKT signalling pathways: role in cancer pathogenesis and implications for therapeutic approaches. Expert Opin Ther Targets. 2012; 2:S17–27.
12. Wang H, Xu L, Zhu X, Wang P, Chi H, Meng Z. Activation of phosphatidylinositol 3-kinase/Akt signaling mediates sorafenib-induced invasion and metastasis in hepatocellular carcinoma. Oncol Rep. 2014; 32:1465–1472.
13. Zhai B, Hu F, Jiang X, Xu J, Zhao D, Liu B, Pan S, Dong X, Tan G, Wei Z, Qiao H, Jiang H, Sun X. Inhibition of Akt reverses the acquired resistance to sorafenib by switching protective autophagy to autophagic cell death in hepatocellular carcinoma. Mol Cancer Ther. 2014; 13:1589–1598.
14. Gedaly R, Angulo P, Chen C, Creasy KT, Spear BT, Hundley J, Daily MF, Shah M, Evers BM. The role of PI3K/mTOR inhibition in combination with sorafenib in hepatocellular carcinoma treatment. Anticancer Res. 2012; 32:2531–2536.
15. Zhang Y, Li J, Cao L, Xu W, Yin Z. Circulating tumor cells in hepatocellular carcinoma: detection techniques, clinical implications, and future perspectives. Semin Oncol. 2012; 39:449–460.
16. Riethdorf S, Müller V, Zhang L, Rau T, Loibl S, Komor M, Roller M, Huober J, Fehm T, Schrader I, Hilfrich J, Holms F, Tesch H, et al. Detection and HER2 expression of circulating tumor cells: prospective monitoring in breast cancer patients treated in the neoadjuvant Gepar-Quattro trial. Clin Cancer Res. 2010; 16:2634–2645.
17. Punnoose EA, Atwal SK, Spoerke JM, Savage H, Pandita A, Yeh RF, Pirzkall A, Fine BM, Amler LC, Chen DS, Lackner MR. Molecular biomarker analyses using circulating tumor cells. PLoS One. 2010; 5:e12517.
18. Lianidou ES, Markou A, Strati A. Molecular characterization of circulating tumor cells in breast cancer: challenges and promises for individualized cancer treatment. Cancer Metastasis Rev. 2012; 31:663–671.
19. Maheswaran S, Sequist LV, Nagrath S, Ulkus L, Brannigan B, Collura CV, Inserra E, Diederichs S, Iafrate AJ, Bell DW, Digumarthy S, Muzikansky A, Irimia D, et al. Detection of mutations in EGFR in circulating lung cancer cells. N Engl J Med. 2008; 359:366–377.
20. Miyamoto DT, Lee RJ, Stott SL, Ting DT, Wittner BS, Ulman M, Smas ME, Lord JB, Brannigan BW, Trautwein J, Bander NH, Wu CL, Sequist LV, et al. Androgen receptor signaling in circulating tumor cells as a marker of hormonally responsive prostate cancer. Cancer Discov. 2012; 2:995–1003.
21. de Bono JS1, Attard G, Adjei A, Pollak MN, Fong PC, Haluska P, Roberts L, Melvin C, Repollet M, Chianese D, Connely M, Terstappen LW, Gualberto A. Potential applications for circulating tumor cells expressing the insulin-like growth factor-I receptor. Clin Cancer Res. 2007; 13:3611–3616.
22. Shin SJ, Hwang JW, Ahn JB, Rha SY, Roh JK, Chung HC. Circulating vascular endothelial growth factor receptor 2/pAkt-positive cells as a functional pharmacodynamic marker in metastatic colorectal cancers treated with antiangiogenic agent. Invest New Drugs. 2013; 31:1–13.
23. Yokoi K, Hawke D, Oborn CJ, Jang JY, Nishioka Y, Fan D, Kim SW, Kim SJ, Fidler IJ. Identification and validation of SRC and phospho-SRC family proteins in circulating mononuclear cells as novel biomarkers for pancreatic cancer. Transl Oncol. 2011; 4:83–91.
24. Tinhofer I, Hristozova T, Stromberger C, Keilhoiz U, Budach V. Monitoring of circulating tumor cells and their expression of EGFR/phospho-EGFR during combined radiotherapy regimens in locally advanced squamous cell carcinoma of the head and neck. Int J Radiat Oncol Biol Phys. 2012; 83:e685–690.
25. Kallergi G, Agelaki S, Kalykaki A, Stournaras C, Mavroudis D, Georgoulias V. Phosphorylated EGFR and PI3K/Akt signaling kinases are expressed in circulating tumor cells of breast cancer patients. Breast Cancer Res. 2008; 10:R80.
26. Kallergi G, Mavroudis D, Georgoulias V, Stournaras C. Phosphorylation of FAK, PI-3K, and impaired actin organization in CK-positive micrometastatic breast cancer cells. Mol Med. 2007; 13:79–88.
27. Chen D, Zhao P, Li SQ, Xiao WK, Yin XY, Peng BG, Liang LJ. Prognostic impact of pERK in advanced hepatocellular carcinoma patients treated with sorafenib. Eur J Surg Oncol. 2013; 39:974–980.
28. Llovet JM, Peña CE, Lathia CD, Shan M, Meinhardt G, Bruix J. Plasma biomarkers as predictors of outcome in patients with advanced hepatocellular carcinoma. Clin Cancer Res. 2012; 18:2290–2300.
29. Miyahara K, Nouso K, Tomoda T, Kobayashi S, Hagihara H, Kuwaki K, Toshimori J, Onishi H, Ikeda F, Miyake Y, Nakamura S, Shiraha H, Takaki A, et al. Predicting the treatment effect of sorafenib using serum angiogenesis markers in patients with hepatocellular carcinoma. J Gastroenterol Hepatol. 2011; 26:1604–1611.
30. Gyöngyösi B, Végh E, Járay B, Székely E, Fassan M, Bodoky G, Schaff Z, Kiss A. Pretreatment microRNA level and outcome in sorafenib-treated hepatocellular carcinoma. J Histochem Cytochem. 2014; 62:547–555.
31. Vaira V, Roncalli M, Carnaghi C, Faversani A, Maggioni M, Augello C, Rimassa L, Pressiani T, Spagnuolo G, Di Tommaso L, Fagiuoli S, Rota Caremoli E, Barberis M, et al. MicroRNA-425-3p predicts response to sorafenib therapy in patients with hepatocellular carcinoma. Liver Int. 2014; 10.
32. Personeni N, Rimassa L, Pressiani T, Destro A, Ligorio C, Tronconi MC, Bozzarelli S, Carnaghi C, Di Tommaso L, Giordano L, Roncalli M, Santoro A. Molecular determinants of outcome in sorafenib-treated patients with hepatocellular carcinoma. J Cancer Res Clin Oncol. 2013; 139:1179–1187.
33. Fernando J, Malfettone A, Cepeda EB, Vilarrasa-Blasi R, Bertran E, Raimondi G, Fabra À, Alvarez-Barrientos≈A, Fernández-Salguero P, Fernández-Rodríguez CM, Giannelli G, Sancho P, Fabregat I. A mesenchymal-like phenotype and expression of CD44 predict lack of apoptotic response to sorafenib in liver tumor cells. Int J Cancer. 2015; 136:E161–172.
34. Scartozzi M, Faloppi L, Svegliati Baroni G, Loretelli C, Piscaglia F, Iavarone M, Toniutto P, Fava G, De Minicis S, Mandolesi A, Bianconi M, Giampieri R, Granito A, et al. VEGF and VEGFR genotyping in the prediction of clinical outcome for HCC patients receiving sorafenib: the ALICE-1 study. Int J Cancer. 2014; 135:1247–1256.
35. Peng S, Wang Y, Peng H, Chen D, Shen S, Peng B, Chen M, Lencioni R, Kuang M. Autocrine vascular endothelial growth factor signaling promotes cell proliferation and modulates sorafenib treatment efficacy in hepatocellular carcinoma. Hepatology. 2014; 60:1264–1277.
36. Llovet JM. Focal gains of VEGFA: candidate predictors of sorafenib response in hepatocellular carcinoma. Cancer Cell. 2014; 25:560–562.
37. Horwitz E, Stein I, Andreozzi M, Nemeth J, Shoham A, Pappo O, Schweitzer N, Tornillo L, Kanarek N, Quagliata L, Zreik F, Porat RM, Finkelstein R, et al. Human and mouse VEGFA-amplified hepatocellular carcinomas are highly sensitive to sorafenib treatment. Cancer Discov. 2014; 4:730–743.
38. Luo X, Feng GS. VEGFA genomic amplification tailors treatment of HCCs with sorafenib. Cancer Discov. 2014; 4:640–641.
39. Negri FV, Dal Bello B, Porta C, Campanini N, Rossi S, Tinelli C, Poggi G, Missale G, Fanello S, Salvagni S, Ardizzoni A, Enrico Maria S. Expression of pERK and VEGFR-2 in advanced hepatocellular carcinoma and resistance to sorafenib treatment. Liver Int. 2015; 35:2001–2008.
40. Kim S, Abou-Alfa GK. The role of tyrosine kinase inhibitors in hepatocellular carcinoma. Clin Adv Hematol Oncol. 2014; 12:36–41.
41. Llovet JM, Decaens T, Raoul JL, Boucher E, Kudo M, Chang C, Kang YK, Assenat E, Lim HY, Boige V, Mathurin P, Fartoux L, Lin DY, et al. Brivanib in patients with advanced hepatocellular carcinoma who were intolerant to sorafenib or for whom sorafenib failed: results from the randomized phase III BRISK-PS study. J Clin Oncol. 2013; 31:3509–3516.
42. Cheng AL, Kang YK, Lin DY, Park JW, Kudo M, Qin S, Chung HC, Song X, Xu J, Poggi G, Omata M, Pitman Lowenthal S, Lanzalone S, et al. Sunitinib versus sorafenib in advanced hepatocellular cancer: results of a randomized phase III trial. J Clin Oncol. 2013; 31:4067–4075.
43. Cainap C, Qin S, Huang WT, Chung IJ, Pan H, ChengY, Kudo M, Kang YK, Chen PJ, Toh HC, Gorbunova V, Eskens FA, Qian J, et al. Linifanib versus sorafenib in patients with advanced hepatocellular carcinoma: results of a randomized phase III trial. J Clin Oncol. 2015; 33:172–179.
44. Patel A, Sun W. Molecular targeted therapy in hepatocellular carcinoma: from biology to clinical practice and future. Curr Treat Options Oncol. 2014; 15:380–394.
45. Zhang W, Sun HC, Wang WQ, Zhang QB, Zhuang PY, Xiong YQ, Zhu XD, Xu HX, Kong LQ, Wu WZ, Wang L, Song TQ, Li Q, et al. Sorafenib down-regulates expression of HTATIP2 to promote invasiveness and metastasis of orthotopic hepatocellular carcinoma tumors in mice. Gastroenterology. 2012; 143:1641–1649.
46. Iavarone M, Cabibbo G, Piscaglia F, Zavaglia C, Grieco A, Villa E, Cammà C, Colombo M. Field-practice study of sorafenib therapy for hepatocellular carcinoma: a prospective multicenter study in Italy. Hepatology. 2011; 54:2055–2063.
47. Abou-Alfa GK. Sorafenib use in hepatocellular carcinoma: more questions than answers. Hepatology. 2014; 60:15–18.
48. Liu HY, Qian HH, Zhang XF, Li J, Yang X, Sun B, Ma JY, Chen L, Yin ZF. Improved method increases sensitivity for circulating hepatocellular carcinoma cells. World J Gastroenterol. 2015; 21:2918–2925.
49. Lovitt CJ, Shelper TB, Avery VM. Miniaturized three-dimensional cancer model for drug evaluation. Assay Drug Dev Technol. 2013; 11:435–448.