
INTRODUCTION
Prostate Cancer (PC) is a heterogeneous disease that ranges from asymptomatic to a rapidly fatal systemic malignancy with the features of small-cell neuroendocrine cancer, or neuroendocrine differentiation (NED) nests, which arise in conventional adenocarcinoma [1]. Identification of genetic drivers of these variants and molecular determinants of PC spreading should be not only of great prognostic value, but essential for a targeted prevention or therapy of metastatic disease. Recent studies have revealed that pluripotency associated genes may condition the biological heterogeneity of a cancer and correlate with its aggressiveness [2]. The SRY (sex determining region Y)-box 2 gene, SOX2, so far recognized as crucial for the stem cell state [3] and necessary for induced cellular reprogramming [3, 4], is gaining a renewed interest as a key regulator of self-renewal and maintenance of Cancer Stem Cells (CSCs) in a variety of tumors including PC [5–10]. In this type of cancer, SOX2 has been shown to increase cellular proliferation and survival, to stimulate epithelial-mesenchimal transition (EMT) [11, 12] and to promote castration-resistant disease [13]. We recently found that the EMT transcription factor SNAI2/Slug upregulates SOX2 in PC cells and that these genes are co-expressed at the invasion front and in NED areas of high-grade PC [14]. However, the question of whether SOX2 may drive NED remains unresolved and the way it may favor PC progression is not fully elucidated.
By means of laser capture microdissection (LCM) followed by molecular and genetic analyses, we assessed SOX2 gene expression and regulation in PC samples and correlated the molecular data to the patient's clinical pathological profiles and follow-ups. We also performed in vitro studies with human PC cell lines to investigate SOX2's ability to regulate critical PC progression pathways.
RESULTS
SOX2 is downregulated in PC and its expression correlates with NED and lymph node metastasization
We recently found that SOX2 was downregulated, as observed for SNAI2, in the neoplastic prostatic epithelia compared to its normal counterpart [14]. In the present study, we investigated the possible mechanisms involved in its regulation and extended molecular and immuno-pathological analyses to a greater number of PC samples (from a new cohort of patients) to find out whether SOX2 expression may be related to the patient's clinical pathological characteristics and follow-ups.
In the present cohort of 206 prostatectomized PC patients, the mean level of SOX2 mRNA was found to be significantly (p < 0.05) downregulated in the neoplastic epithelium from both low- and high-Gleason grade PC foci (≤3 and >3), by 20.78 and 7.87 times, respectively (with no substantial differences between them), compared to the normal counterpart (whose expression levels were similar to those in the normal epithelium of the controls) (Figure 1A).
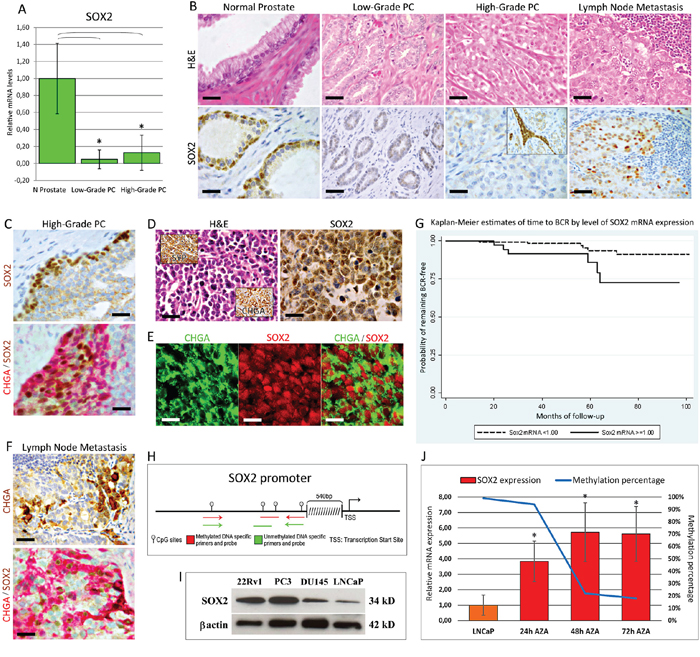
Figure 1: Expression of SOX2 in normal and neoplastic prostate tissue from PC patients. A. SOX2 mRNA expression in microdissected normal and cancerous prostate tissues from PC patients. Histogram representing the relative expression ± SD of SOX2 mRNA in normal epithelium and its neoplastic counterparts with low or high Gleason grades, from clinical prostate samples of patients subjected to radical prostatectomy, normalized with the housekeeping gene HPRT. One-way ANOVA was used for comparisons between epithelial compartments of normal prostate and low- and high-grade PC: p < 0.0001. *p < 0.01 Tukey HSD Test compared with normal prostate epithelium. B. SOX2 protein expression in normal and cancerous prostate tissues and lymph node metastases from PC patients. Immunohistochemistry shows that normal prostate glands display a bright SOX2 nuclear expression in most of the basal epithelial cell layer. SOX2 expression was frequently lost in the malignant epithelium of PC with either low or high Gleason grades, except for some low- or more frequently high-grade PC foci showing stromal infiltrating SOX2-positive cancer cell clusters (inset). Most lymph node metastases displayed a distinct to strong nuclear expression of SOX2. Magnification: X630, top and bottom left panels; X400, the remaining panels. Scale bars: 20 μm (top and bottom left panels); 30 μm (the remaining panels). C. SOX2 protein expression in high-grade PC. Immunohistochemistry shows a strong SOX2 expression confined to cancer cell clusters bordering the expansion/invasion fronts, which frequently co-expressed CHGA. Magnification: X630. Scale bars: 20 μm. D. SOX2 protein expression in neuroendocrine (NED) areas of high–grade PC. Immunohistochemistry shows a strong SOX2 expression in the majority of CHGA+/SYP+ (insets) neoplastic cells forming NED areas. Magnification: X630. Scale bars: 20 μm. E. Expression of CHGA and SOX2 in NED areas. Confocal analyses of double immunofluorescence staining for CHGA (green) and SOX2 (red) show that CHGA+ cells express SOX2 in their nuclei. Magnification: X630. Scale bars: 20 μm. F. Expression of CHGA and SOX2 in lymph node metastasis. Lymph node metastasis frequently include scattered CHGA-positive cancer cells mostly endowed with nuclear SOX2 positivity, as shown by the double SOX2 (brown) / CHGA (red) immunostaining. Magnification: X630. Scale bars: 20 μm. G. Kaplan-Meier estimates of time to biochemical recurrence (BCR) by level of SOX2 mRNA expression. H. DNA methylation status of SOX2 gene promoter in microdissected PC epithelia and in LNCaP cell line. The last portion of the SOX2 promoter, 540bp upstream from the transcription start site, contains a dense CpG 128bp sequence. I. WB analyses of SOX2 expression in PC cell lines. SOX2 protein expression is substantial in 22Rv1, PC3, and DU145 cell lines, whereas it is barely detected in LNCaP cells. J. Restoration of SOX2 expression by 5-Aza-dC treatment and concomitant reduction of the methylation percentage of the SOX2 gene promoter. Expression level of SOX2 mRNA (expressed as mean ± SD) is significantly (*p < 0.05 Student's t-test compared with control cells) increased in LNCaP cells, starting 24 hours after the treatment with 5-Aza-dC, whereas SOX2 methylation status simultaneously decreases. Data are representative of three independent experiments.
Immunohistochemistry corroborated the molecular data and demonstrated distinct SOX2 expression in the basal cell layer of normal prostate glands (as previously reported in ref. 13) and its absence in most of the neoplastic epithelia (Figure 1B), with the exception of a few low-grade foci (10/75:13%) and a discrete number of high-grade PC foci (47/131: 36%). In the latter, SOX2 was usually localized in cell clusters infiltrating the stroma (Figure 1B) or bordering the expansion/invasion fronts, which were frequently Chromogranin-A(CHGA)-positive (Figure 1C). Furthermore, the 23 CHGA/synaptophysin (SYP)-positive NED areas (detected in 131 high-grade PC foci) displayed distinct to strong SOX2 expression (Figure 1D and 1E). Fisher's exact test, revealed a significant (p < 0.0001) link between the expression of SOX2 and of CHGA in the NED areas of high-grade PC.
In 21/27 node-positive PC cases a distinct to strong SOX2 expression was observed in the lymph node metastases, as seen in the primary tumor. Interestingly, 17/27 lymph node metastasis displayed distinct to strong expression of both SOX2 and CHGA (Figure 1F). A significant association was also found, through Fisher's exact test, between SOX2 and CHGA expression in the lymph node metastasis (p = 0.04413) (Figure 1F).
Through a univariate analysis, using a SOX2 mRNA cutoff level of 1.00 (relative to XpressRef Universal Total RNA, Qiagen), a high SOX2 mRNA expression level was strongly associated with lymph node metastasis (p < 0.001; Table 1). The sensitivity was 0.81 (95% CI: 0.61–0.93) and the specificity was 0.87 (95% CI: 0.81–0.91).
Table 1: Clinical pathological characteristics of the samples, overall and by lymph node status (pN0 vs pN ≥1)
Variables |
Overall (n = 206) |
pN0 patients (n = 179) |
pN ≥1 patients (n = 27) |
pa |
|---|---|---|---|---|
Median follow-up in months (IQRb) |
47 (34) |
47 (37) |
52 (37) |
0.7 |
Age |
||||
Mean age in years (SD) |
65.5 (6.2) |
65.2 (6.0) |
67.6 (7.0) |
0.010 |
Age-class in years, % |
||||
<64 |
26.7 |
27.9 |
18.5 |
0.3 |
64–68 |
40.8 |
43.6 |
22.2 |
0.035 |
>68 |
32.5 |
28.5 |
59.3 |
0.002 |
SOX2 mRNA expression level relative to XpressRef Universal Total RNA (XUTR) |
||||
Median (IQRb) |
0.16 (0.87) |
0.11 (0.58) |
3.20 (4.25) |
<0.001 |
0.00, % |
35.0 |
39.7 |
3.7 |
<0.001 |
0.00–0.99, % |
42.7 |
46.9 |
14.8 |
0.002 |
≥1.00, % |
22.3 |
13.4 |
81.5 |
<0.001 |
Gleason grade inmicrodissected foci, % |
||||
>3 |
63.6 |
58.1 |
100.0 |
<0.001 |
Surgical Gleason score |
||||
<6 |
21.8 |
25.2 |
0.0 |
0.003 |
6 |
14.6 |
16.8 |
0.0 |
0.021 |
7 |
37.4 |
37.4 |
37.0 |
0.9 |
8 |
10.7 |
9.5 |
18.5 |
0.16 |
>8 |
15.5 |
9.2 |
44.4 |
<0.001 |
Peri-neural invasion, % |
85.4 |
83.2 |
100.0 |
0.021 |
Extra-capsular invasion, % |
42.2 |
36.9 |
77.8 |
<0.001 |
Pathologic Stage,% |
||||
- pT2pN0M0 |
54.9 |
63.1 |
0.0 |
— |
- pT3pN0M0 |
32.0 |
36.9 |
0.0 |
— |
- any pTpN ≥1M0 |
13.1 |
0.0 |
100.0 |
— |
PSA levels (ng/ml), % |
||||
Median (IQRb) |
8.96 (9.90) |
8.66 (9.73) |
11.91 (10.70) |
0.010 |
<10 |
56.8 |
59.2 |
40.7 |
0.070 |
10–20 |
33.0 |
32.4 |
37.0 |
0.6 |
>20 |
10.2 |
8.4 |
22.2 |
0.027 |
Biochemical recurrence, % |
5.8 |
2.2 |
29.6 |
<0.001 |
a Chi-square test for categorical variables, Mann-Whitney U test for continuous ones.
b IQR: Interquartile range.
The multivariate analysis, adjusting for age, PSA levels and Gleason score, showed that the increase in SOX2 mRNA expression was significantly associated with the presence of lymph node metastasis (OR = 1.83 for each 1 unit increase in SOX2 mRNA expression; 95% CI: 1.43–2.35; Table 2). Patients with SOX2 mRNA level ≥ 1.00 relative to XpressRef Universal Total RNA (XUTR), compared to those with SOX2 mRNA level < 1.00, showed a very high likelihood of metastasis (adjusted OR: 24.4; 95% CI: 7.54–79.0; Table 2).
Table 2: Results of the multiple logistic regression analyses indicative of lymph node metastasis
Variables |
Adjusted Odds Ratio (95% Confidence interval) |
pa |
|---|---|---|
Model 1a |
||
Age, 1 year increase |
1.08 (0.98–1.18) |
0.14 |
PSA levels, 1 ng/ml increase |
0.98 (0.90–1.06) |
0.6 |
Gleason score, 1 point increase |
2.56 (1.35–4.85) |
0.004 |
SOX2 mRNA expression relative to XUTR |
||
< 1.00 |
1 (ref. category) |
— |
≥ 1.00 |
24.4 (7.54–79.0) |
<0.001 |
|
|
|
Model 2b |
||
SOX2 mRNA expression, 1 unit increase relative to XUTR |
1.83 (1.43–2.35) |
<0.001 |
a Logistic regression model with 206 observations; Hosmer-Lemeshow goodness of fit p = 0.89; Area under the ROC curve 0.92.
b As model 1, with SOX2 mRNA level treated as a continuous variable. With the exception of Gleason grade in microdissected focus, all the variables that have not been included in the model were not significant.
All of the individuals (n = 12) experiencing biochemical recurrence had high median levels of SOX2 mRNA (median ± IQR: 1.86 ± 4.08 vs 0.14 ± 0.8 relative to XUTR, p = 0.007). Kaplan-Meier estimates suggested a shorter time to recurrence for the individuals with higher SOX2 mRNA expression (Figure 1G). However, the number of relapses was too scarce to allow for a meaningful multivariate analysis.
Expression of SOX2 in PC samples is related to its methylation status and the treatment of PC cells with 5-Aza-dC restores its expression
Since epigenetic gene silencing through DNA methylation is significant for PC progression, we tested its involvement in SOX2 downregulation. By quantitative Methylation-Specific PCR (qMSP) we assessed, in clinical PC and in human PC cell lines, the methylation status of a dense CpG island, 128bp sequence, in the last portion of the SOX2 promoter (Figure 1H).
We first tested SOX2 methylation in the microdissected epithelia from a cohort of 12 patients diagnosed with low- or high-grade PC and previously examined in function of their SOX2 mRNA expression levels. As shown in Table 3, the percentage of methylation ranged from 0.00 to 5.33% in the normal epithelia, 6.20–99.0% in low-grade PC and 0.0–100% in high-grade PC. Interestingly, 3/6 high-grade PC, with a methylation status of 0%, presented with NED areas. Spearman's rank correlation coefficient revealed an inverse correlation between SOX2 mRNA transcript levels and the percentage of SOX2 methylation (Spearman's ρ = −0.751; p < 0.0001).
Table 3: SOX2 gene promoter methylation and mRNA expression levels
Samples |
Gene promoter methylation (%) |
Relative mRNA expression levelsa |
|---|---|---|
Control samples |
||
1 |
0.00 |
16.00 |
2 |
2.28 |
16.48 |
3 |
0.05 |
6.31 |
4 |
4.83 |
10.77 |
5 |
0.00 |
8.63 |
6 |
0.00 |
8.75 |
7 |
3.18 |
6.97 |
8 |
5.33 |
6.78 |
9 |
1.17 |
7.68 |
10 |
1.22 |
12.17 |
11 |
0.00 |
14.36 |
12 |
0.00 |
15.00 |
Low-grade PC samples |
||
1 |
32.47 |
0.00 |
2 |
6.20 |
0.52 |
3 |
7.10 |
0.00 |
4 |
44.00 |
0.08 |
5 |
99.00 |
0.00 |
6 |
13.15 |
0.88 |
High-grade PC samples |
||
7 |
0.00 |
7.13 |
8 |
100.00 |
0.00 |
9 |
0.00 |
4.12 |
10 |
0.00 |
8.51 |
11 |
100.00 |
0.38 |
12 |
27.36 |
2.30 |
a Gene expression levels are relative to XpressRef Universal Total RNA from SABiosciences.
Indeed, Western Blotting (WB) analyses showed that SOX2 expression was remarkable in 22Rv1, PC3, DU145 cells and scarce in LNCaP cells (Figure 1I), where qMSP showed 99% DNA methylation and treatment with the demethylating agent 5-Aza-dC resulted in both a consistent (p < 0.05) upregulation of the SOX2 transcript level and a concomitant reduction of the methylation percentage (Figure 1J). Thus, DNA methylation is most likely involved in the downregulation of SOX2 observed in PC.
SOX2 regulates NED genes, neural cell adhesion molecules, and neurotrophin/neurotrophin receptor genes
Findings from clinical specimens led us to assess whether SOX2 may regulate gene sets related to NED and tumor progression. Two cell lines, representative of androgen-dependent and -independent PC, namely 22Rv1 and PC3 cells, were transfected to overexpress SOX2.
In cells transfected with SOX2 pcDNA, the expression of both SOX2 mRNA (22Rv1 by 363% and PC3 by 132%, p < 0.05) and protein (22Rv1 by 931% and PC3 by 135%, normalized to β-actin) increased substantially compared to cells transfected with the empty vector (Figure 2A).
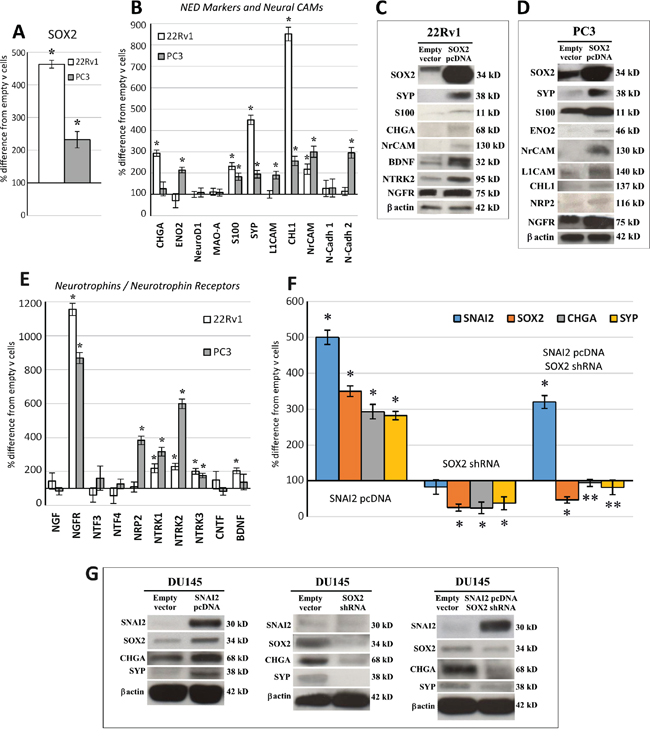
Figure 2: SOX2 overexpression upregulates NED, neural CAM and neurotrophin/neurotrophin receptor gene expression, and SOX2 silencing abolishes SNAI2-dependent NED. A. qRT-PCR analyses of SOX2 mRNA in SOX2 gene transfected 22Rv1 and PC3 cells. Cell transfection with SOX2 pcDNA substantially increased SOX2 mRNA (by 363%) in 22Rv1 cells and in PC3 cells (by 132%). Data are representative of three independent experiments and results are expressed as mean ± SD. *p < 0.05 Student's t-test compared with control cells. B. Regulation of NED marker and neural CAM mRNA expression levels by SOX2 overexpression in 22Rv1 and PC3 cell lines. S100, SYP, CHL1 and NrCAM are upregulated in both SOX2-overexpressing cell lines, whereas CHGA only in 22Rv1 and ENO2, L1CAM and N-Cadh 2 only in PC3 cells. Data are representative of three independent experiments and results are expressed as mean ± SD. *p < 0.05 Student's t-test compared with control cells. C. WB analyses of proteins extracted from empty vector and SOX2 pcDNA transfected 22Rv1 cells. WB analysis shows SOX2 overexpression (by 931%) in SOX2 pcDNA transfected 22Rv1 cells and confirms, at the protein level, most of the gene expression regulation evidenced, at the transcript level, by qRT-PCR. β-actin was used as a loading control. D. WB analysis of proteins extracted from empty vector and SOX2 pcDNA transfected PC3 cells. WB analysis shows SOX2 overexpression (by 135%) in SOX2 pcDNA transfected PC3 cells and confirms, at the protein level, most of the gene expression regulation evidenced, at the transcript level, by qRT-PCR. β-actin was used as a loading control. E. Regulation of neurotrophin/neurotrophin receptor mRNA expression levels by SOX2 overexpression in 22Rv1 and PC3 cell lines. NGFR, NTRK1, NTRK2 and NTRK3 are upregulated in both SOX2-overexpressing cell lines, whereas BDNF is upregulated only in 22Rv1 and NRP2 only in PC3 cells. Data are representative of three independent experiments and results are expressed as mean ± SD. *p < 0.05± SD Student's t-test compared with control cells. F. Histograms represent the relative expression ± SD of SOX2, SNAI2 and NED genes in the SNAI2 pcDNA transfected, SOX2 shRNA treated and co-transfected DU145 cells. CHGA and SYP mRNA were significantly upregulated, together with SOX2 mRNA by SNAI2 overexpression, whereas they were downmodulated by SOX2 silencing. Co-transfection with both SNAI2 pcDNA and SOX2 shRNA abolished SNAI2-dependent CHGA and SYP upregulation. Data are representative of three independent experiments. *p < 0.05 Student's t-test compared with empty vector-transfected DU145 cells. **p < 0.05 Student's t-test compared with SNAI2 pcDNA transfected DU145 cells. qRT-PCR data obtained from empty vector-transfected cells were similar to those obtained from untransfected cells (not shown). G. WB analysis of proteins extracted from SNAI2 pcDNA transfected DU145 cells, SOX2 shRNA treated DU145 cells and SNAI2 pcDNA/SOX2 shRNA co-transfected DU145 cells. WB substantiated, at protein level, the data obtained from qRT-PCR analyses showed in the panel F.
■ Within the canonical NED genes, SOX2 overexpression upregulated SYP (PC3: 95%; 22Rv1: 349%) and S100 (PC3: 83%; 22Rv1: 132%) in both cell lines, ENO2 in PC3 cells (by 114%) and CHGA in 22Rv1 cells (by 193%), as assessed by qRT-PCR and WB (Figure 2B, 2C, 2D).
■ Within the neural (N) Cell Adhesion Molecules (CAM), neuronal CAM (NrCAM), was upregulated in both SOX2-overexpressing cell lines (PC3: 200%; 22Rv1: 118%). Neuronal cadherin-2 (NCadh-2) and L1CAM were only upregulated in PC3 cells (by 195% and 91% respectively) with WB confirmation for the latter. Meanwhile, CAM L1-like (CHL1) increased in both cell lines (22Rv1: 752% and PC3: 157%), but only in PC3 cells at the protein level (Figure 2B, 2C, 2D).
■ The Neurotrophin/Neurotrophin Receptor system was also influenced by SOX2. Following SOX2 gene transfection, Brain Derived Neurotrophic Factor (BDNF) was upregulated in 22Rv1 cells (by 103%) and Neuropilin-2 (NRP2) in PC3 cells (by 285%), with confirmation at protein level. Moreover, in both cell lines, SOX2 overexpression upregulated Neurotrophic Tyrosine Kinase Receptor type 1, NTRK1/TrkA (PC3: 218%; 22Rv1: 118%), and type 2, NTRK2/TrkB (PC3: 500%, and 22Rv1: 128%). WB analysis confirmed the result for NTRK2/TrkB in the 22Rv1 cells. At the transcriptional level, NTRK3/TrkC was induced in 22Rv1 and upregulated (by 75%) in PC3 cells, whereas Nerve Growth Factor Receptor, NGFR/p75NTR, was increased in PC3 (by 769%) and in 22Rv1 (by 1055%) with WB confirmation (Figure 2E, 2C, 2D).
SOX2 knockdown abrogates the NED gene upregulation elicited by SNAI2/Slug overexpression
We recently found that expression of SNAI2/Slug, in clinical PC samples, is associated with that of SOX2, and NED genes, specifically CHGA and SYP. In vitro experiments revealed that, in PC cells, both SOX2 and NED genes were upregulated by SNAI2 [14]. To assess whether SNAI2's ability to boost NED genes may involve SOX2, we transfected DU145 cells (which have low levels of endogenous SNAI2 mRNA with respect to other PC cell lines and low constitutive level of SOX2 mRNA, as shown in ref. 14) to overexpress SNAI2 and silence SOX2. SOX2 silencing (by 75%) in DU145 cells resulted in a significant (p < 0.05) downmodulation of both CHGA (by 76%) and SYP (by 63%). Meanwhile, DU145 cells transfected with SNAI2-expressing vector (more than 300%, p < 0.05), resulted in the upregulation of CHGA (by 193%) and SYP (by 182%), as well as SOX2 (more than 200%, p < 0.05) (Figure 2F) [14]. As shown in Figure 2F and 2G, knockdown of SOX2 in SNAI2-overexpressing DU145 cells resulted in significantly (p < 0.05) lower levels of CHGA and SYP transcripts (by 199% and by 201%, respectively) and proteins, than those observed in PC cells overexpressing only SNAI2 and comparable to the levels observed in the control vector of transfected cells.
SOX2 regulates stemness and EMT related genes as well as growth, angiogenic and lymphangiogenic factor related genes
The significant association, emerged from the multivariate analysis, between the increase in SOX2 mRNA expression in the primary tumor and the presence of lymph node metastasis, led us to further assess whether SOX2 regulates gene sets implicated in tumor growth and progression.
■ SOX2 overexpression significantly (p < 0.05) upregulated, in both 22Rv1 and PC3 cell lines, the expression levels of specific pluripotency genes such as KLF4 (PC3: 394%; 22Rv1: 203%), CD44v6 (PC3: 99%; 22Rv1: 128%), BMI1 (PC3: 89%; 22Rv1: 81%) and NOTCH1 (PC3: 107%; 22Rv1: 90%). WB analysis confirmed the upregulation of CD44v6 and NOTCH1 in PC3 cells and of BMI1 in both cell lines. Assessment of c-Myc, which has a prominent role in PC stem-like cells (PCSCs) / cancer initiating cells (CICs) maintenance and tumorigenicity [15], revealed a substantial upregulation, at the transcriptional (by 143%) and at the protein level, only in 22Rv1 cells (Figure 3A, 3B, 3C).
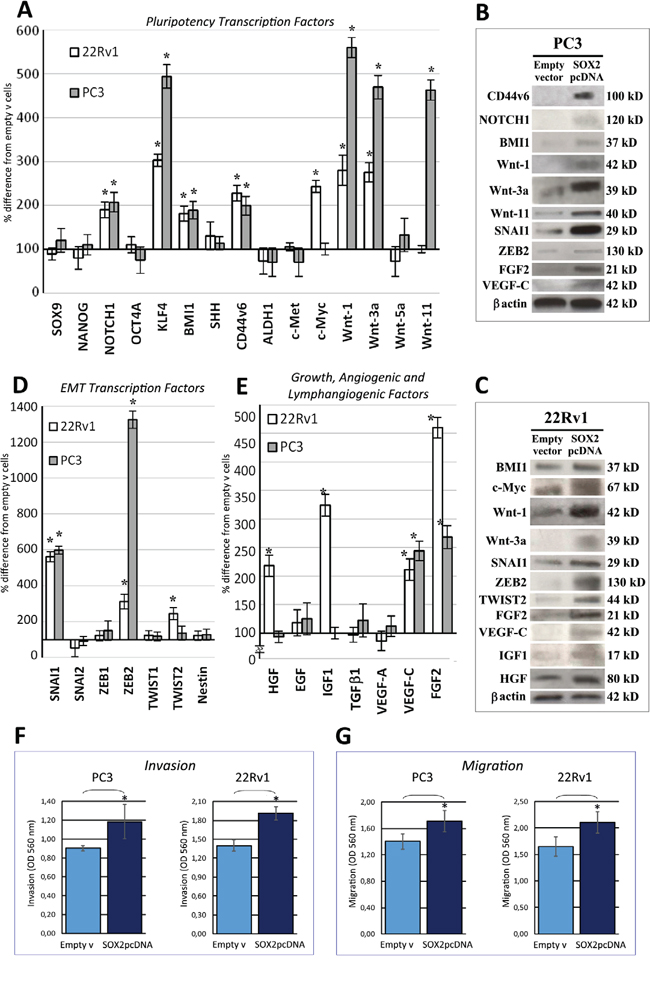
Figure 3: SOX2 overexpression upregulates pluripotency and EMT transcription factors, along with growth, angiogenic and lymphangiogenic factors, and promotes PC cell invasiveness. A. Regulation of pluripotency transcription factor mRNA expression levels by SOX2 overexpression in 22Rv1 and PC3 cell lines. NOTCH1, KLF4, BMI1, CD44v6, Wnt-1 and Wnt-3a are upregulated in both SOX2-overexpressing cell lines, whereas Wnt-11 only in PC3 cells, and c-Myc only in 22Rv1 cells. Data are representative of three independent experiments and results are expressed as mean ± SD. *p < 0.05 Student's t-test compared with control cells. B. WB analyses of proteins extracted from empty vector and SOX2 pcDNA transfected PC3 cells WB analysis confirmed, at the protein level, most of the gene expression regulation by SOX2 overexpression, evidenced at the transcript level, by qRT-PCR, as shown in panel A, D, and E. β-actin was used as a loading control. C. WB analyses of proteins extracted from empty vector and SOX2 pcDNA transfected 22Rv1 cells WB analysis confirmed, at the protein level, most of the gene expression regulation by SOX2 overexpression, evidenced at the transcript level, by qRT-PCR, as shown in panel A, D, and E. β-actin was used as a loading control. D. Regulation of EMT transcription factor mRNA expression levels by SOX2 overexpression in 22Rv1 and PC3 cell lines. SNAI1 and ZEB2 are upregulated in both SOX2-overexpressing cell lines, whereas TWIST2 only in 22Rv1 cells. Data are representative of three independent experiments and results are expressed as mean ± SD. *p < 0.05 Student's t-test compared with control cells. E. Regulation of growth, angiogenic and lymphangiogenic factor mRNA expression levels by SOX2 overexpression in 22Rv1 and PC3 cell lines. VEGF-C and FGF2 are upregulated in both SOX2-overexpressing cell lines, whereas HGF and IGF1 only in 22Rv1 cells. Data are representative of three independent experiments and results are expressed as mean ± SD. *p < 0.05 Student's t-test compared with control cells. qRT-PCR data obtained from empty vector-transfected cells were similar to those obtained from untransfected cells (not shown). F. Histograms represent invasion assay of PC3 and 22Rv1 cells transfected with SOX2 pcDNA or empty vector as measured by Optical Density (OD). Invasion assay shows a significant increase in the number of invading PC3 and 22Rv1 cells 40 hours after SOX2 pcDNA transfection, when compared with empty vector transfected cells, as measured by OD at 560 nm after extraction, using a SpectraMax 190 microplate reader. Experiments were performed in triplicate. Results are expressed as mean ± SD. *p < 0.05 Student's t-test compared with control cells. G. Histograms represent migration assays of PC3 and 22Rv1 cells transfected with SOX2 pcDNA or empty vector as measured by OD. Migration assay shows a significant increase in the number of invading PC3 and 22Rv1 cells 15 hours after SOX2 pcDNA transfection, when compared with empty vector-transfected cells, as measured by OD at 560 nm after extraction, using a SpectraMax 190 microplate reader. Experiments were performed in triplicate. Results are expressed as mean ± SD. *p < 0.05 Student's t-test compared with control cells. Migration and invasion data obtained from empty vector-transfected cells were similar to those obtained from untransfected cells (not shown).
■ Assessment of the Wnt family members, also involved in self-renewal, migration and survival of CSCs [16], revealed an increase (p < 0.05) of Wnt-1 (PC3: 460%, 22Rv1 180%), and Wnt-3a transcripts (PC3: 370%; 22Rv1: 175%) and proteins in both SOX2-overexpressing lines and an increase of Wnt-11 (by 363%) in PC3 cells only (Figure 3A, 3B, 3C).
■ Drivers of cell invasiveness, within the EMT transcription factors, SNAI1/Snail and in particular, ZEB2 transcripts and proteins, were consistently (p < 0.05) upregulated in both SOX2-overexpressing PC3 (SNAI1 by 498% and ZEB2 by 1225%) and 22Rv1 cells (SNAI1 by 462% and ZEB2 by 212%), whereas TWIST2 was increased in the latter cell line (by 144%) (Figure 3D, 3B, 3C).
■ Within the families of growth, angiogenic and lymphangiogenic factors critically involved in prostate tumorigenesis, in both SOX2-overexpressing cell lines, we found a considerable upregulation of FGF2 (PC3; 168%; 22Rv1: 360%) and VEGF-C (PC3: 144%; 22Rv1: 111%), whereas IGF1 and HGF were upregulated (by 224% and 118%, respectively) in 22Rv1 cells as confirmed by WB (Figure 3E, 3B, 3C).
SOX2 overexpression in PC cells promotes their invasion and migration
The correlation between SOX2 expression by the primary tumor and the development of lymph node metastasis, together with the finding of SOX2-dependent upregulation of EMT transcription factors, neural CAMs, which mediate cell adhesion and migration [17–19] and members of the Wnt gene family, induced us to assess alterations in migration and invasion capabilities of SOX2-overexpressing PC3 and 22Rv1 cells. Both SOX2 gene transfected lines displayed a significantly (p < 0.05) increased invasion (across matrigel-coated inserts) and migration ability (through a polycarbonate basement membrane) when compared to empty vector transfected cells (Figure 3F and 3G).
DISCUSSION
A significant role is emerging for the stemness transcription factor SOX2 in PC progression [5–6], but the dynamics of its expression and regulation in clinical samples, the related molecular outcomes and clinical pathological impact are mostly unknown. This study reveals that SOX2, regularly expressed in the basal cell layer of normal prostatic glands, is substantially downregulated, most likely by gene promoter methylation, in PC epithelia and cell lines, as previously observed in gastric cancer [20]. Although the lack of basal cells is a typical histologic feature of PC, it has emerged that this type of tumor originates in basal cells and subsequently evolves to adenocarcinoma, which is maintained by more differentiated luminal-like cells [21]. It may thus be conceivable that the epigenetic mechanisms of pluripotency gene silencing accompanying differentiation in developing embryos [22] may aberrantly occur in prostate carcinogenesis. Contrasting data on SOX2 expression in cancerous versus normal prostate have been reported [9, 23]. Our results from microdissected epithelia rule out confounding information from the heterogeneous stromal component and suggest that SOX2 plays a role in the normal prostatic gland hierarchy and self-renewal, whereas its epigenetic silencing accompanies the onset of most malignant glands. Its focal expression, instead, shapes NED in PC and confers selected clones with invasive and migratory properties, as corroborated by gene transfection, by functional studies and by the finding of a strong association between SOX2 mRNA expression in the primary tumor and lymph node metastasis.
Besides small-cell/neuroendocrine PC [14, 23], other neuroendocrine tumors have been described to express SOX2, such as small-cell lung cancer and Merkel cell carcinoma of the skin [8, 24]. SOX2 overexpression by PC cell lines, either androgen-dependent or -independent, dramatically boosts a range of NED genes such as SYP, S100, CHGA and ENO2. We recently found that SNAI2 elicits SOX2 and NED gene expression in PC cell lines and that these genes frequently co-localized in the primary tumors [14]. The present study revealed, through co-transfection experiments, that SOX2 plays a key role in SNAI2′s ability to regulate NED gene expression, since its silencing almost abolished CHGA and SYP upregulation by SNAI2. Moreover, the frequent co-expression of SOX2 and CHGA in both primary tumors (localized not only in typical NED areas, but also in PC cells scattered or located at the invasion fronts of high grade PC) and in lymph node metastasis, is highly suggestive of their cooperation in shaping the metastatic phenotype. The leading role of SOX2 in this context is also corroborated by its ability to boost a network of pro-metastatic genes such as those coding for neural tissue associated molecules NrCAM, L1CAM and CHL1, which behave as physiological signaling transducers of axon guidance and neuronal migration, but also as aberrant drivers for tumor cell invasion and motility [17–19].
Well-known regulator of neuronal differentiation, survival and growth, within the classic neurotrophins family, BDNF and its receptor NTRK2/TrkB, which are implicated in PC progression [25], emerge as novel SOX2 targets together with NGFR, which instead may function as a PC suppressor [26]. However, the wide range of SOX2 activated tumor progression pathways may overcome the effects of this molecular alteration.
The correlation between the expression of SOX2 in the primary tumor and lymph node metastasization fits well with its ability to upregulate critical tumor promoting factors such as FGF2 [27], VEGF-C and NRP2. Originally identified as a semaphorin receptor and regulator of axon guidance, NRP2 has been found to act as a co-receptor of VEGF-C [28], and it has been implicated in angiogenesis, lymphangiogenesis and lymph node metastasization. The first step of metastasization is invasion, which is enabled by EMT [29] and may be promoted by SOX2 through SNAI1/Snail, TWIST2 and ZEB2 upregulation, whereas migration may be driven by the IGF1/IGFR [30, 31] or HGF/Met [32, 33] signaling axis, both to be included as novel SOX2 targets. HGF has also been shown to play a role in the maintenance of PCSCs/CICs in an autocrine and paracrine fashion [34] and, together with the pluripotency genes NOTCH1 [35], BMI1 [36], CD44v6 [37] and the proto-oncogene c-Myc [15], may be envisaged as downstream SOX2 targets which cooperate in conferring PC cells with a pluripotent and spreading-prone phenotype.
Correlated with PC aggressiveness through their ability to increase the self-renewal of putative PCSCs, promote EMT and stimulate AR target genes, members of the Wnt signaling family, namely Wnt-1, Wnt-3a and Wnt-11 [16], are substantially upregulated by SOX2 and their increased expression may lead to androgen deprivation therapy failure and PC recurrence [16].
Although Kaplan-Meir curves suggest a correlation between biochemical recurrence-free survival and SOX2 mRNA expression, the low relapse rate observed in our cohort does not allow to draw a definitive conclusion. Even so, while disclosing a discrete network of novel SOX2 target genes mostly involved in PC progression, the novelty of our study consists in I. the revelation of a variety of molecular alterations elicited by SOX2 overexpression, which can lead to disease aggressiveness and progression, II. the identification of SOX2 as a critical target through which to hinder metastasization, and finally III. the proposal to assess SOX2 expression in the prostate needle biopsy as a biomarker of nodal metastasization and a useful tool for tailoring the extent of lymphadenectomy at surgery. A larger cohort of patients and clinical samples will be used to determine whether assessment of SOX2 mRNA in PC might improve accuracy of current nomogram predicting LN invasion [38] and thus enter in clinical practice.
MATERIALS AND METHODS
Ethics statement
Written informed consent was obtained. Investigation has been conducted in accordance with the ethical standards with the Declaration of Helsinki and national and international guidelines and has been approved by the Ethical Committee of the “G. d'Annunzio” University of Chieti and Local Health Authority No.2 Lanciano-Vasto-Chieti, Italy (PROT 1945/09 COET of 14/07/2009).
Patients and samples
We collected prostate specimens and clinical pathological data related to 206 patients who underwent radical prostatectomy for PC between 2006 and 2014 at the “S.S. Annunziata” Hospital, Chieti, Italy (Table 1), which were followed-up for 1–9 years after prostatectomy. In addition, we obtained normal prostates (histologically negative for PC or benign prostatic hyperplasia) from 15 untreated patients aged 55 to 64, prostatectomized for bladder cancer (controls). Details on the clinical pathological data and tissue sample processing are reported in the Supplementary Materials and Methods.
Immunohistochemistry
Immunohistochemistry and immunofluorescence stainings were performed as reported in ref. 39 and described in detail in the Supplementary Materials and Methods.
Morphometric analyses
SOX2, CHGA and SYP expression in primary tumors or lymph node metastases was evaluated, as previously reported [14], using the following criteria:
1. the widening of the staining expressed as the percentage of tumor or lymph node metastasis stained i.e.: <50%, ≥50% ≤70% and >70%,
2. the strength of the staining defined as negative (0), slight (1), moderate (2) or intense (3).
Thus, immunostaining was defined as:
• strong ++, when a) the widening was >70% and its strength ranged from slight (1) to intense (3), or b) the widening was >50% ≤70% and its strength ranged from moderate (2) to intense (3);
• distinct +, when a) the widening was >50% ≤70% and its strength was slight (1) or b) the widening was = 50% and its strength ranged from slight (1) to intense (3);
• absent −, when the widening was <50% and its strength was slight (1) to negative (0).
Immunostained formalin fixed and paraffin embedded sections were evaluated with Leica DM 2500 microscope at X400 magnification in a 85431.59 μm2 field, by two pathologists (EDC and CS) in blind fashion, with very good agreement (κ value = 0.82) [40].
LCM
For LCM, 10 μm frozen sections from cancer and normal prostate specimens from the controls and PC patients were analyzed. Neoplastic foci with low Gleason grade (≤3) were microdissected from PC samples of 75/206 patients, whereas those with high-grade (>3) were obtained from the other 131 patients, as described in the Supplementary Materials and Methods.
qMSP
For qMSP, genomic DNA was extracted from PC cell lines and from microdissected cells and bisulfite converted using the EpiTect Fast DNA Bisulfite Kit (Qiagen, Hilden, D). The methylation levels of the SOX2 gene promoter were assessed as described in the Supplementary Materials and Methods.
Cell cultures
PC cell lines 22Rv1, DU145, LNCaP, and PC3 were from ATCC (Manassas, VA, USA), which performed their characterization by Short Tandem Repeats profile analysis. Cell lines were passaged in our laboratory for fewer than 6 months after resuscitation. Details on cell culture, treatment with 5-Aza-2′-deoxycytidine (5-Aza-dC) and cell transfections are provided in the Supplementary Materials and Methods.
Migration and invasion assay
The CytoSelect Cell Migration and Invasion Assay Kit (Cell-Biolabs, San Diego, CA, USA) was used as illustrated in the Supplementary Materials and Methods.
Quantitative RT-PCR (qRT-PCR)
qRT-PCR was performed on RNA extracted from microdissected cells, PC cell lines transfected with SOX2 pcDNA, SNAI2 pcDNA, SOX2 shRNA, co-transfected with SNAI2 pcDNA/SOX2 shRNA and respective controls, with the Quantitect Reverse Transcription Kit for the Reverse Transcription and the Quantifast SYBR Green PCR Kit for qPCR (Qiagen). Details are described in the Supplementary Materials and Methods.
Western blotting
WB was performed using total proteins obtained from approximately 2.0 × 10⁶ cells as described in the Supplementary Materials and Methods.
Statistical analysis
Between-group differences in the relative expression of SOX2 mRNA in the epithelial compartments of normal and neoplastic prostate tissues were assessed by ANOVA. The difference between each pair of means was evaluated with the Tukey HSD test. Differences between SOX2 pcDNA and empty vector transfected PC cells, in gene expression determined by qRT-PCR, in invasion and migration capability and between PC cells treated with or without 5-Aza-dC were assessed by Student's t-test. Differences between SNAI2 pcDNA transfected, SOX2 shRNA treated, SNAI2 pcDNA/SOX2 shRNA co-transfected, and empty vector transfected PC cells, in gene expression determined by qRT-PCR, were assessed by Student's t-test. Spearman's test was used to examine the correlation between SOX2 expression levels and gene methylation status. Association between SOX2 and CHGA staining was analysed by Fisher's exact test. The potential association between the presence of lymph node metastasis and all recorded variables was initially evaluated using chi-squared test for categorical variables and the Mann-Whitney U test for continuous ones. Kaplan-Meier survival analysis was also used to examine the association between SOX2 mRNA expression and biochemical recurrence. Stepwise forward logistic regression was then used to investigate potential independent indicators of the presence of lymph node metastasis.
Gleason grade in microdissected focus, could not be included as a variable in the logistic model, because of perfect failure prediction (100.0% of the subjects with lymph node metastasis had Gleason level higher than 3). Only significant covariates were kept into the final model and the overall number of covariates was limited to 5 throughout the steps of model fitting to reduce potential overfitting. Standard diagnostic procedures were adopted to check final model validity: influential observation analysis (Dbeta, change in Pearson chi-square), multicollinearity, interaction terms, Hosmer-Lemeshow test for the goodness of fit and C statistic (area under the Receiving Operator Curve). We had no missing values.
The SOX2 mRNA expression level was first analyzed in each microdissected PC samples from low and high grade foci relative to XpressRef Universal Total RNA (SABiosciences, Frederick, MD, USA). We then identified a SOX2 mRNA expression threshold among 10 arbitrarily chosen cutoffs (thresholds were identified using multiples of 0.2, starting from 0.2 up to 2.00). The criteria for the selection of the best cutoff were: higher sensitivity and specificity, > 0.70, higher Pseudo-R2 value in the logistic regression model and easiness of interpretation in clinical practice. The SOX2 mRNA expression level of 1.00, relative to XpressRef Universal Total RNA, showed the best combination of sensitivity, specificity, and pseudo-R2 values and was, thus, reported and included in the final logistic model.
A second model, identical to the final one, was also fitted to show the results of SOX2 mRNA expression when treated as a continuous variable (in its identifying form). All other tested cutoffs, starting from a SOX2 mRNA expression level of 0.2, were significantly associated with lymph node metastasis in both univariate and multivariate analysis, but the results for each are not shown to avoid redundancy. Ninety-five percent confidence intervals (CI) for specificity and sensitivity were computed according to the efficient-score method (corrected for continuity) as described by Newcombe [41]. Statistical significance was defined as a two-sided p-value < 0.05 and all analyses were carried out using Stata version 13 (Stata Corp., College Station, TX, USA).
CONFLICTS OF INTEREST
The authors disclose no potential conflicts of interest.
FINANCIAL SUPPORT
This work was supported by grants from the Associazione Italiana Ricerca sul Cancro (AIRC, Investigator Grant n. 13134), Ricerca Finalizzata Ministero della Salute Grant n. RF-2013-02357552 and the “Umberto Veronesi”; and grants from AIRC (Investigator Grant n. 13018), Ricerca Finalizzata Collaboratore Estero, Ministero della Salute (Grant n. RF-2010-2308270), and from Cinque per mille e Ricerca Corrente, Ministero della Salute to I. Airoldi. Foundation for the Progress of Sciences to E. Di Carlo. Both foundations played no role in the study.
REFERENCES
1. Beltran H, Tomlins S, Aparicio A, Arora V, Rickman D, Ayala G, Huang J, True L, Gleave ME, Soule H, Logothetis C, Rubin MA. Aggressive variants of castration-resistant prostate cancer. Clin Cancer Res. 2014; 20:2846–2850.
2. Pece S, Tosoni D, Confalonieri S, Mazzarol G, Vecchi M, Ronzoni S, Bernard L, Viale G, Pelicci PG, Di Fiore PP. Biological and molecular heterogeneity of breast cancers correlates with their cancer stem cell content. Cell. 2010; 140:62–73.
3. Sarkar A, Hochedlinger K. The sox family of transcription factors: versatile regulators of stem and progenitor cell fate. Cell Stem Cell. 2013; 12:15–30.
4. Takahashi K, Yamanaka S. Induction of pluripotent stem cells from mouse embryonic and adult fibroblast cultures by defined factors. Cell. 2006; 126:663–676.
5. Liu K, Lin B, Zhao M, Yang X, Chen M, Gao A, Liu F, Que J, Lan X. The multiple roles for Sox2 in stem cell maintenance and tumorigenesis. Cell Signal. 2013; 25:1264–1271.
6. Weina K, Utikal J. SOX2 and cancer: current research and its implications in the clinic. Clin Transl Med. 2014; 3:19.
7. Leis O, Eguiara A, Lopez-Arribillaga E, Alberdi MJ, Hernandez-Garcia S, Elorriaga K, Pandiella A, Rezola R, Martin AG. Sox2 expression in breast tumours and activation in breast cancer stem cells. Oncogene. 2012; 31:1354–1365.
8. Rudin CM, Durinck S, Stawiski EW, Poirier JT, Modrusan Z, Shames DS, Bergbower EA, Guan Y, Shin J, Guillory J, Rivers CS, Foo CK, Bhatt D, et al. Comprehensive genomic analysis identifies SOX2 as a frequently amplified gene in small-cell lung cancer. Nat Genet. 2012; 44:1111–1116.
9. Jia X, Li X, Xu Y, Zhang S, Mou W, Liu Y, Liu Y, Lv D, Liu CH, Tan X, Xiang R, Li N. SOX2 promotes tumorigenesis and increases the anti-apoptotic property of human prostate cancer cell. J Mol Cell Biol. 2011; 3:230–238.
10. Rybak AP, Tang D. SOX2 plays a critical role in EGFR-mediated self-renewal of human prostate cancer stem-like cells. Cell Signal. 2013; 25:2734–2742.
11. Lin F, Lin P, Zhao D, Chen Y, Xiao L, Qin W, Li D, Chen H, Zhao B, Zou H, Zheng X, Yu X. Sox2 targets cyclinE, p27 and survivin to regulate androgen-independent human prostate cancer cell proliferation and apoptosis. Cell Prolif. 2012; 45:207–216.
12. Li X, Xu Y, Chen Y, Chen S, Jia X, Sun T, Liu Y, Li X, Xiang R, Li N. SOX2 promotes tumor metastasis by stimulating epithelial-to-mesenchymal transition via regulation of WNT/β-catenin signal network. Cancer Lett. 2013; 336:379–389.
13. Kregel S, Kiriluk KJ, Rosen AM, Cai Y, Reyes EE, Otto KB, Tom W, Paner GP, Szmulewitz RZ, Vander Griend DJ. Sox2 is an androgen receptor-repressed gene that promotes castration-resistant prostate cancer. PLoS One. 2013; 8:e53701.
14. Esposito S, Russo MV, Airoldi I, Tupone MG, Sorrentino C, Barbarito G, Di Meo S, Di Carlo E. SNAI2/Slug gene is silenced in prostate cancer and regulates neuroendocrine differentiation, metastasis-suppressor and pluripotency gene expression. Oncotarget. 2015; 6:17121–17134. doi: 10.18632/oncotarget.2736.
15. Civenni G, Malek A, Albino D, Garcia-Escudero R, Napoli S, Di Marco S, Pinton S, Sarti M, Carbone GM, Catapano CV. RNAi-mediated silencing of Myc transcription inhibits stem-like cell maintenance and tumorigenicity in prostate cancer. Cancer Res. 2013; 73:6816–6827.
16. Valkenburg KC, Graveel CR, Zylstra-Diegel CR, Zhong Z, Williams BO. Wnt/β-catenin Signaling in Normal and Cancer Stem Cells. Cancers (Basel). 2011; 3:2050–2079.
17. Conacci-Sorrell M, Kaplan A, Raveh S, Gavert N, Sakurai T, Ben-Ze’ev A. The shed ectodomain of Nr-CAM stimulates cell proliferation and motility, and confers cell transformation. Cancer Res. 2005; 65:11605–11612.
18. Kiefel H, Bondong S, Hazin J, Ridinger J, Schirmer U, Riedle S, Altevogt P. L1CAM: a major driver for tumor cell invasion and motility. Cell Adh Migr. 2012; 6:374–384.
19. He LH, Ma Q, Shi YH, Ge J, Zhao HM, Li SF, Tong ZS. CHL1 is involved in human breast tumorigenesis and progression. Biochem Biophys Res Commun. 2013; 438:433–438.
20. Otsubo T, Akiyama Y, Yanagihara K, Yuasa Y. SOX2 is frequently downregulated in gastric cancers and inhibits cell growth through cell-cycle arrest and apoptosis. Br J Cancer. 2008; 98:824–831.
21. Stoyanova T, Cooper AR, Drake JM, Liu X, Armstrong AJ, Pienta KJ, Zhang H, Kohn DB, Huang J, Witte ON, Goldstein AS. Prostate cancer originating in basal cells progresses to adenocarcinoma propagated by luminal-like cells. Proc Natl Acad Sci USA. 2013; 110:20111–20116.
22. Christophersen NS, Helin K. Epigenetic control of embryonic stem cell fate. J Exp Med. 2010; 207:2287–2295.
23. Yu X, Cates JM, Morrissey C, You C, Grabowska MM, Zhang J, DeGraff DJ, Strand DW, Franco OE, Lin-Tsai O, Hayward SW, Matusik RJ. SOX2 expression in the developing, adult, as well as, diseased prostate. Prostate Cancer Prostatic Dis. 2014; 17:301–309.
24. Laga AC, Lai CY, Zhan Q, Huang SJ, Velazquez EF, Yang Q, Hsu MY, Murphy GF. Expression of the embryonic stem cell transcription factor SOX2 in human skin: relevance to melanocyte and merkel cell biology. Am J Pathol. 2010; 176:903–913.
25. Montano X, Djamgoz MB. Epidermal growth factor, neurotrophins and the metastatic cascade in prostate cancer. FEBS Lett. 2004; 571:1–8.
26. Arrighi N, Bodei S, Zani D, Simeone C, Cunico SC, Missale C, Spano P, Sigala S. Nerve growth factor signaling in prostate health and disease. Growth Factors. 2010; 28:191–201.
27. Corn PG, Wang F, McKeehan WL, Navone N. Targeting fibroblast growth factor pathways in prostate cancer. Clin Cancer Res. 2013; 19:5856–5866.
28. Xu Y, Yuan L, Mak J, Caunt M, Kasman I, Larrivée B, Del Toro R, Suchting S, Medvinsky A, Silva J, Yang J, Thomas JL, Koch AW, et al. Neuropilin-2 mediates VEGF-C-induced lymphatic sprouting together with VEGFR3. J Cell Biol. 2010; 188:115–130.
29. Nieto MA, Cano A. The epithelial-mesenchymal transition under control: global programs to regulate epithelial plasticity. Semin Cancer Biol. 2012; 22:361–368.
30. Kaplan PJ, Mohan S, Cohen P, Foster BA, Greenberg NM. The insulin-like growth factor axis and prostate cancer: lessons from the transgenic adenocarcinoma of mouse prostate (TRAMP) model. Cancer Res. 1999; 59:2203–2209.
31. Sprenger CC, Haugk K, Sun S, Coleman I, Nelson PS, Vessella RL, Ludwig DL, Wu JD, Plymate SR. Transforming Growth Factor-{beta}-Stimulated Clone-22 Is an Androgen-Regulated Gene That Enhances Apoptosis in Prostate Cancer following Insulin-Like Growth Factor-I Receptor Inhibition. Clin Cancer Res. 2009; 15:7634–7641.
32. Russo AL, Jedlicka K, Wernick M, McNally D, Kirk M, Sproull M, Smith S, Shankavaram U, Kaushal A, Figg WD, Dahut W, Citrin D, Bottaro DP, et al. Urine analysis and protein networking identify met as a marker of metastatic prostate cancer. Clin Cancer Res. 2009; 15:4292–4298.
33. Jensen AR, David SY, Liao C, Dai J, Keller ET, Al-Ahmadie H, Dakin-Haché K, Usatyuk P, Sievert MF, Paner GP, Yala S, Cervantes GM, Natarajan V, Salgia R, Posadas EM. Fyn is downstream of the HGF/MET signaling axis and affects cellular shape and tropism in PC3 cells. Clin Cancer Res. 2011; 17:3112–3122.
34. Nishida S, Hirohashi Y, Torigoe T, Inoue R, Kitamura H, Tanaka T, Takahashi A, Asanuma H, Masumori N, Tsukamoto T, Sato N. Prostate cancer stem-like cells/cancer-initiating cells have an autocrine system of hepatocyte growth factor. Cancer Sci. 2013; 104:431–436.
35. Kwon OJ, Valdez JM, Zhang L, Zhang B, Wei X, Su Q, Ittmann MM, Creighton CJ, Xin L. Increased Notch signalling inhibits anoikis and stimulates proliferation of prostate luminal epithelial cells. Nat Commun. 2014; 5:4416.
36. Lukacs RU, Memarzadeh S, Wu H, Witte ON. Bmi-1 is a crucial regulator of prostate stem cell self-renewal and malignant transformation. Cell Stem Cell. 2010; 7:682–693.
37. Tei H, Miyake H, Harada K, Fujisawa M. Expression profile of CD44s, CD44v6, and CD44v10 in localized prostate cancer: effect on prognostic outcomes following radical prostatectomy. Urol Oncol. 2014; 32:694–700.
38. Briganti A, Larcher A, Abdollah F, Capitanio U, Gallina A, Suardi N, Bianchi M, Sun M, Freschi M, Salonia A, Karakiewicz PI, Rigatti P, Montorsi F. Updated nomogram predicting lymph node invasion in patients with prostate cancer undergoing extended pelvic lymph node dissection: the essential importance of percentage of positive cores. Eur Urol. 2012; 61:480–487.
39. Di Meo S, Airoldi I, Sorrentino C, Zorzoli A, Esposito S, Di Carlo E. Interleukin-30 expression in prostate cancer and its draining lymph nodes correlates with advanced grade and stage. Clin Cancer Res. 2014; 20:585–594.
40. Landis JR, Koch GG. The measurement of observer agreement for categorical data. Biometrics. 1977; 33:159–174.
41. Newcombe RG. Two-sided confidence intervals for the single proportion: comparison of seven methods. Stat Med. 1998; 17:857–872.