
Introduction
Recent advances in tiling arrays and RNA deep sequencing (RNA-seq), have revealed that between and within protein-coding genes there lie sequences for many thousands of long non-coding RNAs (lncRNAs) greater than 200 nucleotides (nt) in length [1]. LncRNAs affect many biological processes [2-4], including regulation of gene expression, genomic imprinting, nuclear organization, and compartmentalization. However, we have limited knowledge of how lncRNA functions [5], even for the earliest discovered lncRNAs, such as mammalian H19 [6-8], Xist [9] or HOTAIR [10].
Functional characterization of lncRNAs is a challenging task. Poor sequence conservation and tissue-specific expression make it difficult to accurately predict from the level or extent of its expression, or its sequence composition [11, 12]. In addition, there is lack of molecular interaction data, further hampering functional annotation of lncRNAs [13-15]. Genetic loss-of-function strategies can be used to study the function of lncRNAs in vivo, however, these are time-consuming and expensive [16]. Recently, several approaches have been proposed to predict lncRNA function, but only a small portion of lncRNAs have been functionally characterized. Cabili et al. has defined a reference catalog of > 8,000 human lncRNAs and functionally characterized these lncRNAs through co-expression between protein-coding genes and lncRNAs [17]. Similarly, Liao et al. has constructed a coding-noncoding co-expression network based on gene expression data and predicted the probable functions for lncRNAs in that network [18]. Recently, Guo et al. tried to apply a global network-based strategy to tackle this issue [19]. They developed a bi-colored network based global function predictor (‘lnc-GFP’) to predict probable functions for lncRNAs on a large scale by integrating gene expression data and protein interaction data. Although all of these studies have enhanced our knowledge about lncRNAs, only gene expression data and local genomic information were used in their methods [19].
Considering the key roles that lncRNAs likely play, their transcription must be tightly regulated. Similar to protein-coding genes, most lncRNAs are transcribed by RNA polymerase II and have typical epigenetic hallmarks, including DNA methylation and acetylation and/or methylation of histone residues [20]. Epigenetic-based mechanisms including DNA methylation and acetylation and/or methylation of histone residues play a critical role in gene and lncRNA expression [21, 22]. The histone modification state of genomic regions is hypothesized to reflect the regulatory activity of the underlying genomic sequence, so investigations of these features may advance our understanding of lncRNAs. Previous studies have demonstrated that chromatin marks correlate with gene expression [23, 24]. Histone modifications can either activate or repress gene transcription, and occur combinatorially to form a ‘histone code’ that is read by other proteins to give rise to various downstream events [25]. Interestingly, Wamstad et al. found that, despite similar expression patterns, groups of functionally related genes can be distinguished at the chromatin level [26]. Many studies have identified other noncoding regulators, such as enhancers, based on the chromatin combinations [27-29]. These results suggest that genomic annotation of these chromatin states can extend the functional interpretation of noncoding part of the human genome. Based on these observations, a number of studies have used chromatin patterns to identify lncRNAs. Guttman et al. systematically discovered a large number of lncRNAs by exploring chromatin structure and developed an approach to predict putative functions [30]. By the same method, Khalil et al. also identified approximately 3,300 lincRNAs in six human cell types and further examined the associations between these lincRNAs and polycomb repressive complex 2 (PRC2) [31]. In addition, Lv et al. demonstrated that the accuracy of lncRNA predictions can be greatly improved when incorporating chromatin modifications data [32]. Moreover, Ounzain et al. reasoned that lncRNAs that share specific chromatin patterns as those described for coding genes are likely to be involved in comparable biological processes. Based on this hypothesis, they successfully inferred heart-specific functions for the novel lncRNAs identified in their study [33].
Motivated by these studies, here, we propose an integrative framework to predict the lncRNA functions based on both chromatin states and exprssion patterns (Figure 1). Taking advantage of the datasets from the ENCODE project, we compiled genome-wide chromatin and expression profiles for lncRNAs and coding genes. We then derived a novel unbiased integrative model to functionally annotate lncRNAs. The proposed method was validated on protein-coding genes with known functional annotations by five-fold cross-validations. Applying the trained integrative model, we predicted the probable functions for more than 97% of human lncRNAs. We also linked cancer-associated lncRNAs to cellular processes that are hallmarks of cancer, providing a “lncRNA point-of-view” on tumor biology. Our attempt to compile massive RNA-Seq and ChIP-Seq data will facilitate future functional investigation of lncRNAs and serves as an important resource (LncRNA Ontology), for further biological research.
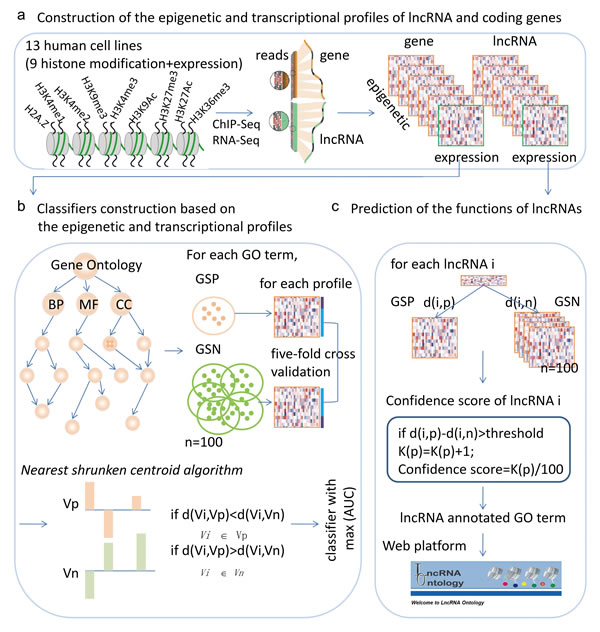
Figure 1: Workflow for predicting the functions of lncRNAs based on chromatin and expression patterns. a., chromatin and expression profiles for lncRNAs and protein coding genes were constructed based on ChIP-Seq and RNA-Seq datasets. b., for each GO term and each chromatin and expression profile, a nearest shrunken centroid algorithm based classifier was constructed and the power of the classifiers was evaluated by AUC. The classifier with the maximum AUC was selected as the final classifier. c., predicting the functions of lncRNAs based on the chromatin and expression patterns.
Results
Integration of transcriptional and chromatin features effectively predicts gene functions
To systematically study the relationship between biological function and chromatin state, we collected 117 ChIP-seq profiles of histone modifications (seven activating signals and two repressive ones) along with the corresponding transcriptome data assayed by RNA-seq across thirteen human cell lines. These data were downloaded from the ENCODE project (Table S1). We hypothesized that groups of functionally related genes (as determined by gene ontology [GO]) would have similar histone modifications and expression levels, which could be used to distinguish them. For genes within each GO term from the database, we calculated their similarity at the level of expression and modification. We found that genes annotated in the same term of the biological process (BP) ontology show high co-expression at the FDR < 0.01; however, just 20% BP terms were satisfied. This is similar to what has been found in S. cerevisiae and C. elegans [34], indicating that co-expression alone generally provides a relatively narrow range for functional prediction. In contrast, compared to co-expression, we found a much wider similarity at the level of epigenetic modifications under different FDR threshold values (Figure 2a). Moreover, the vast majority (97.17%) of GO terms with high co-expression also show high chromatin similarity (Figure 2b). The same tendency was also found for two additional ontology branches. In addition, there are many GO terms that were only similar at the level of chromatin modifications, suggesting that expression was not the best predictor for these terms. Interestingly, complementary effects were revealed for active and repressive chromatin modifications, with many functional groups exhibiting high similarity in both kinds of modifications (Figure 2c).
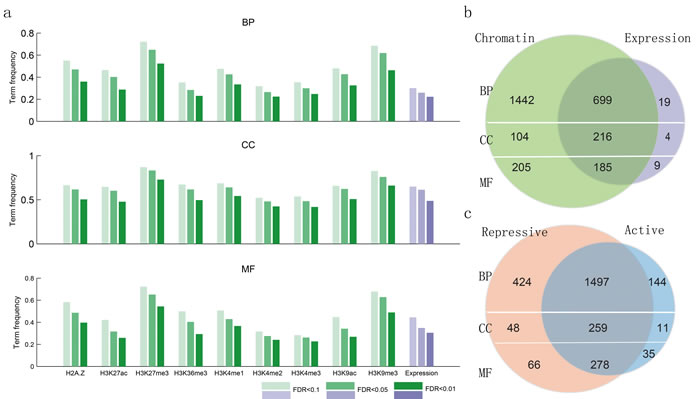
Figure 2: Functionally similar genes have epigenetic and transcriptional similarities. a., the proportion of GO terms with epigenetic and transcriptional similarities. b., venn diagram showing the number of GO terms with chromatin and expression similarities. c., venn diagram showing the number of GO terms with chromatin similarities, with the chromatin states divided into active and repressive based on their effects on gene expression.
Given that both gene expression and epigenetic regulation can act as predictors for function of protein-coding genes, we wanted to establish an integrative method using both expression and modifications to predict lncRNA functions genome-wide. First, we trained this model on protein-coding genes with known functional information (Materials and Methods). We compared the predictive power of 9 chromatin features and gene expression using the index of average Area Under the Curve (AUC). As shown in Figure 3, all the chromatin and expression features were much better predictors than random ordering, which would give an expected AUC of 0.5. The median AUCs of the models learned from the chromatin features were all higher than those for expression, and there was no difference in performance between active and repressive chromatin modifications. The relative predictive power of different chromatin features was heterogeneous across different biological processes. Some GO terms with higher AUCs learned from chromatin features while others learned from expression. These results suggested that the integration of these two predictors was best; therefore, we used an integrative model to predict gene functions for each specific GO term. The median AUC value of all terms was ~0.6, comparable to the performance of the top-five performing models in the CAFA experiment [35], validating our integrative model as an effective predictor of gene function.
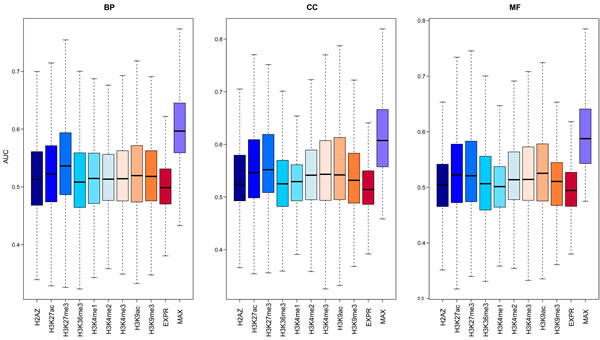
Figure 3: The predictive power of the model using signals from different chromatin or expression features. For each GO term, 100 GSNs with the same number of genes as GSPs were randomly selected from the remaining genes, and then cross-validation was used to compute the AUC. The average AUCs for 100 times of all GO terms are shown in the boxplot. The left panel is for biological process (BP) categories, middle panel for cell component (CC) categories and the right panel for molecular function (MF) categories.
Integration of transcriptional and epigenetic features predicts the functions of lncRNAs
The promoters of genes and lncRNAs were divided into 20bp bins and read density was counted. We observed that, as shown previously, several histone marks show a similar distribution pattern around the transcriptional start site (TSS) of both lncRNAs and mRNAs irrespective of cell types. This was particularly true for the activating signals, H3K4me3 and H3K4me1, as well as the repressive histone mark H3K27me3 (Figure 4a and Figure S1-S13). These findings suggest that the epigenetic regulation of lncRNAs is similar to that of protein coding genes.
Based on our prior hypothesis about predicting function of protein-coding genes, we predicted lncRNA functions using these same integrative modeling. We used the nearest shrunken centroid algorithm to assign lncRNAs to each GO term with a confidence score ranging from 0 to 1 (Materials and Methods). We obtained 5,404,928 lncRNA-GO associations among 17,998 lncRNAs and 1,256 GO terms with a confidence score of 1.0, and we assigned functions for 97.79% of all lncRNAs for BP, 97.77% of all lncRNAs for cellular components (CC), and 97.77% of all lncRNAs for molecular function (MF). LncRNAs were predicted to be involved in diverse biological processes including organ/tissue development (e.g. neuron, eye and muscle development), cellular transport, and metabolism. We next analyzed how much each predictive feature contributed to lncRNA functional associations. As shown in Figure 4b, H3K9ac contributed the highest number of associations, while the lncRNA expression contributed the least. H2A.Z, H3K27ac, H3K36me3 and H3K4me1/3 are comparable in the number of the predicted results. The above analyses suggest that the functions of lncRNAs can be at least partially deduced from chromatin features.
An integrative model provides a robust method of predicting lncRNA functions
While only a small number of lncRNAs have been functionally characterized, it is believed that lncRNAs interact with DNA, RNA, and proteins [34], acting as regulators in chromatin organization, transcription and post-transcriptional modulation. In order to validate our predictions of lncRNA function, we tested our findings against known lncRNA-protein interactions, lncRNA-chromatin interactions, and lncRNA knockdown/overexpression datasets. First, we collected the lncRNA-protein interactions identified by CLIP-Seq datasets and predicted the functions of lncRNAs by annotation of the interacting genes. Based on these interactions, 4,505 lncRNAs regulated at least one function, whereas our model predicted the same functions for 3,291 (73.05%) of these lncRNAs (Figure 4c, P < 0.05). The 3D structure of the genome plays a critical role in regulating gene expression [36]; thus, we compiled the chromatin interaction datasets from the 4Dgenome database, involving 616,476 interactions among 12,434 lncRNAs and 17,451 genes. The predicted functions of 40.65% of lncRNAs overlapped with those predictions from our integrative model. Finally, we utilized data from lncRNA knockdown/overexpression experiments collected from the LncRNA2Target database [16], where the differentially expressed genes are considered as the target genes of the lncRNAs. Based on these datasets, we found the functions were matched with our predictions for 8/23 (34.78%) of lncRNAs.
As these methods predicted the functions of lncRNAs from different viewpoints, we analyzed these results and found that most of the unique lncRNA-GO term pairs were predicted by our method (Figure S14). These pairs provide candidates for further experimental validation. In addition, we observed that a majority of pairs were predicted by H3K9ac histone marks. Recently, H3K9ac was shown to have a high power to predict the expression of genes [24], suggesting that H3K9ac plays a key role in regulating gene expression. We also observed that about 91 pairs of lncRNA-GO terms were included in the lncRNAdb v2.0 [37], a comprehensive, manually curated reference database of lncRNAs that have been described independently in the scientific literature.
Taken together, our results indicate the robustness of our model at predicting lncRNA functions. To further assess our model based on available datasets, we gradually reduced the number of cell lines from 13 to 9 to perform the above prediction pipeline. When sample size decreased, the median AUC pattern never changed (Figure S15-Figure S18). In addition, analysis of the lncRNA-function pairs at varying sample numbers revealed up to 80% functional consistency across all three ontologies at a confidence score of 1.0 (Figure 4d). These analyses indicate that sample size may not be a significant part of our algorithm’s final performance.
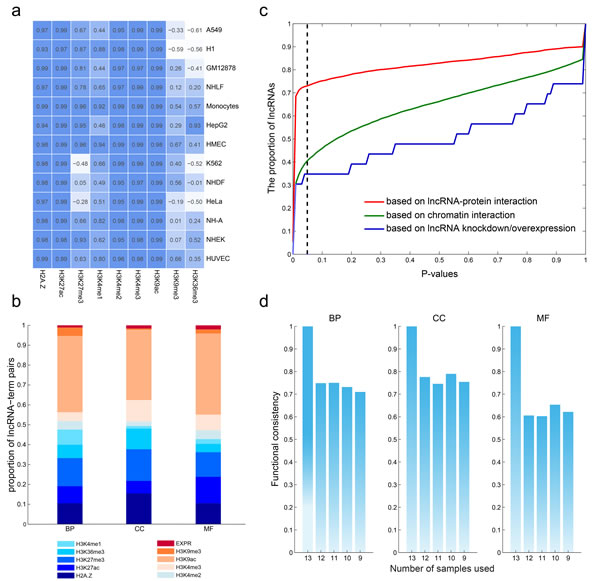
Figure 4: Robustness of the predicted functions of lncRNAs. a., lncRNAs share common chromatin patterns with protein coding genes. The matrix shows the correlation of chromatin modification around the TSSs (+2kb) of lncRNAs and protein coding genes in each cell type. b., the contribution of each chromatin and expression feature to the predicted lncRNA-GO term associations. c., the consistency of lncRNA-GO term associations using different number of cell types. d., predicted lncRNA functions show high consistency with commonly used methods.
Prediction of functions for cancer-associated lncRNAs
LncRNAs are dysregulated in several human cancers and involved in a broad spectrum of functions [38, 39]. Although the biology of cancer is extremely complex, there are a few cancer hallmarks that enable tumor growth and metastasis dissemination [40, 41]. Here, we linked the cellular processes influenced by lncRNAs to the hallmarks of cancer, providing a “lncRNA point-of-view” on tumor biology. We used a list of GO terms previously defined as related to cancer hallmarks [42] and obtained 109 experimentally-validated cancer lncRNAs, including disease lncRNAs in the LncRNADisease database [43]. Of these lncRNAs, we found that 55 were associated with at least one cancer-associated GO term. And these lncRNAs are totally functionally annotated with 19 cancer hallmark GO terms. Figure 5a shows the 194 pairs of lncRNA-GO associations. With analysis of chromatin and expression patterns, we found that the 194 pairs of lncRNA-GO associations were predicted based on chromatin similarity (Figure 5b). Some functional links were consistent with the literature. For example, HOTAIR is a well-known lncRNA whose dysregulation correlates with poor prognosis and malignant progression in many forms of cancer [44, 45]. Knockdown of HOTAIR results in the induction of cell cycle arrest and apoptosis [46]. Based on chromatin patterns, we observed that HOTAIR was associated with DNA repair and the regulation of apoptosis. Another example is the lncRNA, MEG3, which is highly expressed in non-neoplastic tissues, but lowly expressed in cancer tissues. Ectopic expression of MEG3 inhibits the proliferation of cervical carcinoma cells through the induction of cell cycle arrest and apoptosis [47]. We found that, based on H3K4me3 and H3K27ac patterns, MEG3 is involved in the ‘negative regulation of cell cycle’ and ‘negative regulation of apoptotic process’. These results identify an important role of MEG3 in the molecular etiology of cancer and implicate it as a potential target for cancer therapy.
LncRNA Ontology: a database of lncRNA functions
Based on our data, we have developed a free, web accessible database, LncRNA Ontology (http://www.bio-bigdata.com/lncrnaontology/), which makes the functions, chromatin, and expression patterns viewable to users across cell types. In addition, we also annotated the lncRNA-GO pairs predicted based on chromatin interaction, lncRNA-gene interaction, and lncRNA over-expression or knockdown data, as well as those lncRNA-GO pairs reported in the literature. LncRNA Ontology can support rapid searches by individual lncRNA or by a specific GO term, and allows for data downloads. It currently provides the functions predicted for each lncRNA in our study: 5,404,928 lncRNA-GO associations among 17,998 lncRNAs and 1,256 GO terms.
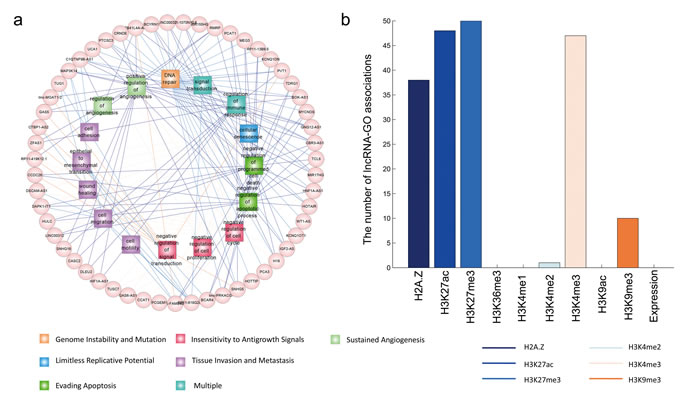
Figure 5: The predicted functions of cancer-associated lncRNAs. a., the lncRNA-GO functional associations are shown as a network. Only GO terms associated with cancer hallmarks are shown, and the GO terms with the same hallmarks are shown in the same color. The color of edges indicatethe type of histone modification used to predict the functional associations. b., The number of lncRNA-GO term associations predicted by different chromatin and expression features.
Discussion
Although mammalian cells produce many thousands of lncRNAs, the functional significance of these transcripts has been controversial. Co-expression networks of genes and lncRNAs, in which a node represents a gene or lncRNA and an edge represents an expressional correlation, have been used to identify cellular modules and predict the functions of unknown lncRNAs [48-50]. In addition, genome-wide chromatin-state maps provide another rich information source about cellular state, yielding insights beyond what is typically obtained by transcriptome profiling. Genes with similar expression patterns could share a common chromatin pattern or may be represented by multiple different chromatin patterns [23]. However, chromatin information had been ignored when predicting the functions of lncRNAs.
In this study, we showed that chromatin modifications and gene expression are strongly correlated with gene function. Although most of genes within a GO term show both highly similar chromatin marks and expression patterns, some GO terms only show chromatin modification similarity. Previous studies have proposed that some histone modifications are the memory of past transcriptional events resulting from previous active transcription [51, 52]. Other studies have shown that chromatin modification changes precede changes in gene expression [53]. For instance, a recent study in human T cells demonstrated that, for both protein-coding and non-coding RNAs, activating histone marks were already in place before the induction of expression, and these marks were maintained even after the genes were silenced [54]. Thus, these epigenetic signals may be helpful in the functional annotation of genes or lncRNAs, beyond the functions predicted based on expression patterns. Using both gene expression and chromatin data, we developed a novel integrated model to predict the functions of lncRNAs. We reasoned that lncRNAs that shared specific chromatin patterns as those coding genes with functional annotations were likely to be involved in comparable biological processes. We used ENCODE data to reveal that chromatin patterns can predict sets of functionally related genes, which implies that functionally related genes have specific modes of epigenetic regulation. Moreover, we showed that, in terms of function, information from different histone modifications is considerably more effective at predicting function than gene expression, and that integration of chromatin features and expression patterns can predict the functions of protein coding genes with high accuracy.
Although our strategy was successful at predicting functional annotations of lncRNAs, our method can be improved in several ways. First, in this study, we made our best effort to collect a number of samples with histone modifications. Although we have demonstrated that the accuracy of our model is robust regardless of the number of samples, as the data become more comprehensive, extended range of potential functions will be reliably ascribed to a given lncRNA. Secondly, while we used GO function categories to annotate the lncRNAs in the study [55], the relationships among GO terms may lead to correlated functional annotations for lncRNAs. Alternatively, the function classification for lncRNAs may be not be feasible based on current knowledge. Other functional labels, such as pathway information could be characterized for lncRNAs in the future.
Taken together, integrating the chromatin and expression patterns, we generated biologically meaningful functional annotations for lncRNAs genome-wide. Our model illustrates the power in functional prediction of lncRNAs, and this study opens up new avenues to study and functionally characterize lncRNAs. We anticipate that in the future, the integration of computational function prediction and more knockout or over-expression experiments will offer even deeper insight into the lncRNA functions.
Materials and methods
Genomic annotation of lncRNAs and protein-coding genes
The genomic annotations of lncRNAs were compiled from Gencode [11], Ensembl and the study of Cabili et al. [17]. If the lncRNAs from Cabili et al. had > 80% overlap with those from Gencode or Ensembl, we retained the lncRNA annotation from Gencode or Ensembl. The annotation of protein coding genes was retrieved from the UCSC Genome Browser (Refseq table) for the hg19 build of the human genome [56]. In total, the annotation information of 18,405 lncRNAs and 44,331 gene transcripts were obtained.
Chromatin profiles of lncRNAs and mRNAs
We compiled the genomic distributions of nine histone modifications from the ENCODE project, including H2A.Z, H3K4me1/2/3, H3K9me3, H3K27me3, H3K27ac, H3K36me3 and H3K9ac in 13 human cell lines (Figure 1a and Table S1). To aviod the bias of datasets provided by different organizations, all ChIP-seq data used were generated at the Broad Institute. We directly downloaded the mapped files in bam format. Sequence reads from each experiment were aligned to the human reference genome (GRCh37/hg19) and count coverage within a 4kb region centered at the TSS of each lncRNA/gene transcript was calculated using BEDTools multicov, a BAM focused tool [57]. The raw read counts were divided by the total number of million mapped reads in each sample (Reads Per Million, RPM) [26]. The chromatin level of each lncRNA or gene was defined as the highest value observed across all transcripts of a gene. The lncRNAs or genes that had at least one chromatin mark in one cell type were subsequently analyzed, and the epigenetic intensity of each lncRNA/gene was log2 transformed and Z-score normalized. As a result, 16,112 lncRNAs and 22,524 genes in average were analyzed for chromatin patterns.
Transcriptional profiles of lncRNAs and mRNAs
Gene expression of 9 human cell lines were measured by RNA-seq technology, which were also downloaded from the ENCODE project (Table S1). The raw reads were downloaded and aligned to the hg19 version of the human genome using TopHat2 with default options [58]. Cufflinks was used to generate the gene-level read counts and estimate the fragments per kilobase of exon model per million mapped reads (FPKM) [59]. Only lncRNAs/genes expressed in all cell types were considered for subsequent analysis. Expression data was log2-transformed and Z-score normalized. In total, 4,453 lncRNAs and 20,746 genes with expression were analyzed in this study.
The functional annotation of protein coding genes
The gene2go table was downloaded from the National Center for Biotechnology Information, and we extracted human related information including three different ontologies-biological process (BP), molecular function (MF) and cellular component (CC). Considering the hierarchical nature of GO categories, we considered all the descendant nodes one level below when computing the size of a node. The topology of the ontology was downloaded from GO website. GO terms were considered only if the number of annotated genes was less than 2000 but more than 20. We retained 2,385, 339 and 436 terms for BP terms, CC terms and MF terms, respectively.
Epigenetic and transcriptional similarities of genes within the same function terms
To compute the epigenetic and transcriptional similarity among genes of each GO term, their corresponding epigenetic profiles or expression profiles were extracted, and then we calculated the Pearson correlation coefficients for every gene pair. We took the average value of all the coefficients to represent the similarity of each GO term. In order to measure the significance of the similarity, we randomly selected the same number of genes and recalculated the similarity of the GO term. The procedure was repeated 100 times. The significance was defined as the proportion of times in which in random conditions, the similarity values were higher than the real ones.
Classifier construction based on the chromatin states and expression patterns
Gold standard
For each GO term, gold standard positives (GSP) were defiend as genes annotated in the GO term or all the descendant terms. However, it was difficult to obtain the gold-standard negatives (GSN). Here, the GSN was with the same gene number as the GSP, which was randomly selected from the remaining gene sets. Both GSPs and GSNs should exist in the chromatin and expression profiles. We constructed 100 GSNs for each GO term.
Classification algorithm and assessment
The nearest shrunken centroid algorithm was used to construct a classifier to distinguish genes with the same functions from randomly selected gene sets, incorporating the expression profile and the 9 chromatin profiles (Figure 1b). For each GO term, a classifer was constructed based on each feature profile. The performance of each classifier was evaluated through five-fold cross-validation. We split the GSPs and GSNs at random into five approximately equal-size parts, where four folds were used to create two centroids (‘positive’ and ‘negative’) using the mean profile (chromatin or expression) of the mRNAs. And then for each gene i in the training set, the distance difference Δd to the two centroids were calculated as follow:
![]()
where ![]() is the chromatin or expression profile of gene i in n samples,
is the chromatin or expression profile of gene i in n samples, ![]() and
and ![]() are the two centroids of the GSP and GSN, and n is the size of the feature profiles. Then, if the Δd of gene i is higher than the given cutoff, we proposed that the gene was predicted to annotate to this functions, otherwise the gene was not predicted to be involved in the function. This procedure was repeated five times. The quality of the classifier was evaluated by plotting the ROC curve at various cutoffs of Δd. The ultimate performance for each function term was evaluated by the average AUC because of 100 constructed GSNs.
are the two centroids of the GSP and GSN, and n is the size of the feature profiles. Then, if the Δd of gene i is higher than the given cutoff, we proposed that the gene was predicted to annotate to this functions, otherwise the gene was not predicted to be involved in the function. This procedure was repeated five times. The quality of the classifier was evaluated by plotting the ROC curve at various cutoffs of Δd. The ultimate performance for each function term was evaluated by the average AUC because of 100 constructed GSNs.
Prediction the functions regulated by lncRNAs
As shown in Figure 1c, for each GO term, the related lncRNAs were identifed based on the classifier with the maximum AUC, which was reconstructed based on the whole GSP and GSN datasets to incorporate more information. Then the distance difference Δd from the feature vector of lncRNA to the two centroids was calculated as described above. The cutoff of Δd was determined by the Youden’s J statistic [60]. Finally, if Δd was higher than the cutoff, we proposed that the lncRNA was associated with this function, otherwise the lncRNA did not regulate the function. Corresponding to the 100 randomly selected GSNs, the classifier was carried out 100 times. Finally, the times of positive predictions were defined as the confidence score. The higher the score was, the more likely the lncRNA can regulate this function.
Epigenetic similarity of mRNAs and lncRNAs across TSS
The genomic regions around the TSS (-2kb to 2kb) were divided into bins with 20bp, and then we counted the number of reads in each bin. For the calculation of densities over a defined window, the methods were derived from the one generally used to generate density files. And then the average read density of all genes and lncRNAs were computed for each bin. All these processes were performed by the software seqMINER [61]. And then we computed the correlation coefficient of the gene and lncRNA using the averge read density across 200 bins.
Compared with other methods
We compared the predicted model in our study with two other commonly used methods: (1) based on the genes interacting with lncRNAs; (2) based on the genes differentially expressed after knockdown or overexpress of lncRNAs. The lncRNA-interacting genes were obtained from starBase and 4DGenome, and the differentially expressed genes were downloaded from LncRNA2Target. Then the functions of lncRNAs were predicted by the interacting genes or differentially expressed genes. A hypergeometric test was used to evaluate the function consistence of lncRNAs.
The web development of the LncRNA Ontology
The LncRNA Ontology web interface (abbreviated to LO, http://www.bio-bigdata.com/lncrnaontology/) was developed in Java Servlet framework and deployed in tomcat 6.0.33 web server and runs under Cent OS 5.5 system. It is supported by a MySQL database of histone modification and expression data. LncRNA ontology is fully tested in Google Chrome (version 17 and later).
Funding
This work was supported by the National High Technology Research and Development Program of China [863 Program, Grant No. 2014AA021102], the National Program on Key Basic Research Project [973 Program, Grant No. 2014CB910504], the National Natural Science Foundation of China [Grant Nos. 91439117, 61473106, 61203264, 31571331 and 61502126], the China Postdoctoral Science Foundation [Grant Nos. 2014T70364, 2015M571436 and LBH-Z14134], Natural Science Foundation of Heilongjiang Province [Grant No. QC2015020], WeihanYu Youth Science Fund Project of Harbin Medical University.
Conflicts of Interest
No potential conflicts of interest were disclosed.
References
1. Rinn JL and Chang HY. Genome regulation by long noncoding RNAs. Annual review of biochemistry. 2012; 81:145-166.
2. Sultmann H and Diederichs S. Long noncoding RNA: “LNCs” to cancer. European urology. 2014; 65:1152-1153.
3. Papait R, Kunderfranco P, Stirparo GG, Latronico MV and Condorelli G. Long noncoding RNA: a new player of heart failure? Journal of cardiovascular translational research. 2013; 6:876-883.
4. Shi X, Sun M, Liu H, Yao Y and Song Y. Long non-coding RNAs: a new frontier in the study of human diseases. Cancer letters. 2013; 339:159-166.
5. Gutschner T and Diederichs S. The hallmarks of cancer: a long non-coding RNA point of view. RNA biology. 2012; 9:703-719.
6. Matouk IJ, DeGroot N, Mezan S, Ayesh S, Abu-lail R, Hochberg A and Galun E. The H19 non-coding RNA is essential for human tumor growth. PLoS One. 2007; 2:e845.
7. Li H, Yu B, Li J, Su L, Yan M, Zhu Z and Liu B. Overexpression of lncRNA H19 enhances carcinogenesis and metastasis of gastric cancer. Oncotarget. 2014; 5:2318-2329. PMID: 24810858.
8. Chen B, Yu M, Chang Q, Lu Y, Thakur C, Ma D, Yi Z and Chen F. Mdig de-represses H19 large intergenic non-coding RNA (lincRNA) by down-regulating H3K9me3 and heterochromatin. Oncotarget. 2013; 4:1427-1437. PMID: 23965803.
9. Dimond A and Fraser P. Molecular biology. Long noncoding RNAs Xist in three dimensions. Science. 2013; 341:720-721.
10. He S, Liu S and Zhu H. The sequence, structure and evolutionary features of HOTAIR in mammals. BMC evolutionary biology. 2011; 11:102.
11. Derrien T, Johnson R, Bussotti G, Tanzer A, Djebali S, Tilgner H, Guernec G, Martin D, Merkel A, Knowles DG, Lagarde J, Veeravalli L, Ruan X, Ruan Y, Lassmann T, Carninci P, et al. The GENCODE v7 catalog of human long noncoding RNAs: analysis of their gene structure, evolution, and expression. Genome research. 2012; 22:1775-1789.
12. Iyer MK, Niknafs YS, Malik R, Singhal U, Sahu A, Hosono Y, Barrette TR, Prensner JR, Evans JR, Zhao S, Poliakov A, Cao X, Dhanasekaran SM, Wu YM, Robinson DR, Beer DG, et al. The landscape of long noncoding RNAs in the human transcriptome. Nature genetics. 2015; 47:199-208.
13. Chu C, Qu K, Zhong FL, Artandi SE and Chang HY. Genomic maps of long noncoding RNA occupancy reveal principles of RNA-chromatin interactions. Mol Cell. 2011; 44:667-678.
14. Li JH, Liu S, Zhou H, Qu LH and Yang JH. starBase v2.0: decoding miRNA-ceRNA, miRNA-ncRNA and protein-RNA interaction networks from large-scale CLIP-Seq data. Nucleic acids research. 2014; 42:D92-97.
15. Li J, Ma W, Zeng P, Wang J, Geng B, Yang J and Cui Q. LncTar: a tool for predicting the RNA targets of long noncoding RNAs. Briefings in bioinformatics. 2014.
16. Jiang Q, Wang J, Wu X, Ma R, Zhang T, Jin S, Han Z, Tan R, Peng J, Liu G, Li Y and Wang Y. LncRNA2Target: a database for differentially expressed genes after lncRNA knockdown or overexpression. Nucleic acids research. 2015; 43:D193-196.
17. Cabili MN, Trapnell C, Goff L, Koziol M, Tazon-Vega B, Regev A and Rinn JL. Integrative annotation of human large intergenic noncoding RNAs reveals global properties and specific subclasses. Genes & development. 2011; 25:1915-1927.
18. Liao Q, Liu C, Yuan X, Kang S, Miao R, Xiao H, Zhao G, Luo H, Bu D, Zhao H, Skogerbo G, Wu Z and Zhao Y. Large-scale prediction of long non-coding RNA functions in a coding-non-coding gene co-expression network. Nucleic acids research. 2011; 39:3864-3878.
19. Guo X, Gao L, Liao Q, Xiao H, Ma X, Yang X, Luo H, Zhao G, Bu D, Jiao F, Shao Q, Chen R and Zhao Y. Long non-coding RNAs function annotation: a global prediction method based on bi-colored networks. Nucleic acids research. 2013; 41:e35.
20. Sati S, Ghosh S, Jain V, Scaria V and Sengupta S. Genome-wide analysis reveals distinct patterns of epigenetic features in long non-coding RNA loci. Nucleic acids research. 2012; 40:10018-10031.
21. Zhi H, Ning S, Li X, Li Y, Wu W and Li X. A novel reannotation strategy for dissecting DNA methylation patterns of human long intergenic non-coding RNAs in cancers. Nucleic acids research. 2014; 42:8258-8270.
22. Li Y, Zhang Y, Li S, Lu J, Chen J, Wang Y, Li Y, Xu J and Li X. Genome-wide DNA methylome analysis reveals epigenetically dysregulated non-coding RNAs in human breast cancer. Sci Rep. 2015; 5:8790.
23. Cheng C, Yan KK, Yip KY, Rozowsky J, Alexander R, Shou C and Gerstein M. A statistical framework for modeling gene expression using chromatin features and application to modENCODE datasets. Genome biology. 2011; 12:R15.
24. Dong X, Greven MC, Kundaje A, Djebali S, Brown JB, Cheng C, Gingeras TR, Gerstein M, Guigo R, Birney E and Weng Z. Modeling gene expression using chromatin features in various cellular contexts. Genome biology. 2012; 13:R53.
25. Jenuwein T and Allis CD. Translating the histone code. Science. 2001; 293:1074-1080.
26. Wamstad JA, Alexander JM, Truty RM, Shrikumar A, Li F, Eilertson KE, Ding H, Wylie JN, Pico AR, Capra JA, Erwin G, Kattman SJ, Keller GM, Srivastava D, Levine SS, Pollard KS, et al. Dynamic and coordinated epigenetic regulation of developmental transitions in the cardiac lineage. Cell. 2012; 151:206-220.
27. Chen CY, Morris Q and Mitchell JA. Enhancer identification in mouse embryonic stem cells using integrative modeling of chromatin and genomic features. BMC genomics. 2012; 13:152.
28. Ernst J and Kellis M. Discovery and characterization of chromatin states for systematic annotation of the human genome. Nature biotechnology. 2010; 28:817-825.
29. Ernst J, Kheradpour P, Mikkelsen TS, Shoresh N, Ward LD, Epstein CB, Zhang X, Wang L, Issner R, Coyne M, Ku M, Durham T, Kellis M and Bernstein BE. Mapping and analysis of chromatin state dynamics in nine human cell types. Nature. 2011; 473:43-49.
30. Guttman M, Garber M, Levin JZ, Donaghey J, Robinson J, Adiconis X, Fan L, Koziol MJ, Gnirke A, Nusbaum C, Rinn JL, Lander ES and Regev A. Ab initio reconstruction of cell type-specific transcriptomes in mouse reveals the conserved multi-exonic structure of lincRNAs. Nature biotechnology. 2010; 28:503-510.
31. Khalil AM, Guttman M, Huarte M, Garber M, Raj A, Rivea Morales D, Thomas K, Presser A, Bernstein BE, van Oudenaarden A, Regev A, Lander ES and Rinn JL. Many human large intergenic noncoding RNAs associate with chromatin-modifying complexes and affect gene expression. Proceedings of the National Academy of Sciences of the United States of America. 2009; 106:11667-11672.
32. Lv J, Liu H, Huang Z, Su J, He H, Xiu Y, Zhang Y and Wu Q. Long non-coding RNA identification over mouse brain development by integrative modeling of chromatin and genomic features. Nucleic acids research. 2013; 41:10044-10061.
33. Ounzain S, Micheletti R, Beckmann T, Schroen B, Alexanian M, Pezzuto I, Crippa S, Nemir M, Sarre A, Johnson R, Dauvillier J, Burdet F, Ibberson M, Guigo R, Xenarios I, Heymans S, et al. Genome-wide profiling of the cardiac transcriptome after myocardial infarction identifies novel heart-specific long non-coding RNAs. European heart journal. 2015; 36:353-368a.
34. van Noort V, Snel B and Huynen MA. Predicting gene function by conserved co-expression. Trends in genetics : TIG. 2003; 19:238-242.
35. Radivojac P, Clark WT, Oron TR, Schnoes AM, Wittkop T, Sokolov A, Graim K, Funk C, Verspoor K, Ben-Hur A, Pandey G, Yunes JM, Talwalkar AS, Repo S, Souza ML, Piovesan D, et al. A large-scale evaluation of computational protein function prediction. Nature methods. 2013; 10:221-227.
36. Teng L, He B, Wang J and Tan K. 4DGenome: a comprehensive database of chromatin interactions. Bioinformatics. 2015.
37. Quek XC, Thomson DW, Maag JL, Bartonicek N, Signal B, Clark MB, Gloss BS and Dinger ME. lncRNAdb v2.0: expanding the reference database for functional long noncoding RNAs. Nucleic acids research. 2015; 43:D168-173.
38. Wang F, Ren S, Chen R, Lu J, Shi X, Zhu Y, Zhang W, Jing T, Zhang C, Shen J, Xu C, Wang H, Wang H, Wang Y, Liu B, Li Y, et al. Development and prospective multicenter evaluation of the long noncoding RNA MALAT-1 as a diagnostic urinary biomarker for prostate cancer. Oncotarget. 2014; 5:11091-11102. PMID: 25526029.
39. Di Gesualdo F, Capaccioli S and Lulli M. A pathophysiological view of the long non-coding RNA world. Oncotarget. 2014; 5:10976-10996. PMID: 25428918.
40. Hanahan D and Weinberg RA. Hallmarks of cancer: the next generation. Cell. 2011; 144:646-674.
41. Hainaut P and Plymoth A. Targeting the hallmarks of cancer: towards a rational approach to next-generation cancer therapy. Current opinion in oncology. 2013; 25:50-51.
42. Plaisier CL, Pan M and Baliga NS. A miRNA-regulatory network explains how dysregulated miRNAs perturb oncogenic processes across diverse cancers. Genome research. 2012; 22:2302-2314.
43. Chen G, Wang Z, Wang D, Qiu C, Liu M, Chen X, Zhang Q, Yan G and Cui Q. LncRNADisease: a database for long-non-coding RNA-associated diseases. Nucleic acids research. 2013; 41:D983-986.
44. Wu ZH, Wang XL, Tang HM, Jiang T, Chen J, Lu S, Qiu GQ, Peng ZH and Yan DW. Long non-coding RNA HOTAIR is a powerful predictor of metastasis and poor prognosis and is associated with epithelial-mesenchymal transition in colon cancer. Oncology reports. 2014; 32:395-402.
45. Zhang K, Sun X, Zhou X, Han L, Chen L, Shi Z, Zhang A, Ye M, Wang Q, Liu C, Wei J, Ren Y, Yang J, Zhang J, Pu P, Li M, et al. Long non-coding RNA HOTAIR promotes glioblastoma cell cycle progression in an EZH2 dependent manner. Oncotarget. 2015; 6:537-546. PMID: 25428914.
46. Qiu JJ, Wang Y, Ding JX, Jin HY, Yang G and Hua KQ. The long non-coding RNA HOTAIR promotes the proliferation of serous ovarian cancer cells through the regulation of cell cycle arrest and apoptosis. Experimental cell research. 2015; 333:238-248.
47. Qin R, Chen Z, Ding Y, Hao J, Hu J and Guo F. Long non-coding RNA MEG3 inhibits the proliferation of cervical carcinoma cells through the induction of cell cycle arrest and apoptosis. Neoplasma. 2013; 60:486-492.
48. Luo F, Yang Y, Zhong J, Gao H, Khan L, Thompson DK and Zhou J. Constructing gene co-expression networks and predicting functions of unknown genes by random matrix theory. BMC bioinformatics. 2007; 8:299.
49. Sharan R, Ulitsky I and Shamir R. Network-based prediction of protein function. Molecular systems biology. 2007; 3:88.
50. Wren JD. A global meta-analysis of microarray expression data to predict unknown gene functions and estimate the literature-data divide. Bioinformatics. 2009; 25:1694-1701.
51. Fischer JJ, Toedling J, Krueger T, Schueler M, Huber W and Sperling S. Combinatorial effects of four histone modifications in transcription and differentiation. Genomics. 2008; 91:41-51.
52. Ng HH, Robert F, Young RA and Struhl K. Targeted recruitment of Set1 histone methylase by elongating Pol II provides a localized mark and memory of recent transcriptional activity. Mol Cell. 2003; 11:709-719.
53. Chambeyron S and Bickmore WA. Chromatin decondensation and nuclear reorganization of the HoxB locus upon induction of transcription. Genes & development. 2004; 18:1119-1130.
54. Barski A, Jothi R, Cuddapah S, Cui K, Roh TY, Schones DE and Zhao K. Chromatin poises miRNA- and protein-coding genes for expression. Genome research. 2009; 19:1742-1751.
55. Ashburner M, Ball CA, Blake JA, Botstein D, Butler H, Cherry JM, Davis AP, Dolinski K, Dwight SS, Eppig JT, Harris MA, Hill DP, Issel-Tarver L, Kasarskis A, Lewis S, Matese JC, et al. Gene ontology: tool for the unification of biology. The Gene Ontology Consortium. Nature genetics. 2000; 25:25-29.
56. Rosenbloom KR, Armstrong J, Barber GP, Casper J, Clawson H, Diekhans M, Dreszer TR, Fujita PA, Guruvadoo L, Haeussler M, Harte RA, Heitner S, Hickey G, Hinrichs AS, Hubley R, Karolchik D, et al. The UCSC Genome Browser database: 2015 update. Nucleic acids research. 2015; 43(Database issue):D670-681.
57. Quinlan AR. BEDTools: The Swiss-Army Tool for Genome Feature Analysis. Current protocols in bioinformatics / editoral board, Andreas D Baxevanis [et al]. 2014; 47:11 12 11-11 12 34.
58. Kim D, Pertea G, Trapnell C, Pimentel H, Kelley R and Salzberg SL. TopHat2: accurate alignment of transcriptomes in the presence of insertions, deletions and gene fusions. Genome biology. 2013; 14:R36.
59. Pollier J, Rombauts S and Goossens A. Analysis of RNA-Seq data with TopHat and Cufflinks for genome-wide expression analysis of jasmonate-treated plants and plant cultures. Methods in molecular biology. 2013; 1011:305-315.
60. Liu C, Mallick B, Long D, Rennie WA, Wolenc A, Carmack CS and Ding Y. CLIP-based prediction of mammalian microRNA binding sites. Nucleic acids research. 2013; 41:e138.
61. Ye T, Krebs AR, Choukrallah MA, Keime C, Plewniak F, Davidson I and Tora L. seqMINER: an integrated ChIP-seq data interpretation platform. Nucleic acids research. 2011; 39:e35.