
INTRODUCTION
Modern chemotherapeutic regimens use ten or more different drugs over a 2–3 year period to treat childhood ALL. Though recurrences are now fewer, relapsed ALL remains the fifth most common malignancy in children [1]. The complex chemotherapy schedules and the underlying genetic heterogeneity of the disease have made it difficult to understand the biological mechanisms for the variations in response to therapy, and relapses occurs in all cytogenetic subtypes. Within all genetic subtypes of ALL, the most sensitive predictive factor of outcome is the level of minimal residual disease (MRD) in bone marrow aspirates at the end of the first month of therapy. Patients with high MRD levels have an increased risk of relapse [2]. This suggests that MRD represents drug resistant subclones selected by specific chemotherapy schedules; MRD cells survive and proliferate over time giving rise to recurrence. We recently reported the superiority of mitoxantrone over idarubicin, in the context of a randomised clinical trial in patients with relapsed ALL [3]. Both drugs were administered on the first two days of therapy but MRD levels after 4 weeks treatment were comparable in both arms, indicating that intrinsic drug resistance to idarubicin was not causal to outcome. However, patients treated with mitoxantrone experienced a higher degree of myelosupression for up to 12 months after administration, suggesting that therapeutic benefit was related to an increased toxicity to the bone marrow, indicating the role of environment mediated drug resistance (EMDR) in tumor treatment failure [4, 5].
The abnormal tumor microenvironment induces a collection of cellular stress responses and plays a major roles in determining the metabolic status and chemosensitivity in cancer cells [6]. BMSC protect cancer cells from chemotherapy by activating pro-survival signal pathways such as PI-3K/AKT [7–9]; or releasing chemoprotective factors such as asparagine [10], fatty acids [11] or cysteine [12]. Whether BMSC mediated chemoprotection facilitates the emergence of drug resistant subpopulations leading to the development of MRD; and if such cells are able to persist over the long duration of ALL therapy remains unknown. The diverse mechanisms identified for BMSC mediated drug resistance also suggest that targeting specific signalling molecules may not be sufficient to overcome BMSC mediated multidrug resistance, and common downstream survival mechanisms need to be identified.
Oncogenic signalling pathways converge to adaptive cancer cell metabolisms in order to support survival. Targeting these unique biochemical alterations in cancer cells as a potential therapeutic approach is yet to be fully exploited [6, 13]. Cancer cells have altered redox status [6, 13–15] and the modifications in the levels of ROS have been linked to radioresistance of cancer stem cells [15]. In this study we show that BMSC mediated multidrug resistance may occur through redox adaptation in ALL cells. By targeting antioxidant and anti-apoptotic capacity in leukemic cells, we identify a potential strategy to overcome therapeutic failure in ALL.
RESULTS
Soluble factors produced by BMSC induce a multidrug resistant phenotype in ALL cells
Co-culture of ALL cells with BMSC promote survival, growth [16], and modulate the in vitro response to chemotherapy [17]. Such 2-D co-culture systems are being used to test efficacy of new drugs [18] and providing insights into the mechanisms of EMDR [19]. BMSC however exist in a complex 3-D milieu along with various types of extracellular matrix (ECM) [20, 21], and 3-D in vitro BMSC culture systems created on artificial or natural scaffolds have provided differential insights in the mechanisms of hematopoiesis and oncogenesis [22, 23]. We selected a BMSC-ECM culture model, by growing BMSC on a biological and physiologically relevant ECM scaffold [24] (Supplementary Figure S1A). Briefly, BMSC were cultured on the plate till confluent, treated with Triton X-100 and NH4OH, washed with PBS to remove cellular components, only ECM remained on the plate. The ECM scaffold was produced by BMSC, contained fibronectin and collagen I (Figure 1A), and facilitated BMSC differentiation into osteoblast-like cells (Figure 1B, 1C). The BMSC-ECM culture model contained key bone marrow components including ECM, BMSC, osteoblast-like cells, and factors released by BMSC and osteoblast-like cells.
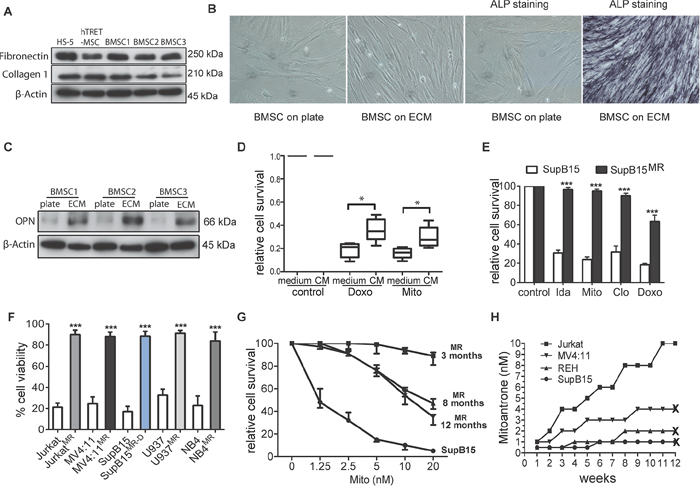
Figure 1: Generation of multidrug resistant subpopulations from ALL cell lines in a BMSC-ECM culture model. A. BMSC-ECM scaffolds were generated from HS5, hTRET-BMSC, and primary BMSC from ALL patients (as BMSC1, 2, and 3); Immunoblots show the protein extracts from the ECM express fibronectin and collagen 1. β-Actin as loading control. B. Primary BMSC cultured on the BMSC-ECM scaffold showed filamentous spindle shaped morphology and alkaline phosphatase (ALP) positive staining (after 14 days culture). BMSC cells cultured in plate were set as control. Microscopy was performed with a Nikon TS100 Inverted Microscope at x20 magnification. C. When cultured on BMSC-ECM scaffold (ECM), primary BMSC have increased expression of osteopontin (OPN) compared to cells cultured on plate (BMSC-plate). β-Actin as loading control. D. BMSC derived CM protected primary ALL blasts from chemotherapy. Primary ALL blasts from 4 ALL patients were cultured in normal medium or CM, treated with doxorubicin (Doxo, 50 nM) or mitoxantrone (Mito 10 nM) for 3 days, cell survival were assessed by MTS assay. E. SupB15 and SupB15MR cells were treated with idarubicin (Ida, 100 nM), Mito (10 nM), clofarabine (Clo, 300 nM), Doxo (50 nM) for 3 days. Cell survival was assessed by MTS assay. F. JurkatMR, MV4:11MR, SupB15MR-D, U937MR, NB4MR and their drug sensitive parent cells were treated with Mito (10 nM) for 3 days. Cell viability was assessed by trypan blue exclusion assay. G. Cell viability of SupB15 or SupB15MR cells after treatment with increasing concentrations of Mito for 3 days. SupB15MR cells which had been continuously cultured in drug-free medium for 8 or 12 months showed decreased drug resistant capacity. H. Jurkat, MV4:11, REH and SupB15 cells were incubated in normal medium and treated with stepwise dose increases in Mito (starting at 0.5–1 nM concentrations). Drug dose was increased when cells were observed to grow satisfactorily at a given dose level. At 3 months, only Jurkat cells survived the 10 nM of Mito; the other cell lines did not survive beyond 3 months at the indicated Mito doses. ‘X’, cell death. Data are mean ± SEM of at least three independent experiments (E,F). Non-parametric Mann-Whitney test (D) and unpaired 2-tailed Student’s t test (E,F). *p < 0.05, ***p < 0.001.
In vitro BMSC mediated chemoprotection has been investigated by incubating cancer cells in BMSC derived conditioned medium (CM), or co-culturing cancer cells with BMSC, and then treating with drugs for 3 or 4 days [17, 19]. In the BMSC-ECM culture model, leukemia cells lines incubated in CM or long term co-cultured with BMSC (LTCC) showed a multi-drug resistant phenotype (Supplementary Figure S1B, S1C, S1D), a phenomenon also demonstrated by primary ALL cells (Figure 1D).
To mimic the effect of chemotherapy within the bone marrow microenvironment, ALL cell lines SupB15, REH, MV4:11 and Jurkat; acute myeloid leukemia cell line U937 and acute promyelocytic leukemia cell line NB4 cells were incubated in human BMSC cell line HS-5 derived CM, treated with 10 nM of mitoxantrone (Mito) for 6 days and then maintained in drug-free medium for 3 months. Control cells were incubated in normal medium and treated identically. This dose of drug was wholly lethal to cell in normal medium, but a population of leukemia cells incubated in CM survived the treatment and gave rise to multidrug resistant (MR) subpopulation. Similar MR cells were generated from SupB15 cells treated with doxorubicin (SupB15MR-D) (Figure 1E, 1F). BMSC releases small molecular weight chemoprotective molecules such as fatty acids [11] or cysteine [12]. Our results showed that both the <3kDa and ≥3kDa fraction of the CM are chemoprotective. On heating or after proteinase K treatment, CM continued to preserve its chemoprotective effects (Supplementary Figure S1E). However, neither the <3kDa nor the ≥3kDa fractions could generate MR clones from ALL cells lines (Supplementary Figure S1F), suggesting that the MR phenotype occurred as a result of multiple soluble factors present in CM.
SupB15MR cells show partial restoration of chemosensitivity after 8 months of continuous culture in drug free medium (Figure 1G), indicated an epigenetic mechanism, previously described in drug resistant cell lines [25]. To further investigate the origin of the MR clones, SupB15, REH, MV4:11, or Jurkat cells were incubated in normal culture medium in the presence of 0.5 nM of MITO for 2 weeks and then with gradual increases in the Mito dose every 2–3 weeks. Cell viability was continuously monitored for 3 months. As shown in Figure 1H, drug resistant subclones were only generated from Jurkat cells. While SupB15, REH and MV4:11 cells survived treatment with 2 nM or 4 nM of Mito for a short time, they finally died out within 2–3 months. These results showed that BMSC protected ALL cells from chemotherapy in a cell type and drug-independent manner. This chemoprotection facilitated the emergence of reversible multidrug resistant subclones, which were more likely to be epigenetically derived [25].
BMSC induces adaptation in ALL cells characterized by decreased pAKT and ROS levels and upregulation of MCL-1
In this study, BMSC mediated short-term (CM protected leukemia cells from 3–4 days’ treatment) and long-term (CM help to generate drug resistant subclones) drug resistance. To investigate the mechanism underlying BMSC induced drug resistance, we first used SILAC-based phosphoproteomics to investigating the changing of signalling pathway activity in short-term (30 minutes and 2 hours) CM-exposed SupB15 cells (Supplementary Figure S2A). 1295 differentially phosphorylated peptides, attributable to 720 known proteins were identified after 2 hours’ exposure to CM (Supplementary Table S1). Ingenuity pathway analysis (www.qiagen.com/ingenuity) identified activation of PI3K/AKT, MAPK and ROS pathways in SupB15 cells among others (Figure 2A and Supplementary Figure S2B). Chemosensitivity could be restored on prior exposure to PI3K inhibitors (Supplementary Figure S2C), suggesting that an alteration in PI3K signalling was contributory to the short term drug resistant phenotype.
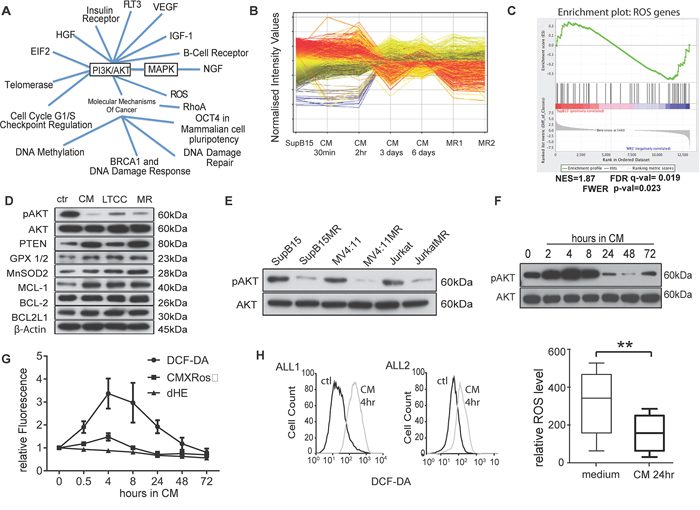
Figure 2: Multidrug resistant cells have lower intracellular ROS levels and AKT activity. A. Ingenuity pathway analysis of phosphoproteomic data show signal pathways activated in SupB15 cells after exposure to HS-5 derived CM for 2 hours. B. Gene expression profiles of SupB15, SupB15 incubated in CM for different times, and two SupB15MR clones (MR1 and MR2). Data were analysed by GeneSpring GX software (Agilent Technologies, Inc.). C. GSEA plot showing differential expression of ROS related genes in SupB15 and SupB15MR cells. GSEA plots of gene expression related to AKT, apoptosis, chromatin remodeling, DNA repair, and ATPase are shown in Supplementary Figure S2D. D. Compared with SupB15 cells incubated in normal medium (ctr), SupB15 cells cultured in CM for 3 days, SupB15LTCC and SupB15MR show increased expression of PTEN, Glutathione peroxidase (GPX 1/2), MnSOD2 and MCL-1; decreased expression of ser473-AKT phosphorylation (pAKT), and relative unchanged expression of BCL-2 and BCL2L1. E. MR cells have decreased pAKT compared to their drug sensitive parent cells. All cells were maintained in normal medium. F. Immunoblot showing temporal biphasic expression of pAKT in SupB15 cells incubated in CM. Following an initial increase (2–8 hours incubation), pAKT expression declines (24–48 hours incubation), then stabilizes to a lowered steady state at 72 hours. G. ROS level (DCF-DA), Superoxide level (Dihydroethidium, dHE), and Δψm (CMXRos) in SupB15 cells when incubated in CM for 0.5 to 72 hours, cells incubated in normal medium as time ‘0′. H. ROS levels increased in primary ALL blasts after incubated in medium containing 50% of CM (v/v) for 4 hours (n = 2, histogram); and decreased after 24 hours’ incubation (n = 6, box plot). Cells incubated in normal medium as control (ctl). Data are mean ± SEM of at least three independent experiments. Non-parametric Mann-Whitney test (H) **p < 0.01.
Comparative gene expression analysis were performed on normal cultured SupB15; SupB15MR; and SupB15 cells incubated in CM for different times (from 30 minutes to 6 days) (Figure 2B). Functional annotation and gene set enrichment analysis of the 6,357 genes differentially expressed between normal cultured SupB15 and the other treatment groups, revealed significant association with regulation of ROS, PI3K-AKT, MAPK, apoptosis and cell cycle checkpoint pathways (Figure 2C and Supplementary Figure S2D, S2E; Supplementary Tables S2 and S3). Based on this functional information, a heatmap with the representative gene set (2489 genes) confirmed the distinct contrast in gene expression signature between MR clones and their corresponding wild type control (Supplementary Figure S2F). Principal component analysis identified two distinct clusters with similarity between SupB15MR and SupB15 cells exposed to CM for 3 or 6 days (Supplementary Figure S2G). This suggested a temporal switch in drug resistant pathways between 3–6 days of exposure to CM. Verification of the identified pathways using Western blot showed that drug resistant cells, including MR cells, SupB15 cells incubated in CM for 3 days, and SupB15LTCC cells, had increased expression of antioxidants (MnSOD2, GPX1/2), anti-apoptotoic protein MCL-1, and decreased AKT ser473 phosphorylation when compared to cells grown in normal medium (Figure 2D). Low pAKT was also detected in JurkatMR and MV4:11MR cells (Figure 2E).
Time course experiments were performed to investigate the effects of CM on AKT activity in ALL cells. As shown in Figure 2F, AKT activity in SupB15 cells fluctuated according to incubation time. After exposure to CM, AKT ser-473 phosphorylation increased at 2–8 hours with a subsequent decline from 24 hours to a steady level at 72 hours. Intracellular ROS level in ALL cells showed similar fluctuations after exposure to CM. In SupB15 cells, ROS levels and mitochondrial membrane potential (Δψm) increased from 0.5 hours, peaked at 4 hours, and decreased to lower than basal levels at 72 hours (Figure 2G). In primary ALL blasts, ROS levels increased after 2 hours’ exposure to CM, but decreased after 24 hours (Figure 2H). MR cells too have lower intracellular ROS levels and Δψm when compared with their drug sensitive parent cells (Supplementary Figure S2H, S2I).
BMSC induced chemoresistance is distinct from its effect on cellular proliferation
Constitutive activation of the PI3K/AKT pathway promotes cancer cell proliferation [26–29]. The low AKT activity mediated by BMSC in ALL cells was associated with decreased cellular proliferation (Figure 3A) and cell cycle progression (Figure 3B), and increased p27 expression (Figure 3C) in vitro. Comparing with SupB15 cells, SupB15MR showed delayed engraftment kinetics in NOD-scid IL2Rgammanull (NSG) mice (Figure 3D). This is consistent with evidence that BMSC inhibit proliferation and function of immune cells [30, 31], as ALL cells are malignant counterparts of immature lymphocytes.
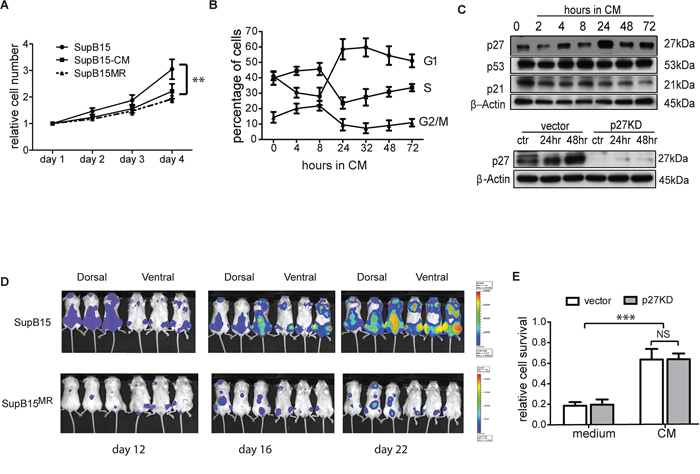
Figure 3: BMSC induced chemoresistance is distinct from its effect on cellular proliferation. A. SupB15 and SupB15MR cells were cultured in normal medium; or SupB15 cells were maintained in medium containing 50% of CM (v/v) for 4 days. Cell number were normalised to day 1. Cell proliferation was assessed with MTS assay. B. Cell cycle progression in SupB15 cells when cultured in CM. After 24 to 72 hours, cells showed a higher proportion of cells in G1 phase, lower proportion of cells in S and G2/M phase. C. After incubation in CM for 24 to 72 hours, SupB15 cells showed increased expression of p27, decreased expression of p21, the expression of p53 did not change (upper panel). CM failed to upregulate p27 expression in SupB15p27KD cells (lower panel) after 24 or 48 hours’ incubation. D. 1 × 10⁵ of SupB15LucGFP or SupB15MRLucGFP cells were injected into NSG mice (n = 6 each group) intravenously. Representative images of 3 mice from a cohort of 6 animals showing delayed engraftment kinetics of SupB15MR transplanted mice when comparing with SupB15 cells. Leukemia engraftment was measured with bioluminescence. E. SupB15 cells with p27 wild type (vector) or knockdown (p27KD) were incubated in normal medium or CM. CM equally protected SupB15vector and SupB15p27kd cells from Doxo (50 nM, 72 hours) treatment. Data are mean ± SEM of at least three independent experiments (A,B,E). unpaired 2-tailed Student’s t test (A, E). **p < 0.01, ***p < 0.001.
To assess the association between BMSC mediated growth suppression and chemoprotection, SupB15 cells were stably transduced with p27shRNA (SupB15p27kd) or vector control (SupB15vector), incubated in CM or normal medium and treated with doxorubicin for 3 days. Unlike that observed from SupB15vector cells, SupB15p27kd cells grew at a similar rate when cultured in CM or normal medium (Figure 3C, lower panel; and 3E). Nevertheless, CM was equally protective of SupB15p27kd or SupB15vector cells against doxorubicin (Supplementary Figure S3A). When incubated in CM, SupB15 cells have high AKT activity at 2 hours and low AKT phosphorylation after 24 hours (Figure 2F). The proportion of cells at G1 phase was increased significantly after 24 hours incubation (Figure 3B). 10 nM of Mito was added into culture at these two time points (2 hours and 24 hours after incubation in CM). After 3 days’ treatment, cell survivals in these two groups were similar (Supplementary Figure S3B). These results suggested that BMSC-ECM mediated chemoprotection is not regulated by alterations in cellular proliferation.
BMSC regulates intracellular ROS level and induce redox adaptation in ALL cells
Compared with cells in normal medium, medium containing 25% CM (v/v) also increased ROS levels (Figure 4A), suggesting that the increased ROS production in ALL cells was not due to the lack of nutrients in CM. ROS generating enzymes are activated by increased mitochondrial calcium (mCa2+) concentrations [32]. To examine whether BMSC regulation of ROS metabolism was related to mCa2+ influx, SupB15 cells were incubated in CM and mCa2+ concentrations were assessed by Rhod-2 staining followed with flow cytometry analysis. mCa2+ concentrations increased after 30 minutes, and gradually decreased from 2 hours returning to basal levels after 24 hours. Intracellular ROS levels paralleled the temporal changes in mCa2+ concentrations (Figure 4B). The fluctuations of mitochondrial calcium influx were unrelated to intercellular Ca2+ concentrations as they were similar in both CM (30.6 ± 2.42mg/L) and normal medium (30.8 ± 0.8mg/L). RU360, a selective inhibitor of mitochondrial calcium uptake, suppressed CM induced ROS generation (Figure 4C). As RU360 is unstable in the presence of oxygen, the calcium chelator BAPTA-AM was used to test the role of mCa2+ influx in CM induced drug resistance. CM failed to stimulate ROS generation (Figure 4D) or provide chemoprotection in BAPTA-AM pre-treated ALL cells (Figure 4E).
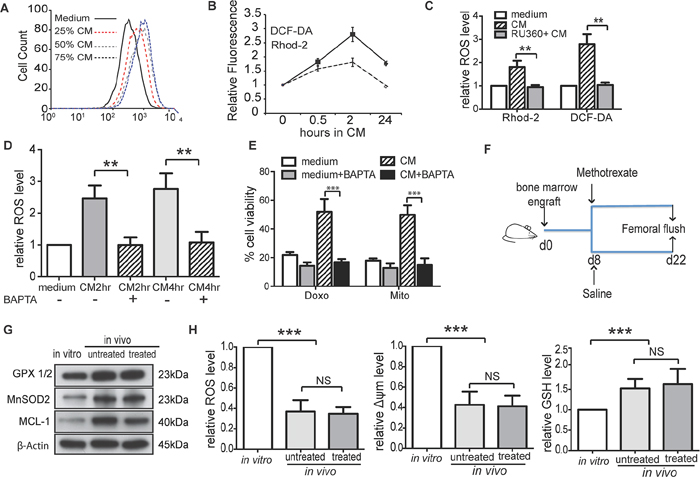
Figure 4: BMSC regulates intracellular ROS levels and induce redox adaptation in ALL cells. A. Medium containing different proportion of CM (25%, 50% or 75%, v/v) increased ROS production in REH cells after 4 hours’ incubation. B. Level of ROS (DCF-DA) and mitochondrial calcium (Rhod-2) in SupB15 cells after incubation in CM for indicated times. C. SupB15 cells were treated with RU360 (10 μM) for 1 hour, then incubated in CM for 2 hours. CM failed to increase ROS level. D. and E. Pre-treatment of SupB15 cells with BAPTA-AM (3 μM, 2 hours) inhibited (D) CM induced ROS generation and (E) CM mediated chemoprotection. F. and G. Intrafemorally engrafted SupB15LucGFP cells showed increased expression of GPX1/2, MnSOD2, and MCL-1 when compared to SupB15LucGFP cells cultured in vitro. H. Intrafemorally engrafted SupB15LucGFP cells had lower levels of ROS and Δψm; higher level of GSH when compared to in vitro cultured cells. n = 6 mice per group. Data are mean ± SEM of at least three independent experiments (C,D,E). Non-parametric Mann-Whitney test (H) and unpaired 2-tailed Student’s t test (C,D,E). **p < 0.01, ***p < 0.001.
We have shown that BMSC-CM dynamically regulated ROS levels in ALL cells and resulted in a low intracellular ROS status. The decreased ROS levels in ALL cells after incubation in CM was not the consequence of CM mediated growth inhibition, as SupB15p27kd cells have the same proliferation rate when cultured in normal or CM, but ROS levels decreased after incubation in CM for 72 h (Supplementary Figure S4). These findings suggested that the BMSC microenvironment induced a redox adaptation in ALL cells. To address this hypothesis, NSG mice were engrafted intrafemorally with 1 × 10⁵ of SupB15LucGFP cells and treated with methotrexate (5 mg/kg) or saline from day 8 (Figure 4F). Compared with in vitro cultured cells, SupB15LucGFP cells obtained from femoral flushes of both treated and untreated mice showed higher expression of GPX1/2, MnSOD2 and MCL-1 (Figure 4G), lower levels of ROS and Δψm, and higher levels of GSH (Figure 4H). Together, BMSC microenvironment induces an initial increase in intracellular ROS levels and Δψm via an influx of calcium ions into mitochondria. As excess ROS is harmful to cells, ALL cells adapt to this oxidative stress by increasing antioxidant production and lowering intracellular ROS levels. This redox-adapted phenotype is maintained by cells surviving post exposure to chemotherapy, as illustrated by MR cells.
Low ROS levels characterize subpopulations of primary ALL cells with relative resistance to chemotherapy
Both long term CM-exposed ALL cells and MR cells had low ROS levels. We proposed that ROSlow subpopulations of CM-exposed ALL cells were likely to be more resistant to chemotherapy than ROShigh subpopulations. To test this, SupB15 cells were incubated in CM for 6 days and sorted into ROSlow and ROShigh populations (<10% of whole population) using DCF-DA staining. ROSlow cells were relative resistant to chemotherapy with Mito or Doxo when compared to ROShigh cells on (Figure 5A). Next we examined the chemosensitivity of the subpopulations in primary ALL blasts with differential intracellular ROS levels. CD19+ primary ALL blast cells, obtained from diagnostic bone marrow aspirates could be characterized into 3 subpopulations based on ROS levels, low, medium and high. After exposure to CM for 24 hours, there was a moderate expansion in the ROSlow subpopulation (Figure 5B). We engrafted primary ALL cells intrafemorally in non-irradiated NSG mice. Femoral flushes were obtained on evidence of engraftment and purified CD19+ ALL blasts were sorted into ROSlow and ROShigh populations, treated with Mito or Doxo for 3 days. ROSlow cells were again shown to be comparatively more drug resistant than ROShigh cells (Figure 5C).
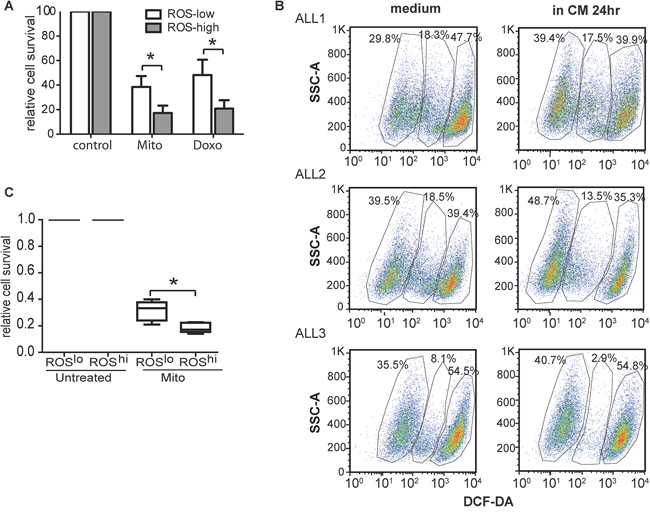
Figure 5: Low ROS levels characterized subpopulations of primary ALL cells with relative resistance to chemotherapy. A. Roslow SupB15 cells were relatively drug resistant than that of Roshigh cells after treated with Mito (10 nM) or Doxo (50 nM) for 72 hours. B. Flow cytometry dot plots (side scatter SSC vs DCF-DA staining) indicated presence of distinct ROShigh, ROSintermediate and ROSlow subpopulations in CD19 positive primary ALL cells (ALL1, ALL2, ALL3). The ROSlow subpopulation expanded on 24-hours incubation with CM. Lymphoprep™ density gradient centrifugation were used to exclude dead cells. After 24 hours’ incubation in normal medium or CM, cell viability were more than 90% (Trypan blue exclusive assay), and cells incubated in CM had better viability than cells incubated in normal medium. Dead cells were further excluded by SSC/FSC gating on Flowjo software. C. ROSlow populations of primagraft ALL blasts were more drug resistant than that of ROShigh cells (n = 5). CD19 positive primagraft cells were collected from mice bone marrow flushes, purified with magnetic purification, and dead cells were excluded by Lymphoprep™ density gradient centrifugation. Cells were sorted into ROSlow and ROShigh cells based on intracellular ROS level (DCF-DA staining). In the process of cell sorting, dead/dying cells were excluded by SSC/FSC gating and propidium iodid (PI) staining. Cells were then incubated in medium containing 50% CM (CM), and treated with Mito (15 nM) for 72 hours. Data are mean ± SEM of at least three independent experiments. unpaired 2-tailed Student’s t test (A) and Non-parametric Mann-Whitney test (C) *p < 0.05, ***p < 0.001.
Inhibiting antioxidants and antiapoptotic capacity overcomes BMSC mediated drug resistance
As shown earlier, the drug resistant phenotype was further characterized by upregulation of the antiapoptotic BCL2 family members BCL-2, BCL2L1 and MCL-1. Overexpression of MCL-1 has been previously associated with drug resistance in cancer [33–35]. MCL-1 was upregulated in LTCC, CM exposed ALL cells, MR cells (Figure 2D), and bone marrow engrafted primary ALL cells (Figure 4G). Transient MCL-1 knockdown by siRNA, or the MCL-1 inhibitor Obatoclax sensitized SupB15 and SupB15MR cells to H2O2 cytotoxicity (Figures 6A, 6B, and Supplementary Figure S5), suggesting that MCL-1 contributes to the redox adaptation process in ALL.
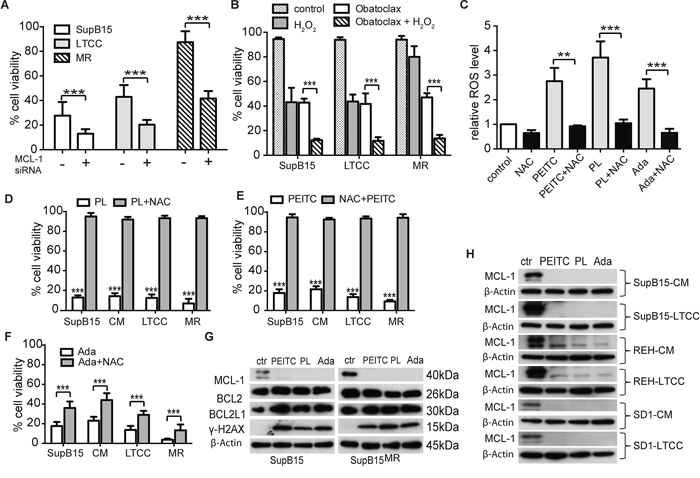
Figure 6: Inhibiting antioxidants and antiapoptotic capacity overcome BMSC mediated drug resistance. A. and B. Suppression of MCL-1 expression sensitizes SupB15 cells to H2O2 treatment. SupB15 cells were (A) transfected with MCL-1 siRNA (1 μM) for 72 hours; or (B) treated with Obatoclax (100 nM) for 24 hours. Cells were then treated with H2O2 (80 μM) for 24 hours. Cell viability was assessed by trypan blue exclusion assay. C. PEITC (5 μM), PL (10 μM), or Ada (5 μM) stimulated ROS production in SupB15MR cells after 1 hour treatment. Effects were reversed by NAC (3 mM, 2 hours) pretreatment. D, E. and F. PEITC (D), PL (E) and Ada (F) were toxic for SupB15 in normal medium (as control); SupB15 incubated in CM; SupB15LTCC; and SupB15MR cells. Note the differential effects of NAC (3 mM) pre-treatment on the toxicity of PEITC, PL and Ada. G. 2 hours of PEITC (5 μM), PL (10 μM), or Ada (5 μM) treatments inhibited MCL-1 expression, and induced γ-H2AX expression in SupB15 and SupB15MR cells. Cells were maintained in normal medium. H. MCL-1 expressions in cells were strongly inhibited after 2 hours of PEITC (5 μM), PL (10 μM), or Ada (5 μM) treatment: SupB15, REH and SD1 cells were incubated in CM for 3 days; and SupB15LTCC, REHLTCC, and SD1LTCC were cultured in normal medium. Data are mean ± SEM of at least three independent experiments. unpaired 2-tailed Student’s t test (A,B,C,D,E,F). **p < 0.01, ***p < 0.001.
Under oxidative stress, cancer cells increase their antioxidant capacity and develop a drug resistant phenotype. Targeting this redox adaptation process has significant therapeutic implications [13]. Piperlongumine (PL) [36, 37], β-phenethyl isothiocyanate (PEITC) [38] and Adaphostin (Ada) [39] have dual effects of increasing ROS production and suppressing BCL-2 family molecules. 10 μM of PEITC, PL, or Ada strongly stimulated ROS generation (Figure 6C) and were lethal to SupB15MR, SupB15LTCC and SupB15CM cells (Figure 6D, 6E and 6F). The ROS scavenger N-acetyl-cysteine (NAC) reversed the effects of PEITC or PL, but was less effective against Ada. This may due to the fact that Ada inhibits ABL1 kinase activity and SupB15, while highly chemosensitive, is a BCR-ABL positive cell line. All three drugs strongly induced γ-H2AX phosphorylation and inhibited MCL-1 (not BCL-2 or BCL2L1) expression (Figure 6G and 6H). Therefore the simultaneous increase of ROS and inhibition of MCL-1 appeared to inhibit BMSC induced chemoprotection.
Targeting antioxidants and MCL-1 effectively against ASNase resistance in primary ALL blasts
We next evaluated the role of antioxidant and MCL-1 targeting as adjunct strategies in ALL therapy. The anticancer effects of PEITC are dose-dependent. Compared to SupB15 cells, SupB15MR were sensitive to 10 μM of PEITC but more resistant to 2 μM of PEITC (Figure 7A). Serum concentrations of PEITC reached ~1 μM after oral intake [40], posing a practical hurdle for its clinical use. GSH is the main cellular antioxidant. A potential strategy would be to combine PEITC with reagents that inhibit GSH synthesis, such as buthionine sulfoximine (BSO) or the anti-leukemic drug L-Asparaginase (ASNase). ASNase converts asparagine to aspartate and glutamine to glutamate. The depletion of both asparagine and glutamine by ASNase appears to be required for its cytotoxic action [41], and ASNase has been reported to deplete serum glutamine and suppresses GSH levels in ALL patients [42]. We speculated that the effect of ASNase could in part be related to its antioxidant activity and used in combination with PEITC could potentiate its effect. REH and SupB15MR cells are highly resistant to ASNase when compared to SupB15 (Figure 7B). The combinations of PEITC with BSO or ASNase were more effective in suppressing MCL-1 activity, stimulating γ-H2AX expression (Figure 7C), inhibiting GSH expression (Figure 7D) and increasing ROS levels (Figure 7E) in SupB15MR and REH cells, than PEITC or ASNase alone. PEITC potentiates ASNase cytotoxicity in SupB15MR and REH cells (Figure 7F and 7G).
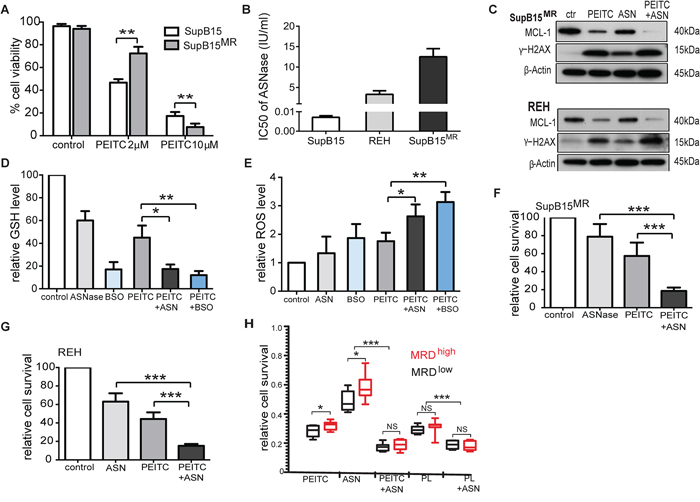
Figure 7: Targeting antioxidants and MCL-1 effectively restored sensitivity to ASNase in ALL cells. A. Variations in cell viability of SupB15 and SupB15MR cells after treatment with PEITC (2 μM or 10 μM) for 24 hours. B. IC50 of ANSase in SupB15, REH, and SupB15MR cells. C. Combination of PEITC with ASNase strongly inhibited MCL-1 expression and increased γ-H2AX expression in SupB15MR and REH cells. PEITC (2 μM) for 48 hours; ASNase (ASN) for 72 hours (2 IU/ml for REH, 5 IU/ml for SupB15MR); or ASNase for 24 hours, then PEITC for further 48 hours (PEITC + ASN). D. and E. Combination of PEITC with ASNase (ASN) or BSO (D) inhibited GSH expression and (E) increased ROS generation in SupB15MR cells after 20 hours’ treatment. PEITC (2 μM); ASNase (5 IU/ml); BSO (100 uM). F. and G. Cell viability of SupB15MR (F) or REH (G) following treatment: PEITC (2 μM) 48 hours; ASNase 96 hours (5 IU/ml for SupB15MR, 2IU/ml for REH); ASNase 48 hours, then PEITC 48 hours (PEITC + ASN). H. The addition of PEITC or PL overcame ASNase resistance in primary ALL cells. Diagnostic blast cells from MRDhigh or MRDlow patients were incubated in medium containing 50% CM, and treated with ASNase (2 IU/ml) for 72 hours; PEITC or PL (2 uM) for 48 hours; or ASNase for 24 hours, followed by PEITC or PL for further 48 hours. Data are mean ± SEM. Unpaired 2-tailed Student’s t test (A,D,E,F and G) and nonparametric Mann-Whitney test (H) *p < 0.05, **p < 0.01, ***p < 0.001.
As shown earlier, in patients with ALL, BMSC microenvironment mediated redox adaptation has occurred in a proportion of leukemic cells prior to treatment. We speculated that these cells persist after initial therapy. Sufficiently expanded, these cells may give rise to detectable MRD. Primary diagnostic blasts obtained from MRDlow (<10–4) and MRDhigh (≥10–4) patients recruited to the UKALL2003 clinical study [43] were analyzed (Supplementary Figure S6A). These patients were treated with a 3-drug induction of dexamethasone, vincristine and ASNase. 28 days after starting therapy, MRD assessments were performed. Trough ASNase activity was measured at two time points during induction (Supplementary Figure S6B). All patients had adequate ASNase activity at both time points (>100 U/L) [44], indicating adequate drug activity. As shown in Figure 7H, blast cells from MRDhi (n = 10) patients displayed proportionately increased resistance to ASNase when compared to cells from MRDlow patients (n = 15). This is indicative of an expanded drug resistant population in the pre-treatment bone marrow sample in the MRDhi group. The addition of PEITC or PL overcame ASNase resistance. Immunoblots showed that the combination of PEITC or PL with ASNase strongly inhibited MCL-1 levels and induced γ-H2AX expression in primary ALL blasts (Supplementary Figure S6C). Thus targeting antioxidants production and inhibiting MCL-1 may be potential adjunctive therapeutic strategies to overcome MRD in childhood ALL.
DISCUSSION
Analyses of the effect of the microenvironment created by the in vitro BMSC-ECM 3-D model offer possible biological explanations for the clinical variations in response to therapy in childhood ALL (Figure 8). As in most cancers, at diagnosis the majority of leukemic cells though metabolically active are not proliferative and mainly dying. Only a small populations of slowly cycling cells survive and give rise subsequently to fast cycling progenitors [45]. Our study suggests that the BMSC microenvironment produces an oxidative stress response in ALL cells. A subpopulation of ALL cells underwent redox adaptation, tolerated lethal doses of chemotherapy and gave rise to MR cells; a phenomenon not recapitulated by cells grown in normal medium. MR cells are characterised by decreased proliferation and multidrug resistance. This result agrees with the finding that in childhood ALL patients after 8 days treatment, persisting blast cells had decreased proliferative activity [46]. The method of generating MR cells parallels the clinical setting as cancer cells were cultured in a protective environment and exposed to toxic drug levels. In patient, treated with intensive combination chemotherapy MRD of ≥10–4 after 4 weeks of treatment is associated with a poorer outcome even though treatment lasts over 2-years. Further intensification with myelosuppressive therapy is associated with a clearance of MRD and better outcomes [47]. Our model suggests that EMDR derived, slowly proliferative, multidrug resistant cells survived initial cytotoxic stress and if sufficiently expanded were detectable as MRD. Cytotoxic therapy is non-specific and injurious to both leukemic and the protective microenvironment. This is one possible explanation for our observation of the clinical benefits of the more myelotoxic mitoxantrone when compared to idarubicin [3].
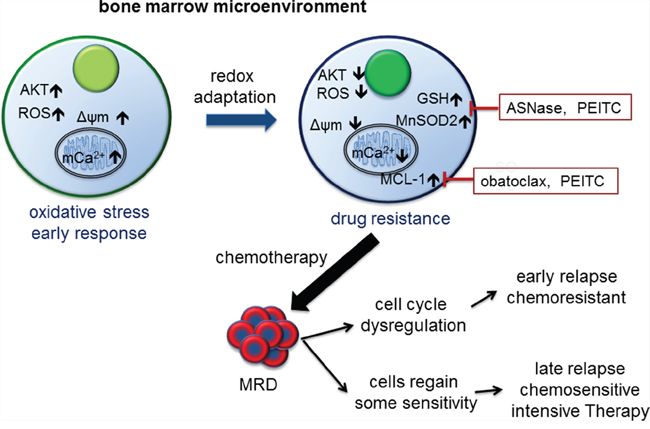
Figure 8: Model of bone marrow microenvironment mediated drug resistance in ALL and its clinical correlation. The bone marrow microenvironment exerts oxidative stress on leukemic cells by promoting mitochondrial calcium influx, increasing intracellular ROS levels and Δψm, and activating AKT. In response, leukemic cells initiate a mediated redox adaptation process, resulting in an increased expression of antioxidants (e.g. GSH and MnSOD2) and MCL-1, decreased ROS levels, Δψm and AKT activity. This confers a multiple drug resistance (MR) phenotype in leukemic cells. MR cells exist at diagnosis and can be detected as MRD post therapy. Cells with deregulated cell cycle control give rise to early recurrence. Other drug resistant cells gradually regain a degree of chemosensitivity, and respond to intensification with cytotoxic drugs. Alternatively, inhibiting antioxidants and MCL-1 activity as adjunctive therapy can target the MR phenotype.
When removed from the stressful environment, MR cells gradually lose their drug resistant phenotype, a feature also described in other cancers [25] and provides a model for late relapses. ALL patients with late relapses occurring many months after stopping therapy often respond to further intensification by similar chemotherapeutic agents. If MRD is cleared then many patients can be cured second time round [47]. On the contrary recurrences whilst on therapy are often associated with rapidly progressive disease and poor outcomes even after allogeneic stem cell transplantation [3]. SupB15 cells with p27 knockdown retained their drug resistant phenotype but were proliferative when incubated in BMSC CM. Similarly, mutations and deletion of the cell cycle control gene TP53 are associated with early highly aggressive relapse with poor outcomes [48].
Our experiments revealed a distinct biphasic response in ALL cells upon BMSC-CM stimulation, with initial upregulation of AKT activity and intracellular ROS levels, followed by decreased pAKT and ROS level after 24 to 72 hours, together with increased antioxidants expression. Short-term drug resistance, characterised by increased AKT activity and intracellular ROS levels, was reversed by pretreating cells with PI-3K/AKT inhibitor, as previously reported [7, 8]. Similar to the long-term drug resistant phenotype, leukaemia-initiating cells have low AKT activity [49], as do ‘stem-cell like’ cancer drug resistant cells [25]. So the metabolic phenotype of drug resistant cells observed in this study is common with other drug resistant cancer cells and cancer stem cells [15, 50–52]. The association between short- and long-term drug resistances indicates an evolutionary process, as illustrated in our mechanistic model (Figure 8).
This process also leads to the upregulation of the mitochondrial anti-apoptotic protein MCL-1. MCL-1 is one of the most highly amplified genes in a broad range of human cancers [33, 53] and its expression rapidly changed in responds to cellular stresses [54]. A recent study suggested that outer mitochondrial membrane localized MCL-1 possess antiapoptotic activity, and the mitochondrial matrix localized MCL-1 isoform supports oxidative phosphorylation, ATP production, and the maintenance of mitochondrial membrane potential [55], so it is possible that inhibition of both the anti-apoptotic and the mitochondrial functions of MCL-1 may lead to more effective therapies. In line with these findings, we found that MCL-1 as the most upregulated anti-apoptotic molecules in cells exposed to CM. In some of our experiments, MCL-1 protein appeared as a doublets as detected by Western blot, depending on the conditions of SDS-PAGE. Suppression of MCL-1 expression by siRNA or obatoclax sensitized ALL cells to H2O2 induced cell death. PEITC, PL, or Adaphostin treatments effectively inhibited or abolished MCL-1 expression, but not that of BCL-2 or BCL-xL. Moreover, at certain concentrations, the multiple drug resistant SupB15MR was more sensitive to PEITC or PL than its drug sensitive counterpart. Given that low MMP and high MCL-1 is the feature of BMSC mediated drug resistance, the extensive metabolic reprogramming in cancer cells may make them more vulnerable to motochondrial perturbations than normal cells [56], so it is possible that drug resistant cells may rely on high antioxidants and MCL-1 to maintain normal mitochondrial morphology. Inhibiting MCL-1 and antioxidants activity is able to further decrease MMP and eventually induce mitochondrial membrane collapse and cell death.
Our study has a number of limitations, chief of which is that the mechanisms of bone marrow microenvironment/BMSC mediated drug resistance were mainly explored in leukemic cell lines and murine models. Among the multiple signal pathways regulated by BMSC cells, as shown in our phosphoproteomics and gene expression analyses, we only investigated PI3K/AKT, cell proliferation, anti-apoptosis, and ROS metabolism in ALL cells. The nature of the subpopulations of cells that undergo redox adaptation remains unclear. As MRD levels vary with cytogenetic subtypes, it is possible that primary and secondary genetic subclonal changes may facilitate the redox adaptation. Murine models suggest that leukemic cells persist within the marrow after chemotherapy [57]. However the leukemic marrow environment is different to that of a marrow in remission. We do not know if the oxidative stress and response is different, or with time epigenetic transfer decreases leading to proliferation and increased chemosensitivity in daughter cells. Given the complexity of EMDR, more detailed investigation on other signalling pathways and better animal studies are required. Another limitation of this study is that the role of the immune system has not been explored in vitro and in vivo experiments. Genetic and epigenetic alterations happened in cancer cells may provide a diverse set of antigens that could be served as targets for immunotherapy. For example, PD1 pathway, an immune-checkpoint pathway that primarily operates in the tumour microenvironment, has emerged as a promising target in cancer [58].
Our study adds to the evidence that drug resistance in cancer cells is determined by both intrinsic and microenvironmental factors. Further in-depth investigation of metabolic profiling and epigenetic changes in the development of cancer drug resistance will provide insights into clinical treatment failure and relapse.
MATERIALS AND METHODS
Human tissue and cell lines
Clinical samples were obtained after informed signed consent from patients enrolled into the national clinical trial (ALL 2003) for children with ALL. National and Local ethical committees approved analyses of samples and ASNase activity. Primary ALL blast cells from bone marrow aspiration were separated with Ficoll gradient centrifugation (Lymphoprep; Axis-Shield). Leukemia cell lines were maintained in RPMI 1640 (Lonza, Belgium) supplemented with 10% fetal calf serum (FCS, Biosera). Primary BMSCs were prepared from ALL patients at diagnosis or have been received intensive chemotherapy. Only BMSC of three to six passages were used. Primary BMSC and human BMSC cell line HS-5 and hTRET-MSC were cultured in DMEM medium (Lonza) supplemented with 10% FCS, 100 U/ml penicillin and 100 μg/ml streptomycin. Differentiation of BMSC into osteoblast-like cells was assessed by alkaline phosphatase (ALP) staining (Roche, Germany) and osteopontin expression.
Animal experiments
All animal procedures were approved by the Cancer Research UK Manchester Institute’s Animal Ethics Committee and performed under a project license issued by the United Kingdom Home Office, in keeping with the Home Office Animal Scientific Procedures Act, 1986. NOD/SCID/IL-2Rγnull (NSG) mice were purchased from Jackson Laboratories (Bar Harbor, ME, USA) and bred in house. To investigate bone marrow microenvironment mediated redox adaptation in ALL cells, 1 × 10⁵ of ALL cells were transplanted into NOD/shi-scid/IL-2Rγnull mice femoral bone marrow. Mice were treated with methotrexate (5 mg/kg body weight) or PBS after 8 days transplantation. Bone marrow mononuclear cells were flushed from bone marrow after three weeks’ transplantation. Cells were gated with GFP (for SupB15LucGFP cells) or CD45 (for non-labelled cells) on flow cytometry.
Generation of BMSC derived extracellular matrix (ECM)
BMSC-ECM was generated by growing BMSC to confluence in normal medium [24]. Briefly, primary or cell line BMSCs were cultured in normal medium, just prior to reaching confluent, cells were treated with 50 ug/ml of ascorbic acid (Sigma) and cultured for another 5 days. BMSCs layer were treated with extraction buffer containing 0.5% (v/v) Triton X-100 and 20 mM NH4OH, gave rise to cell free ECM that remain attached to the culture plates. After washed three times with ice-cold PBS, the resulting extracted ECM can be stored at 4°C in PBS containing 100 U/ml penicillin and 100 ug/ml streptomycin with parafilm sealing for up to 3 months.
Generation of conditioned medium and ultrafiltration
BMSCs were cultured in complete medium on the BMSC-ECM layer until reach about 70% confluence, then serum free RPMI1640 were added and incubated for 24–48 hours. Cell culture supernatant were collected, centrifuged at 3500 rpm for 10 min to clear cells debris, then passed 0.2 μm filter. CM was snap frozen in dry ice, and kept in −80°C. CM was diluted with normal medium at a ratio of 1:1 just before use. CM fractions (<3kDa and >3kDa) were ultra-filtrated at 3000 Da (Millipore, Billerica, MA, USA), 3000 × g, 60 min, at 4°C.
RNA extraction, microarray, and GSEA analysis
Total RNA were purified by Qiagen RNeasy Micro kit, cDNA was amplified and labelled with Nugen Ovation Biotin labelling system (NuGEN Technologies). Labelled probes were hybridized to Affymetrix U133A 2.0 PLUS Array. The probe-level expression values in the data obtained from the Affymetrix HG133plus2 array were normalised and summarised as the expression values at the probeset level using the RMA method implemented in the Affymetrix’s tool ‘apt-probeset-summarize’. Data (.CEL files) were analyzed using the R statistical package bioconductor and Genespring 7.3.1 software. Gene array data were deposited in NCBI gene expression database Gene Expression Ominibus (GEO), accession number GSE48876.
The probe set-level expression data was loaded into the gene set enrichment analysis (GSEA) software. We created six gene sets, which involved in ROS metabolism (68 genes), AKT pathway (64 genes), apoptosis (110 genes), ATPase (46 genes), DNA repair (41 genes) and Chromatin remodelling (76 genes) by selecting genes from previously published gene list or the gene lists from SABiosciences website (http://www.sabiosciences.com/ArrayList.php) with modification based on published methods, only genes with published evidence of functions were included in the final gene list. In the GSEA analysis, we used the default settings except using the ‘gene-set’ as the permutation type, the Chip file provided by the GSEA software for the Affymetrix HG133plus2 array, and the ‘Diff_of_Classes’ option as the metric for ranking genes.
Triple SILAC based phosphoproteomics
SupB15 and HS-5 cells were grown in heavy (H) Arginine (13C6 15N4 L-Arginine-HCl)/Lysine (13C6 15N2 L-Lysine-2HCl), intermediate (I) Arginine (13C6 L-Arginine-HCl)/Lysine (13C6 L-Lysine-2HCl) and light (L) Arginine (L-Arginine-HCl)/Lysine (L-Lysine-2HCl) media for a minimum of five passages according to manufacturer’s instructions. All media was supplemented with 230 μg/ml L-Proline to prevent conversion of Arginine to Proline. After serum starved overnight, SupB15 cells were treated with SILAC conditioned media (CM) from HS-5 cells for 30 mins or 2 hrs. Then cells were washed with ice-cold PBS, equal numbers of H, I and L viable SupB15 cells were mixed together, lysed with 50 mM Tris, 4% SDS containing protease and phosphoprotease inhibitor cocktails (Roche) on ice for 30 mins. Protein samples were then digested with trypsin, desalted and dried down. Seven aliquots (each around 320 ug) were combined. The sample was split equally into ten portions for TiO2 enrichment and subjected to a LTQ OrbitrapXL mass spectrometer (Thermo Fisher, Hertfordshire, UK) for analysis.
shRNA and siRNA transfection
Lentiviruses which express GFP, p27 shRNA or their empty vector control were produced in 293T cells, transfected into SupB15 cells and stable transfection were selected with 10 ug/ml of Puromycin. Accell MCL-1 siRNA or its control siRNA (Thermo Scientific Dharmacon) were transduced into ALL cell lines according to manufacturer’s instruction. 3 days after transfection, protein knockdown were assessed by Western Blot and cells were immediately used for experiments.
Cell proliferation and viability
Cell proliferation and viability was analyzed by using CellTiter96Aqueous One Solution Cell proliferation Assay kit (Promega, Madision, WI, USA) according to the manufacturer’s protocol. Cell viability was determined by recording the absorbance at 490 nM using a 96-well plate reader (FLUOstar Omega). Cell viability was also be determined by Trypan blue exclusion (Invitrogen) assay and the cell viability were assessed in a TC10 Automated cell counter (Bio Rad, Berkeley, CA, USA).
Immunoblots and antibodies
Cells were suspended in lysis buffer (20 mM Tris-HCl, pH 7.8, 50 mM NaCl, 5 mM EGTA, and 1% v/v Triton X-100) containing freshly added protease and phosphatase inhibitors (Roche). Lysates were clarified by centrifugation at 4°C, and protein concentration was determined by Bio-Rad protein assay.
To verify the protein contents of the BMSC-ECM after alkaline detergent extraction, BMSC-ECM were scratched from culture plate and dissolved in buffer containing 100 mM Tris-HCl (pH 6.8), 200 mM dithiothreitol and 4% SDS. Samples were homogenized by pass through 27 g needle for at least 7 times, incubated on ice for 60 minutes, cleared by centrifugation and subjected to protein concentration assessment. Then 0.2% glycerol and 0.2% bromophenol blue (final concentration) were added and samples were heated at 95°C for 5 minutes.
The following antibodies are used: phosphor-AKT Ser 473 and were from Cell Signalling. γ-H2AX, osteopontin, β-actin, MnSOD2, BCL-2, and BCL-xL were from Millipore. p27, p21, collagen 1, fibronectin, MCL-1, Gpx1/2, were from Santa Cruz Biotechnology.
Flow cytometry
ROS level (CM-H2DCFDA or CellROX™ Deep Red), Δψm (Mitotracker CMXRos), and Mitochondrial Ca2+ concentration (Rhod2-AM) were analyzed using a FACSCalibur flow cytometer (BD Bioscience, Oxford, UK). Intracellular GSH level were assessed in a LSR model II flow cytometry (BD Bioscience, Oxford, UK) with ThiolTracker™ Violet dye staining. The fluorescence dyes were from Invitrogen (Carlsbad, CA, USA), and data were analyzed using FlowJo software (FlowJo, Oregon, USA). Cell isolation by flow sorting was performed on a BD FACS Aria III (BD Bioscience).
Measurement of calcium concentration
The concentration of Calcium ions was measured by using Calcium Colorimetric Assay Kit (BioVision, Milpitas, CA, USA) and determined by recording the absorbance at 575 nm using a 96-well plate reader (FLUOstar Omega, BMG LABTECH, Germany).
Statistical analysis
Statistical analyses were performed using unpaired 2-tailed Student’s t test for in vitro cell line data; non-parametric Mann-Whitney test for in vivo and patients sample data. Statistical calculations were performed with GraphPad Prism software. P value < 0.05 was considered as significant. Data are expressed as means ± SEM. *p < 0.05, **p < 0.01, ***p < 0.001.
ACKNOWLEDGMENTS AND FUNDING
We gratefully acknowledge the review and comments by Professor Michael Lisanti and Dr. Federica Sotgia. We thank Professor Dario Campana for providing the hTRET-MSC cell line, Oscar Fernandez-Capetillo for the p27 shRNA plasmid, and Jean-Pierre Bourquin for ALL primagraft samples. This study was supported by grants from Cancer Research UK and Leukaemia Lymphoma Research Fund to Vaskar Saha. Vaskar Saha is an India Alliance Margdarshi Fellow.
CONFLICTS OF INTEREST
The authors declare no conflict of interest.
REFERENCES
1. Bhojwani D, Kang HN, Moskowitz NP, Min DJ, Lee H, Potter JW, Davidson G, Willman CL, Borowitz MJ, Belitskaya-Levy I, Hunger SP, Raetz EA, Carroll WL. Biologic pathways associated with relapse in childhood acute lymphoblastic leukemia: a Children’s Oncology Group study. Blood. 2006; 108:711–717.
2. Conter V, Bartram CR, Valsecchi MG, Schrauder A, Panzer-Grumayer R, Moricke A, Arico M, Zimmermann M, Mann G, De Rossi G, Stanulla M, Locatelli F, Basso G, Niggli F, Barisone E, Henze G, et al. Molecular response to treatment redefines all prognostic factors in children and adolescents with B-cell precursor acute lymphoblastic leukemia: results in 3184 patients of the AIEOP-BFM ALL 2000 study. Blood. 2010; 115:3206–3214.
3. Parker C, Waters R, Leighton C, Hancock J, Sutton R, Moorman AV, Ancliff P, Morgan M, Masurekar A, Goulden N, Green N, Revesz T, Darbyshire P, Love S, Saha V. Effect of mitoxantrone on outcome of children with first relapse of acute lymphoblastic leukaemia (ALL R3): an open-label randomised trial. Lancet. 2010; 376:2009–2017.
4. Meads MB, Gatenby RA, Dalton WS. Environment-mediated drug resistance: a major contributor to minimal residual disease. Nature Reviews Cancer. 2009; 9:665–A674.
5. Abdi J, Chen G, Chang H. Drug resistance in multiple myeloma: latest findings and new concepts on molecular mechanisms. Oncotarget. 2013; 4:2186–2207.
6. Cairns RA, Harris IS, Mak TW. Regulation of cancer cell metabolism. Nature Reviews Cancer. 2011; 11:85–95.
7. Shehata M, Schnabl S, Demirtas D, Hilgarth M, Hubmann R, Ponath E, Badrnya S, Lehner C, Hoelbl A, Duechler M, Gaiger A, Zielinski C, Schwarzmeier JD, Jaeger U. Reconstitution of PTEN activity by CK2 inhibitors and interference with the PI3-K/Akt cascade counteract the antiapoptotic effect of human stromal cells in chronic lymphocytic leukemia. Blood. 2010; 116:2513–2521.
8. Tabe Y, Jin LH, Tsutsumi-Ishii Y, Xu YY, McQueen T, Priebe W, Mills GB, Ohsaka A, Nagaoka I, Andreeff M, Konopleva M. Activation of integrin-linked kinase is a critical prosurvival pathway induced in leukemic cells by bone marrow-derived stromal cells. Cancer Research. 2007; 67:684–694.
9. Yang F, Chen YZ, Shen T, Guo D, Dakhova O, Ittmann MM, Creighton CJ, Zhang YQ, Dang TD, Rowley DR. Stromal TGF-beta signaling induces AR activation in prostate cancer. Oncotarget. 2014; 5:10854–10869.
10. Iwamoto S, Mihara K, Downing JR, Pui CH, Campana D. Mesenchymal cells regulate the response of acute lymphoblastic leukemia cells to asparaginase. Journal of Clinical Investigation. 2007; 117:1049–1057.
11. Roodhart JML, Daenen LGM, Stigter ECA, Prins HJ, Gerrits J, Houthuijzen JM, Gerritsen MG, Schipper HS, Backer MJG, van Amersfoort M, Vermaat JSP, Moerer P, Ishihara K, Kalkhoven E, Beijnen JH, Derksen PWB, et al. Mesenchymal Stem Cells Induce Resistance to Chemotherapy through the Release of Platinum-Induced Fatty Acids. Cancer Cell. 2011; 20:370–383.
12. Zhang W, Trachootham D, Liu JY, Chen G, Pelicano H, Garcia-Prieto C, Lu WQ, Burger JA, Croce CM, Plunkett W, Keating MJ, Huang P. Stromal control of cystine metabolism promotes cancer cell survival in chronic lymphocytic leukaemia. Nat Cell Biol. 2012; 14:276–286.
13. Trachootham D, Alexandre J, Huang P. Targeting cancer cells by ROS-mediated mechanisms: a radical therapeutic approach? Nat Rev Drug Discov. 2009; 8:579–591.
14. Hsu PP, Sabatini DM. Cancer cell metabolism: Warburg and beyond. Cell. 2008; 134:703–707.
15. Diehn M, Cho RW, Lobo NA, Kalisky T, Dorie MJ, Kulp AN, Qian DL, Lam JS, Ailles LE, Wong MZ, Joshua B, Kaplan MJ, Wapnir I, Dirbas FM, Somlo G, Garberoglio C, et al. Association of reactive oxygen species levels and radioresistance in cancer stem cells. Nature. 2009; 458:780–U123.
16. Nishigaki H, Ito C, Manabe A, Kumagai M, Coustan-Smith E, Yanishevski Y, Behm FG, Raimondi SC, Pui CH, Campana D. Prevalence and growth characteristics of malignant stem cells in B-lineage acute lymphoblastic leukemia. Blood. 1997; 89:3735–3744.
17. Ito C, Evans WE, McNinch L, Coustan-Smith E, Mahmoud H, Pui CH, Campana D. Comparative cytotoxicity of dexamethasone and prednisolone in childhood acute lymphoblastic leukemia. Journal of clinical oncology : official journal of the American Society of Clinical Oncology. 1996; 14:2370–2376.
18. Suryani S, Carol H, Chonghaile TN, Frismantas V, Sarmah C, High L, Bornhauser B, Cowley MJ, Szymanska B, Evans K, Boehm I, Tonna E, Jones L, Manesh DM, Kurmasheva RT, Billups C, et al. Cell and molecular determinants of in vivo efficacy of the BH3 mimetic ABT-263 against pediatric acute lymphoblastic leukemia xenografts. Clinical cancer research : an official journal of the American Association for Cancer Research. 2014; 20:4520–4531.
19. Boutter J, Huang Y, Marovca B, Vonderheit A, Grotzer MA, Eckert C, Cario G, Wollscheid B, Horvath P, Bornhauser BC, Bourquin JP. Image-based RNA interference screening reveals an individual dependence of acute lymphoblastic leukemia on stromal cysteine support. Oncotarget. 2014; 5:11501–11512.
20. Kiel MJ, Morrison SJ. Uncertainty in the niches that maintain haematopoietic stem cells. Nature Reviews Immunology. 2008; 8:290–301.
21. Keating A. Mesenchymal Stromal Cells: New Directions. Cell Stem Cell. 2012; 10:709–716.
22. Windus LCE, Glover TT, Avery VM. Bone-stromal cells up-regulate tumourigenic markers in a tumour-stromal 3D model of prostate cancer. Mol Cancer. 2013; 12:112.
23. Pampaloni F, Reynaud EG, Stelzer EHK. The third dimension bridges the gap between cell culture and live tissue. Nat Rev Mol Cell Bio. 2007; 8:839–845.
24. Cukierman E, Pankov R, Stevens DR, Yamada KM. Taking cell-matrix adhesions to the third dimension. Science. 2001; 294:1708–1712.
25. Sharma SV, Lee DY, Li BH, Quinlan MP, Takahashi F, Maheswaran S, McDermott U, Azizian N, Zou L, Fischbach MA, Wong KK, Brandstetter K, Wittner B, Ramaswamy S, Classon M, Settleman J. A Chromatin-Mediated Reversible Drug-Tolerant State in Cancer Cell Subpopulations. Cell. 2010; 141:69–80.
26. Altomare DA, Testa JR. Perturbations of the AKT signaling pathway in human cancer. Oncogene. 2005; 24:7455–7464.
27. Davies MA. Regulation, Role, and Targeting of Akt in Cancer. Journal of Clinical Oncology. 2011; 29:4715–4717.
28. Wong J, Welschinger R, Hewson J, Bradstock KF, Bendall LJ. Efficacy of dual PI-3K and mTOR inhibitors in Vitro and in Vivo in acute lymphoblastic leukemia. Oncotarget. 2014; 5:10460–10472.
29. Cani A, Simioni C, Martelli AM, Zauli G, Tabellini G, Ultimo S, McCubrey JA, Capitani S, Neri LM. Triple Akt inhibition as a new therapeutic strategy in T-cell acute lymphoblastic leukemia. Oncotarget. 2015; 6:6597–6610.
30. Glennie S, Soeiro I, Dyson PJ, Lam EWF, Dazzi F. Bone marrow mesenchymal stem cefls induce division arrest anergy of activated T cells. Blood. 2005; 105:2821–2827.
31. Corcione A, Benvenuto F, Ferretti E, Giunti D, Cappiello V, Cazzanti F, Risso M, Gualandi F, Mancardi GL, Pistoia V, Uccelli A. Human mesenchymal stem cells modulate B-cell functions. Blood. 2006; 107:367–372.
32. Brookes PS, Yoon YS, Robotham JL, Anders MW, Sheu SS. Calcium, ATP, and ROS: a mitochondrial love-hate triangle. American Journal of Physiology-Cell Physiology. 2004; 287:C817–C833.
33. Beroukhim R, Mermel CH, Porter D, Wei G, Raychaudhuri S, Donovan J, Barretina J, Boehm JS, Dobson J, Urashima M, Mc Henry KT, Pinchback RM, Ligon AH, Cho YJ, Haery L, Greulich H, et al. The landscape of somatic copy-number alteration across human cancers. Nature. 2010; 463:899–905.
34. Kornblau SM, Singh N, Qiu YH, Chen WJ, Zhang NX, Coombes KR. Highly Phosphorylated FOXO3A Is an Adverse Prognostic Factor in Acute Myeloid Leukemia. Clinical Cancer Research. 2010; 16:1865–1874.
35. Kuiper RP, Schoenmakers EFPM, van Reijmersdal SV, Hehir-Kwa JY, van Kessel AG, van Leeuwen FN, Hoogerbruggey PM. High-resolution genomic profiling of childhood ALL reveals novel recurrent genetic lesions affecting pathways involved in lymphocyte differentiation and cell cycle progression. Leukemia. 2007; 21:1258–1266.
36. Raj L, Ide T, Gurkar AU, Foley M, Schenone M, Li XY, Tolliday NJ, Golub TR, Carr SA, Shamji AF, Stern AM, Mandinova A, Schreiber SL, Lee SW. Selective killing of cancer cells by a small molecule targeting the stress response to ROS. Nature. 2011; 475:231–234.
37. Roh JL, Kim EH, Park JY, Kim JW, Kwon M, Lee BH. Piperlongumine selectively kills cancer cells and increases cisplatin antitumor activity in head and neck cancer. Oncotarget. 2014; 5:9227–9238.
38. Trachootham D, Zhou Y, Zhang H, Demizu Y, Chen Z, Pelicano H, Chiao PJ, Achanta G, Arlinghaus RB, Liu JS, Huang P. Selective killing of oncogenically transformed cells through a ROS-mediated mechanism by beta-phenylethyl isothiocyanate. Cancer Cell. 2006; 10:241–252.
39. Le SB, Hailer MK, Buhrow S, Wang Q, Flatten K, Pediaditakis P, Bible KC, Lewis LD, Sausville EA, Pang YP, Ames MM, Lemasters JJ, Holmuhamedov EL, Kaufmann SH. Inhibition of mitochondrial respiration as a source of adaphostin-induced reactive oxygen species and cytotoxicity. Journal of Biological Chemistry. 2007; 282:8860–8872.
40. Ji Y, Morris ME. Determination of phenethyl isothiocyanate in human plasma and urine by ammonia derivatization and liquid chromatography-tandem mass spectrometry. Analytical Biochemistry. 2003; 323:39–47.
41. Offman MN, Krol M, Patel N, Krishnan S, Liu JZ, Saha V, Bates PA. Rational engineering of L-asparaginase reveals importance of dual activity for cancer cell toxicity. Blood. 2011; 117:1614–1621.
42. Avramis VI, Panosyan EH. Pharmacokinetic/pharmacodynamic relationships of asparaginase formulations — The past, the present and recommendations for the future. Clinical Pharmacokinetics. 2005; 44:367–393.
43. Vora A, Goulden N, Wade R, Mitchell C, Hancock J, Hough R, Rowntree C, Richards S. Treatment reduction for children and young adults with low-risk acute lymphoblastic leukaemia defined by minimal residual disease (UKALL 2003): a randomised controlled trial. The lancet oncology. 2013; 14:199–209.
44. Masurekar A, Fong C, Hussein A, Revesz T, Hoogerbrugge PM, Love S, Ciria C, Parker C, Krishnan S, Saha V. The optimal use of PEG-asparaginase in relapsed ALL—lessons from the ALLR3 Clinical Trial. Blood cancer journal. 2014; 4:e203.
45. Clarkson B, Ohkita T, Ota K, Fried J. Studies of Cellular Proliferation in Human Leukemia. I. Estimation of Growth Rates of Leukemic and Normal Hematopoietic Cells in 2 Adults with Acute Leukemia Given Single Injections of Tritiated Thymidine. J Clin Invest. 1967; 46:506–529.
46. Rhein P, Scheid S, Ratei R, Hagemeier C, Seeger K, Kirschner-Schwabe R, Moericke A, Schrappe M, Spang R, Ludwig WD, Karawajew L. Gene expression shift towards normal B cells, decreased proliferative capacity and distinct surface receptors characterize leukemic blasts persisting during induction therapy in childhood acute lymphoblastic leukemia. Leukemia. 2007; 21:897–905.
47. Eckert C, Henze G, Seeger K, Hagedorn N, Mann G, Panzer-Grumayer R, Peters C, Klingebiel T, Borkhardt A, Schrappe M, Schrauder A, Escherich G, Sramkova L, Niggli F, Hitzler J, von Stackelberg A. Use of allogeneic hematopoietic stem-cell transplantation based on minimal residual disease response improves outcomes for children with relapsed acute lymphoblastic leukemia in the intermediate-risk group. Journal of clinical oncology : official journal of the American Society of Clinical Oncology. 2013; 31:2736–2742.
48. Hof J, Krentz S, van Schewick C, Korner G, Shalapour S, Rhein P, Karawajew L, Ludwig WD, Seeger K, Henze G, von Stackelberg A, Hagemeier C, Eckert C, Kirschner-Schwabe R. Mutations and Deletions of the TP53 Gene Predict Nonresponse to Treatment and Poor Outcome in First Relapse of Childhood Acute Lymphoblastic Leukemia. J Clin Oncol. 2011; 29:3185–3193.
49. Sykes SM, Lane SW, Bullinger L, Kalaitzidis D, Yusuf R, Saez B, Ferraro F, Mercier F, Singh H, Brumme KM, Acharya SS, Scholl C, Tothova Z, Attar EC, Frohling S, DePinho RA, et al. AKT/FOXO Signaling Enforces Reversible Differentiation Blockade in Myeloid Leukemias. (vol 146, pg 697, 2011). Cell. 2011; 147:247–247.
50. Harper ME, Antoniou A, Villalobos-Menuey E, Russo A, Trauger R, Vendemelio M, George A, Bartholomew R, Carlo D, Shaikh A, Kupperman J, Newell EW, Bespalov IA, Wallace SS, Liu Y, Rogers JR, et al. Characterization of a novel metabolic strategy used by drug-resistant tumor cells. Faseb Journal. 2002; 16:1550–1557.
51. Jang YY, Sharkis SJ. A low level of reactive oxygen species selects for primitive hematopoietic stem cells that may reside in the low-oxygenic niche. Blood. 2007; 110:3056–3063.
52. Li CP, Thompson MA, Tamayo AT, Zuo Z, Lee J, Vega F, Ford RJ, Pham LV. Over-expression of Thioredoxin-1 mediates growth, survival, and chemoresistance and is a druggable target in diffuse large B-cell lymphoma. Oncotarget. 2012; 3:314–326.
53. Jonchere B, Vetillard A, Toutain B, Lam D, Bernard AC, Henry C, Trecesson SD, Gamelin E, Juin P, Guette C, Coqueret O. Irinotecan treatment and senescence failure promote the emergence of more transformed and invasive cells that depend on anti-apoptotic Mcl-1. Oncotarget. 2015; 6:409–426.
54. Maurer U, Charvet C, Wagman AS, Dejardin E, Green DR. Glycogen synthase kinase-3 regulates mitochondrial outer membrane permeabilization and apoptosis by destabilization of MCL-1. Molecular Cell. 2006; 21:749–760.
55. Perciavalle RM, Stewart DP, Koss B, Lynch J, Milasta S, Bathina M, Temirov J, Cleland MM, Pelletier S, Schuetz JD, Youle RJ, Green DR, Opferman JT. Anti-apoptotic MCL-1 localizes to the mitochondrial matrix and couples mitochondrial fusion to respiration. Nat Cell Biol. 2012; 14:575–583.
56. Kroemer G, Pouyssegur J. Tumor cell metabolism: Cancer’s Achilles’ heel. Cancer Cell. 2008; 13:472–482.
57. Duan CW, Shi J, Chen J, Wang B, Yu YH, Qin X, Zhou XC, Cai YJ, Li ZQ, Zhang F, Yin MZ, Tao Y, Mi JQ, Li LH, Enver T, Chen GQ, et al. Leukemia propagating cells rebuild an evolving niche in response to therapy. Cancer cell. 2014; 25:778–793.
58. Pardoll DM. The blockade of immune checkpoints in cancer immunotherapy. Nat Rev Cancer. 2012; 12:252–264.