
INTRODUCTION
Nasopharyngeal carcinoma (NPC) is an Epstein-Barr virus (EBV) associated malignant tumor that arises from the epithelial cells at the nasopharynx [1]. It has remarkably high prevalence in southern China and Southeast Asia with an incidence rate of 20–30 per 100, 000, although it's a rare cancer in the western countries [2, 3]. As the tumor cells are sensitive to radiotherapy, substantial improvements in radiation technique and concurrent-adjuvant chemotherapy during the recent decades have provided a significant benefit in clinical outcomes for NPC patients [4]. The 5-year overall survival rate were recently reported to exceed 80% [5–7]. However, there are still 20% to 30% of patients develop distant metastasis and/or loco-regional recurrence, which are the major causes of therapeutic failure [8]. No effective biomarkers other than TNM stage and primary tumor volume are currently used to predict treatment outcomes for NPC patients [9]. However, NPC patients with the same clinical stage usually suffer different clinical outcomes, suggesting the current TNM staging and the tumor size are insufficient factors for prognosis prediction. Therefore, it is urgent to identify effective prognostic biomarkers to improve clinical management for NPC patients. Accumulating evidences have suggested a strong association between germline polymorphisms and cancer prognosis [10]. Previously, genetic polymorphisms in genes MCP-1 and HLA-G have been found to be associated with NPC prognosis [11, 12].
Posttranscriptional regulation of gene expression is a crucial biological event in cancer development [13]. The metabolism of mRNA is largely defined by RNA-binding proteins (RBPs), which play key roles in regulating gene expression at different processes and in cancer progression [14]. The CELF (CUG-BP- and ETR-3-like factor) family of RBPs consist of six members that have been shown with abilities to regulate mRNA editing, stability, and translation [15]. CELF1 and CELF2 [16, 17] are two founder members of CELF family and have been implicated in cell growth, apoptosis, and prognosis of cancer [18–23]. However, the association between CELF family members and the prognosis of NPC remains unclear.
In present study, in attempt to address the link between the genetic variants in members of CELF family and the clinical outcomes of NPC patients, we selected 112 tagging SNPs of CELF genes and tested their associations with clinical outcomes in 717 NPC patients, followed by a validation in an additional sample of 1,520 NPC cases.
RESULTS
Distribution of patient characteristics and survival status
The characteristics of NPC patients in the discovery stage and the validation stage were summarized in Table 1. The median age at the time of diagnosis was 50 years (ranging 6–98 years) for all the 2,237 patients. Among these patients, there were 1,652 males (73.8%) and 585 females (26.2%). The majority of patients including 1,793 individuals (80.2%) were diagnosed at late stages (III and IV), and the other 444 patients (19.8%) were at early stages (I and II). All of the patients were treated with radiotherapy, including 1,713 patients received 2-dimensional conventional radiotherapy and 524 patients received 3-dimensional radiotherapy. Moreover, different regimes of platinum-based chemotherapy were given to 1,604 patients. Among these patients, 970 patients received inducing chemotherapy, 1,039 patients received concurrent chemotherapy, and 94 patients received adjuvant chemotherapy.
Table 1: Characteristic of individuals with NPC in the discovery, validation and combined stages
Characteristics |
Discovery stage (n = 717) |
Validation stage (n = 1, 520) |
Combined samples (n = 2, 237) |
N (%) |
N (%) |
N (%) |
|
Gender |
|||
Male |
525 (73.2) |
1127 (74.1) |
1652 (73.8) |
Female |
192 (26.8) |
393 (25.9) |
585 (26.2) |
Age, years |
|||
<50 |
295 (41.1) |
750 (49.3) |
1045 (46.7) |
≥50 |
422 (58.9) |
770 (50.7) |
1192 (53.3) |
T-classification |
|||
T1-T2 |
256 (35.7) |
493 (32.4) |
749 (33.5) |
T3-T4 |
461 (64.3) |
1027 (67.6) |
1488 (66.5) |
N-classification |
|||
N1-N2 |
378 (52.7) |
822 (54.1) |
1200 (53.6) |
N3-N4 |
339 (47.3) |
698 (45.9) |
1037 (46.4) |
Overall stage |
|||
I-II |
149 (20.8) |
295 (19.4) |
444 (19.8) |
III-IV |
568 (79.2) |
1225 (80.6) |
1793 (80.2) |
Radiotherapy |
|||
2D-RT |
614 (85.6) |
1099 (72.3) |
1713 (76.6) |
3D-RT |
103 (14.4) |
421 (27.7) |
524 (23.4) |
Chemotherapy |
|||
No |
236 (32.9) |
397 (22.1) |
633 (28.3) |
ICT |
315 (43.9) |
655 (43.1) |
970 (43.4) |
CCT |
279 (38.9) |
760 (50.0) |
1039 (46.4) |
ACT |
41 (5.72) |
53 (3.49) |
94 (4.20) |
Death |
146 (20.4) |
186 (12.2) |
332 (14.8) |
Metastasis |
96 (13.4) |
188 (12.4) |
284 (12.7) |
Recurrence |
76 (10.6) |
138 (9.08) |
214 (9.57) |
N, number of patients; 2D-RT, 2-dimensional radiotherapy; 3D-RT, 3-dimensional radiotherapy; ICT, inducing chemotherapy; CCT, concurrent chemotherapy; ACT, adjuvant chemotherapy.
By the last follow-up in June 2013, the median follow-up duration was 56.41 months (Ranging 1.22–119.2 months); 332 patients (14.8%) died of NPC; 284 patients (12.7%) developed distant metastases; 214 patients (9.6%) developed loco-regional recurrences; 26 patients (1.2%) developed both distant metastases and loco-regional recurrences; and, six patients were treated as defaulters due to death of other causes.
Two-stage association study of CELF polymorphisms and NPC survival
After quality control filtering, 112 SNPs in 717 NPC cases were tested in discovery stage by using Cox proportional hazards model adjusted for gender, age, tumor stage, and treatment modality (Table 2 and Supplementary Table S1). Our results showed that five SNPs were significantly associated with NPC survival, including rs3740194 in CELF2 (HR = 0.69, 95%CI = 0.52–0.90; P = 0.007), rs11257025 in CELF2 (HR = 1.66, 95%CI = 1.18–2.33; P = 0.003), rs7094118 in CELF2 (HR = 1.41, 95%CI = 1.11–1.80; P = 0.005), rs7234088 in CELF4 (HR = 0.64, 95%CI = 0.43–0.95; P = 0.029) and rs1786814 in CELF4 (HR = 0.50, 95%CI = 0.29–0.84; P = 0.009), respectively. These five promising SNPs were further genotyped in 1,520 additional cases. Survival analysis revealed that only rs3740194 showed consistently significant association in the validation stage (HR = 0.70, 95%CI = 0.55–0.89, P = 0.003), while the other 4 SNPs failed to be validated (P > 0.05). Moreover, combined analysis showed that rs3740194 at CELF2 was significantly associated with the length of overall survival (HR = 0.69, 95%CI = 0.58–0.82, P = 4.16 × 10⁻⁵, P corrected for multiple testing = 0.005; Table 2).
Table 2: Association results for five candidate SNPs with NPC survival in the discovery, validation and combined stages
SNP |
Gene |
Allelesa |
Stages |
MAF |
GENOb |
HWE |
HR (95%CI)c |
P value |
FDRd |
rs3740194 |
CELF2 |
G/A |
|||||||
Discovery |
0.312 |
61/324/331 |
0.14 |
0.69 (0.52-0.90) |
0.007 |
||||
Validation |
0.325 |
148/690/679 |
0.16 |
0.70 (0.55-0.89) |
0.003 |
||||
Combined |
0.321 |
209/1014/1010 |
0.05 |
0.69 (0.58-0.82) |
4.16 × 10⁻⁵ |
0.005 |
|||
rs11257025 |
CELF2 |
A/G |
|||||||
Discovery |
0.101 |
5/134/576 |
0.53 |
1.66 (1.18-2.33) |
0.003 |
||||
Validation |
0.112 |
14/312/1192 |
0.24 |
1.12 (0.82-1.53) |
0.470 |
||||
Combined |
0.108 |
19/446/1768 |
0.13 |
1.31 (1.04-1.64) |
0.020 |
0.747 |
|||
rs7094118 |
CELF2 |
A/G |
|||||||
Discovery |
0.295 |
60/301/353 |
0.79 |
1.41 (1.11-1.80) |
0.005 |
||||
Validation |
0.299 |
132/644/743 |
0.67 |
0.87 (0.69-1.09) |
0.230 |
||||
Combined |
0.298 |
192/945/1096 |
0.58 |
1.08 (0.91-1.27) |
0.383 |
1.000 |
|||
rs7234088 |
CELF4 |
G/A |
|||||||
Discovery |
0.139 |
8/182/525 |
0.08 |
0.64 (0.43-0.95) |
0.029 |
||||
Validation |
0.123 |
22/329/1167 |
0.91 |
0.75 (0.54-1.04) |
0.087 |
||||
Combined |
0.128 |
30/511/1692 |
0.25 |
0.71 (0.55-0.91) |
0.008 |
0.448 |
|||
rs1786814 |
CELF4 |
A/G |
|||||||
Discovery |
0.086 |
4/115/597 |
0.81 |
0.50 (0.29-0.84) |
0.009 |
||||
Validation |
0.070 |
7/200/1311 |
1.00 |
1.12 (0.76-1.64) |
0.583 |
||||
Combined |
0.075 |
11/315/1908 |
0.76 |
0.80 (0.59-1.10) |
0.170 |
1.000 |
aMinor allele/major allele. bMinor homozygote/heterozygote/major homozygote. cUnder codominant model. dBenjamini-Hochberg correction for multiple testing. MAF, minor allele frequency; HWE, Hardy-Weinberg equilibrium; HR, Hazard Ratio, adjusted for gender, age, tumor stage, and treatment; CI, confidence interval.
Association analyses of CELF2 rs3740194 as a prognostic factor of NPC
According to the univariate analyses, both the risk of death and metastasis were significantly increased in males, patients with advanced T, N and overall stages, and patients treated with inducing chemotherapy (Table 3). Moreover, elder age was an adverse factor for overall survival (HR = 1.83, 95%CI = 1.46–2.31). None of the selected factors was associated with recurrence, except that being male or receiving 3-dimensional radiotherapy was associated with poor loco-regional recurrence-free survival, respectively (Table 3). Consistent with the above Cox proportional hazards model, rs3740194 at CELF2 showed a significant association with overall survival (AG+GG vs AA, HR = 0.66, 95% CI = 0.53–0.82). Moreover, it was significantly associated with the metastasis-free survival (AG+GG vs AA, HR = 0.63, 95% CI = 0.50–0.80). The Kaplan-Meier survival curves and log-Rank tests showed that the AA genotype of rs3740194 was consistently associated with poor overall survival and metastasis-free survival of NPC patients in the discovery, validation and combined samples (P < 0.05; Figure 1).
Table 3: Univariate analysis of prognostic factors associated with NPC prognosis
Variables |
OS |
DMFS |
LRRFS |
||||||
Deaths (%) |
HR (95% CI) |
P value |
Metastases (%) |
HR (95% CI) |
P value |
Recurrences (%) |
HR (95% CI) |
P value |
|
Gender |
|||||||||
Female |
55 (9.40) |
1 |
5.97 × 10⁻⁶ |
53 (9.06) |
1 |
0.001 |
41 (7.01) |
1 |
0.005 |
Male |
277 (16.8) |
1.95 (1.46–2.61) |
231 (14.0) |
1.65 (1.22–2.22) |
173 (10.5) |
1.63 (1.16–2.30) |
|||
Age (years) |
|||||||||
<50 |
105 (10.0) |
1 |
2.77 × 10⁻⁷ |
122 (11.7) |
1 |
0.262 |
100 (9.57) |
1 |
0.833 |
≥50 |
227 (19.0) |
1.83 (1.46–2.31) |
162 (13.6) |
1.14 (0.90–1.45) |
114 (9.56) |
0.97 (0.74–1.27) |
|||
T status |
|||||||||
T1-T2 |
71 (9.48) |
1 |
3.86 × 10⁻⁷ |
73 (9.75) |
1 |
0.002 |
77 (10.3) |
1 |
0.636 |
T3-T4 |
261 (17.5) |
1.97 (1.52–2.57) |
211 (14.2) |
1.52 (1.16–1.98) |
137 (9.21) |
0.93 (0.71–1.24) |
|||
N status |
|||||||||
N1-N2 |
138 (11.5) |
1 |
2.84 × 10⁻⁷ |
118 (9.83) |
1 |
3.28 × 10⁻⁶ |
110 (9.17) |
1 |
0.208 |
N3-N4 |
194 (18.7) |
1.77 (1.42–2.20) |
166 (16.0) |
1.75 (1.38–2.22) |
104 (10.0) |
1.19 (0.91-1.55) |
|||
Overall stage |
|||||||||
I-II |
31 (6.98) |
1 |
1.95 × 10⁻⁷ |
30 (6.76) |
1 |
2.15 × 10⁻⁵ |
45 (10.1) |
1 |
0.949 |
III-IV |
301 (16.8) |
2.67 (1.84–3.86) |
254 (14.2) |
2.27 (1.56–3.32) |
169 (9.43) |
1.01 (0.73–1.40) |
|||
Radiotherapy |
|||||||||
2D-RT |
272 (15.9) |
1 |
0.203 |
231 (13.5) |
1 |
0.147 |
157 (9.17) |
1 |
0.042 |
3D-RT |
60 (11.5) |
0.83 (0.63–1.10) |
53 (10.1) |
0.80 (0.59–1.08) |
57 (10.9) |
1.37 (1.01–1.86) |
|||
Chemotherapy |
|||||||||
No |
85 (13.4) |
1 |
55 (8.69) |
1 |
71 (11.2) |
1 |
0.326 |
||
ICT |
166 (17.1) |
1.41 (1.14–1.75) |
0.002 |
142 (14.6) |
1.38 (1.09–1.74) |
0.007 |
96 (9.90) |
1.15 (0.87–1.50) |
|
CCT |
140 (13.5) |
0.96 (0.77–1.19) |
0.712 |
132 (12.7) |
1.07 (0.85–1.35) |
0.564 |
93 (8.95) |
0.99 (0.75–1.29) |
0.913 |
ACT |
20 (21.3) |
1.49 (0.95–2.35) |
0.083 |
16 (17.0) |
1.39 (0.84–2.30) |
0.201 |
8 (8.51) |
0.90 (0.44–1.82) |
0.764 |
CELF2 rs3740194 genotype |
|||||||||
AA |
181 (17.9) |
1 |
158 (15.6) |
1 |
105 (8.91) |
1 |
|||
AG |
132 (13.0) |
0.70 (0.56–0.87) |
0.002 |
107 (10.6) |
0.65 (0.51–0.83) |
5.05 × 10⁻⁴ |
90 (8.88) |
0.82 (0.62–1.09) |
0.164 |
GG |
19 (9.09) |
0.70 (0.55–0.89) |
0.003 |
19 (9.09) |
0.75 (0.59–0.95) |
0.018 |
19 (9.09) |
0.93 (0.73–1.18) |
0.538 |
AG+GG |
151 (12.3) |
0.66 (0.53–0.82) |
1.78 × 10⁻⁴ |
126 (10.3) |
0.63 (0.50–0.80) |
1.21 × 10⁻⁴ |
109 (8.91) |
0.82 (0.63–1.08) |
0.159 |
OS, Overall Survival; DMFS, Distant Metastasis-Free Survival; LRRFS, Loco-Regional Recurrence-Free Survival; 2D-RT, 2-dimensional radiotherapy; 3D-RT, 3-dimensional radiotherapy; ICT, inducing chemotherapy; CCT, concurrent chemotherapy; ACT, adjuvant chemotherapy; HR, Hazard Ratio, derived from COX proportional hazards model; CI, confidence interval.
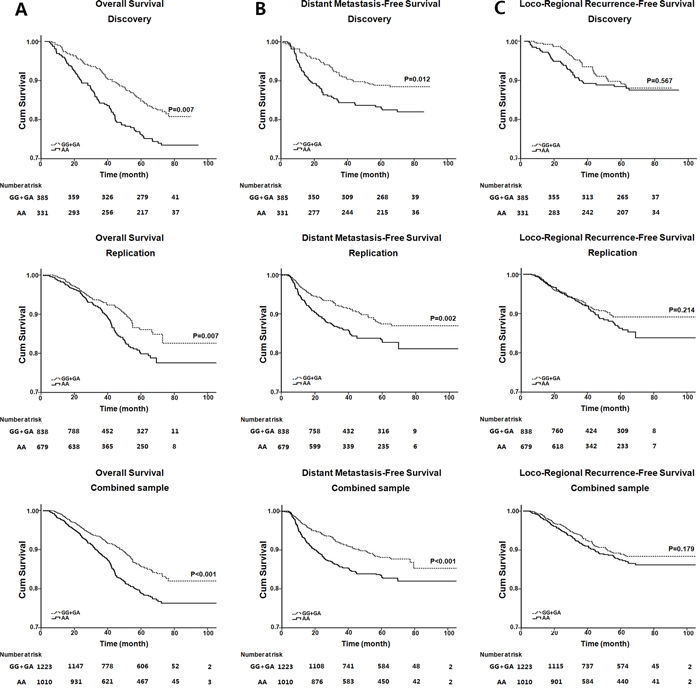
Figure 1: Kaplan–Meier survival analysis of rs3740194 in the discovery, validation and combined samples. A. Kaplan–Meier plots of overall survival in NPC patients; B. Kaplan–Meier plots of distant metastasis-free survival in NPC patients; C. Kaplan–Meier plots of loco-regional recurrence-free survival in NPC patients. P values were derived from log-rank tests.
The multivariate analysis revealed that the rs3740194 AA genotype was a significant independent predictor for the inferior overall survival (AA vs AG+GG, HR = 1.53, 95%CI = 1.23–1.89) and metastasis-free survival (AA vs AG+GG, HR = 1.60, 95%CI = 1.26–2.02). Moreover, gender was shown as an independent factor for all prognostic measures (P < 0.05, Table 4). The younger age, early T and N stages were also independent indicators for superior overall survival, whereas the advanced T and N stage were independent factors for inferior metastasis-free survival (P < 0.05, Table 4). In addition, no significant association was observed between rs3740194 genotypes and any of the selected clinical characteristics (P > 0.05, Supplementary Table S2).
Table 4: Multivariate analysis of prognostic factors associated with NPC prognosis
Variables |
OS |
DMFS |
LRRFS |
|||
HR (95% CI) |
P value |
HR (95% CI) |
P value |
HR (95% CI) |
P value |
|
Gender (male vs. female) |
1.95 (1.45–2.61) |
7.68 × 10⁻⁶ |
1.65 (1.22–2.23) |
0.001 |
1.61 (1.14–2.27) |
0.007 |
Age (≥ vs. < 50 years) |
1.85 (1.47–2.34) |
2.33 × 10⁻⁷ |
1.15 (0.90–1.45) |
0.262 |
0.98 (0.75–1.29) |
0.906 |
T status (T3-T4 vs. T1-T2) |
1.88 (1.43–2.47) |
6.12 × 10⁻⁶ |
1.40 (1.06–1.84) |
0.018 |
0.92 (0.68–1.23) |
0.560 |
N status (N2-N3 vs. N0-N1) |
1.77 (1.41–2.21) |
8.68 × 10⁻⁷ |
1.66 (1.30–2.12) |
4.99 × 10⁻⁵ |
1.22 (0.92–1.62) |
0.162 |
Radiotherapy (3D-RT vs. 2D-RT) |
0.94 (0.70–1.27) |
0.691 |
0.82 (0.60–1.12) |
0.206 |
1.39 (1.01–1.92) |
0.045 |
Inducing chemotherapy (Yes vs. No) |
1.04 (0.82–1.30) |
0.758 |
1.11 (0.87–1.43) |
0.404 |
1.08 (0.81–1.45) |
0.590 |
Concurrent chemotherapy (Yes vs. No) |
0.85 (0.67–1.08) |
0.177 |
1.00 (0.77–1.29) |
0.990 |
0.89 (0.67–1.20) |
0.459 |
Adjuvant chemotherapy (Yes vs. No) |
1.36 (0.86–2.17) |
0.192 |
1.24 (0.74–2.07) |
0.416 |
0.89 (0.43–1.82) |
0.744 |
CELF2 rs3740194 (AA vs AG) |
1.44 (1.15–0.81) |
0.001 |
1.55 (1.21–1.99) |
4.45 × 10⁻⁴ |
1.22 (0.92–1.62) |
0.167 |
CELF2 rs3740194 (AA vs GG) |
1.46 (1.15–1.86) |
1.21 × 10⁻⁴ |
1.36 (1.07–1.73) |
0.012 |
1.12 (0.87–1.43) |
0.374 |
CELF2 rs3740194 (AA vs AG+GG) |
1.53 (1.23–1.89) |
1.30 × 10⁻⁴ |
1.60 (1.26–2.02) |
8.87 × 10⁻⁵ |
1.21 (0.93–1.59) |
0.156 |
OS, Overall Survival; DMFS, Distant Metastasis-Free Survival; LRRFS, Loco-Regional Recurrence-Free Survival; 2D-RT, 2-dimensional radiotherapy; 3D-RT, 3-dimensional radiotherapy; HR, Hazard Ratio, derived from COX proportional hazards model; CI, confidence interval.
Stratified analysis was also conducted to estimate the effect of different treatment modalities on the association between rs3740194 genotypes and NPC prognosis. The most significant associations were found between OS and the patients treated with 2D-RT only (HR = 1.88, 95%CI = 1.27–2.81; P = 0.002; Table 5) and those treated with 2D-RT plus CCT (HR = 1.60, 95% CI = 1.13–2.26; P = 0.007; Table 5). However, no significant differences were observed among subgroups (P > 0.05 for heterogeneity test), suggesting that the effect of different treatment regimes on the association of rs3740194 and NPC prognosis is minimal.
Table 5: Analysis on the association between rs3740194 genotype and NPC prognosis stratified by treatment modality
RT |
CRT |
rs3740194 |
OS |
DMFS |
LRRFS |
|||||
AA (%) |
AG (%) |
GG (%) |
HR (95% CI)a |
P value |
HR (95% CI)a |
P value |
HR (95% CI)a |
P value |
||
2D |
No |
235 (45.1) |
240 (46.1) |
46 (8.80) |
1.88 (1.27–2.81) |
0.002 |
1.91 (1.16–3.17) |
0.012 |
1.07 (0.69–1.65) |
0.761 |
2D |
ICT |
329 (43.7) |
342 (45.4) |
82 (10.9) |
1.17 (0.90–1.51) |
0.247 |
1.26 (0.95–1.67) |
0.105 |
1.40 (0.96–2.04) |
0.078 |
2D |
CCT |
300 (44.8) |
308 (46.0) |
62 (9.20) |
1.60 (1.13–2.26) |
0.007 |
1.39 (0.99–1.96) |
0.056 |
1.24 (0.83–1.85) |
0.296 |
2D |
ACT |
36 (47.4) |
38 (50.0) |
2 (2.60) |
1.60 (0.65–3.93) |
0.310 |
1.64 (0.61–4.41) |
0.329 |
0.55 (0.12–2.59) |
0.446 |
3D |
No |
54 (48.2) |
49 (43.8) |
9 (8.00) |
1.58 (0.41–6.07) |
0.502 |
1.34 (0.35–5.09) |
0.670 |
1.24 (0.56–2.72) |
0.596 |
3D |
ICT |
99 (45.6) |
97 (44.7) |
21 (9.70) |
1.67 (0.90–3.12) |
0.104 |
1.92 (0.90–4.10) |
0.092 |
0.91 (0.53–1.58) |
0.748 |
3D |
CCT |
178 (48.2) |
159 (43.1) |
32 (8.70) |
1.52 (0.95–2.46) |
0.084 |
1.77 (1.04–3.01) |
0.035 |
0.89 (0.52–1.53) |
0.681 |
3D |
ACT |
9 (50.0) |
8 (44.4) |
1 (5.60) |
N/A |
0.999 |
N/A |
1.000 |
N/A |
1.000 |
Pheterogeneity |
0.660 |
0.854 |
0.811 |
|||||||
aCodominant model; adjusted for gender, age, and tumor stage. OS, Overall Survival; DMFS, Distant Metastasis-Free Survival; LRRFS, Loco-Regional Recurrence-Free Survival; RT, Radiotherapy; CRT, Chemoradiotherapy; 2D, 2-dimensional; 3D, 3-dimensional; ICT, inducing chemotherapy; CCT, concurrent chemotherapy; ACT, adjuvant chemotherapy; HR, Hazard Ratio; CI, confidence interval.
DISCUSSION
Although NPC tumor cells are sensitive to chemo/radiotherapy, a proportion of NPC patients, especially those at later stages, develop distant metastasis and loco-regional recurrence, leading to poor outcomes. Identification of effective biomarkers for treatment optimizations is important to improve the NPC prognosis. Herein, we carried out a two-stage survival analysis with large sample size and explored the association of polymorphisms of CELF genes with NPC outcome. To the best of our knowledge, this is the first study to demonstrate associations of genetic variations in CELF genes or RBPs with NPC outcome. By combining a total of 2, 237 cases, we found that rs3740194 at CELF2 locus was significantly associated with NPC overall survival rate and metastasis-free survival rate (both P < 0.001), and further consistently, rs3740194 at CELF2 locus was an independent prognostic factor for overall survival and metastasis-free survival. These suggest that the CELF2 might play important roles in the metastasis and invasion of NPC, which have been shown as the major causes of its poor survival [8].
Previous studies have reported that RBPs are involved in cancer by modulating cell growth and proliferation [24]. As a RBP, CELF2 (also known as CUGBP2, ETR3, BRUNOL2, Napor2) is a family member of CELF that was identified as a transcript highly expressed in neuroblastoma cells undergoing colchicine-induced apoptosis [25, 26]. CELF2 is ubiquitously expressed, while overexpression of CELF2 leads to mitotic catastrophe and apoptosis of cells [21, 27, 28]. In colon cancer cells, CELF2 expression is consistently reduced during neoplastic transformation, and suppression of CELF2 expression decreased radiation-induced apoptosis, suggesting it is a potential tumor suppressor protein [22, 29]. Supportively, overexpression of CELF2 resulted in mitotic catastrophe of pancreatic cancer cells [18]. CELF2 shares similar structure with HuR, which is one of the well-known RBPs that play important roles in tumor development [30, 31]. CELF2 can bind to the ARE sequence in the 3′-UTR of cyclooxygenase-2 (COX-2), increase COX-2 mRNA stability, and however, inhibit the translation of COX-2. By contrast, HuR specifically interacted with the AU-rich element (ARE) of COX-2, leading to increased expression of COX-2 [32]. The expression of cytoplasmic HuR was significantly associated with COX-2 expression in tumors and showed a correlation with lymphatic invasion and metastasis [33, 34]. Furthermore, CELF2 competed with HuR for binding to COX-2 mRNA and prevented its translation [35].
To further investigate the functional role of rs3740194, which is located on the fourth intron of CELF2, we conducted eQTL analyses in human lymphoblastoid cell lines of 45 unrelated Han Chinese individuals. Gene expression data were obtained from the NCBI Gene Expression Omnibus (series number: GSE6536; http://www.ncbi.nlm.nih.gov/geo/), and SNP genotype data were derived from the corresponding HapMap dataset (Rel28, PhaseII+III, August 10, Build 36; http://hapmap.ncbi.nlm.nih.gov/). The eQTL effects were classified as cis or trans, if they occurred within an expanded region (±1 Mb) surrounding rs3740194, or outside this region, respectively. However, none of significant cis-eQTLs or trans-eQTLs was observed after Benjamini-Hochberg correction for multiple testing (P < 0.05, data not shown). These results might be limited by the single cell line data and incomplete coverage of the probe sets at this region. Further investigations are warranted to reveal the functional relevance of the SNP association.
Taken together, we carried out a two-stage survival analysis to address the associations between the polymorphisms of CELF family members and NPC prognosis, and discovered that NPC patients with AA genotype of CELF2 gene polymorphism rs3740194 correlated with the inferior overall survival and metastasis-free survival. The finding suggests that CELF2 might be another potential prognostic predictor of NPC, which could be applied for stratified therapeutic studies attempting to develop better treatment and better outcome for NPC. In addition, we acknowledged that our study is limited as a retrospective study in a single center. Further studies in either prospective manner or multicenter may help to validate our findings.
MATERIALS AND METHODS
Subject recruitment
All subjects were histologically diagnosed with NPC and subsequently treated at Sun Yat-sen University Cancer Center (SYSUCC) between January 2002 and December 2010. Individuals were excluded if they reported with history of cancer, and radiotherapy or chemotherapy at diagnosis. A total of 2, 237 NPC patients were enrolled, in which 717 patients were randomly selected into the discovery stage and the remaining 1, 520 patients were treated as validation sample. All subjects were staged according to the sixth edition of UICC/AJCC TNM staging system [36]. The follow-up data was collected every six months after diagnosis or until death. Local recurrence was confirmed by fiberoptic endoscopy, magnetic resonance imaging (MRI) and biopsy, whereas distant metastases were diagnosed by clinical symptoms, physical examination, and imaging methods including CT-scan, bone scan, abdominal sonography or 18F-fluorodeoxyglucose positron emission tomography and computed tomography (PET-CT). This study was approved by the ethics committees of SYSUCC. Informed consent documents were obtained from all of the subjects.
SNP selection and genotyping
A total of 734 SNPs located in the coding regions and untranslated-regions (5′-UTR and 3′-UTR) of six CELF members were retrieved from the International HapMap database (Rel28, PhaseII+III, August 10, Build 36; http://hapmap.ncbi.nlm.nih.gov/) and the NCBI database (dbSNP version 126, http://www.ncbi.nlm.nih.gov), if their minor allele frequencies (MAF) in Chinese Han population (CHB) were above 5%. Subsequently, 114 tagging SNPs were identified by linkage disequilibrium (LD) analysis using Haploview software (version 4.2; r2 < 0.5).
Venous blood sample was collected from each patient prior to any treatment. DNA was extracted from blood samples using the QIAamp DNA Blood Midi Kit (QIAGEN, Valencia, CA). In discovery stage, candidate SNPs were genotyped in 717 NPC patients by using GoldenGate® Genotyping Assay (Illumina Inc, San Diego, CA) according to manufacturer's instructions. Two SNPs were excluded due to genotyping failure (call rates < 95%). The overall call rates ranged from 98.7% to 100% for the remaining 112 SNPs. Five promising SNPs with significant P-value (<0.05) in discovery stage were further genotyped in the validation sample of 1, 520 NPC patients, using TaqMan assay on ABI PRISM 7900 HT platform (Applied Biosystems Inc.). The details of primers and probes were shown in Supplementary Table S3.
Statistical analysis
Minor allele frequency was calculated and Hardy–Weinberg equilibrium (HWE) was tested for each selected SNP using PLINK software (version 1.07). The analyses of association between candidate SNPs and length of survival were carried out under different genetic models (Supplementary Table S4). Hazard ratios (HRs) and 95% confidence intervals (95% CIs) were calculated by Cox proportional hazards regression model with adjustments for age, sex, clinical stage, and treatment modality, considering their influence on the length of survival. Comparisons of demographic characteristics, selected variables and genotypes were analyzed by the Wilcoxon rank-sum test (for continuous variables) or χ2 test (for categorical variables). The survival curves were generated by Kaplan-Meier methods, and P values were assessed by log-rank tests. The hazard ratios (HRs) and 95% confidence intervals (95% CIs) for univariate analyses were calculated using Cox proportional hazards model. Multivariate survival analyses were adjusted for age, gender, T stage, N stage, and treatment modality. These analyses were carried out in a two-sided manner by using R version 3.0.2.
ACKNOWLEDGMENTS AND FUNDING
This work is partially supported by the National Basic Research Program of China (973 plan; 2011CB504302), the National High Technology Research and Development Program of China (863 plan; 2012AA02A206 and 2012AA02A501), National Natural Science Foundation of China (No: 81222035), and the Program for New Century Excellent Talents in University (NCET-11-0529). The funders had no role in study design, data collection and analysis, decision to publish, or preparation of the manuscript.
CONFLICTS OF INTEREST
The authors declare no conflict of interest.
REFERENCES
1. Wei WI, Sham JS. Nasopharyngeal carcinoma. Lancet. 2005; 365:2041–2054.
2. Yoshizaki T, Ito M, Murono S, Wakisaka N, Kondo S, Endo K. Current understanding and management of nasopharyngeal carcinoma. Auris Nasus Larynx. 2012; 39:137–144.
3. Chang ET, Adami HO. The enigmatic epidemiology of nasopharyngeal carcinoma. Cancer Epidemiol Biomarkers Prev. 2006; 15:1765–1777.
4. Lee AW, Lin JC, Ng WT. Current management of nasopharyngeal cancer. Semin Radiat Oncol. 2012; 22:233–244.
5. Bae WK, Hwang JE, Shim HJ, Cho SH, Lee JK, Lim SC, Chung WK, Chung IJ. Phase II study of docetaxel, cisplatin, and 5-FU induction chemotherapy followed by chemoradiotherapy in locoregionally advanced nasopharyngeal cancer. Cancer Chemother Pharmacol. 2010; 65:589–595.
6. Zheng J, Wang G, Yang GY, Wang D, Luo X, Chen C, Zhang Z, Li Q, Xu W, Li Z, Wang D. Induction chemotherapy with nedaplatin with 5-FU followed by intensity-modulated radiotherapy concurrent with chemotherapy for locoregionally advanced nasopharyngeal carcinoma. Jpn J Clin Oncol. 2010; 40:425–431.
7. Airoldi M, Gabriele P, Gabriele AM, Garzaro M, Raimondo L, Pedani F, Beatrice F, Pecorari G, Giordano C. Induction chemotherapy with carboplatin and taxol followed by radiotherapy and concurrent weekly carboplatin + taxol in locally advanced nasopharyngeal carcinoma. Cancer Chemother Pharmacol. 2011; 67:1027–1034.
8. Lee AW, Lau WH, Tung SY, Chua DT, Chappell R, Xu L, Siu L, Sze WM, Leung TW, Sham JS, Ngan RK, Law SC, Yau TK, et al. Preliminary results of a randomized study on therapeutic gain by concurrent chemotherapy for regionally-advanced nasopharyngeal carcinoma: NPC-9901 Trial by the Hong Kong Nasopharyngeal Cancer Study Group. J Clin Oncol. 2005; 23:6966–6975.
9. Wu Z, Su Y, Zeng RF, Gu MF, Huang SM. Prognostic value of tumor volume for patients with nasopharyngeal carcinoma treated with concurrent chemotherapy and intensity-modulated radiotherapy. J Cancer Res Clin Oncol. 2014; 140:69–76.
10. Savas S, Liu G. Genetic variations as cancer prognostic markers: review and update. Hum Mutat. 2009; 30:1369–1377.
11. Tse KP, Tsang NM, Chen KD, Li HP, Liang Y, Hsueh C, Chang KP, Yu JS, Hao SP, Hsieh LL, Chang YS. MCP-1 Promoter Polymorphism at 2518 is associated with metastasis of nasopharyngeal carcinoma after treatment. Clin Cancer Res. 2007; 13:6320–6326.
12. Ghandri N, Gabbouj S, Farhat K, Bouaouina N, Abdelaziz H, Nouri A, Chouchane L, Hassen E. Association of HLA-G polymorphisms with nasopharyngeal carcinoma risk and clinical outcome. Hum Immunol. 2011; 72:150–158.
13. Silvera D, Formenti SC, Schneider RJ. Translational control in cancer. Nat Rev Cancer. 2010; 10:254–266.
14. Musunuru K. Cell-specific RNA-binding proteins in human disease. Trends Cardiovasc Med. 2003; 13:188–195.
15. Barreau C, Paillard L, Mereau A, Osborne HB. Mammalian CELF/Bruno-like RNA-binding proteins: molecular characteristics and biological functions. Biochimie. 2006; 88:515–525.
16. Hwang DM, Hwang WS, Liew CC. Single pass sequencing of a unidirectional human fetal heart cDNA library to discover novel genes of the cardiovascular system. J Mol Cell Cardiol. 1994; 26:1329–1333.
17. Timchenko LT, Miller JW, Timchenko NA, DeVore DR, Datar KV, Lin L, Roberts R, Caskey CT, Swanson MS. Identification of a (CUG)n triplet repeat RNA-binding protein and its expression in myotonic dystrophy. Nucleic Acids Res. 1996; 24:4407–4414.
18. Subramaniam D, Ramalingam S, Linehan DC, Dieckgraefe BK, Postier RG, Houchen CW, Jensen RA, Anant S. RNA binding protein CUGBP2/CELF2 mediates curcumin-induced mitotic catastrophe of pancreatic cancer cells. PLoS One. 2011; 6:e16958.
19. Liu Y, Huang H, Yuan B, Luo T, Li J, Qin X. Suppression of CUGBP1 inhibits growth of hepatocellular carcinoma cells. Clin Invest Med. 2014; 37:E10–18.
20. Talwar S, Balasubramanian S, Sundaramurthy S, House R, Wilusz CJ, Kuppuswamy D, D’Silva N, Gillespie MB, Hill EG, Palanisamy V. Overexpression of RNA-binding protein CELF1 prevents apoptosis and destabilizes pro-apoptotic mRNAs in oral cancer cells. RNA Biol. 2013; 10:277–286.
21. Subramaniam D, Natarajan G, Ramalingam S, Ramachandran I, May R, Queimado L, Houchen CW, Anant S. Translation inhibition during cell cycle arrest and apoptosis: Mcl-1 is a novel target for RNA binding protein CUGBP2. Am J Physiol Gastrointest Liver Physiol. 2008; 294:G1025–1032.
22. Natarajan G, Ramalingam S, Ramachandran I, May R, Queimado L, Houchen CW, Anant S. CUGBP2 downregulation by prostaglandin E2 protects colon cancer cells from radiation-induced mitotic catastrophe. Am J Physiol Gastrointest Liver Physiol. 2008; 294:G1235–1244.
23. Jiao W, Zhao J, Wang M, Wang Y, Luo Y, Zhao Y, Tang D, Shen Y. CUG-binding protein 1 (CUGBP1) expression and prognosis of non-small cell lung cancer. Clin Transl Oncol. 2013; 15:789–795.
24. Lukong KE, Chang KW, Khandjian EW, Richard S. RNA-binding proteins in human genetic disease. Trends Genet. 2008; 24:416–425.
25. Choi DK, Ito T, Mitsui Y, Sakaki Y. Fluorescent differential display analysis of gene expression in apoptotic neuroblastoma cells. Gene. 1998; 223:21–31.
26. Choi DK, Ito T, Tsukahara F, Hirai M, Sakaki Y. Developmentally-regulated expression of mNapor encoding an apoptosis-induced ELAV-type RNA binding protein. Gene. 1999; 237:135–142.
27. Ramalingam S, Natarajan G, Schafer C, Subramaniam D, May R, Ramachandran I, Queimado L, Houchen CW, Anant S. Novel intestinal splice variants of RNA-binding protein CUGBP2: isoform-specific effects on mitotic catastrophe. Am J Physiol Gastrointest Liver Physiol. 2008; 294:G971–981.
28. Lu X, Timchenko NA, Timchenko LT. Cardiac elav-type RNA-binding protein (ETR-3) binds to RNA CUG repeats expanded in myotonic dystrophy. Hum Mol Genet. 1999; 8:53–60.
29. Ramalingam S, Ramamoorthy P, Subramaniam D, Anant S. Reduced Expression of RNA Binding Protein CELF2, a Putative Tumor Suppressor Gene in Colon Cancer. Immunogastroenterology. 2012; 1:27–33.
30. Abdelmohsen K, Gorospe M. Posttranscriptional regulation of cancer traits by HuR. Wiley Interdiscip Rev RNA. 2010; 1:214–229.
31. Lopez de Silanes I, Lal A, Gorospe M. HuR: post-transcriptional paths to malignancy. RNA Biol. 2005; 2:11–13.
32. Dixon DA, Tolley ND, King PH, Nabors LB, McIntyre TM, Zimmerman GA, Prescott SM. Altered expression of the mRNA stability factor HuR promotes cyclooxygenase-2 expression in colon cancer cells. J Clin Invest. 2001; 108:1657–1665.
33. Lim SJ, Lee SH, Joo SH, Song JY, Choi SI. Cytoplasmic expression of HuR is related to cyclooxygenase-2 expression in colon cancer. Cancer Res Treat. 2009; 41:87–92.
34. Cha JD, Li S, Cha IH. Association between expression of embryonic lethal abnormal vision-like protein HuR and cyclooxygenase-2 in oral squamous cell carcinoma. Head Neck. 2011; 33:627–637.
35. Sureban SM, Murmu N, Rodriguez P, May R, Maheshwari R, Dieckgraefe BK, Houchen CW, Anant S. Functional antagonism between RNA binding proteins HuR and CUGBP2 determines the fate of COX-2 mRNA translation. Gastroenterology. 2007; 132:1055–1065.
36. Sobin LH. TNM, sixth edition: new developments in general concepts and rules. Semin Surg Oncol. 2003; 21:19–22.