
INTRODUCTION
Adrenocortical carcinoma (ACC) represents a rare malignancy with a very poor prognosis. Resectability is the prime determinant of prognosis. For patients with disseminated disease, chemotherapy options are few and lack sufficient efficacy. Mitotane, a cytotoxic drug with a not well documented mechanism of action [1], is the conventional therapy. The toxicity of mitotane has been a major limit to its suitability in the treatment of ACC patients. Severe side-effects, of either the gastrointestinal or the nervous system, have been frequently reported, and many patients are not able to take the drug regularly [2, 3]. Recently, monoclonal antibodies targeting insulin-like growth factor (IGF) receptor (IGF1R) have been tested in clinical trials, however, they provided a limited effectiveness in refractory patients [4]. Rationale for targeting IGF1R comes from the observation that IGFII [5] is overexpressed in ACC. IGFII effects are mediated through its receptor IGF1R resulting in activation of the PI3K/AKT/mTOR cascade, the RAS/MAPK and the PLC/PKC pathways [6]. We have recently demonstrated that activation of these pathways can be triggered by the estrogen receptor alpha (ESR1) [7], a gene overexpressed in ACC that mediates estrogen-dependent proliferative effects [7, 8]. Our in vitro experiments demonstrated that ESR1 knock down was more effective than an IGF1R antibody in controlling H295R cell proliferation [7]. Targeting ESR1 in vivo using tamoxifen, a selective estrogen receptor modulator (SERM), was effective in reducing H295R xenografts growth [7].
It is well known that tamoxifen and its active metabolite 4-hydroxytamoxifen (OHT), not only exert antiestrogenic activity [9], but also act as full agonist on the G protein-coupled estrogen receptor GPR30 (from the GPER gene) [10–14]. Then, can Tamoxifen effects depend on GPER activation? GPER can mediate rapid E2-induced non-genomic signaling events, including stimulation of adenylyl cyclase, mobilization of intracellular calcium (Ca2+) stores and activation of mitogen-activated protein kinase (MAPK) and phosphoinositide 3-kinase (PI3K) signaling pathways [15–17]. GPER exhibits prognostic utility in endometrial [18], ovarian [19], and breast cancer [20] and can modulate growth of hormonally responsive cancer cells [10, 11, 21, 22]. Expression of GPER has been characterized in the outer zona glomerulosa (ZG) and in the medulla of the human adrenal [23], however its expression status in ACC is not known.
A non-steroidal, high-affinity GPER agonist G-1 (1-[4-(6-bromobenzo [1, 3]dioxol-5yl)-3a, 4, 5, 9b-tetrahydro-3H-cyclopenta-[c]quinolin-8-yl]-ethanone) has been developed to dissect GPER-mediated estrogen responses from those mediated by classic estrogen receptors [24]. The biological effects triggered by G-1 appear cell type specific and dependent on the ERs expression pattern [25–29]. By using G-1, in this study we wanted to investigate the effects of GPER activation on ACC growth.
RESULTS
G-1 treatment decreases H295R cell growth in vitro and in vivo
We first examined GPER expression in human ACCs and in H295R cells. By western blot analysis (Fig. 1A) and real time RT-PCR (Fig. 1B–1C) we demonstrated that GPER is expressed in normal adrenal, in human ACCs and in H295R cells at variable levels. Effects of G-1 on cell viability and proliferation were tested using increasing concentrations (0.01-0.1-1 μM) for different times (24-48-72 h) (Fig. 1D–1E). Of the different doses tested only 1 μM caused a time-dependent reduction in H295R cell growth. Doses higher than 1uM did not show any more pronounced effect (data not shown). Knocking down of GPER gene expression, using a specific shRNA, (shGPER) was assessed by western blot analysis and revealed a substantial decrease in protein content compared to the control shRNA (insert, Fig. 1F). However, GPER silencing was able to only partially abrogate the inhibitory effects exerted by G-1 on H295R cell proliferation (Fig. 1F)
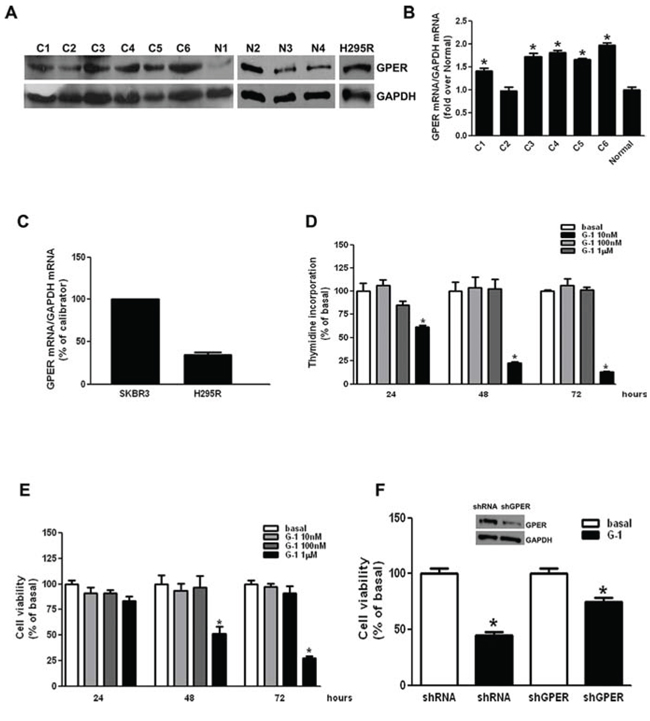
Figure 1: G-1 treatment decreases H295R cell growth in vitro. A. Western blot analysis of GPER was performed on 50 μg of total proteins extracted from normal adrenal, ACCs and H295R cells. GAPDH was used as a loading control. B-C. GPER mRNA expression in normal adrenal and ACCs (B), H295R and SKBR3 (positive control) cells (C) was analyzed by real time RT-PCR. Each sample was normalized to its GAPDH RNA content. Final results are expressed as n-fold differences of gene expression relative to calibrator. Data represent the mean + SE of values from at least three separate RNA samples; *P < 0.05, versus calibrator). D-E. H295R cells were treated with G-1 (0.01–1 μM) for different times (24, 48 and 72 h). Cell proliferation was evaluated by [3H]Thymidine incorporation (D) and MTT (E) assays. Results were expressed as mean + SE of three independent experiments each performed in triplicate. Statistically significant differences are indicated (*P < 0.05 versus basal). F. MTT assay was performed on H295R cells, which were previously transfected for 72 h in the presence of control vector (shRNA) or shGPER. Twenty-four hours after transfection cells were treated in 2.5% DCC-FBS medium for 48 h with G-1 (1 μM). Results were expressed as mean + SE of three independent experiments each performed in triplicate. (*p < 0.05 versus basal). The insert shows a Western blotting assay on H295R protein extracts evaluating the expression of GPER receptor in the presence of shRNA or of shGPER. GAPDH was used as a loading control.
H295R cells were used to generate xenograft tumors in athymic nude mice. Twenty one days after tumor grafting all mice developed a detectable tumor and were randomized to be treated with either vehicle or G-1. G-1 administration produced a statistically significant decrease in tumor volume from day 14 post treatment (Fig. 2A). A trend of growth inhibition was observed thereafter. The drug was well tolerated without lethal toxicity or body weight loss during treatment (data not shown). Multi-slices T2-W MRI indicated larger tumor volume in vehicle treated animals compared to tumors from G-1 treated mice. Hyperintense large cystic area and haemorrahagic regions, that appear as dark areas in the tumor sections, were present in vehicle treated animals (Fig. 2B). Grafted tumors harvested after three-week treatment with G-1 showed a significant decrease in tumor weight compared to vehicle treated animals (Fig. 2C). Hematoxylin and eosin staining of xenograft tumors revealed some picnotic nuclei only in G-1 treated tumors (Fig. 2D). Ki-67 immunostaimning was significantly lower in G-1-treated tumors compared to control mice (value score control: 6, 6 ± 0, 89 (SD); value score G-1 treated cells: 3, 1 ± 0.55 * (SD) (*p < 0.05) (Fig. 2E).
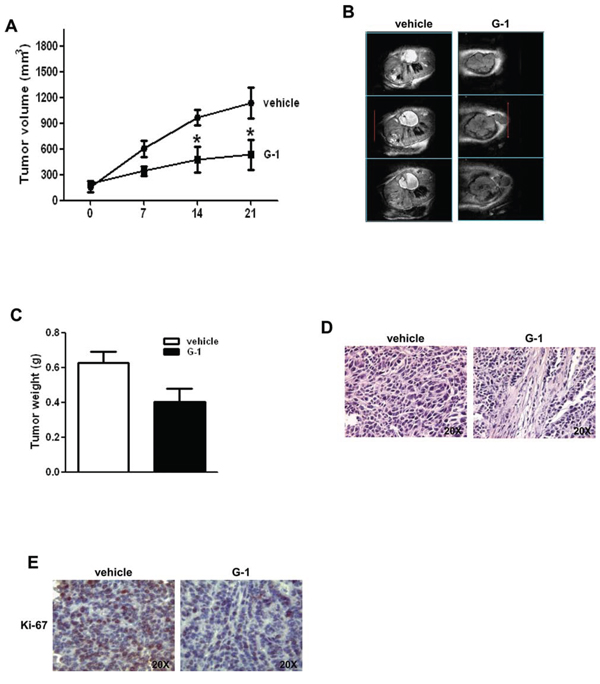
Figure 2: G-1 treatment decreases H295R cell growth in vivo. A. 6 × 10⁶ H295R cells were injected subcutaneously in the flank region of immunocompromized mice and the resulting tumors were grown to an average of 200 mm3 twenty one days after inoculation. Tumor volumes were calculated, as indicated in Materials and Methods. Values represent the mean + SE of measured tumor volume over time in the control group (filled circles, n = 10) and in the G-1-treated group (filled triangles, n = 10). Data represent pooled values from two independent experiments. (*P < 0.05 versus control at the same day of treatment). B. In vivo coronal T2-weighted spin-echo MR image of primary ACCs. Examples of multi-slices T2-W MRI (section thickness of 1 mm) tumors from vehicle treated mice (control tumors) show a larger volume compared to tumors from G-1 treated mice. Hyperintense large cystic area and haemorrhagic regions that appear as dark areas in the tumor sections, are present in the control tumors. C. After 3-week treatment tumors were harvested and weighed. Values represent the mean + SE of measured tumor weight (n = 10) (* P < 0.05 versus vehicle). D. Hematoxylin and eosin stained histologic images of H295R xenograft tumors. E. Representative pictures of Ki-67 immunohistochemical staining of H295R xenograft tumors.
G-1 induces H295R cell cycle arrest and cell death
Cell cycle analysis of H295R cells after 24 h of G-1 treatment demonstrated a cell cycle arrest in the G2 phase (Fig 3A). This effect was further confirmed by a change in the expression of cyclins, after G-1 treatment (Fig. 3B). Specifically, by western analysis we observed that G-1 treatment caused a decrease in Cyclin E (CCNE), while Cyclin B1 (CCNB1), involved in the regulation of G2 phase, was increased. CCNE and CCNB1 had similar expression pattern in protein samples extracted from xenografts tumors (Fig. 3C). Collectively these events support the idea of cells exiting G1 but remaining stuck in G2 phase. In agreement with the observation that inappropriate accumulation of B type cyclins is associated with the initiation of apoptotic pathways [30], we found that G-1 caused cell death by apoptosis. Cells were treated for 24 or 48 h with vehicle or G-1, incubated with an Annexin-V specific antibody and sorted by flow cytometry. As shown in Figure 3D the number of dead cells increased in a time dependent manner reaching about 40% of apoptotic cells 48 h after G-1 treatment (Fig. 3D).
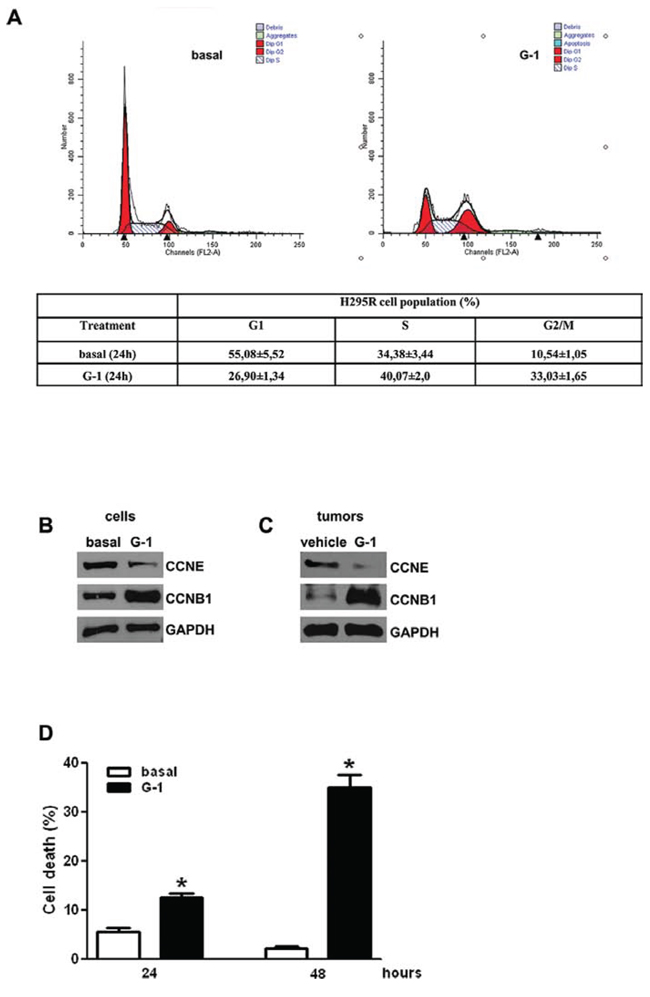
Figure 3: Effects of G-1 treatment on cell cycle distribution and on cell death. A. H295R cells were synchronized in serum-free media for 24 h and then exposed to vehicle (basal) or G-1 (1 μM) for the indicated times. The distribution of H295R cells in the cycle was determined by Flow Cytometry using Propidium Iodide stained nuclei. Table shows the distribution of H295R cell population (%) in the various phases of cell cycle. B-C. Western blot analyses of Cyclin E (CCNE) and Cyclin B1 (CCNB1) were performed equal amounts of total proteins extracted from H295R cells treated with G-1 (1 μM) for 24 h (B) and xenografts tumors (C) Blots are representative of three independent experiments with similar results. GAPDH was used as a loading control. D. Subconfluent H295R monolayers starved for 24 h were treated for the indicated times with G-1 (1 μM). Then cells were stained with Annexin V/ FITC plus PI and examined by flow cytometer. Graph represents the percentage of cell death at the different times of treatment. (* P < 0.05 versus basal).
G-1 causes cell nuclei morphological changes, DNA damage and apoptosis
G-1 ability to trigger apoptosis in H295R cells was further confirmed by evaluation of DNA fragmentation. TUNEL staining demonstrated the presence of increased positive cells in cells treated with G-1 (Fig. 4A). In addition, Hoechst staining evidenced that untreated H295R cells had round nuclei with regular contours; while nuclei from cells treated with G-1 appeared shrunken and irregularly shaped or degraded with condensed DNA. DNA gel electrophoresis extracted from G-1 treated H295R cells revealed a classic laddering pattern of inter-nucleosomal DNA fragmentation that was absent in control cells (Fig. 4B). This event was associated with an increase in Parp-1 cleavage (Fig. 4C). The presence of G-1 increased Bax expression while decreased Bcl-2 (Fig. 4D). Similarly, data obtained from western blot analysis of tumors samples overlap with those obtained in H295R cells (Fig. 4E). When the intrinsic apoptotic mechanism is triggered, Cytochrome c (Cyt c) is released from the mitochondria into the cytosol [31]. Therefore we fractionated G-1 treated H295R cell lysates into cytosolic and mitochondrial fractions and evaluated Cytochrome c release by western blot analysis (Fig. 4F). Cytochrome c levels increased in the cytosolic fraction of treated samples while decreased in the mitochondrial compartment. Cytochrome c release from mitochondria into the cytosol triggers caspase activation. After G-1 treatment we detected active Caspase 9 (Fig. 4G) as well as the executioner Caspase 3/7 (Fig. 4H).
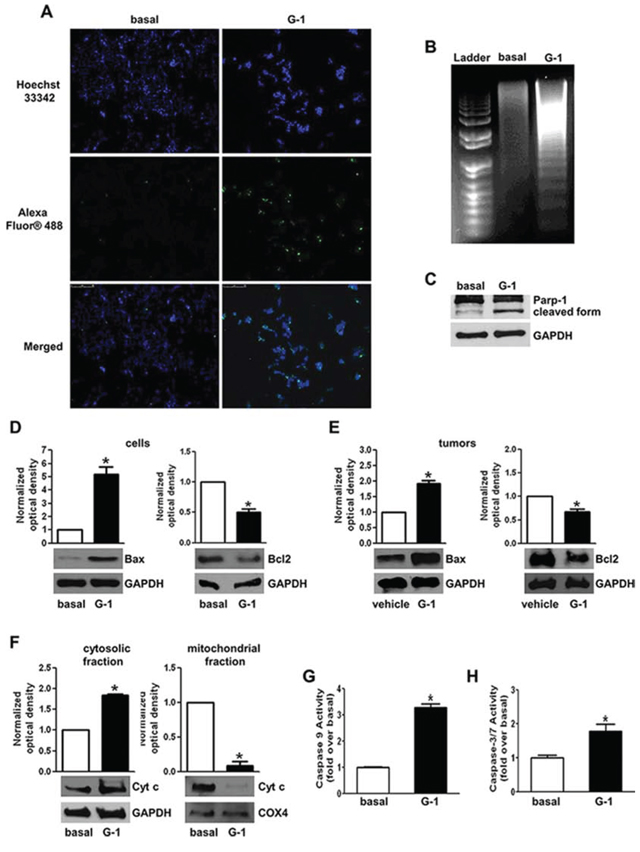
Figure 4: G-1 treatment induces apoptosis in H295R cells. A. Cells were left untreated (basal) or treated with G-1 (1 μM) for 24 h; after treatment cells were fixed with paraformaldehyde and processed for TUNEL staining. Nuclei counterstaining was performed using Hoechst 33342. Fluorescent signal was observed under a fluorescent microscope (magnification 200X). Images are from a representative experiment. B. After 48 h treatment DNA was extracted from cells and analyzed on a 1.5% agarose gel. Images are from a representative experiment. C–F. H295R cells were treated with G-1 (1 μM) for 24 h. Western blot analyses of Parp-1 (C), Bax and Bcl-2 (D). Cytochrome c (F) were performed on equal amounts of total proteins. Blots are representative of three independent experiments with similar results. Bax and Bcl-2 were analyzed on total proteins extracted from xenograft tumors (E). GAPDH was used as a loading. G-H. H295R cells were treated with G-1 (1 μM) for 24 h. Caspase 9 (G) and caspase 3/7 (H) activity was determined by a luminescent assay. Results were expressed as percentage of enzyme activity. Graphs represent mean + SE of three independent experiments each performed in triplicate. Statistically significant differences are indicated (*P < 0.05 versus basal).
G1 treatment causes sustained ERK1/2 phosphorylation
In order to define the molecular mechanism associated with G-1-induced apoptosis, we investigated the activation of MAPK family members extracellular signal-regulated kinase 1/2 (ERK1/2), which have been demonstrated to be involved in apoptosis if activated for a prolonged time [32]. As shown in Figure 5A, G-1 treatment activated ERK1/2 in a time-dependent manner as seen by the increased levels of their phosphorylation status. Activation started after 30-min of G-1 treatment and persisted for up to 24 h (Fig. 5A). ShGPER, that partially reversed G-1 effects on cell proliferation (Fig. 1E) did not affect ERK1/2 activation (Fig. 5B). Involvement of ERK1/2 in G-1-induced apoptosis of adrenocortical cancer cells was confirmed by the observation that MEK1 inhibitor, PD98059, prevented the up-regulatory effect exerted by G-1 on Bax expression (Fig. 5C).
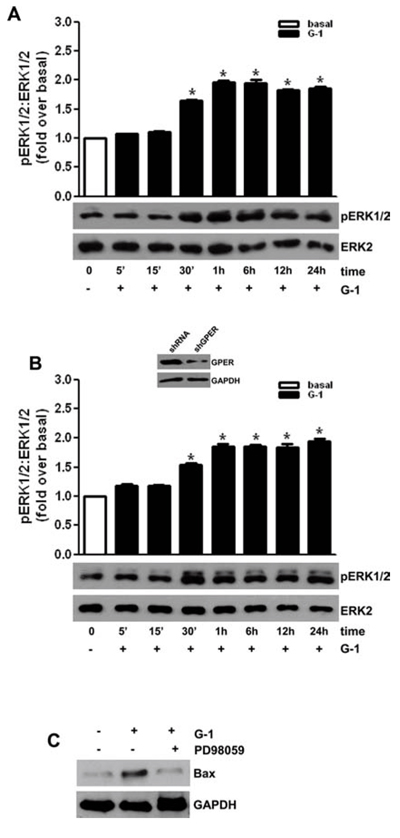
Figure 5: G-1-induced MAPK activation correlates with an increased protein expression of proapoptotic Bax. H295R cells were transfected with shRNA A. or shGPER B. for 72 h. Forty-eight hours after transfection cells were untreated (0) or treated for at the indicated time with G-1 (1 μM). Western blot analyses of pERK1/2 were performed on 10 μg of total proteins. ERK1/2 was used as a loading control. Blots are representative of three independent experiments with similar results. The insert in (B) shows a Western blot on H295R protein extracts evaluating the expression of GPER receptor in the presence of shcontrol or of shGPER. GAPDH was used as a loading control. (A-B up panels) Graphs represent means of normalized optical densities from three experiments, bars represent SE. *p < 0.05 versus basal. C., H295R cells were treated for 24 h with vehicle (−) or G-1 (1 μM) alone or combined with PD98059 (10 μM). Western blot analysis of Bax was performed on equal amounts of total proteins. GAPDH was used as a loading control. Blots are representative of three independent experiments with similar results.
DISCUSSION
Here, we demonstrated for the first time that a selective non estrogenic ligand of GPER named G-1 is able to inhibit H295R cell growth both in vitro and in vivo in a xenograft model. Starting from these results we investigated the potential role of GPER in this event.
First, we showed GPER expression both at transcriptional and post-transcriptional level in our ACC cell model represented by H295R cells as well as in normal adrenal and ACC samples. These first analyses aimed to assess only if GPER was expressed in normal and tumor adrenal and not to indicate any difference in expression levels, since overexpression of GPCR is not a common event in human diseases [20].
Recent studies have shown that activation of GPER initiates signaling cascades that, depending on the cell type, are associated with both proliferation [11, 33] and apoptosis [29, 32]. Ariazi et al. have highlighted the opposite effects played by GPER activation on cell proliferation of ERs negative and ERs positive breast cancer cells [17]. Specifically, when ERs are expressed, activation of GPER leads to inhibition of cell proliferation. On the contrary, when cells are ERs negative activation of GPER leads to an increase in cell proliferation [17]. Our work, demonstrated that micromolar concentrations of G-1 decrease H295R cell proliferation in vitro, significantly reduce ACC tumor volume in vivo and cause a marked decrease in the expression of the nuclear proliferation antigen Ki-67. Accordingly, flow cytometry analysis revealed that G-1 treatment causes changes in cellular distribution within the different phases of cell cycle. It is well established that cell cycle progression is dynamically and strictly regulated by complexes containing cyclins and cyclin dependent kinases (CDKs) [34]. Here, we found that after G-1 treatment expression of G1 phase cyclin CCNE was reduced, while G2 phase cyclin CCNB1 was increased. This observation indicates that H295R cells do not bypass G2 checkpoint. Similar data were reported for prostate cancer cells, where GPER activation by 1 μM G-1 caused cell cycle arrest at the G2 phase [35]. G2 phase arrest was followed by apoptotic cell death as indicated by positive staining for Annexin-V, nuclei morphological changes and appearance of DNA ladder pattern.
Apoptosis can be induced by extrinsic [36] and intrinsic [37] mechanisms; the latter is strictly controlled by bcl-2 family of proteins [38] that consists of both pro- (Bax, Bad, Bak, Bid) and anti-apoptotic (Bcl-2, Bcl-xl) proteins able to modulate the execution phase of the cell death pathway. Bax exerts pro-apoptotic activity by allowing Cytochrome c translocation from the mitochondria to the cytosol [39]. Cytochrome c then binds to apoptotic protease-activating factor-1 (Apaf-1) [40], which in turn associates with Procaspase 9 resulting in the activation of its enzymatic activity [41], responsible for the proteolytic activation of executioner Caspase 3 [42]. The active Caspase 3 is then involved in the cleavage of a set of proteins including Poly-(ADP) ribose polymerase-1 (Parp-1) [43]. Bcl-2, instead, exerts its anti-apoptotic activity, at least in part, by inhibiting the translocation of Bax to the mitochondria [40]. Changes in expression and/or activation of all the above mentioned biochemical markers of mitochondrial apoptotic pathway were observed in H295R cells in response to G-1 treatment.
MAPK family members ERK1/2 are part of GPER signaling [14]. Despite the well-defined role of ERK1/2 activation in proliferative pathways [44], sustained ERK1/2 phosphorylation is involved in apoptotic events [29, 32, 45]. Cagnol and Chambard have summarized more than 50 publications showing a link between prolonged ERK activation and apoptosis [46]. Specifically it can be appreciated that duration of ERK activation in promoting cell death can be different depending on cell type and stimuli. G-1 caused sustained ERK1/2 activation in H295R, this event was clearly involved in the induction of apoptosis, since chemical inhibition of MEK1/2 using PD98059 abrogated G-1 ability to induce the expression of proapoptotic factor Bax. Several reports pointed out that ERK1/2 activity can be associated with upregulation of proapoptotic members of the Bcl-2 family, such as Bax [47–49]. Moreover, ERK activity has been shown to directly affect mitochondrial function [46] by decreasing mitochondrial respiration [50, 51] and mitochondrial membrane potential [51, 52], causing mitochondrial membrane disruption and Cytochrome c release [52–54].
Interestingly, GPER silencing was not able to prevent G-1 induced ERK phosphorylation, underlying the existence of alternative targets for G-1. These targets, similarly to GPER, are able to activate ERK1/2 signaling, however for a prolonged period, and clearly deserve further investigation.
Other papers evidenced inhibitory effects exerted by G-1 on the growth of different tumor cell types in a GPER independent manner [55–57], but a precise mechanism has not been defined. Although further studies are needed to clarify the molecular mechanisms behind G-1-dependent effects, this molecule could be a viable alternative to the current limited treatment options and therapeutic efficacy for adrenocortical cancer.
In conclusion, we demonstrated that treatment of H295R cells with G-1 reduced tumor growth in vitro and in vivo through a mechanism involving not only GPER activation. G-1 clearly causes cell-cycle arrest at the G2 phase and apoptosis through a mechanism that requires sustained ERK1/2 activation. Our previously published results highlighting the ability of OHT, a known GPER agonist and ESR1 antagonist, to reduce ACC cell growth, together with the present findings indicating the inhibitory effects exerted by G-1, open up new perspectives for the development of therapies with molecules modulating estrogen receptors action for the treatment of ACC.
MATERIALS AND METHODS
Cell culture and tissues
H295R cells were obtained from Dr W.E. Rainey (University of Michigan at Ann Arbor, USA) [58]. Cells were cultured as previously described [9]. Cell monolayers were subcultured onto 100 mm dishes for phosphatase activity and laddering assay (8 × 10⁶ cells/plate), 60 mm dishes for protein and RNA extraction (4 × 10⁶ cells/plate) and 24 well culture dishes for proliferation experiments (2 × 10⁵ cells/well) and grown for 2 days. Prior to experiments, cells were starved overnight in DMEM/F-12 medium without phenol red and containing antibiotics. Cells were treated with (±)-1-[(3aR*, 4S*, 9bS*)-4-(6-Bromo-1, 3-benzodioxol-5-yl)-3a, 4, 5, 9b-tetrahydro-3H-cyclopenta[c]quinolin-8-yl]-ethanone (G-1) (1 μM) (Tocris Bioscience, Bristol, UK) in DMEM/F-12 containing FBS-DCC 2, 5% (fetal bovine serum dextran-coated charcoal-treated). Inhibitors PD98059 (PD) (10 μM) (Calbiochem, Merck KGaA, Darmstadt, Germany) was used 1 h prior to G-1. Adrenocortical tumors, removed at surgery, and normal adrenal cortex, macroscopically dissected from adrenal glands of kidney donors, were collected at the hospital-based Divisions of the University of Padua (Italy). Tissue samples were obtained with the approval of local ethics committees and consent from patients, in accordance with the Declaration of Helsinki guidelines as revised in 1983. Diagnosis of malignancy was performed according to the histopathologic criteria proposed by Weiss et al. [59] and the modification proposed by Aubert et al. [60]. Clinical data of the six ACC patients included in this study are shown in Table 1. Patient C6 terminated mitotane treatment six months after beginning of therapy for severe gastrointestinal side effects. Patients C1 and C2 were treated with chemotherapy EAP protocol (etoposide, doxorubicin, and cisplatin) + mitotane.
Table 1: Clinical data of the 6 ACC patients analyzed in this study
Sample ID |
Age(years) |
Gender |
Stage at surgery |
Syndrome |
Weiss score |
Size (cm) |
Outcome |
C1 |
41 |
M |
IV |
Cushing |
9 |
16 |
Died, 1 year |
C2 |
17 |
F |
IV |
Cushing |
9 |
14 |
Died, 18 months |
C3 |
43 |
F |
III |
None |
4 |
9 |
Died, 8 years |
C4 |
46 |
M |
III |
None |
3 |
18 |
Remission, 7 years |
C5 |
47 |
M |
IV |
Cushing |
9 |
14 |
Died, 1 year |
C6 |
57 |
M |
II |
SubclinicalCushing |
5 |
14 |
Remission, 4 years |
RNA extraction, reverse transcription and real time PCR
TRizol RNA isolation system (Invitrogen, Carlsbad, CA, USA) was used to extract total RNA from H295R, SKBR3 and ACCs. Each RNA sample was treated with DNase I (Invitrogen), and purity and integrity of the RNA were confirmed spectroscopically and by gel electrophoresis before use. One microgram of total RNA was reverse transcribed in a final volume of 30 μl using the ImProm-II Reverse transcription system kit (Promega Italia S.r.l., Milano, Italia); cDNA was diluted 1:2 in nuclease-free water, aliquoted, and stored at − 20°C. The nucleotide sequences for GPER amplification were forward, 5′-CGCTCTTCCTGCAGGTCAA-3′, and reverse, 5′-ATGTAGCGGTCGAAGCTCATC-3′ ; the nucleotide sequences for GAPDH amplification were forward, 5′-CCCACTCCTCCACCTTTGAC-3′, and reverse, 5′-TGTTGCTGTAGCCAAATTCGTT-3′. PCR reactions were performed in the iCycler iQ Detection System (Bio-Rad Laboratories S.r.l., Milano, Italia) using 0.1 μmol/L of each primer, in a total volume of 30 μl reaction mixture following the manufacturer’s recommendations. SYBR Green Universal PCR Master Mix (Bio-Rad) with the dissociation protocol was used for gene amplification; negative controls contained water instead of first-strand cDNA. Each sample was normalized to its GAPDH content. The relative gene expression levels were normalized to a calibrator (normal tissue for ACC tissues or SKBR3 for H295R cells). Final results were expressed as n-fold differences in gene expression relative to GAPDH and calibrator, calculated using the ΔΔCt method as previously shown [61].
Western blot analysis
Fifty μg of protein was subjected to western blot analysis [62]. Blots were incubated overnight at 4°C with antibodies against GPER, Cyclin E (CCNE), Cyclin B1 (CCNB1), phospho-Rb, Cytochrome c, Bax, Bcl-2, Parp1, pERK1/2-ERK2 (all from Santa Cruz Biotechnology, Santa Cruz CA, USA). Membranes were incubated with horseradish peroxidase (HRP)-conjugated secondary antibodies (Amersham Pharmacia Biotech, Piscataway, NJ) and immunoreactive bands were visualized with the ECL western blotting detection system (Amersham Pharmacia Biotech, Piscataway, NJ). To assure equal loading of proteins, membranes were stripped and incubated overnight with Glyceraldehyde 3-phosphate dehydrogenase (GAPDH) antibody (Santa Cruz Biotechnology).
Histopathological analysis
Tumors were fixed in 4% formalin, sectioned at 5 μm and stained with hematoxylin and eosin, as suggested by the manufacturer (Bio-Optica, Milan, Italy).
Immunohistochemical analysis
Paraffin-embedded sections, 5 mm thick, were mounted on slides precoated with poly-lysine, and then they were deparaffinized and dehydrated (seven to eight serial sections). Immunohistochemical experiments were performed as described [63], using mouse monoclonal Ki-67 primary antibody at 4°C over-night (Dako Italia Spa, Milano, Italy). Then, a biotinylated goat-anti-mouse IgG was applied for 1 h at room temperature, to form the avidin biotin-horseradish peroxidase complex (Vector Laboratories, CA, USA). Immunoreactivity was visualized by using the diaminobenzi-dine chromogen (Vector Laboratories). Counterstaining was carried out with hematoxylin (Bio-Optica, Milano, Italy). The primary antibody was replaced by normal rabbit serum in negative control sections.
Cytochrome c detection
Cells were treated for 24 h, fractioned and processed for Cytochrome c detection as previously reported [26]. Briefly, cells were harvested by centrifugation at 2500 rpm for 10 min at 4°C. Pellets were resuspended in 50 μl of sucrose buffer (250 mM sucrose; 10 mM Hepes; 10 mM KCl; 1.5 mM MgCl2; 1 mM EDTA; 1 mM EGTA) (all from Sigma-Aldrich, Milano, Italy) containing 20 μg/ml aprotinin, 20 μg/ml leupeptin, 1 mM PMSF and 0.05% digitonine (Sigma-Aldrich). Cells were incubated for 20 min at 4°C and then centrifuged at 13,000 rpm for 15 min at 4°C. Supernatants containing cytosolic protein fraction were transferred to new tubes and the resulting mitochondrial pellets were resuspended in 50 μl of lysis buffer (1% Triton X-100; 1 mM EDTA; 1 mM EGTA; 10 mM Tris-HCl, pH 7.4) (all from Sigma-Aldrich) containing 20 μg/ml aprotinin, 20 μg/ml leupeptin, 1 mM PMSF (Sigma-Aldrich) and then centrifuged at 13,000 rpm for 10 min at 4°C. Equal amounts of proteins were resolved by 11% SDS/polyacrylamide gel as indicated in the Western blot analysis paragraph.
Cell cycle analysis and evaluation of cell death
Subconfluent monolayers growing in 60 mm plates were depleted of serum for 24 h and treated for an additional 24 h with G-1. The cells were harvested by trypsinization and resuspended with 0.5 ml of Propidium Iodide solution (PI) (100 μg/ml) (Sigma-Aldrich) after treatment with RNase A (20 μg/ml). The DNA content was measured using a FACScan flow cytometer (Becton Dickinson, Mountain View, CA, USA) and the data acquired using CellQuest software. Cell cycle profiles were determined using ModFit LT program. Subconfluent monolayers growing in 60 mm plates were depleted of serum for 24 h and treated for 24 and 48 h with G-1. Trypsinized cells were incubated with Ligation Buffer (10 mM Hepes (pH = 7.4), 150 mM NaCl, 5 mM KCl, 1 mM MgCl2 and 1.8 mM CaCl2) containing Annexin-V-FITC (1:5000) (Santa Cruz) and with Propidium Iodide. Twenty minutes post-incubation at room temperature (RT) protected from light, samples were examined in a FACSCalibur cytometer (Becton Dickinson, Milano, Italy). Results were analyzed using CellQuest program.
Caspases 9 and 3/7 activity assay
H295R cells after treatments were subjected to caspases 9 and 3/7 activity measurement with Caspase-Glo 9 and 3/7 assay kits (Promega) and modified protocol. Briefly, the proluminescent substrate containing LEHD or DEVD sequences (sequences are in a single-letter amino acid code) are respectively cleaved by Caspases 9 and 3/7. After caspases cleavage, a substrate for luciferase (aminoluciferin) is released resulting in luciferase reaction luminescent signal production. Cells were trypsinized, harvested and then suspended in DMEM-F12 before being incubated with an equal volume of Caspase-Glo reagent (40 μl) at 37°C for 1 h. The luminescence of each sample was measured in a plate-reading luminometer (Gen5 2.01) with Synergy H1 Hybrid Reader.
TUNEL (terminal deoxynucleotidyltransferase-mediated dUTP nick-end labelling) assay
Cells were grown on glass coverslips, treated for 24 h and then washed with PBS and fixed in 4% formaldehyde for 15 min at room temperature. Fixed cells were washed with PBS and then soaked for 20 min with 0.25% of Triton X-100 in PBS. After two washes in deionized water, they were stained using the Click-iT® TUNEL Alexa Fluor® Imaging Assay (Invitrogen) according to the manufacturer’s protocol. Co-staining with Hoechst33342 was performed to analyze the nuclear morphology of the cells after the treatment. Cell nuclei were observed and imaged under an inverted fluorescence microscope (200X magnification).
Determination of DNA fragmentation
To determine the occurrence of DNA fragmentation, total DNA was extracted from control and G-1 (1 μM) treated (48 h) cells as previously described [26]. Equal amounts of DNA were analyzed by electrophoresis on a 2% agarose gel stained with Ethidium Bromide (Sigma-Aldrich).
Assessment of cell proliferation
[3H]Thymidine incorporation assay
H295R cell proliferation after G-1 treatment was directly evaluated after a 6 h incubation with 1 μCi of [3H]thymidine (Perkin- Elmer Life Sciences, Boston, MA, USA) per well as previously described [64]. Each experiment was performed in triplicate and results are expressed as percent (%) of basal.
MTT assay
The effect of G-1 on cell viability was measured using 3-[4, 5-Dimethylthiaoly]-2, 5-diphenyltetrazolium bromide (MTT) assay as previously described [7]. Briefly, cells were treated for different times as indicated in figure legends. At the end of each time point fresh MTT (Sigma-Aldrich), re-suspended in PBS, was added to each well (final concentration 0.33 mg/ml). After 30 minutes incubation, cells were lysed with 1 ml of DMSO (Sigma-Aldrich). Each experiment was performed in triplicate and the optical density was measured at 570 nm in a spectrophotometer.
Gene silencing experiments
For the gene silencing experiments, cells were plated in 12 well plates (1 × 10⁵ cells/well) for proliferation experiments or in 6 well plates (2 × 10⁵ cells/well) for Western blot analysis; cells were transfected with control vector (shRNA) or shGPER in 2, 5% DCC-FBS medium using lipofectamine 2000 transfection reagent (Invitrogen) according to the manufacturer’s recommendations for a total of 72 h. For proliferation experiments cells were transfected for 24 h and then treated for 48 h before performing MTT assay.
Xenograft model
Four-week-old nu/nu − Forkhead box N1nu female mice were obtained from Charles River Laboratories Italia (Calco, Lecco, Italy). All animals were maintained in groups of five or less and quarantined for two weeks. Mice were kept on a 12 h/12 h light/dark regimen and allowed access to food and water ad libitum. H295R cells, 6 × 10⁶, suspended in 100 μl PBS (Dulbecco’s Phosphate Buffered Saline), were combined with 30 μl of Matrigel (4 mg/ml) (Becton Dickinson) and injected subcutaneously in the shoulder of each animal. Resulting tumors were measured at regular intervals using a caliper, and tumor volume was calculated as previously described [65], using the formula: V = 0.52 (L × W2), where L is the longest axis of the tumor and W is perpendicular to the long axis. Mice were treated 21 days after cell injection, when tumors had reached an average volume of about 200 mm3. Animals were randomly assigned to be treated with vehicle or G-1 (Tocris Bioscience) at a concentration of 2 mg/kg/daily. Drug tolerability was assessed in tumor-bearing mice in terms of: a) lethal toxicity, i.e. any death in treated mice occurring before any death in control mice; b) body weight loss percentage = 100 − [(body weight on day x/body weight on day 1) × 100], where x represents a day during the treatment period [66, 67]. Animals were sacrificed by cervical dislocation 42 days after cell injection. All animal procedures were approved by Local Ethics Committee for Animal Research.
In vivo magnetic resonance analyses
Mice were anesthetized with 1–2% isofluorane in O2, 1 L/min (Forane, Abbott SpA, Latina, Italia) and underwent MRI/MRS study. MR analyses were performed at 4.7 T on Agilent Technologies system (Palo Alto, CA, USA). T2-weighted MRI was acquired using a spin echo sequence with the following parameters: TR/TE = 3000/70 ms, section thickness of 1.0 mm, number of acquisitions = 4, point resolution of 256 μm.
Scoring system
The immunostained slides of tumor samples were evaluated by light microscopy using the Allred Score [68] which combines a proportion score and an intensity score. A proportion score was assigned representing the estimated proportion of positively stained tumor cells (0 = none; 1 = 1/100; 2 = 1/100 to < 1/10; 3 = 1/10 to < 1/3; 4 = 1/3 to 2/3; 5 = > 2/3). An intensity score was assigned by the average estimated intensity of staining in positive cells (0 = none; 1 = weak; 2 = moderate; 3 = strong). Proportion score and intensity score were added to obtain a total score that ranged from 0 to 8. A minimum of 100 cells were evaluated in each slide. Six to seven serial sections were scored in a blinded manner for each sample.
Data analysis and statistical methods
All experiments were performed at least three times. Data were expressed as mean values + standard error (SE), statistical significance between control (basal) and treated samples was analyzed using GraphPad Prism 5.0 (GraphPad Software, Inc.; La Jolla, CA) software. Control and treated groups were compared using the analysis of variance (ANOVA) with Bonferroni or Dunn’s post hoc testing. A comparison of individual treatments was also performed, using Student’s t test. Significance was defined as p < 0.05.
ACKNOWLEDGMENTS
This work was supported by Associazione Italiana per la Ricerca sul Cancro (AIRC) projects n. IG10344, IG14433 to Vincenzo Pezzi and by grant to AS from Fondazione Guido Berlucchi per la Ricerca sul Cancro, research project: ‘‘Tumori del sistema endocrino’’ Borgonato di Corte Franca – Brescia, Italy to Antonio Stigliano. This work was also supported by Fondo Investimenti Ricerca di Base (FIRB) Accordi di Programma 2011, RBAP1153LS-02 from the Ministry of Education, University and Research, Rome, Italy. The funders had no role in study design, data collection and analysis, decision to publish, or preparation of the manuscript. We thank Prof. Giorgio Arnaldi, Division of Endocrinology, University of Ancona, Italy, for providing ACC tissues samples.
CONFLICTS OF INTEREST
The authors declare no conflicts of interest.
REFERENCES
1. Lehmann TP, Wrzesinski T, Jagodzinski PP. The effect of mitotane on viability, steroidogenesis and gene expression in NCIH295R adrenocortical cells. Molecular medicine reports. 2013; 7:893–900.
2. Lubitz JA, Freeman L, Okun R. Mitotane use in inoperable adrenal cortical carcinoma. Journal of the American Medical Association. 1973; 223:1109–1112.
3. Barzilay JI, Pazianos AG. Adrenocortical carcinoma. The Urologic clinics of North America. 1989; 16:457–468.
4. Haluska P. Insulin-like growth factor pathway. Journal of thoracic oncology: official publication of the International Association for the Study of Lung Cancer. 2010; 5:S478–479.
5. Barlaskar FM, Spalding AC, Heaton JH, Kuick R, Kim AC, Thomas DG, Giordano TJ, Ben-Josef E, Hammer GD. Preclinical targeting of the type I insulin-like growth factor receptor in adrenocortical carcinoma. The Journal of clinical endocrinology and metabolism. 2009; 94:204–212.
6. Pollak M. Insulin and insulin-like growth factor signalling in neoplasia. Nature reviews Cancer. 2008; 8:915–928.
7. Sirianni R, Zolea F, Chimento A, Ruggiero C, Cerquetti L, Fallo F, Pilon C, Arnaldi G, Carpinelli G, Stigliano A, Pezzi V. Targeting estrogen receptor-alpha reduces adrenocortical cancer (ACC) cell growth in vitro and in vivo: potential therapeutic role of selective estrogen receptor modulators (SERMs) for ACC treatment. The Journal of clinical endocrinology and metabolism. 2012; 97:E2238–2250.
8. Barzon L, Masi G, Pacenti M, Trevisan M, Fallo F, Remo A, Martignoni G, Montanaro D, Pezzi V, Palu G. Expression of aromatase and estrogen receptors in human adrenocortical tumors. Virchows Archiv: an international journal of pathology. 2008; 452:181–191.
9. Montanaro D, Maggiolini M, Recchia AG, Sirianni R, Aquila S, Barzon L, Fallo F, Ando S, Pezzi V. Antiestrogens upregulate estrogen receptor beta expression and inhibit adrenocortical H295R cell proliferation. Journal of molecular endocrinology. 2005; 35:245–256.
10. Vivacqua A, Bonofiglio D, Albanito L, Madeo A, Rago V, Carpino A, Musti AM, Picard D, Ando S, Maggiolini M. 17beta-estradiol, genistein, and 4-hydroxytamoxifen induce the proliferation of thyroid cancer cells through the g protein-coupled receptor GPR30. Molecular pharmacology. 2006; 70:1414–1423.
11. Vivacqua A, Bonofiglio D, Recchia AG, Musti AM, Picard D, Ando S, Maggiolini M. The G protein-coupled receptor GPR30 mediates the proliferative effects induced by 17beta-estradiol and hydroxytamoxifen in endometrial cancer cells. Molecular Endocrinology. 2006; 20:631–646.
12. Li Y, Chen Y, Zhu ZX, Liu XH, Yang L, Wan L, Lei TW, Wang XD. 4-Hydroxytamoxifen-stimulated processing of cyclin E is mediated via G protein-coupled receptor 30 (GPR30) and accompanied by enhanced migration in MCF-7 breast cancer cells. Toxicology. 2013; 309:61–65.
13. Prossnitz ER, Maggiolini M. Mechanisms of estrogen signaling and gene expression via GPR30. Molecular and cellular endocrinology. 2009; 308:32–38.
14. Lappano R, De Marco P, De Francesco EM, Chimento A, Pezzi V, Maggiolini M. Cross-talk between GPER and growth factor signaling. The Journal of steroid biochemistry and molecular biology. 2013.
15. Prossnitz ER, Barton M. Signaling, physiological functions and clinical relevance of the G protein-coupled estrogen receptor GPER. Prostaglandins & other lipid mediators. 2009; 89:89–97.
16. Prossnitz ER, Arterburn JB, Smith HO, Oprea TI, Sklar LA, Hathaway HJ. Estrogen signaling through the transmembrane G protein-coupled receptor GPR30. Annual review of physiology. 2008; 70:165–190.
17. Ariazi EA, Brailoiu E, Yerrum S, Shupp HA, Slifker MJ, Cunliffe HE, Black MA, Donato AL, Arterburn JB, Oprea TI, Prossnitz ER, Dun NJ, Jordan VC. The G protein-coupled receptor GPR30 inhibits proliferation of estrogen receptor-positive breast cancer cells. Cancer research. 2010; 70:1184–1194.
18. Smith HO, Leslie KK, Singh M, Qualls CR, Revankar CM, Joste NE, Prossnitz ER. GPR30: a novel indicator of poor survival for endometrial carcinoma. American journal of obstetrics and gynecology. 2007; 196:386. e381–389, discussion e389–311.
19. Smith HO, Arias-Pulido H, Kuo DY, Howard T, Qualls CR, Lee SJ, Verschraegen CF, Hathaway HJ, Joste NE, Prossnitz ER. GPR30 predicts poor survival for ovarian cancer. Gynecologic oncology. 2009; 114:465–471.
20. Filardo EJ, Graeber CT, Quinn JA, Resnick MB, Giri D, DeLellis RA, Steinhoff MM, Sabo E. Distribution of GPR30, a seven membrane-spanning estrogen receptor, in primary breast cancer and its association with clinicopathologic determinants of tumor progression. Clinical cancer research: an official journal of the American Association for Cancer Research. 2006; 12:6359–6366.
21. Albanito L, Madeo A, Lappano R, Vivacqua A, Rago V, Carpino A, Oprea TI, Prossnitz ER, Musti AM, Ando S, Maggiolini M. G protein-coupled receptor 30 (GPR30) mediates gene expression changes and growth response to 17beta-estradiol and selective GPR30 ligand G-1 in ovarian cancer cells. Cancer research. 2007; 67:1859–1866.
22. Thomas P, Pang Y, Filardo EJ, Dong J. Identity of an estrogen membrane receptor coupled to a G protein in human breast cancer cells. Endocrinology. 2005; 146:624–632.
23. Baquedano MS, Saraco N, Berensztein E, Pepe C, Bianchini M, Levy E, Goni J, Rivarola MA, Belgorosky A. Identification and developmental changes of aromatase and estrogen receptor expression in prepubertal and pubertal human adrenal tissues. The Journal of clinical endocrinology and metabolism. 2007; 92:2215–2222.
24. Bologa CG, Revankar CM, Young SM, Edwards BS, Arterburn JB, Kiselyov AS, Parker MA, Tkachenko SE, Savchuck NP, Sklar LA, Oprea TI, Prossnitz ER. Virtual and biomolecular screening converge on a selective agonist for GPR30. Nature chemical biology. 2006; 2:207–212.
25. Chimento A, Casaburi I, Rosano C, Avena P, De Luca A, Campana C, Martire E, Santolla MF, Maggiolini M, Pezzi V, Sirianni R. Oleuropein and hydroxytyrosol activate GPER/ GPR30-dependent pathways leading to apoptosis of ER-negative SKBR3 breast cancer cells. Molecular nutrition & food research. 2014; 58:478–489.
26. Chimento A, Sirianni R, Casaburi I, Ruggiero C, Maggiolini M, Ando S, Pezzi V. 17beta-Estradiol activates GPER- and ESR1-dependent pathways inducing apoptosis in GC-2 cells, a mouse spermatocyte-derived cell line. Molecular and cellular endocrinology. 2012; 355:49–59.
27. Chimento A, Sirianni R, Zolea F, Bois C, Delalande C, Ando S, Maggiolini M, Aquila S, Carreau S, Pezzi V. Gper and ESRs are expressed in rat round spermatids and mediate oestrogen-dependent rapid pathways modulating expression of cyclin B1 and Bax. International journal of andrology. 2011; 34:420–429.
28. Chimento A, Sirianni R, Delalande C, Silandre D, Bois C, Ando S, Maggiolini M, Carreau S, Pezzi V. 17 beta-estradiol activates rapid signaling pathways involved in rat pachytene spermatocytes apoptosis through GPR30 and ER alpha. Molecular and cellular endocrinology. 2010; 320:136–144.
29. Chimento A, Casaburi I, Bartucci M, Patrizii M, Dattilo R, Avena P, Ando S, Pezzi V, Sirianni R. Selective GPER activation decreases proliferation and activates apoptosis in tumor Leydig cells. Cell death & disease. 2013; 4:e747.
30. Ling YH, Jiang JD, Holland JF, Perez-Soler R. Arsenic trioxide produces polymerization of microtubules and mitotic arrest before apoptosis in human tumor cell lines. Molecular pharmacology. 2002; 62:529–538.
31. Oberst A, Bender C, Green DR. Living with death: the evolution of the mitochondrial pathway of apoptosis in animals. Cell death and differentiation. 2008; 15:1139–1146.
32. Chen JR, Plotkin LI, Aguirre JI, Han L, Jilka RL, Kousteni S, Bellido T, Manolagas SC. Transient versus sustained phosphorylation and nuclear accumulation of ERKs underlie anti-versus pro-apoptotic effects of estrogens. The Journal of biological chemistry. 2005; 280:4632–4638.
33. Albanito L, Lappano R, Madeo A, Chimento A, Prossnitz ER, Cappello AR, Dolce V, Abonante S, Pezzi V, Maggiolini M. G-protein-coupled receptor 30 and estrogen receptor-alpha are involved in the proliferative effects induced by atrazine in ovarian cancer cells. Environmental health perspectives. 2015; 123:493–9.
34. John PC, Mews M, Moore R. Cyclin/Cdk complexes: their involvement in cell cycle progression and mitotic division. Protoplasma. 2001; 216:119–142.
35. Chan QK, Lam HM, Ng CF, Lee AY, Chan ES, Ng HK, Ho SM, Lau KM. Activation of GPR30 inhibits the growth of prostate cancer cells through sustained activation of Erk1/2, c-jun/c-fos-dependent upregulation of p21, and induction of G(2) cell-cycle arrest. Cell death and differentiation. 2010; 17:1511–1523.
36. Kim R, Emi M, Tanabe K, Murakami S, Uchida Y, Arihiro K. Regulation and interplay of apoptotic and non-apoptotic cell death. The Journal of pathology. 2006; 208:319–326.
37. Fadeel B, Orrenius S. Apoptosis: a basic biological phenomenon with wide-ranging implications in human disease. Journal of internal medicine. 2005; 258:479–517.
38. Cory S, Adams JM. The Bcl family: regulators of the cellular life-or-death switch. Nature reviews Cancer. 2002; 2:647–656.
39. Antonsson B, Montessuit S, Lauper S, Eskes R, Martinou JC. Bax oligomerization is required for channel-forming activity in liposomes and to trigger cytochrome c release from mitochondria. The Biochemical journal. 2000; 2:271–278.
40. Wang X. The expanding role of mitochondria in apoptosis. Genes & development. 2001; 15:2922–2933.
41. Kuida K, Haydar TF, Kuan CY, Gu Y, Taya C, Karasuyama H, Su MS, Rakic P, Flavell RA. Reduced apoptosis and cytochrome c-mediated caspase activation in mice lacking caspase 9. Cell. 1998; 94:325–337.
42. Wilson MR. Apoptosis: unmasking the executioner. Cell death and differentiation. 1998; 5:646–652.
43. Soldani C, Scovassi AI. Poly(ADP-ribose) polymerase-1 cleavage during apoptosis: an update. Apoptosis: an international journal on programmed cell death. 2002; 7:321–328.
44. Meloche S, Pouyssegur J. The ERK1/2 mitogen-activated protein kinase pathway as a master regulator of the G1- to S-phase transition. Oncogene. 2007; 26:3227–3239.
45. Ramos JW. The regulation of extracellular signal-regulated kinase (ERK) in mammalian cells. The international journal of biochemistry & cell biology. 2008; 40:2707–2719.
46. Cagnol S, Chambard JC. ERK and cell death: mechanisms of ERK-induced cell death—apoptosis, autophagy and senescence. The FEBS journal. 2010; 277:2–21.
47. Chen MF, Qi L, Li Y, Zu XB, Dai YQ, Zhang P. Icaritin induces growth inhibition and apoptosis of human prostatic smooth muscle cells in an estrogen receptor-independent manner. Amino acids. 2010; 38:1505–1513.
48. Tong JS, Zhang QH, Huang X, Fu XQ, Qi ST, Wang YP, Hou Y, Sheng J, Sun QY. Icaritin causes sustained ERK1/2 activation and induces apoptosis in human endometrial cancer cells. PloS one. 2011; 6:e16781.
49. Tan BJ, Chiu GN. Role of oxidative stress, endoplasmic reticulum stress and ERK activation in triptolide-induced apoptosis. International journal of oncology. 2013; 42:1605–1612.
50. Nowak G. Protein kinase C-alpha and ERK1/2 mediate mitochondrial dysfunction, decreases in active Na+ transport, and cisplatin-induced apoptosis in renal cells. The Journal of biological chemistry. 2002; 277:43377–43388.
51. Nowak G, Clifton GL, Godwin ML, Bakajsova D. Activation of ERK1/2 pathway mediates oxidant-induced decreases in mitochondrial function in renal cells. American journal of physiology Renal physiology. 2006; 291:F840–855.
52. Kim GS, Hong JS, Kim SW, Koh JM, An CS, Choi JY, Cheng SL. Leptin induces apoptosis via ERK/cPLA2/cytochrome c pathway in human bone marrow stromal cells. The Journal of biological chemistry. 2003; 278:21920–21929.
53. Zhang CL, Wu LJ, Zuo HJ, Tashiro S, Onodera S, Ikejima T. Cytochrome c release from oridonin-treated apoptotic A375-S2 cells is dependent on p53 and extracellular signal-regulated kinase activation. Journal of pharmacological sciences. 2004; 96:155–163.
54. Li DW, Liu JP, Mao YW, Xiang H, Wang J, Ma WY, Dong Z, Pike HM, Brown RE, Reed JC. Calcium-activated RAF/MEK/ERK signaling pathway mediates p53-dependent apoptosis and is abrogated by alpha B-crystallin through inhibition of RAS activation. Molecular biology of the cell. 2005; 16:4437–4453.
55. Holm A, Grande PO, Luduena RF, Olde B, Prasad V, Leeb-Lundberg LM, Nilsson BO. The G protein-coupled oestrogen receptor 1 agonist G-1 disrupts endothelial cell microtubule structure in a receptor-independent manner. Molecular and cellular biochemistry. 2012; 366:239–249.
56. Gui Y, Shi Z, Wang Z, Li JJ, Xu C, Tian R, Song X, Walsh MP, Li D, Gao J, Zheng XL. The GPER Agonist G-1 Induces Mitotic Arrest and Apoptosis in Human Vascular Smooth Muscle Cells Independent of GPER. Journal of cellular physiology. 2015; 230:885–895.
57. Wang C, Lv X, Jiang C, Davis JS. The putative G-protein coupled estrogen receptor agonist G-1 suppresses proliferation of ovarian and breast cancer cells in a GPER-independent manner. American journal of translational research. 2012; 4:390–402.
58. Rainey WE, Bird IM, Mason JI. The NCI-H295 cell line: a pluripotent model for human adrenocortical studies. Molecular and cellular endocrinology. 1994; 100:45–50.
59. Weiss LM, Medeiros LJ, Vickery AL Jr. Pathologic features of prognostic significance in adrenocortical carcinoma. The American journal of surgical pathology. 1989; 13:202–206.
60. Aubert S, Wacrenier A, Leroy X, Devos P, Carnaille B, Proye C, Wemeau JL, Lecomte-Houcke M, Leteurtre E. Weiss system revisited: a clinicopathologic and immunohistochemical study of 49 adrenocortical tumors. The American journal of surgical pathology. 2002; 26:1612–1619.
61. Sirianni R, Chimento A, De Luca A, Zolea F, Carpino A, Rago V, Maggiolini M, Ando S, Pezzi V. Inhibition of cyclooxygenase-2 down-regulates aromatase activity and decreases proliferation of Leydig tumor cells. The Journal of biological chemistry. 2009; 284:28905–28916.
62. Sirianni R, Chimento A, Malivindi R, Mazzitelli I, Ando S, Pezzi V. Insulin-like growth factor-I, regulating aromatase expression through steroidogenic factor 1, supports estrogen-dependent tumor Leydig cell proliferation. Cancer research. 2007; 67:8368–8377.
63. Catalano S, Panza S, Malivindi R, Giordano C, Barone I, Bossi G, Lanzino M, Sirianni R, Mauro L, Sisci D, Bonofiglio D, Ando S. Inhibition of Leydig tumor growth by farnesoid X receptor activation: the in vitro and in vivo basis for a novel therapeutic strategy. International journal of cancer Journal international du cancer. 2013; 132:2237–2247.
64. Sirianni R, Chimento A, De Luca A, Casaburi I, Rizza P, Onofrio A, Iacopetta D, Puoci F, Ando S, Maggiolini M, Pezzi V. Oleuropein and hydroxytyrosol inhibit MCF-7 breast cancer cell proliferation interfering with ERK1/2 activation. Molecular nutrition & food research. 2010; 54:833–840.
65. Seshadri M, Spernyak JA, Maiery PG, Cheney RT, Mazurchuk R, Bellnier DA. Visualizing the acute effects of vascular-targeted therapy in vivo using intravital microscopy and magnetic resonance imaging: correlation with endothelial apoptosis, cytokine induction, and treatment outcome. Neoplasia. 2007; 9:128–135.
66. Johnson JI, Decker S, Zaharevitz D, Rubinstein LV, Venditti JM, Schepartz S, Kalyandrug S, Christian M, Arbuck S, Hollingshead M, Sausville EA. Relationships between drug activity in NCI preclinical in vitro and in vivo models and early clinical trials. British journal of cancer. 2001; 84:1424–1431.
67. Hollingshead MG. Antitumor efficacy testing in rodents. Journal of the National Cancer Institute. 2008; 100:1500–1510.
68. Allred DC, Harvey JM, Berardo M, Clark GM. Prognostic and predictive factors in breast cancer by immunohistochemical analysis. Modern pathology: an official journal of the United States and Canadian Academy of Pathology, Inc. 1998; 11:155–168.