
INTRODUCTION
2-Methoxyestradiol (2-ME) is a physiological metabolite of 17β-estradiol (E2). It is synthesized through the hydroxylation and O-methylation of E2 at the 2-position [1, 2]. Serum levels of 2-ME range from 3 × 10⁻¹¹ M in men to as much as over 3 × 10⁻⁸ M in pregnant women [3–6]. Pharmacological concentrations of 2-ME (10−7 – 10−5 M) inhibit cancer in various experimental models. In vitro and in vivo models revealed that 2-ME inhibited growth of colon [7], breast [8, 9], lung [10] cancer as well as endothelial cells [11, 12]. 2-ME (branded as Panzem) is currently recognized as a potent inhibitor of angiogenesis and tumor growth [7, 13–17]. Recommended oral dose of 2-ME is 1000 mg, 4 times a day [14]. Treatment with 2-ME NanoCrystal dispersion enhanced clinical benefit rate due to the improved bioavaibility of the compound and is preferably used in clinical practice [14, 15]. Steady-state Cmax plasma concentration of 2-ME reached a pharmacological concentration of 2.17 × 10⁻⁷ M. The minimum estimated target concentration of 2-ME is 1.1 × 10⁻⁸ M, which is considered as a high physiological concentration [13, 14]. Multiple clinical trials have used 2-ME as an efficient therapeutic agent for several types of cancer [7, 13–17]. In contrast, there are only a few studies concerning the physiological activity of 2-ME [5, 6, 53]. In spite of its proven anticancer activity, the molecular mechanisms of 2-ME remain unclear. Preclinical studies suggest that 2-ME directly inhibits angiogenesis and induces apoptosis in tumorous and rapidly proliferating cells. 2-ME induces both extrinsic and intrinsic apoptotic pathways associated with the overexpression of p53 [18, 19, 20]. Additionally, it takes part in stress-induced apoptosis due to the generation of reactive oxygen (ROS) and nitrogen (RNS) species [21–23]. Our previous study demonstrated that the anticancer effects of 2-ME are associated with the selective increase in neuronal nitric oxide synthase (nNOS) within highly metastatic osteosarcoma (OS) 143B cells [21]. In 2002, Su and co-workers reported that microtubule-disturbing agents, including 2-ME, modify NO generation [24]. Nitric oxide synthases (NOSs) are a group of hemoproteins that catalyze the oxidation of L-arginine to citrulline, releasing a molecule of nitric oxide NO (II) [25]. At least 3 isoforms of NOS have been distinguished: neuronal nitric oxide synthase (nNOS, NOS 1, NOS I), found mainly in neurons; inducible nitric oxide synthase (iNOS, NOS 2, NOS II), induced by factors such as stress or inflammation; and endothelial nitric oxide synthase (eNOS, NOS 3, NOS III), expressed mainly in endothelial cells [25]. The regulatory mechanisms controlling the expression and localization of nNOS are very complex. Though nNOS is usually found within the cytosol, it may be also recruited to the nucleus [26, 27, 28]. The reasons for the nuclear recruitment of nNOS remain unclear.
In our study, we investigated the anticancer effects of 2-ME at physiologically and pharmacologically relevant concentrations in osteosarcoma (OS) cell models. OS is one of the most common bone cancers of childhood and adolescence. It is characterized by the formation of immature bone structures or osteoid tissue by cancerous cells [29, 30, 31]. In the light of many studies, 2-ME can become a potent and relatively safe treatment for OS patients [19, 32, 33, 34, 35]. Here, we showed that the anticancer properties of 2-ME may be explained by DNA damage caused by generation of nitric oxide (NO). 2-ME increased nuclear localization of nNOS in OS cells, possibly causing nuclear NO production. Thus, 2-ME could be considered as a naturally occurring hormone of potential oncostatic properties.
RESULTS
Effect of physiological and pharmacological relevant concentrations of 2-ME on OS 143B cell death
Our first goal was to determine the influence of physiological (10−12 M – 10−8 M) and pharmacological (10−7 M – 10−5 M) relevant concentrations of 2-ME on induction of cell death within 143B OS cells. These concentrations were determined from the available literature data [3–6, 19, 21, 33, 42–47]. Previously, we demonstrated that 2-ME inhibited cell growth and induced cell death in hippocampal (HT22) and OS (143B) cell lines at high pharmacological concentrations [21]. Herein, the cells were treated with different concentrations (10−12 M – 10−5 M) of 2-ME for 24 h. Induction of apoptosis and necrosis was determined by flow cytometry. 2-ME induced apoptosis in 143B OS cells not only at tested pharmacological relevant concentrations (10−7 M – 10−5 M), but also at physiological concentrations (10−10 M – 10−8 M) (Figure 1A). At least 10% of apoptotic 143B cells were observed in the presence of 2-ME ranging from concentrations of 10−10 M to 10−6 M. While, treatment of 143B OS with 10−5 M 2-ME resulted in a dramatic 40% increase in apoptotic cell number in comparison to the control (Figure 1A). Surprisingly, we did not observe any induction of necrosis by physiological relevant concentrations of 2-ME (Figure 1B). Necrosis of 143B OS cells was observed only under pharmacological relevant concentrations (10−6 M and 10−5 M) of 2-ME (Figure 1B). This is consistent with our previous study [21].
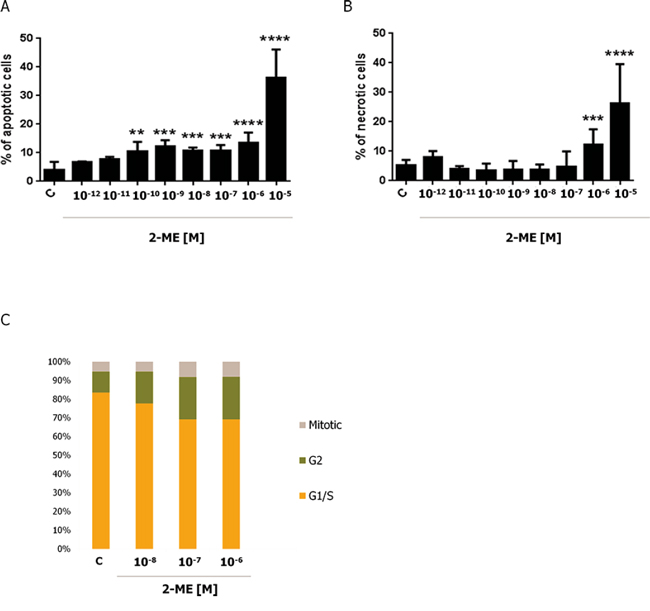
Figure 1: Induction of cell death and inhibition of cell cycle of 143B cells by 2-ME. Induction of apoptosis A. and necrosis B. by 2-ME. 143B OS cells were treated with different concentrations of 2-ME (10−12 M – 10−5 M) for 24 h. The cells were then harvested and the percentage of apoptotic and necrotic cells was determined by Annexin V-PI staining. Values are the mean ± SE of three independent experiments (N = 6 replicate cultures). The absence of an error bar denotes a line thickness greater than the error. *P < 0.01, **P < 0.001, ***P < 0.0001, ****P < 0.00001 versus control cells (C). C. Cell cycle analysis in 143B OS cells treated with 2-ME. After a 24 h treatment with 2-ME (10−8 M – 10−6 M), the cell cycle arrest was determined using the In Cell Analyzer 2000. The cells were stained with a mixture of Hoechst 33342 and Cell Trace™ Calcein Red-Orange. Each experiment was performed at least three times.
Effect of physiological and pharmacological relevant concentrations of 2-ME on the inhibition of the 143B OS cell cycle
Previously, our research group demonstrated that 2-ME-induced cell cycle arrest in 143B cells was concentration-dependent [43]. Since physiological and pharmacological relevant concentrations of 2-ME exerted anticancer effects in previous experiments, current studies were performed with the selected, representative concentrations: physiological (10−8 M) and pharmacological (10−7 M, 10−6 M) (Figure 1C). Cell cycle analysis was conducted by imaging cytometry and cells were stained with Hoechst 33342 and Cell Trace™ Calcein Red-Orange. The number of 143B OS cells within the G2 and M phases of the cell cycle increased with a 24 h treatment of every 2-ME concentration (Figure 1C). After 24 h incubation with 10−8 M, 10−7 M, and 10−6 M of 2-ME, 22.16%, 30.15% and 31.53% of the OS cells were in the G2 and M phases, respectively as compared with the control (16.38%). Taken together, 2-ME may also be considered as a physiological oncostatic agent regulating cell proliferation and death.
Potential mechanisms of 143B OS cell death induced by 2-ME
In our previous study, we demonstrated that 2-ME under high pharmacological relevant concentrations selectively increased nNOS level within 143B OS and HT22 hippocampal cells, resulting in cell death [21]. The maximal nNOS expression peaked between 6 h and 8 h of incubation. Moreover, specific inhibitor of nNOS reversed cell death. E2 (10−6 M, 10−5 M) did not significantly affect nNOS protein levels [21]. Thus, this mode of action seems to be unique for 2-ME, since E2 did not elicit any effects on nNOS concentrations [21]. Similar effects were found at physiological concentrations of 2-ME (Figure 2).
In the current study, nNOSα expression was analyzed by Western blotting using specific anti-nNOS antibodies (Figure 2D). nNOSα was reported as an isoform that may be recruited to the nucleus [26, 27, 28]. As presented, total level of nNOSα increased after 1 h of incubation with 10−9 M to 10−5 M of 2-ME (Figure 2D). Precisely, nNOSα increased 2-fold after incubation with 10−7 M to 10−5 M of 2-ME. Incubation with 10−8 M and 10−9 M of 2-ME altered nNOSα expression 1.84 and 1.64 times, respectively. Immunofluorescence microscopy and imaging cytometry was used to analyze the intracellular localization of nNOS in 143B OS cells. Physiological (10−8 M) and pharmacological (10−7 M, and 10−6 M) concentrations of 2-ME were used. We observed that nuclear fraction of nNOS was elevated after stimulation with all used concentrations of 2-ME (Figure 2A–2C). Significant increases were observed in the level of nNOS in nuclei of 143B cells after 2 h and 6 h of incubation with 10−8 M 2-ME. Treatment with pharmacological relevant concentrations (10−7 M, and 10−6 M) resulted in nuclear nNOS localization after 6 h and 8 h of incubation (Figure 2A). These data are in agreement with the observed increase in the total level of nNOSα (Figure 2C). Inhibition of 143B OS cell growth by 10−6 M of 2-ME was significantly reversed after adding L-NDBA, an nNOS inhibitor (Nω-Nitroarginine-2,4-L-diaminobutyric amide di(trifluoroacetate) salt 10−5 M) (Figure 2E).
Nitro-oxidative stress level after stimulation with 2-ME
Previously, we demonstrated using flow cytometry and 4,5-diaminofluorescein diacetate (DAF-2DA) indicator that incubation of HT22 hippocampal and 143B OS cells with 10−6 M 2-ME resulted in an increase in NO levels due to the upregulation of nNOS [21]. Herein, NO production was measured after treatment of 143B cells with physiological and pharmacological relevant concentrations of 2-ME. Imaging cytometry and specific fluorescent indicators were used to determine the NO level in live cells. 4-amino-5-methylamino-2′,7′-difluorofluorescein diacetate (DAF-FM DA) was chosen as the indicator because it is more sensitive to NO, more photo-stable and less pH sensitive than DAF-2DA [63, 64]. A significant increase in the level of NO was observed in a time-dependent manner (Figure 3A). After 2 h of incubation with 10−8 M, 10−7 M, and 10−6 M of 2-ME, the level of NO was only slightly augmented by 3.4%, 1%, 5.5% in comparison to the control, respectively (Figure 3A). NO level significantly increased by 24%, 27%, 39% after 6 h of treatment with 10−8 M, 10−7 M, 10−6 of 2-ME, respectively (Figure 3A, 3C). Interestingly, after 8 h of incubation, an increase in NO levels was detected only after treatment with 10−8 M and 10−7 M of 2-ME (Figure 3A, 3C). A 2-ME-mediated increase in the level of NO was observed without the presence of the nNOS inhibitor, L-NDBA. As demonstrated in Figure 3B, level of NO was increased by 10−6 M 2-ME and then significantly decreased after preincubation with 10−5 M L-NDBA. Induction of nitro-oxidative stress determined by 2′,7′-dichloro-fluorescein diacetate (DCF-DA) fluorescence by 10−6 M 2-ME was also reversed by using another specific nNOS inhibitor, 4-AAPNT (N-[(4S)-4-amino-5-[(2-aminoethyl)amino]pentyl]-N′-nitroguanidine tris(trifluoroacetate), 10−5 M) (Figure 3D). These results confirmed the involvement of nNOS in the anticancer mechanisms of action of 2-ME. Increased expression of nNOS was correlated with enhanced production of NO (Figure 2A, 2C).
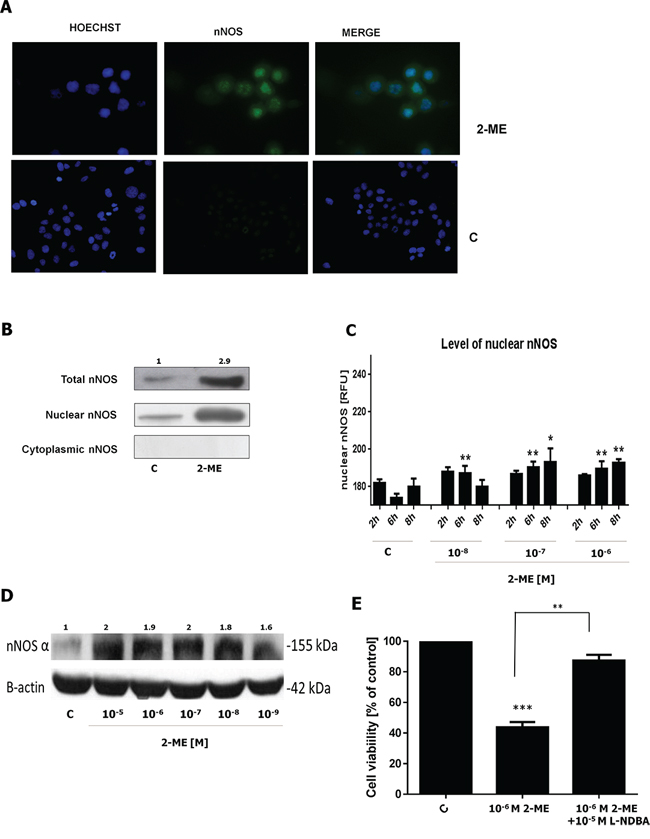
Figure 2: 2-ME results in nuclear localization of nNOS in OS 143B cells. A. 143B OS cells were treated with 10−6 M of 2-ME for 8 h. nNOS levels were evaluated by immunofluorescence microscopy. The cells were incubated with a mouse monoclonal antibody against nNOS and a FITC-conjugated, secondary polyclonal rat antibody against mouse IgG (green). Nuclei were visualized with Hoechst 33342 (blue). The representative images are shown. B. 143B OS cells were treated with 10−6 M of 2-ME for 8 h. Nuclear and cytosolic fractions of nNOS increased by 2-ME were determined by Western blotting. The representative images are shown. C. The quantification analysis of nuclear nNOS levels by imaging cytometry. The fluorescence density is presented in RFUs. For nNOS immunostaining, interphase nuclei were used. After 2-, 6-, 8-h treatments with 2-ME (10−8 M – 10−6 M), 143B OS cells were fixed, then incubated with antibodies (A) The fluorescent signals were captured with an In Cell Analyzer 2000 (GE Healthcare, UK) equipped with a high performance CCD camera. Values are the mean ± SE of three independent experiments (N = 6 replicate cultures). The absence of an error bar denotes a line thickness greater than the error. *P < 0.01, **P < 0.001, ***P < 0.0001, ****P < 0.00001 versus control cells (C). D. 1 h treatment of 143B OS cells with 2-ME (10−9 M – 10−5 M) resulted in an increase of the total level of nNOSα. The result was obtained by Western blotting using nNOS specific antibodies. The band corresponding to nNOS alpha was analyzed. The representative data are shown. E. 10−5 M L-NDBA reversed 2-ME-induced inhibition of 143B OS cell growth. Values are the mean ± SE of three independent experiments (N = 6 replicate cultures). The absence of an error bar denotes a line thickness greater than the error. *P < 0.01, **P < 0.001, ***P < 0.0001, ****P < 0.00001 versus control cells (C) Each experiment was performed at least three times.
2-ME-induced DNA damage
We were wondering whether 2-ME increased nNOS levels and nitro-oxidative stress generation within the nuclei of 143B OS cells may exert any effects on DNA damage and genomic instability In a previous study, the nNOS inhibitor, L-NDBA, significantly decreased the DNA fragmentation rate after 16 h of incubation with 10−6 M of 2-ME [21 and Figure 5B]. Due to the fact that we observed nNOS induction after 1 h maintaining till 8 h of incubation with both physiological and pharmacological concentrations of 2-ME (Figure 2C), we assessed DNA strand breaks after 2 h and 8 h of incubation with 2-ME. Two versions of the comet assay were used to evaluate DNA damage. The alkaline assay detected single strand breaks (SSBs) and the neutral assay detected double strand breaks (DSBs) [39]. Time- and 2-ME-concentration-dependent increases in both SSBs and DSBs were observed (Figure 4). We present that 2-ME increased DNA damage as soon as after 2 h of incubation with the stimuli what is in the correlation with increased total nNOS level (Figure 2). DSBs were 1.37, 1.37, and 1.92 times greater in number after 2 h of incubation with 10−8 M, 10−7 M, and 10−6 M of 2-ME in comparison to the control (0.82), respectively (Figure 4A). Incubation with 10−8 M, 10−7 M, and 10−6 M of 2-ME for 2 h resulted in 5.30-, 7.72-, and 11.45- fold increases in the SSBs in comparison to the control (1.86), respectively (Figure 4B, 4C). The number of DSBs and SSBs subsequently increased after 8 h of incubation with 2-ME. In comparison to the control (1.31), 3.23-, 4.66-, and 3.25-fold increases were observed in DSBs after 143B OS cells were incubated with 10−8 M, 10−7 M, and 10−6 M of 2-ME for 8 h, respectively (Figure 4A, 4C). SSBs increased by a factor of 7.02, 5.14, and 12.85 after 8 h of incubation with 10−8 M, 10−7 M, and 10−6 M of 2-ME in comparison to the control (4.18), respectively (Figure 4B, 4C). Appearance of SSBs and DSBs after 2 h of incubation with 2-ME seemed to be one of the first signals of DNA damage. The cytokinesis-block micronucleus (CBMN) assay confirmed that 2-ME stimulated genotoxicity in 143B OS cells. Micronuclei formation is correlated with altered genomic stability. Genomic instability is often associated with cancer and may be indicative of a poor prognosis for some types of cancer [74, 75, 76, 77]. By imaging cytometry the influence of 2-ME on micronucleus formation was examined. Our experimental data suggested that a time period of 24 h was sufficient for the effective cell division and micronucleus formation of 143B OS cells. 24 h treatment with physiological and pharmacological relevant concentrations of 2-ME lead to increased genomic instability within the 143B cells. This confirmed the genotoxic effects of 2-ME within the experimental model. Incubation with 2-ME resulted in an increased amount of micronuclei that was concentration-dependent. After 24 h of incubation with 10−8 M, 10−7 M, and 10−6 M of 2-ME, micronucleus formation increased by 23.4% ± 1.5, 25.3% ± 1.4, and 28% ± 1.1 in comparison to the control (20.35% ± 1), respectively (Figure 5A, 5B). Activation of the DNA damage response (DDR) is an important determinant of cell sensitivity to chemotherapeutic drugs eliminating tumor cells. 53BP1 is a protein recognizing the central DNA-binding domain of p53. It relocates to the sites of DNA strand breaks in response to DNA damage [39]. We investigated whether the DNA damage response was activated after the treatment of OS cells with 2-ME at physiological and pharmacological concentrations. DNA damage detected as 53BP1 foci/nucleus was evaluated by means of imaging cytometry. As demonstrated in Figure 5, recruitment of 53BP1 was significantly increased after 2 h of treatment at all concentrations of 2-ME (Figure 5C, 5D). The recorded data fully supported the observed SSBs and DSBs in 143B OS cells after treatment with 2-ME (Figure 4). The cells in which DDR was activated may be those that did not undergo cell death, another will be transferred to the way of cell death [78].
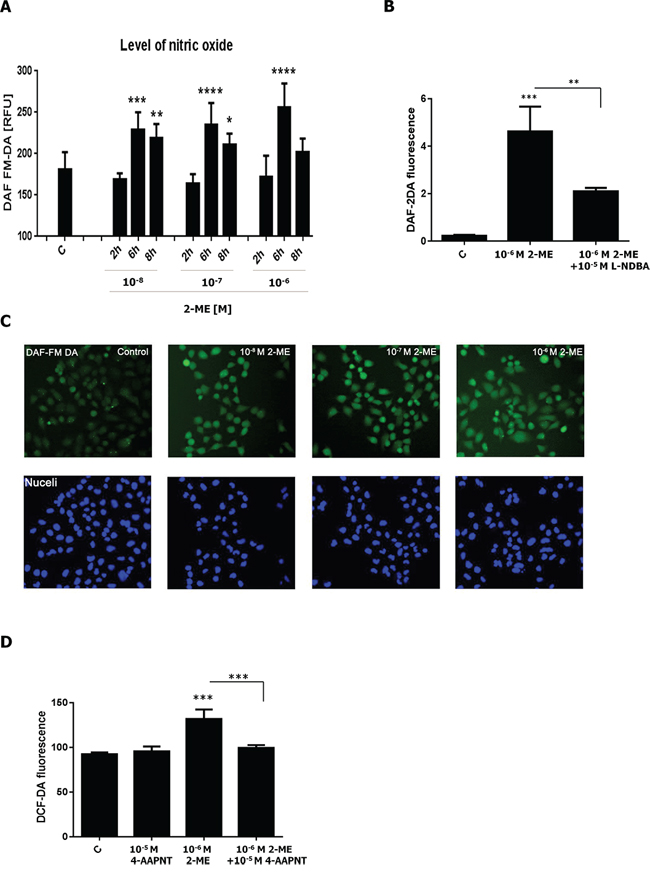
Figure 3: Induction of nitro-oxidative stress by 2-ME. A. NO production increased by 2-ME after 2-, 6-, 8-h treatments with 2-ME (10−8 M – 10−6 M). NO levels were evaluated by imaging cytometry using fluorogenic probes, DAF-FM DA (5 × 10⁻⁶ M), and a 10-min incubation time in PBS buffer. The fluorescent signals were captured with an In Cell Analyzer 2000 (GE Healthcare, UK) equipped with a high performance CCD camera. The fluorescence density is presented in RFUs. Values are the mean ± SE of three independent experiments (N = 6 replicate cultures). The absence of an error bar denotes a line thickness greater than the error. *P < 0.01, **P < 0.001, ***P < 0.0001, ****P < 0.00001 versus control cells (C). B. NO production induced by 2 h incubation with 10−6 M of 2-ME was reversed by specific nNOS inhibitor, L-NDBA (10−5 M). C. Representative images of induction of NO by 2-ME determined by imaging cytometry (A) Cell nuclei are shown in blue and the nitric oxide levels in green. The fluorescent signals were captured with an In Cell Analyzer 2000 (GE Healthcare, UK) equipped with a high performance CCD camera. D. Nitro-oxidative stress induced by an 8 h incubation with 10−6 M of 2-ME was reversed by specific nNOS inhibitor, 4-AAPNT (10−5 M). Values are the mean ± SE of three independent experiments (N = 6 replicate cultures). The absence of an error bar denotes a line thickness greater than the error. *P < 0.01, **P < 0.001, ***P < 0.0001, ****P < 0.00001 versus control cells (C) Each experiment was performed at least three times.
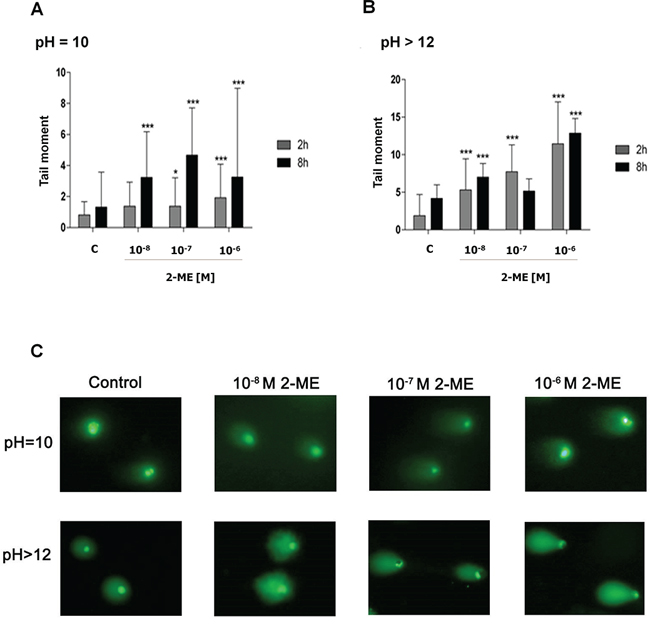
Figure 4: 2-ME induced DNA damage at physiological and pharmacological relevant concentrations. A, B. DSBs and SSBs after 2- and 8-hour treatments with 2-ME (10−8 M – 10−6 M) determined by (pH = 10) and alkaline (pH > 12) comet assay, respectively. The tail moment was considered a general parameter to the DNA integrity assessment. Values are the mean ± SE of three independent experiments. 100 single cells were taken into analysis of DNA damage. The absence of an error bar denotes a line thickness greater than the error. *P < 0.01, **P < 0.001, ***P < 0.0001, ****P < 0.00001 versus control (C). C. DNA damage measurements at neutral and alkaline pH after a 2 h treatment with 2-ME (10−8 M – 10−6 M). The representative images are shown. Each experiment was performed at least three times.
DISCUSSION
Herein, we demonstrated a new mode of anticancer action of 2-ME at physiological and pharmacologically relevant concentrations. Increased levels of nNOS within the nuclei of 143B OS cells and the subsequent induction of nitro-oxidative stress caused cell cycle arrest and cancer cell death. We used the OS experimental model due to its high malignancy, chemoresistance and genomic instability [101].
Various preclinical and clinical cancer models proved the anticancer properties of 2-ME [13, 14, 15, 48, 49, 50, 51, 52], though there are only few reports concerning the physiological activity of 2-ME [5, 6, 53]. Similarly to our current results, Vijayanathan and co-workers demonstrated the inhibitory effects of 10−8 M of 2-ME towards MCF-7 cell growth [5]. Decreased concentrations of 2-ME have been implicated as one of the reasons for pre-eclampsia, suggesting that 2-ME plays an important physiological role [6]. For the first time, we managed to prove that at physiological 2-ME concentrations (10−10 M – 10−8 M) induced apoptosis in highly metastatic 143B OS cells. While high pharmacological relevant 2-ME concentrations (10−6 M – 10−5 M) induced necrosis. Little information is available concerning the induction of necrosis within cancer cells by 2-ME. High pharmacological concentrations of 2-ME induced necrosis within human endometrial carcinoma cells (RL-95–2) [44]. Up to date, 2-ME was shown to inhibit cell growth and induce apoptosis or cell death in cancer cells [19, 21, 33, 35, 45, 54–56].
Previously, we demonstrated that high pharmacological concentrations of 2-ME lead to OS and hippocampal cell death through the induction of nNOS [21]. In the current study, we hypothesize that, under physiological and therapeutical conditions, 2-ME stimulates the nuclear hijacking of nNOS and directly induced nitro-oxidative stress within the nucleus. 2-ME seems to be strictly associated with pro-apoptotic and oncostatic mechanisms of action. nNOS has been believed to be a cytosolic isoform [57, 58]. However, different splicing variants and subcellular localizations of the enzyme were recently reported [26]. Nonetheless, the exact role of nNOS within the nucleus has continued to remain undefined [26, 27, 59]. The effect of 2-ME on proteins regulating nNOS translocation from the cytosol to the nucleus is currently under our investigation. In contrast to eNOS or iNOS, nNOS is a larger protein containing a PDZ domain at its N-terminal, a consensus sequence of approximately 90 amino acids [60–62]. The PDZ domain seems to be an important factor for the facilitation of nNOS to distinct intercellular compartments [27, 59]. Aquilano and colleagues demonstrated that PDZ is essential for the nuclear recruitment of nNOS, thus favoring NO production [26]. 2-ME-increased nitro-oxidative stress associated with the generation of NO and/or its derivatives within the nuclei of OS cells may have directly resulted in SSBs and DSBs, leading to 143B OS cell death. The link between nuclear proteotoxic stress and cancer cell death has been recently reported [79, 80, 81]. Local generation of NO and/or their reactive derivatives (nitrogen dioxide, peroxynitrite) are likely contributed to DNA damage [82, 83, 84]. In vitro studies with cellular models indicated that NO and its derivatives were able to induce direct- and mediated-genotoxic effects [85, 86]. Bossy-Wetzel and Lipton reported that excessive amounts of NO may have induced S-nitrosylation and/or triggered DNA damage, resulting in cell death [87]. ROS/RNS action on DNA may have caused several modifications of nucleotides and generated SSBs and DSBs [82, 84, 88]. Oxidative stress preferentially induced micronucleus formation and mediated the genomic instability caused by p53 dysfunction [89]. Diverse chemotherapeutics like 2-ME may be selectively toxic to tumor cells by increasing oxidative/nitro-oxidative stress and pushing the already-stressed cancer cells beyond their limit [90, 91]. DNA damage caused by increased nNOS levels within OS cell nuclei led to cancer cell death at physiological and pharmacological concentrations of 2-ME. Consistent with our study, 2-ME was reported to enhance the sensitivity of glioma cell lines to radiotherapy by arresting the cell cycle at the G2/M phase and increased DNA damage [92]. Khoei and colleagues demonstrated that combined treatment with 25 × 10−5 M of 2-ME and 60Co significantly increased iododeoxyuridine DNA damage. Only slight DNA damage was observed when 2-ME was administered separately [93]. This result may be attributable to the U87MG glioblastoma cancer cell line spheroid model. Higher resistance has been observed within spheroid cultures in comparison to monolayer cultures [93, 94]. Moreover, cancer cell chemosensitization by NO during anticancer therapy has been reported [95]. Treatments of human cancer cells with NO and NO mimetics also have been shown to restore chemoresistance both in vivo and in vitro [96, 97, 98, 99]. On the other hand, malfunction of DNA damage repair system may result in chemoresistance of cancer cells and further cancer progression [75, 78, 100]. It may be considered as one of the limitations of long-term 2-ME use.
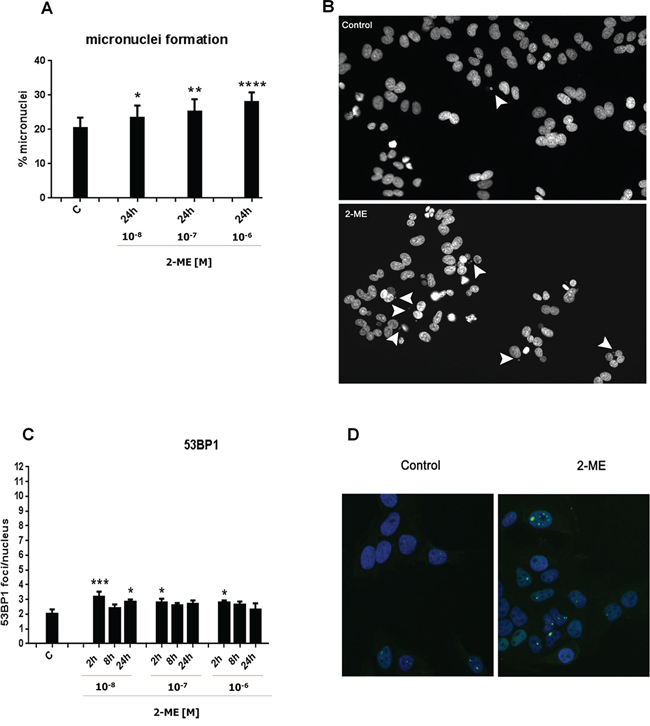
Figure 5: 2-ME induced genomic instability and DNA repair at physiological and pharmacological relevant concentrations. A, B. Micronuclei formation after the 24 h treatment with 2-ME (10−8 M – 10−6 M ) determined by CBMN assay using imaging cytometry. Arrowheads indicate micronuclei. C, D. 143B OS cells were treated with 2-ME (10−8 M – 10−6 M ) for 2, 8, 24 h and 2-ME stimulated DNA repair by increasing 53BP1 foci/nucleus (green) was investigated. Nuclei were visualized using Hoechst 33342 staining (blue). Values are the mean ± SE of three independent experiments (N = 6 replicate cultures). 500 single cells were taken into analysis of DNA damage and DDR. The representative images are shown (B, D). The absence of an error bar denotes a line thickness greater than the error. *P < 0.01, **P < 0.001, ***P < 0.0001, ****P < 0.00001 versus control (C). Each experiment was performed at least three times.
In conclusion, we demonstrated that SSBs and DSBs is involved in the 2-ME oncostatic mechanism (Figure 6). Anticancer effects were observed at physiological and pharmacologically relevant concentrations. Mechanisms of nuclear transport of nNOS induced by 2-ME need to be further investigated.
MATERIALS AND METHODS
Cell line and culture conditions
143B OS cell line was obtained from the American Tissue Type Collection (ATTC-8303). Cells were cultured at 37°C in a humidified atmosphere and saturated with 5% CO2. Dulbecco’s Modified Eagle’s Medium was supplemented with 10% heat-inactivated fetal bovine serum and a penicillin (100 μg/mL)/streptomycin (100 μg/mL) cocktail (Sigma-Aldrich, Poland).
Cell treatment
The 143B OS cells were treated with various concentrations of 2-ME and time, depending on the design of experiments. 10−5 M of nNOS inhibitor (4-AAPNT, L-NDBA) was added to the cells after 2 h of pre-treatment. The medium was removed and the cells were washed with a phosphate-buffered saline (PBS, Sigma Aldrich). A new medium containing 2-ME replaced the previous one. We used charcoal-stripped FBS (Sigma Aldrich, Poland) in the medium for cell treatment. Charcoal-stripped FBS is used to elucidate the effects of hormones in a variety of in vitro systems.
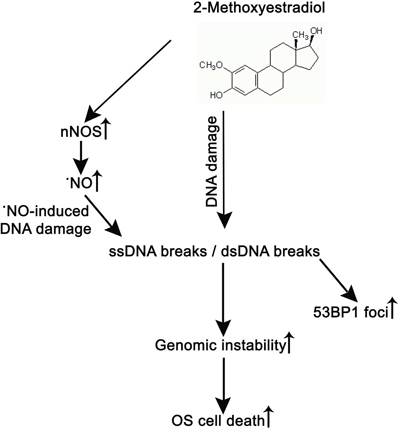
Figure 6: 2-ME induces OS cell death via increasing nuclear nNOS resulting in DNA damage and genomic instability.
Reagents
Tissue culture media, antibiotic cocktail, fetal bovine sera, 2-ME, the nNOS inhibitors L-NDBA, 4-AAPNT were purchased form Sigma Aldrich Poland. Anti-rabbit IgG were purchased from Abcam (Cambridge, UK). Mouse antibodies against nNOS, secondary polyclonal rat antibody against mouse IgG were obtained from BD Biosciences (Germany).
Assessment of apoptosis by flow cytometry with Annexin V-propidium iodide (PI) staining
The analysis was performed as previously described [21, 36]. 143B OS cells were seeded onto six-well plates at a density of 3 × 10⁵ cells/well. After 24 h of culturing in the standard medium, the cells were treated with 2-ME for 24 h. The cells were then pelleted and incubated with Annexin V and PI according to manufacturer’s protocol (BD Pharmingen, Poland). Afterwards, the cells (3 × 10⁴/sample) were analyzed and the fluorescent signals of Annexin V conjugate and PI were detected at the fluorescence intensity channels FL1 and FL3 (BD FACScan). The results were then analyzed by Cyflogic software, version 1.2.1. Each experiment was performed at least three times.
Cell cycle analysis
After treatment with 2-ME, 143B OS cells were stained with a mixture of Hoechst 33342 (2.5 μg/ml) and Cell Trace™ Calcein Red-Orange AM (2.5 × 10⁻⁶ M) (Life Technologies, Poland) in a serum-free DMEM medium at 37°C for 30 min. The OS cells were rinsed with PBS and subjected to cell cycle analysis using an In Cell Analyzer 2000 (GE Healthcare, UK) equipped with a high performance CCD camera.
Assessment of nitro-oxidative stress by flow cytometry
ROS and RNS production were determined using flow cytometry with DCF-DA staining. The cells were seeded onto six-well plates at a density of 3 × 10⁵ cells/well. After 24 h of culturing in the normal growth medium, cells were exposed to treatment with 2-ME for 24 hours. Subsequently, 30 min before the end of the incubation time, a solution of DCF-DA was added to each well of treated cells in order to obtain the final concentration of 10−5 M for 2-ME. Next, both floating and trypsinized cells were collected by centrifugation at 1200 rpm for 7 min. The pellet was next washed twice with PBS, followed by resuspension in PBS. The whole procedure was performed on ice. Afterward, 3 × 10⁴ cells were analyzed by flow cytometry (BD FACScan) and the results were analyzed by Cyflogic software, version 1.2.1. Each experiment was performed at least three times.
NO level by imaging cytometry
Imaging of RNS production in living cells based on fluorescent indicators has been reported as a fast, sensitive and selective method [40, 41]. After 2-, 6-, 8-h treatments with 2-ME, NO levels were evaluated using the fluorogenic probe DAF-FM DA (5 × 10⁻⁶ M) and a 10-min incubation time in a PBS buffer. NO-specific fluorescent signals were captured with an In Cell Analyzer 2000 (GE Healthcare, UK) equipped with a high performance CCD camera. For NO positive control, a NO donor – MAHMA NONOate (10−3 M) was used.
Immunofluorescence microscopy
The immunofluorescence was performed as previously described [50, 21]. The 143B OS cells were treated with 2-ME for 8 h. Anti-nNOS (1:50 in 0.3% GSA, 2 h incubation, BD Biosciences) and goat anti-mouse secondary-conjugated with CY3 (1:100, GAM Cy3, 1 h incubation, Jackson Immunoresearch, Suffolk, UK) antibodies were used. The images were analysed and merged employing the ImageJ software 1.44p. Each experiment was performed at least three times.
nNOS immunostaining by imaging cytometry
For nNOS immunostaining, interphase nuclei were used. After 2-, 6-, and 8-h treatments with 2-ME in the 96-well plate, 143B OS cells were fixed with 3.7% formaldehyde containing 0.1% Triton X-100 in PBS for 20 min. Subsequently, the cells were incubated with 1% bovine serum albumin (BSA) in PBST (phosphate buffered saline containing 0.25% Triton X-100) at room temperature for 30 min. After washing with PBST, the cells were incubated with mouse monoclonal antibodies against nNOS (BD Biosciences, Germany) (diluted 1:50 in PBST–BSA [PBST containing 1% BSA]) overnight at 4°C. The next day, FITC-conjugated, secondary polyclonal rat antibodies against mouse IgG (BD Biosciences, Germany) (diluted 1:1000 in PBST–BSA) were added and incubated at room temperature for 1 h. Nuclei were visualized with Hoechst 33342. Digital cell images were captured with an In Cell Analyzer 2000 (GE Healthcare, UK) equipped with a high performance CCD camera. To analyze cellular nNOS content and localization, In Cell Analyzer software (In Cell Analyzer Investigator) was used. The fluorescence density was presented in relative fluorescence units (RFUs). As a positive control, treatment with 0.1 mg/ml nocodazole was used.
53BP1 immunostaining
The analysis was performed as previously described [39]. For 53BP1 immunostaining, interphase nuclei were used. After 2-, 8- and 24-h treatments with 2-ME in the 96-well plate, 143B OS cells were fixed with 3.7% formaldehyde containing 0.1% Triton X-100 in PBS for 20 min. Subsequently, the cells were incubated with 1% bovine serum albumin (BSA) in PBST (phosphate buffered saline containing 0.25% Triton X-100) at room temperature for 30 min. After washing with PBST, the cells were incubated with a rabbit polyclonal antibody against 53BP1 (Novus Biologicals, Poland) (diluted 1:200 in PBST–BSA (PBST containing 1% BSA)) overnight at 4°C. The next day, FITC-conjugated secondary polyclonal antibodies against rabbit IgG (BD Biosciences, Germany) (diluted 1:200 in PBST–BSA) were added and incubated at room temperature for 1 h. Nuclei were visualized with Hoechst 33342. Digital cell images were captured with an In Cell Analyzer 2000 (GE Healthcare, UK) equipped with a high performance CCD camera. 53BP1 foci were scored per nucleus.
Comet assay
The analysis was performed as previously described [39]. DNA double-strand breaks (DSBs) and DNA single-strand breaks (SSBs) were assessed with neutral and alkaline single-cell microgel electrophoresis (comet assay), respectively. After 2- and 8-h treatments with 2-ME, 143B OS cells were suspended in PBS and mixed with low melting (LM) agarose (0.7%). The cells were fixed to agarose (LM) slides and lyzed with proteinase K (0.5 mg/ml) and reduced glutathione (2 mg/ml) in a lysis solution (1.25 M NaCl, 50 mM EDTA, 100 mM Tris–HCl, 0.01% N-lauroylsarcosine sodium salt, pH 10) at 37°C for 2 h. Electrophoresis (neutral comet assay buffer: 100 mM Tris–HCl, 0.5 M NaCl, 1 mM EDTA, 0.2% DMSO, pH 10 and alkaline comet assay buffer: 1 mM EDTA, 0.2% DMSO, 300 mM NaOH, pH > 12) was performed on the treated cells. The slides were then stained with 2.5 × 10⁷ M YOYO-1 (Invitrogen Corporation, Grand Island, NY, USA) in a 2.5% DMSO and 0.5% sucrose solution. The cells were mounted with a coverslip and digital comet images were immediately captured with an Olympus BX61 fluorescence microscope equipped with a DP72 CCD camera and Olympus CellF software. The CCD capture conditions were: exposure time 81 ms, magnification 400x. Images were saved as TIFF files. At least 100 comets were measured per each sample triplicate using AutoComet Software http://autocomet.com/index.php (TriTek Corp). The Tail Moment (Tail moment = tail length × fraction of total DNA in the tail) was scored as general parameter to DNA integrity assessment.
Cytokinesis-block micronucleus (CBMN) assay
143B OS cells were treated with 2-ME for 24 h. Micronucleus generation was measured with a CBMN assay using the BD™ Gentest Micronucleus Assay Kit and following the standard protocol outlined in the manufacturer’s instructions. A total of 500 binucleated cells per well [37, 38] were scored using an In Cell Analyzer 2000 (GE Healthcare, UK) equipped with a high performance CCD camera. For a positive control, 24 h treatment with 100 ng/ml mitomycin C was used.
Western blotting
The cytoplasmic and nuclear fractions were separated using the Nuclear Extract Kit (Active Motif, France) according to manufacturer’s protocol. Equal amounts of total cell lysates were resolved by 7% SDS-PAGE. The membranes were then incubated with primary antibodies anti-nNOS (BD Biosciences) (1:1000) overnight at 4°C and an analysis was performed as previously described [21, 36]. The chemiluminescence was detected using ImageQuant LAS 500 (GE Healthcare). The protein level was quantified by densitometry technique using the Quantity one 4.5.2 software. The protein levels, as determined by chemiluminescent signal quantification, were normalized relative to beta-actin levels found in the samples. Each experiment was performed at least three times.
Statistical analysis
The results represent the mean ± SD from at least three independent experiments. All microscopic evaluations were done on randomized and coded slides. Differences between control samples versus 2ME-treated samples were assessed with one-way analysis of variance (ANOVA) with post hoc testing using a Dunnett’s multiple comparison test. A p-value of less than 0.01 was considered to correspond with statistical significance. Data were analyzed using GraphPad Prism (GraphPad Software, Inc., version 6, USA).
ACKNOWLEDGMENTS
Part of this work was carried out using instruments provided by the Euro-Mediterranean Institute of Science and Technology, and funded with the Italian National Operational Programme for Research and Competitiveness 2007-2013 grant (Project code: PONa3_00210, European Regional Development Fund). We kindly thank the Centre of Applied Biotechnology and Basic Sciences supported by the Operational Programme Development of Eastern Poland 2007–2013, NoPOPW.01.03.00–18-018/09 where part of the study was performed. M.W. acknowledges support from Medical University of Gdansk Funding No. ST46. We kindly thank Michael Golian for his linguistic assistance and corrections.
Abbreviations
4-AAPNT - N-[(4S)-4-amino-5-[(2-aminoethyl)amino]pentyl]-N′-nitroguanidine tris(trifluoroacetate), C- control, DAF-2DA- 4,5-diaminofluorescein diacetate, DAF-FM DA- 4-Amino-5-methylamino- 2′,7′-difluorofluorescein diacetate, DCF-DA- 2′,7′-dichloro-fluorescein diacetate, DDR – DNA damage response, DHE – dihydroethidium, DSBs - DNA double-strand breaks, E2 - 17β-estradiol, 2-ME - 2-methoxyestradiol, L-NDBA - Nω-Nitroarginine-2, 4-L-diaminobutyric amide di(trifluoroacetate) salt, OS - osteosarcoma, RFUs - relative fluorescence units, ROS-reactive oxygen species, RNS – reactive nitrogen species, SOD - superoxide dismutase, SSBs - DNA single-strand breaks.
FUNDING
The project was funded by grant No. 2012/07/B/NZ1/00010 from National Science Center resources. GraphPad Prism 6 for statistical analysis, LAS 500 (GE Healthcare) for Western blot analysis were also bought thanks to grant No. 2012/07/B/NZ1/00010 from National Science Center resources. The funders had no role in study design, data collection and analysis, decision to publish, or preparation of the manuscript.
CONFLICTS OF INTEREST
The authors declare no conflicts of interest.
REFERENCES
1. LaVallee TM, Zhang XGH, Herbstritt CJ, Kough EC, Green SJ, Pribluda VS. 2-methoxyestradiol inhibits proliferation and induces apoptosis independently of estrogen receptors alpha and beta. Cancer Research. 2002; 62:3691–3697.
2. Ball P, Emons G, Haupt O, Knuppen R. Pharmacological effects of 2-methylestradiol and 4-methylestradiol as a probe to test the biological importance of 2-hydroxylation and 4-hydroxylation of estrogens (catecholoestrogen-formation). Acta Endocrinologica. 1983; 102:150–152.
3. Yue T, Wang X, Louden CS, Gupta S, Pillarisetti K, Gu J, Hart TK, Lysko PG, Feuerstein GZ. 2-methoxyestradiol, an endogenous estrogen metabolite, induces apoptosis in endothelial cells and inhibits aniogenesis: Possible role for stress-activated protein kinase signaling pathway and Fas expression. Molecular Pharmacolog. 1997; 51:951–962.
4. Berg D, Sonsalla R, Kuss E. Concentrations of 2-methoxyestrogens in human-serum measured by a heterologous immunoassay with an i-125-labeled ligand. Acta Endocrinologica. 1983; 103:282–288.
5. Vijayanathan V, Venkiteswaran S, Nair SK, Verma A, Thomas TJ, Zhu BT, Thomas T. Physiologic levels of 2-methoxyestradiol interfere with nongenomic signaling of 17 beta-estradiol in human breast cancer cells. Clinical Cancer Research. 2006; 12:2038–2048.
6. Kansaki K, Palmsten K, Sugimoto H, Ahmad S, Hamano Y, Xie L, Parry S, Augustin HG, Gattone VH, Folkman J, Strauss JF, Kalluri R. Deficiency in catechol-O-methyltransferase and 2-methoxyestradiol is associated with pre-eclampsia. Nature letters. 2008; 453:1117–1121.
7. Zou HC, Adachi M, Imai K, Hareyama M, Yoshioka K, Zhao S, Shinomura Y. 2-methoxyestradiol, an endogenous mammalian metabolite, radiosensitizes colon carcinoma cells through c-jun NH2-terminal kinase activation. Clinical Cancer Research. 2006; 12:6532–6539.
8. Snoeks TJA, Mol IM, Que I, Kaijzel EL, Loewik CWG M. 2-Methoxyestradiol Analogue ENMD-1198 Reduces Breast Cancer-Induced Osteolysis and Tumor Burden Both In Vitro and In Vivo. Molecular Cancer Therapeutics. 2011; 10:874–882.
9. Quezada M, Diaz J, Henriquez S, Bravo ML, Aranda E, Oliva B, Villalon M, Kato S, Cuello MA, Brosens JJ, Lange CA, Owen GI. 2-Methoxyestradiol inhibits progesterone-dependent tissue factor expression and activity in breast cancer cells. Hormones & cancer. 2010; 1:117–126.
10. Shen G, Wang Q, Zhang Q, Sun H, Zhao Y, Zhang Z, Du B. Tissue distribution of 2-methoxyestradiol nanosuspension in rats and its antitumor activity in C57BL/6 mice bearing lewis lung carcinoma. Drug Delivery. 2012; 19:327–333.
11. Gorshkov BA, Zemskova MA, Verin AD, Bogatcheva NV. Taxol alleviates 2-methoxyestradiol-induced endothelial permeability. Vascular Pharmacology. 2012; 56:56–63.
12. Salih SM, Kapur A, Albayrak S, Salama SA, Magness RR. Pregnancy Ameliorates the Inhibitory Effects of 2-Methoxyestradiol on Angiogenesis in Primary Sheep Uterine Endothelial Cells. Reproductive Sciences. 2011; 18:858–867.
13. Bruce JY, Eickhoff J, Pili R, Logan T, Carducci M, Arnott J, Treston A, Wilding G, Liu G. A phase II study of 2-methoxyestradiol nanocrystal colloidal dispersion alone and in combination with sunitinib malate in patients with metastatic renal cell carcinoma progressing on sunitinib malate. Investigational New Drugs. 2012; 30:794–802.
14. Kulke MH, Chan JA, Meyerhardt JA, Zhu AX, Abrams TA, Blaszkowsky LS, Regan E, Sidor C, Fuchs CS. A prospective phase II study of 2-methoxyestradiol administered in combination with bevacizumab in patients with metastatic carcinoid tumors. Cancer Chemotherapy and Pharmacology. 2011; 68:293–300.
15. Harrison MR, Hahn NM, Pili R, Oh WK, Hammers H, Sweeney C, Kim K, Perlman S, Arnott J, Sidor C, Wilding G, Liu G. A phase II study of 2-methoxyestradiol (2ME2) NanoCrystalA (R) dispersion (NCD) in patients with taxane-refractory, metastatic castrate-resistant prostate cancer (CRPC). Investigational New Drugs. 2011; 29:1465–1474.
16. Zhou Q, Gustafson D, Nallapareddy S, Diab S, Leong S, Lewis K, Gore L, Messersmith WA, Treston AM, Eckhardt SG, Sidor C, Camidge DR. A phase I dose-escalation, safety and pharmacokinetic study of the 2-methoxyestradiol analog ENMD-1198 administered orally to patients with advanced cancer. Investigational New Drugs. 2011; 29:340–346.
17. Matei D, Schilder J, Sutton G, Perkins S, Breen T, Quon C, Sidor C. Activity of 2 methoxyestradiol (Panzem (R) NCD) in advanced, platinum-resistant ovarian cancer and primary peritoneal carcinomatosis: A Hoosier Oncology Group trial. Gynecologic Oncology. 2009; 115:90–96.
18. Gong Q, Liu EH, Xin R, Huang X, Gao N. 2ME and 2OHE2 exhibit growth inhibitory effects and cell cycle arrest at G2/M in RL95–2 human endometrial cancer cells through activation of p53 and Chk1. Molecular and Cellular Biochemistry. 2011; 352:221–230.
19. Maran A, Benedikt M, Szatkowski JP, Shogren KL, Yaszemski MJ. 2-methoxyestradiol regulates osteoprotegerin expression in osteosarcoma cells. Clinical & Experimental Metastasis. 2008; 25:59–59.
20. Djavaheri-Mergny M, Wietzerbin J, Besancon F. 2-methoxyestradiol induces apoptosis in Ewing sarcoma cells through mitochondrial hydrogen peroxide production. Oncogene. 2003; 22:2558–2567.
21. Gorska M, Kuban-Jankowska A, Zmijewski MA, Gorzynik M, Szkatula M, Wozniak M. Neuronal Nitric Oxide Synthase Induction in the Antitumorigenic and Neurotoxic Effects of 2-Methoxyestradiol. Molecules. 2014; 19:13267–13281.
22. Zhang Q, Ma Y, Cheng YF, Li WJ, Zhang Z, Chen SY. Involvement of reactive oxygen species in 2-methoxyestradiol-induced apoptosis in human neuroblastoma cells. Cancer Letters. 2011; 313:201–210.
23. Gao N, Rahmani M, Dent P, Grant S. 2-methoxyestradiol-induced apoptosis in human leukemia cells proceeds through a reactive oxygen species and Akt-dependent process. Oncogene. 2005; 24:3797–3809.
24. Su YC, Zharikov SI, Block ER. Microtubule-active agents modify nitric oxide production in pulmonary artery endothelial cells. American Journal of Physiology-Lung Cellular and Molecular Physiology. 2002; 282:L1183–L1189.
25. Foerstermann U, Sessa WC. Nitric oxide synthases: regulation and function. European Heart Journal. 2012; 33:829.
26. Aquilano K, Baldelli S, Ciriolo MR. Nuclear Recruitment of Neuronal Nitric-oxide Synthase by alpha-Syntrophin Is Crucial for the Induction of Mitochondrial Biogenesis. Journal of Biological Chemistry. 2014; 289:365–378.
27. Zhou L, Zhu DY. Neuronal nitric oxide synthase: Structure, subcellular localization, regulation, and clinical implications. Nitric Oxide-Biology and Chemistry. 2009; 20:223–230.
28. Frandsen U, LopezFigueroa M, Hellsten Y. Localization of nitric oxide synthase in human skeletal muscle. Biochemical and Biophysical Research Communications. 1996; 227:88–93.
29. Xiao X, Wang W, Wang Z. The Role of Chemotherapy for Metastatic, Relapsed and Refractory Osteosarcoma. Pediatric Drugs. 2014; 16:503–512.
30. Kansara M, Teng MW, Smyth MJ, Thomas DM. Translational biology of osteosarcoma. Nature Reviews Cancer. 2014; 14:722–735.
31. van Driel M, van Leeuwen JPTM. Cancer and bone: A complex complex. Archives of Biochemistry and Biophysics. 2014; 561:159–166.
32. Schumacher G, Neuhaus P. The physiological estrogen metabolite 2-methoxyestradiol reduces tumor growth and induces apoptosis in human solid tumors. Journal of Cancer Research and Clinical Oncology. 2001; 127:405–410.
33. Maran A, Shogren KL, Benedikt M, Sarkar G, Turner RT, Yaszemski MJ. 2-methoxyestradiol-induced cell death in osteosarcoma cells is preceded by cell cycle arrest. Journal of Cellular Biochemistry. 2008; 104:1937–1945.
34. Shogren KL, Mahlum EW, Yaszemski MJ, Maran A. 2-Methoxyestradiol Alters eIF4E Activity and Causes Protein Synthesis Inhibition in Osteosarcoma Cells. Journal of Bone and Mineral Research. 2008; 23:S300–S301.
35. Maran A, Zhang M, Kennedy A M, Sibonga JD, Rickard DJ, Spelsberg TC, Turner RT. 2-methoxyestradiol induces interferon gene expression and apoptosis in osteosarcoma cells. Bone. 2002; 30:393–398.
36. Gorska M, Gammazza AM, Zmijewski MA, Campanella C, Cappello F, Wasiewicz T, Kuban-Jankowska A, Daca A, Sielicka A, Popowska U, Knap N, Antoniewicz J, Wakabayashi T, Wozniak M. Geldanamycin-Induced Osteosarcoma Cell Death Is Associated with Hyperacetylation and Loss of Mitochondrial Pool of Heat Shock Protein 60. Plos One. 2013; 8.
37. Fenech M. The in vitro micronucleus technique. Mutation Research-Fundamental and Molecular Mechanisms of Mutagenesis. 2000; 455:81–95.
38. Fenech M, Chang WP, Kirsch-Volders M, Holland N, Bonassi S, Zeiger E. HUMN project: detailed description of the scoring criteria for the cytokinesis-block micronucleus assay using isolated human lymphocyte cultures. Mutation Research-Genetic Toxicology and Environmental Mutagenesis. 2003; 534:65–75.
39. Lewinska A, Siwak J, Rzeszutek I, Wnuk M. Diosmin induces genotoxicity and apoptosis in DU145 prostate cancer cell line. Toxicol In Vitro. 2014; 3:417–425.
40. Kojima H, Nakatsubo N, Kikuchi K, Kawahara S, Kirino Y, Nagoshi H, Hirata Y, Nagano T. Detection and imaging of nitric oxide with novel fluorescent indicators: diaminofluoresceins. Anal Chem. 1998; 70:2446–53.
41. Rodriguez-Rodriguez R, Simonsen U. Measurement of Nitric Oxide and Reactive Oxygen Species in the Vascular Wall. Current Analytical Chemistry. 2012; 8:00–001.
42. Chamaon K, Stojek J, Kanakis D, Braeuninger S, Kirches E, Krause G, Mawrin C, Dietzmann K. Micromolar concentrations of 2-methoxyestradiol kill glioma cells by an apoptotic mechanism, without destroying their microtubule cytoskeleton. Journal of Neuro-Oncology. 2005; 72:11–16.
43. Golebiewska J, Rozwadowski P, Spodnik JH, Knap N, Wakabayashi T, Wozniak M. Dual effect of 2-methoxyestradiol on cell cycle events in human osteosarcoma 143B cells. Acta Biochimica Polonica. 2002; 49:59–65.
44. Li L, Heldin NE, Grawe J, Ulmsten U, Fu X. Induction of apoptosis or necrosis in human endometrial carcinoma cells by 2-methoxyestradiol. Anticancer Research. 2004; 24:3983–3990.
45. Kuo KL, Lin WC, Ho IL, Chang HC, Lee PY, Chung YT, Hsieh JT, Pu YS, Shi CS, Huang KH. 2-Methoxyestradiol Induces Mitotic Arrest, Apoptosis, and Synergistic Cytotoxicity with Arsenic Trioxide in Human Urothelial Carcinoma Cells. Plos One. 2013; 8.
46. Wimbauer F, Yang C, Shogren KL, Zhang M, Goyal R, Riester SM, Yaszemski MJ, Maran A. Regulation of interferon pathway in 2-methoxyestradiol-treated osteosarcoma cells. Bmc Cancer. 2012; 12.
47. Sutherland TE, Anderson RL, Hughes RA, Altmann E, Schuliga M, Ziogas J, Stewart AG. 2-methoxyestradiol - a unique blend of activities generating a new class of anti-tumour/anti-inflammatory agents. Drug Discovery Today. 2007; 12:577–584.
48. Peyrat JF, Brion JD, Alami M. Synthetic 2-Methoxyestradiol Derivatives: Structure-Activity Relationships. Current Medicinal Chemistry. 2012; 19:4142–4156.
49. Cicek M, Iwaniec UT, Goblirsch MJ, Vrabel A, Ruan M, Clohisy DR, Turner RR, Oursler MJ. 2-methoxyestradiol suppresses osteolytic breast cancer tumor progression in vivo. Cancer Research. 2007; 67:10106–10111.
50. Rajkumar SV, Richardson PG, Lacy MQ, Dispenzieri A, Greipp PR, Witzig TE, Schlossman R, Sidor CF, Anderson KC, Gertz MA. Novel therapy with 2-methoxyestradiol for the treatment of relapsed and plateau phase multiple myeloma. Clinical Cancer Research. 2007; 13:6162–6167.
51. Dahut WL, Lakhani NJ, Gulley JL, Arlen PM, Kohn EC, Kotz H, McNally D, Parr A, Nguyen D, Yang SX, Steinberg SM, Venitz J, Sparreboom A, Figg WD. Phase I clinical trial of oral 2-methoxyestradiol, an antiangiogenic and apoptotic agent, in patients with solid tumors. Cancer Biology & Therapy. 2006; 5:22–27.
52. Sweeney C, Liu G, Yiannoutsos C, Kolesar J, Horvath D, Staab MJ, Fife K, Armstrong V, Treston A, Sidor C, Wilding G. A phase II multicenter, randomized, double-blind, safety trial assessing the pharmacokinetics, pharmacodynamics, and efficacy of oral 2-methoxyestradiol capsules in hormone-refractory prostate cancer. Clinical Cancer Research. 2005; 11:6625–6633.
53. Kohen P, Henriquez S, Rojas C, Gerk PM, Palomino WA, Strauss J F, Devoto L. 2-Methoxyestradiol in the human corpus luteum throughout the luteal phase and its influence on lutein cell steroidogenesis and angiogenic activity. Fertility and Sterility. 2013; 100:1397.
54. Song IS, Jeong YJ, Jeong SH, Heo HJ, Kim HK, Lee SR, Ko TH, Youm JB, Kim N, Ko KS, Rhee BD, Han J. Combination treatment with 2-methoxyestradiol overcomes bortezomib resistance of multiple myeloma cells. Experimental and Molecular Medicine. 2013; 45.
55. Zhang X, Huang H, Xu Z, Zhan R. 2-Methoxyestradiol blocks cell-cycle progression at the G(2)/M phase and induces apoptosis in human acute T lymphoblastic leukemia CEM cells. Acta Biochimica Et Biophysica Sinica. 2010; 42:615–622.
56. Lee YM, Ting CM, Cheng YK, Fan TP, Wong RNS, Lung ML, Mak NK. Mechanisms of 2-methoxyestradiol-induced apoptosis and G2/M cell-cycle arrest of nasopharyngeal carcinoma cells. Cancer Letters. 2008; 268:295–307.
57. Zhang YH, Casadei B. Sub-cellular targeting of constitutive NOS in health and disease. Journal of Molecular and Cellular Cardiology. 2012; 52:341–350.
58. Villanueva C, Giulivi C. Subcellular and cellular locations of nitric oxide synthase isoforms as determinants of health and disease. Free Radical Biology and Medicine. 2010; 49:307–316.
59. Korzhevskiĭ DE, Otellin VA, Grigor’ev IP, Petrova ES, Gilerovich EG, Zin’kova NN. Immunocytochemical demonstration of neuronal NO-synthase in rat brain cells. Nitric Oxide. 2014; 14:1089–8603.
60. Alderton WK, Cooper CE, Knowles RG. Nitric oxide synthases: structure, function and inhibition. Biochemical Journal. 2001; 357:593–615.
61. Sheta EA, Roman LJ, McMillan K, Masters BSS. Evidence for a bidomain structure of constitutive brain nitric-oxide synthase. Faseb Journal. 1994; 8:A363–A363.
62. Lowe PN, Smith D, Stammers DK, RiverosMoreno V, Moncada S, Charles I, Boyhan A. Identification of the domains of neuronal nitric oxide synthase by limited proteolysis. Biochemical Journal. 1996; 314:55–62.
63. Cortese-Krott MM, Rodriguez-Mateos A, Kuhnle GGC, Brown G, Feelisch M, Kelm M. A multilevel analytical approach for detection and visualization of intracellular NO production and nitrosation events using diaminofluoresceins. Free Radical Biology and Medicine. 2012; 53:2146–2158.
64. Xian JA, Guo H, Li B, Miao YT, Ye JM, Zhang SP, Pan XB, Ye CX, Wang AL, Hao XM. Measurement of intracellular nitric oxide (NO) production in shrimp haemocytes by flow cytometry. Fish & Shellfish Immunology. 2013; 35:2032–2039.
65. Qanungo S, Basu A, Das M, Haldar S. 2-methoxyestradiol induces mitochondria dependent apoptotic signaling in pancreatic cancer cells. Oncogene. 2002; 21:4149–4157.
66. Lambert C, Apel K, Biesalski HK, Frank J. 2-Methoxyestradiol induces caspase-independent, mitochondria-centered apoptosis in DS-sarcoma cells. International Journal of Cancer. 2004; 108:493–501.
67. Schmidt H, Hofmann H, Schindler U, Shutenko ZS, Cunningham DD, Feelisch M. No center dot NO from NO synthase. Proceedings of the National Academy of Sciences of the United States of America. 1996; 93:14492–14497.
68. Hobbs AJ, Fukuto JM, Ignarro LJ. Formation of free nitric-oxide from l-arginine by nitric-oxide synthase - direct enhancement of generation by superoxide-dismutase. Proceedings of the National Academy of Sciences of the United States of America. 1994; 91:10992–10996.
69. List BM, Klosch B, Volker C, Gorren ACF, Sessa WC, Werner ER, Kukovetz WR, Schmidt K, Mayer B. Characterization of bovine endothelial nitric oxide synthase as a homodimer with down-regulated uncoupled NADPH oxidase activity: Tetrahydrobiopterin binding kinetics and role of haem in dimerization. Biochemical Journal. 1997; 323:159–165.
70. Stroes E, Hijmering M, van Zandvoort M, Wever R, Rabelink TJ, van Faassen EE. Origin of superoxide production by endothelial nitric oxide synthase. Febs Letters. 1998; 438:161–164.
71. Roe ND, Ren J. Nitric oxide synthase uncoupling: A therapeutic target in cardiovascular diseases. Vascular Pharmacology. 2012; 57:168–172.
72. Cortese-Krott MM, Fernandez BO, Kelm M, Butler AR, Feelisch M. On the chemical biology of the nitrite/sulfide interaction. Nitric Oxide. 2014; 14:089–8603.
73. Kirsch M, de Groot H. Formation of peroxynitrite from reaction of nitroxyl anion with molecular oxygen. Journal of Biological Chemistry. 2002; 277:13379–13388.
74. Stumpff J, Ghule PN, Shimamura A, Stein JL, Greenblatt M. Spindle Microtubule Dysfunction and Cancer Predisposition. Journal of Cellular Physiology. 2014; 229:1881–1883.
75. Aparicio T, Baer R, Gautier J. DNA double-strand break repair pathway choice and cancer. DNA Repair. 2014; 19:169–175.
76. Jenkins G, O’Byrne KJ, Panizza B, Richard DJ. Genome stability pathways in head and neck cancers. International journal of genomics. 2013; 464720.
77. Colnaghi R, Carpenter G, Volker M, O’Driscoll M. The consequences of structural genomic alterations in humans: Genomic Disorders, genomic instability and cancer. Seminars in Cell & Developmental Biology. 2011; 22:875–885.
78. Bridge G, Rashid S, Martin SA. DNA mismatch repair and oxidative DNA damage: implications for cancer biology and treatment. Cancers. 2014; 6:1597–1614.
79. Hasselbalch HC. Chronic inflammation as a promotor of mutagenesis in essential thrombocythemia, polycythemia vera and myelofibrosis. A human inflammation model for cancer development? Leukemia Research. 2013; 37:214–220.
80. Reily Rocha CR, Lerner LK, Okamoto OK, Marchetto MC, Martins Menck CF. The role of DNA repair in the pluripotency and differentiation of human stem cells. Mutation Research-Reviews in Mutation Research. 2013; 752:25–35.
81. Nowsheen S, Aziz K, Kryston TB, Ferguson NF, Georgakilas A. The Interplay Between Inflammation and Oxidative Stress in Carcinogenesis. Current Molecular Medicine. 2012; 12:672–680.
82. Folkes LK, O’Neill P. DNA damage induced by nitric oxide during ionizing radiation is enhanced at replication. Nitric Oxide-Biology and Chemistry. 2013; 34:47–55.
83. Folkes LK, O’Neill P. Modification of DNA damage mechanisms by nitric oxide during ionizing radiation. Free Radical Biology and Medicine. 2013; 58:14–25.
84. Wiseman H, Halliwell B. Damage to DNA by reactive oxygen and nitrogen species: Role in inflammatory disease and progression to cancer. Biochemical Journal. 1996; 313:17–29.
85. Mikhailenko VM, Muzalov II. Exogenous nitric oxide potentiate DNA damage and alter DNA repair in cells exposed to ionising radiation. Experimental oncology. 2013; 35:318–324.
86. Laval F, Wink DA, Laval J. A discussion of mechanisms of NO genotoxicity: implication of inhibition of DNA repair proteins. Reviews of physiology, biochemistry and pharmacology. 1997; 131:175–191.
87. Bossy-Wetzel E, Lipton SA. Nitric oxide signaling regulates mitochondrial number and function. Cell Death Differ. 2003; 10:757–60.
88. Cooke MS, Evans MD, Dizdaroglu M, Lunec J. Oxidative DNA damage: mechanisms, mutation, and disease. Faseb Journal. 2003; 17:1195–1214.
89. Xu B, Wang WX, Guo HY, Sun ZL, Wei Z, Zhang XY, Liu ZJ, Tischfield JA, Gong YQ, Shao CS. Oxidative stress preferentially induces a subtype of micronuclei and mediates the genomic instability caused by p53 dysfunction. Mutation Research-Fundamental and Molecular Mechanisms of Mutagenesis. 2014; 770:1–8.
90. Kundu JK, Surh YJ. Inflammation: Gearing the journey to cancer. Mutation Research-Reviews in Mutation Research. 2008; 659:15–30.
91. Schumacker PT. Reactive oxygen species in cancer cells: Live by the sword, die by the sword. Cancer Cell. 2006; 10:175–176.
92. Zou H, Zhao S, Zhang J, Lv G, Zhang X, Yu H, Wang H, Wang L. Enhanced radiation-induced cytotoxic effect by 2-ME in glioma cells is mediated by induction of cell cycle arrest and DNA damage via activation of ATM pathways. Brain Research. 2007; 1185:231–238.
93. Khoei S, Delfan S, Neshasteh-Riz A, Mandavi SR. Evaluation of the Combined Effect of 2ME2 and Co-60 on the Inducement of DNA Damage by IUdR in a Spheroid Model of the U87MG Glioblastoma Cancer Cell Line Using Alkaline Comet Assay. Cell Journal. 2011; 13:83–90.
94. Kerbel RS, Rak J, Kobayashi H, Man MS, Stcroix B, Graham CH. Multicellular resistance - a new paradigm to explain aspects of acquired drug-resistance of solid tumors. Cold Spring Harbor Symposia on Quantitative Biology. 1994; 59:661–672.
95. Sullivan R, Graham CH. Chemosensitization of cancer by nitric oxide. Current Pharmaceutical Design. 2008; 14:1113–1123.
96. Frederiksen LJ, Siemens DR, Heaton JP, Maxwell LR, Adams MA, Graham CH. Hypoxia induced resistance to doxorubicin in prostate cancer cells is inhibited by low concentrations of glyceryl trinitrate. Journal of Urology. 2003; 170:1003–1007.
97. Frederiksen LJ, Sullivan R, Maxwell LR, Macdonald-Goodfellow SK, Adams MA, Bennett BM, Siemens DR, Graham CH. Chemosensitization of cancer in vitro and in vivo by nitric oxide signaling. Clinical Cancer Research. 2007; 13:2199–2206.
98. Riganti C, Miraglia E, Viarisio D, Costamagna C, Pescarmona G, Ghigo D, Bosia A. Nitric oxide reverts the resistance to doxorubicin in human colon cancer cells by inhibiting the drug efflux. Cancer Research. 2005; 65:516–525.
99. Konovalova NP, Goncharova SA, Volkova LM, Rajewskaya TA, Eremenko LT, Korolev AM. Nitric oxide donor increases the efficiency of cytostatic therapy and retards the development of drug resistance. Nitric Oxide-Biology and Chemistry. 2003; 8:59–64.
100. Tian H, Gao Z, Li H, Zhang B, Wang G, Zhang Q, Pei D, Zheng J. DNA damage response - A double-edged sword in cancer prevention and cancer therapy. Cancer Lett. 2014; 17:0304–3835.
101. Kuijjer ML, Hogendoorn PC, Cleton-Jansen AM. Genome-wide analyses on high-grade osteosarcoma: making sense of a genomically most unstable tumor. J Cancer. 2013; 11:2512–21.