
INTRODUCTION
Colorectal cancer (CRC) is one of the main causes for morbidity and mortality worldwide, and represents the fourth most common cancer in men and the third in women [1, 2].
Prediction of outcome in CRC is based on the TNM staging classification, which constitutes a good predictor of survival in patients with TNM Stage I and IV with survival rates of 90–95% and < 10%, respectively [3]. However, in patients with intermediate TNM Stages II and III, within survival rates of 70–85% and 40–80% respectively [3], the prediction of outcome is often imprecise with relevant consequences in the clinical outcome and quality of life of patients. Consequently, identification of novel biomarkers that improve the prognostic ability in these CRC stages is needed, and constitutes a main objective of scientific research in the area [4–7].
Recently, altered metabolism has been added to the list of core hallmarks of cancer [8]. It is well known that lipid metabolism plays a crucial role in different types of cancer due to the special requirements of cancer cells to sustain the additional energetic and biosynthetic precursor demands for cell proliferation [9, 10]. These changes in lipid metabolism affect essential cellular processes [10, 11], and overexpression of lipogenic enzymes has been reported as a common characteristic of many cancers [11–13]. In fact, key enzymes involved in lipid-metabolic pathways are differentially expressed in normal and tumoral tissues, and some of them have been individually proposed as prognosis markers in cancer [12]. However, the analysis of dysregulated expression of lipid metabolic enzymes as a whole in carcinogenesis remains to be established [14].
Here, for the first time, gene expression levels of a wide-range of lipid metabolism-related genes to identify different metabolic patterns conferring tumor energetic advantage consequently associated with worse clinical outcome, are analyzed in stage II CRC patients.
RESULTS
Global analysis of lipid metabolism-related genes in stage II-CRC patients
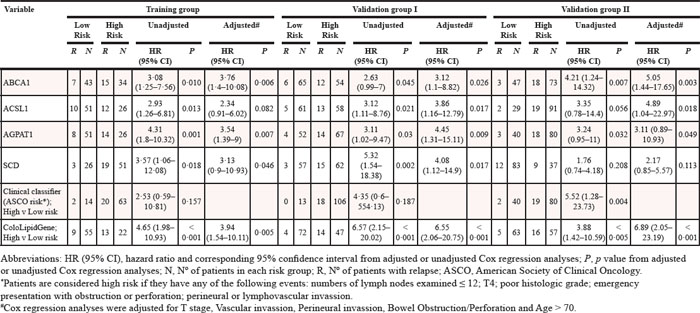
With the aim of classifying patients within the same clinicopathological stage according to their molecular metabolic characteristics, we carried out a global and simultaneous analysis of lipid metabolism-related genes in a training group of 77 samples of patients with stage II-CRC patients. Median follow-up of these patients was 71.5 months. The 3-year DFS was 72.3% and we identified local and/or distant recurrence in 22 patients (28.57%), of which 13 patients (59.01%) died of CRC. Thirty patients (38.96%) did not receive adjuvant treatment, whereas 47 patients (61.04%) received chemotherapy based on 5FU-LV (Fluoracil-Leucovorin) treatment. List of 70 lipid metabolism-related genes selected by their crucial regulatory role of lipid pathways and their involvement in different aspects of lipid metabolism is shown in Table 1. Detailed clinico-histopathological characteristics of these patients are summarized in Table 2.
Results showed that 16 out of the 70 genes analyzed in this study were differentially distributed in the tumors with a putative association between expression levels and worse clinical outcome in this training group of stage II CRC patients (Table 1), suggesting that specific pathways of lipid metabolism might be specially related to increased malignancy.
Development of a metabolic-related gene expression signature
The putative interactions among the different genes and the combination of different metabolic patterns were assayed, and models constituting a prognostic signature were constructed selecting the multivariate model with largest c-index (0.72) using 100 times 5-fold cross-validation (CV). A gene expression signature composed of the combination of 4 lipid metabolism-related genes was selected due to its high score to predict DFS, and designated as ColoLipidGene signature. ColoLipidGene, constituted by the combination of ABCA1, ACSL1, AGPAT1 and SCD, genes involved in lipid transport, fatty acid activation and phospholipid-related signaling, was able to significantly predict risk of relapse of CRC patients within the same stage II with a HR (95% CI): 4.65 (1.98–10.93), log-rank p < 0.001 (Figure 1). 3-year DFS in patients from High risk group classified by ColoLipidGene was 41% (95% CI: 0.25–0.68) compared with 85% (95% CI: 0.76–0.95) in patients from low risk group. To evaluate whether ColoLipidGene might constitute an independent prognostic classifier, clinical and histopathological data were included in both univariate and multivariate Cox regression analyses. In univariate analysis, tumor size (T), vascular invasion, perineural invasion and bowel obstruction/perforation were the strongest clinical variables associated with prognosis in these patients (Table 3), which were included in the multivariate analysis, together with age > 70 as main nonmodifiable risk factor. Results obtained in the multivariate analysis revealed that ColoLipidGene was an independent prognostic classifier for DFS with 4-fold increased risk of relapse for stage II CRC patients positive for this molecular test [HR (95% CI): 3.94 (1.54–10.11), p = 0.005; Table 4], establishing an association between high expression levels of these four genes that constituted ColoLipidGene and worse clinical outcome in these stage II CRC patients.
Table 1: Lipid metabolism-related genes include in the study. HR (95% CI): genes with significant association with tumor progression in the training group.
Metabolic Pathway |
Symbol |
Gene name |
Chromosome location |
HR (95% CI) |
P |
Adipocytokine signaling and immune homeostasis |
ADIPOQ |
Adiponectin, C1Q and collagen domain containing |
3q27 |
||
CFI |
Complement factor I |
4q25 |
|||
PPARGC1A |
Peroxisome proliferator-activated receptor gamma, coactivator 1 alpha |
4p15.1 |
|||
SLC2A4 |
Solute carrier family 2 (facilitated glucose transporter), member 4 |
17p13 |
|||
Bile acid biosynthesis |
ABCB11 |
ATP-binding cassette, sub-family B (MDR/TAP), member 11 |
2q24 |
||
SLC10A2 |
Solute carrier family 10 (sodium/bile acid cotransporter family), member 2 |
13q33 |
|||
SLCO1A2 |
Solute carrier organic anion transporter family, member 1A2 |
12p12 |
|||
SLCO1B1 |
Solute carrier organic anion transporter family, member 1B1 |
12p |
|||
Endocytosis of specific ligands |
LDLR |
Low density lipoprotein receptor |
19p13.2 |
||
Fatty acid biosynthesis |
ACACA |
Acetyl-Coenzyme A carboxylase alpha |
17q21 |
||
FADS1 |
Fatty acid desaturase 1 |
11q12.2–q13.1 |
|||
FADS2 |
Fatty acid desaturase 2 |
11q12.2 |
0.39 (0.16–0.93) |
0.0298 |
|
FADS3 |
Fatty acid desaturase 3 |
11q12–q13.1 |
|||
FADS6 |
Fatty acid desaturase domain family, member 6 |
17q25.1 |
|||
FASN |
Fatty acid synthase |
17q25 |
|||
SCD |
Stearoyl-CoA desaturase (delta-9-desaturase) |
10q24.31 |
3.57 (1.06–12.08) |
0.0181 |
|
SCD5 |
Stearoyl-CoA desaturase 5 |
4q21.22 |
|||
Fatty acid β-oxidation |
ACADM |
Acyl-Coenzyme A dehydrogenase, C-4 to C-12 straight chain |
1p31 |
4.39 (1.03–18.8) |
0.0152 |
ACAT1 |
Acetyl-Coenzyme A acetyltransferase 1 |
11q22.3 |
|||
ACLY |
ATP citrate lyase |
17q21.2 |
|||
ACSM4 |
Acyl-CoA synthetase medium-chain family member 4 |
12p13.31 |
|||
ACSS2 |
Acyl-CoA synthetase short-chain family member 2 |
20q11.22 |
|||
ECHS1 |
Enoyl Coenzyme A hydratase, short chain, 1, mitochondrial |
10q26.2–q26.3 |
|||
HADH |
Hydroxyacyl-Coenzyme A dehydrogenase |
4q22–q26 |
|||
HMGCL |
3-Hydroxymethyl-3-methylglutaryl-Coenzyme A lyase |
1p36.1-p35 |
2.83 (1.04–7.69) |
0.0271 |
|
HMGCS2 |
3-Hydroxy-3-methylglutaryl-Coenzyme A synthase 2 (mitochondrial) |
1p13-p12 |
3.81 (0.89–16.31) |
0.031 |
|
PPA1 |
Pyrophosphatase (inorganic) 1 |
10q11.1–q24 |
|||
SLC25A20 |
Solute carrier family 25 (carnitine/acylcarnitine translocase), member 20 |
3p21.31 |
|||
Lipid metabolism in peroxisomes |
ACOT8 |
Acyl-CoA thioesterase 8 |
20q13.12 |
||
ACOX2 |
Acyl-Coenzyme A oxidase 2, branched chain |
3p14.3 |
2.9 (1.21–6.93) |
0.014 |
|
ACOX3 |
Acyl-Coenzyme A oxidase 3, pristanoyl |
4p15.3 |
2.4 (1.03–5.58) |
0.0474 |
|
ACSL1 |
Acyl-CoA synthetase long-chain family member 1 |
4q35 |
2.93 (1.26–6.81) |
0.0128 |
|
ACSL3 |
Acyl-CoA synthetase long-chain family member 3 |
2q34–q35 |
|||
ACSL4 |
Acyl-CoA synthetase long-chain family member 4 |
Xq22.3–q23 |
4.92 (2.09–11.62) |
0.0003 |
|
AGPS |
Alkylglycerone phosphate synthase |
2q31.2 |
|||
AMACR |
Alpha-methylacyl-CoA racemase |
5p13 |
|||
FAR1 |
Fatty acyl CoA reductase 1 |
11p15.2 |
|||
FAR2 |
Fatty acyl CoA reductase 2 |
12p11.22 |
|||
GNPAT |
Glyceronephosphate O-acyltransferase |
1q42 |
|||
HSD17B4 |
Hydroxysteroid (17-beta) dehydrogenase 4 |
5q21 |
2.64 (1.11–6.29) |
0.025 |
|
SCP2 |
Sterol carrier protein 2 |
1p32 |
|||
Phospholipids metabolism |
LIPH |
Lipase, member H |
3q27 |
||
MBOAT1 |
Membrane bound O-acyltransferase domain containing 1 |
6p22.3 |
|||
MBOAT2 |
Membrane bound O-acyltransferase domain containing 2 |
2p25.1 |
|||
PPAR signaling |
CYP7A1 |
Cytochrome P450, family 7, subfamily A, polypeptide 1 |
8q11-q12 |
||
FABP4 |
Fatty acid binding protein 4, adipocyte |
8q21 |
|||
PLIN1 |
Perilipin 1 |
15q26 |
|||
PPARD |
Peroxisome proliferator-activated receptor delta |
6p21.2 |
|||
PPARG |
Peroxisome proliferator-activated receptor gamma |
3p25 |
|||
Cholesterol transport |
ABCA1 |
ATP-binding cassette, sub-family A (ABC1), member 1 |
9q31.1 |
3.08 (1.25–7.56) |
0.010 |
ABCG5 |
ATP-binding cassette, sub-family G (WHITE), member 5 |
2p21 |
|||
Triacylglycerol metabolism |
AGPAT1 |
1-Acylglycerol-3-phosphate O-acyltransferase 1 (lysophosphatidic acid acyltransferase, alpha) |
6p21.3 |
4.31 (1.8–10.32) |
0.0008 |
AGPAT2 |
1-Acylglycerol-3-phosphate O-acyltransferase 2 (lysophosphatidic acid acyltransferase, beta) |
9q34.3 |
3.37 (1.45–7.81) |
0.0052 |
|
AGPAT3 |
1-Acylglycerol-3-phosphate O-acyltransferase 3 |
21q22.3 |
3.78 (1.28–11.17) |
0.0068 |
|
AGPAT4 |
1-Acylglycerol-3-phosphate O-acyltransferase 4 (lysophosphatidic acid acyltransferase, delta) |
6q26 |
|||
AGPAT5 |
1-Acylglycerol-3-phosphate O-acyltransferase 5 (lysophosphatidic acid acyltransferase, epsilon) |
8p23.1 |
|||
DGAT1 |
Diacylglycerol O-acyltransferase homolog 1 (mouse) |
8q24.3 |
|||
LIPG |
Lipase, endothelial |
18q21.1 |
|||
MGLL |
Monoglyceride lipase |
3q21.3 |
|||
Regulation of the hepatocyte growth factor (HGF) |
SPINT1 |
Serine peptidase inhibitor, Kunitz type 1 |
15q15.1 |
3.96 (1.17–13.41) |
0.010 |
ST14 |
Suppression of tumorigenicity 14 (colon carcinoma) |
11q24-q25 |
|||
Receptors and basement membrane glycoproteins |
MC3R |
Melanocortin 3 receptor |
20q13.2-q13.3 |
||
MC4R |
Melanocortin 4 receptor |
18q22 |
|||
NID1 |
Nidogen 1 |
1q43 |
2.76 (0.93–8.17) |
0.043 |
|
NID2 |
Nidogen 2 (osteonidogen) |
14q22.1 |
|||
Biosynthesis of metabolic components |
GCG |
Glucagon |
2q36-q37 |
||
MGAT1 |
Mannosyl (alpha-1,3-)-glycoprotein beta-1,2-N-acetylglucosaminyltransferase |
5q35 |
|||
NAMPT |
Nicotinamide phosphoribosyltransferase |
7q22.3 |
|||
Fatty acid and guanine nucleotide-binding proteins |
FABP2 |
Fatty acid binding protein 2, intestinal |
4q28-q31 |
||
GNB3 |
Guanine nucleotide binding protein (G protein), beta polypeptide 3 |
12p13 |
Table 2: Detailed clinical and histopathological characteristics of patients included in the study
Characteristics |
Stage II CRC |
|||||||||||||
Training group |
Validation group I |
Validation group II |
||||||||||||
n° of Patients (%) |
n° of Patients (%) |
n° of Patients (%) |
||||||||||||
Total sample size (n) |
77 |
(100) |
119 |
(100) |
120 |
(100) |
||||||||
Age at Diagnosis (years) |
||||||||||||||
Mean |
68·22 |
66·08 |
— |
|||||||||||
Median |
69 |
66 |
— |
|||||||||||
Age Range |
32–86 |
26–91 |
33–88 |
|||||||||||
≤50 |
3 |
(3·90) |
15 |
(12·60) |
15 |
(12·5) |
||||||||
50–70 |
39 |
(50·65) |
58 |
(48·74) |
63 |
(52·5) |
||||||||
≥70 |
35 |
(45·45) |
46 |
(38·66) |
42 |
(35) |
||||||||
Sex |
||||||||||||||
Female |
33 |
(42·86) |
54 |
(45·38) |
60 |
(50) |
||||||||
Male |
44 |
(57·14) |
65 |
(54·62) |
60 |
(50) |
||||||||
Stage |
||||||||||||||
IIA (T3 N0 M0) |
56 |
(72·73) |
70 |
(58·82) |
99 |
(82·5) |
||||||||
IIB (T4 N0 M0) |
21 |
(27·27) |
49 |
(41·18) |
21 |
(17·5) |
||||||||
Regional Lymph Node Metastasis |
||||||||||||||
No Lymph node involvement (N0) |
77 |
(100) |
119 |
(100) |
120 |
(100) |
||||||||
1–3 Lymph node involvement (N1) |
||||||||||||||
≥4 Lymph node involvement (N2) |
||||||||||||||
Could not be assessed (Nx) |
||||||||||||||
Total Lymph Nodes Resected |
||||||||||||||
Mean Lymph nodes resected |
12·09 |
14·20 |
17·38 |
|||||||||||
Range of Lymph nodes examined |
1–29 |
0–43 |
3–43 |
|||||||||||
≤12 |
46 |
(59·7) |
54 |
(45·4) |
32 |
(26·67) |
||||||||
>12 |
30 |
−39 |
62 |
(52·1) |
87 |
(72·5) |
||||||||
Unknown |
1 |
(1·3) |
3 |
(2·5) |
1 |
(0·83) |
||||||||
Location of Primary |
||||||||||||||
Cecum and Ileocecal Valve |
2 |
(2·6) |
13 |
(10·92) |
9 |
(7·5) |
||||||||
Acending colon and Hepatic flexure |
29 |
(37·66) |
29 |
(24·37) |
24 |
(20) |
||||||||
Transverse colon |
6 |
(7·79) |
6 |
(5·04) |
6 |
(5) |
||||||||
Splenic flexure and Descending colon |
5 |
(6·49) |
17 |
(14·29) |
6 |
(5) |
||||||||
Sigmoid colon and rectosigmoid junction |
34 |
(44·16) |
54 |
(45·38) |
75 |
(62·5) |
||||||||
Rectum |
1 |
(1·3) |
0 |
0 |
||||||||||
Grade/Differentiation |
||||||||||||||
Well |
5 |
(6·49) |
10 |
(8·4) |
11 |
(9·17) |
||||||||
Moderately |
66 |
(85·71) |
95 |
(79·8) |
101 |
(84·16) |
||||||||
Poor |
5 |
(6·49) |
10 |
(8·4) |
8 |
(6·67) |
||||||||
Unknown |
1 |
(1·3) |
4 |
(3·4) |
0 |
|||||||||
Bowel Obstruction/Perforation |
||||||||||||||
Yes |
10 |
(12·99) |
45 |
(37·82) |
30 |
(25) |
||||||||
No |
67 |
(87·01) |
74 |
(62·18) |
90 |
(75) |
||||||||
Other Histological Features |
||||||||||||||
Perineural invasion |
12 |
(15·58) |
25 |
(21) |
20 |
(16·67) |
||||||||
Vascular invasion |
22 |
(28·57) |
31 |
(26·05) |
14 |
(11·67) |
||||||||
Adjuvant treatment |
||||||||||||||
5FU-LV* |
47 |
(61·04) |
0 |
0 |
||||||||||
Xelox/Folox |
0 |
76 |
(63·87) |
41 |
(34·17) |
|||||||||
No treatment |
30 |
(38·96) |
43 |
(36·13) |
79 |
(65·83) |
||||||||
Disease-free survival |
||||||||||||||
Patients with recurrence |
22 |
(28·57) |
18 |
(15·13) |
21 |
(17·5) |
||||||||
Overall survival |
||||||||||||||
n° of Exitus |
13 |
(16·88) |
11 |
(9·24) |
15 |
(12·5) |
||||||||
*5-Fluorouracil (5FU)-Leucovorin (LV)
ColoLipidGene validation
In order to confirm the association of these four lipid metabolism-related genes with the potential aggressiveness of the tumor, we evaluated lipidic gene expression analysis as previously indicated in an independent validation set of 119 stage II CRC patients (validation group I). Median follow-up and 3-year DFS of these patients was 43 months and 86.1% respectively. Eighteen out of the 119 patients relapsed with local and/or distant metastasis (15.3%), of which 11 patients (61.1%) died due to CRC. Forty-three patients (36.13%) did not receive adjuvant treatment, whereas 76 patients (63.87%) received chemotherapy based on Xelox or Folfox4 treatment Table 2). Gene expression analysis in the validation group confirmed the potential value of the 4-gene expression signature ColoLipidGene (c-index = 0.77) as a prognostic biomarker to identify stage II CRC patients at high risk of relapse [HR (95% CI): 6.57 (2.15–20.02), log-rank p < 0.001; Figure 1, Table 4]. Thus, 3-year DFS in patients from High risk group classified by this gene expression profile was 69% (95% CI: 0.57–0.84) compared with 97% (95% CI: 0.93–1) in patients from low risk group in the validation group 1. The multivariate analysis also confirmed ColoLipidGene as an independent prognostic classifier for DFS in the validation group I with 6.5-fold increased risk of relapse for stage II CRC patients [HR (95% CI): 6.55 (2.06–20.75), p < 0.001; Table 4].
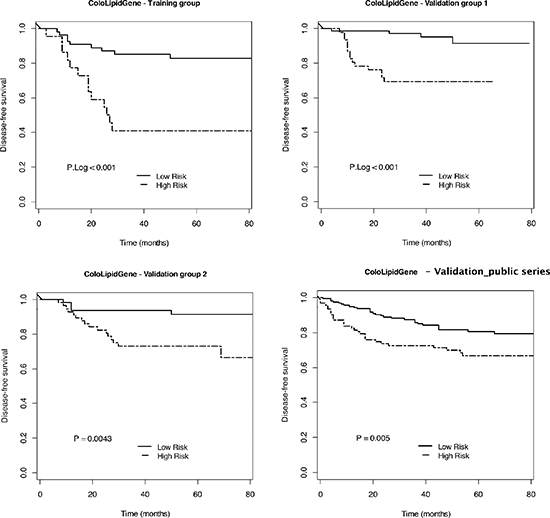
Figure 1: 4-gene expression signature to predict DFS in early-stage CRC patients. Kaplan-Meier plots for 4-gene expression signature ColoLipidGene and p Log Rank value in the training group, validation groups I and II, and GSE39582 series from Gene Expression Omnibus Database are shown. (Training group: Low risk n = 55, High risk n = 22; Validation group I: Low risk n = 72, High risk n = 47; Validation group II: Low risk n = 63, High risk n = 57; Validation in public GSE39582 series: Low risk n = 165, High risk n = 95).
Table 3: Univariate cox regression analysis for disease-free survival of the clinical parameters in stage II CRC patients
Variable |
Univariate analysis |
||||||
Training group |
Validation group I |
Validation group II |
|||||
HR (95% CI) |
P |
HR (95% CI) |
P |
HR (95% CI) |
P |
||
Age (continuous) |
1 (0·96–1·05) |
0·839 |
1·01 (0·98–1·05) |
0·492 |
1 (0·96–1·04) |
0·97 |
|
Age, > v ≤ 70 |
1·08 (0·46–2·52) |
0·863 |
1·37 (0·53–3·54) |
0·525 |
0·88 (0·34–2·26) |
0·786 |
|
Sex, male v female |
1·86 (0·76–4·56) |
0·163 |
1·48 (0·57–3·82) |
0·413 |
0·37 (0·14–0·96) |
0·032 |
|
Location of primary |
0·321 |
0·845 |
0·123 |
||||
(Reference: Sigmoid colon and rectosigmoid junction) |
Cecum and Ileocecal Valve |
NA |
0·81 (0·18–3·7) |
0·48 (0·06–3·6) |
|||
Acending colon and hepatic flexure |
0·77 (0·28–2·07) |
0·57 (0·16–2·07) |
0·81 (0·27–2·43) |
||||
Transverse, splenic flexure and descending colon |
1·57 (0·54–4·53) |
0·79 (0·22–2·86) |
NA |
||||
Rectum |
|||||||
Grade/Differentiation |
0·585 |
0·457 |
0·319 |
||||
(Reference: Moderate) |
Poor |
2·07 (0·48–8·92) |
1·51 (0·34–6·68) |
2·36 (0·69–8·05) |
|||
Well |
0·63 (0·08–4·72) |
2·31 (0·66–8·1) |
0·5 (0·07–3·74) |
||||
pT (T4 v T3) |
1·75 (0·73–4·17) |
0·223 |
3·19 (1·2–8·49) |
0·016 |
3·42 (1·42–8·27) |
0·011 |
|
Mean lymph nodes resected (continuous) |
1·01 (0·95–1·08) |
0·759 |
0·97 (0·91–1·04) |
0·435 |
0·92 (0·85–0·99) |
0·012 |
|
Range of lymph nodes examined, > v ≤ 12 |
1·74 (0·76–4·02) |
0·196 |
0·56 (0·22–1·46) |
0·230 |
0·27 (0·11–0·63) |
0·003 |
|
Adjuvant treatment, yes v no |
1·03 (0·43–2·45) |
0·952 |
1·27 (0·45–3·58) |
0·642 |
1·83 (0·54–6·26) |
0.173 |
|
Vascular invasion, yes v no |
1·08 (0·44–2·65) |
0·866 |
3·08 (1·22–7·78) |
0·020 |
4·44 (1·78–11·04) |
0·004 |
|
Perineural invasion, yes v no |
1·16 (0·39–3·43) |
0·793 |
3·04 (1·2–7·72) |
0·025 |
4·14 (1·69–10·13) |
0·004 |
|
Bowel obstruction/perforation, yes v no |
3·07 (1·19–7·87) |
0·034 |
1·59 (0·63–4) |
0·328 |
4·15 (1·76–9·79) |
0·002 |
|
Clinical classifier (ASCO risk*), High v Low risk |
2·53 (0·59–10·81) |
0·157 |
4·35 (0·6–554·13) |
0·187 |
5·52 (1·28–23·73) |
0·004 |
|
Abbreviations: NA, not available; HR (95% CI), hazard ratio and corresponding 95% confidence interval from univariate cox proportional hazards analysis; P, p value from univariate cox regression analysis; ASCO, American Society of Clinical Oncology.
*Patients are considered high risk if they have any of the following events: numbers of lymph nodes examined ≤ 12; T4; poor histologic grade; emergency presentation with obstruction or perforation; perineural or lymphovascular invassion.
Table 4: Uni- and multivariate cox regression analysis for disease-free survival of ColoLipidGene signature and individual composing genes, and the clinical classifier (ASCO clinical risk criteria) in stage II CRC patients
In order to further validate the prognostic strengthen of CololipidGene, we analyzed the expression levels of the metabolic-related gene signature in an independent set of 120 stage II CRC patients (validation group II) from hospitals located in different regions (Clinic University Hospital in Barcelona, La Fe University Hospital and Oncologic Institute of Valencia). Median follow-up and 3-year DFS of this group of 120 patients was 58.3 months and 84% respectively. Twenty-one out of the 120 patients relapsed with local and/or distant metastasis (17.5%), of which 15 patients (71.43%) died due to CRC. 79 patients (65.83%) did not receive adjuvant treatment, whereas 41 patients (34.17%) received chemotherapy (Table 2). As it is shown in Figure 1, ColoLipidGene prognostic value was further confirmed in this group of patients (c-index = 0.7), identifying stage II CRC patients with almost 7-fold higher risk of relapse 6.89 [HR (95% CI): 6.89 (2.05–23.19), p < 0.001; Table 4]. Similarly to the previously examined validation group 1, the 3-year DFS rates in the validation group 2 in patients from High risk group classified by ColoLipidGene was 73% (95% CI: 0.63–0.86) compared with 94% (95% CI: 0.88–1) in patients from low risk group in this group of stage II CRC patients.
Thus, ColoLipidGene was revealed as an independent prognostic classifier for DFS in all groups of stage II CRC patients, showing stronger power and accuracy than any other variables, including the currently used clinical classification. Of note, though to a lower extent, all genes defining ColoLipidGene combined biomarker constitutes individual biomarkers of prognosis of stage II-CRC patients (Figure 2), facilitating the interpretation of the results. Thus, after adjusting for potential confounding factors, the increased risk of relapse (pooled hazard ratios based on random-effects meta-analysis) for patients with increased levels of ABCA1, ACSL1, AGPAT1 or SCD was of HR (95% CI): 3.78 (2.03–7.03), p < 0.001; HR (95% CI): 3.14 (1.61–6.13), p < 0.001; HR (95% CI): 3.65 (1.93–6.91), p < 0.001; and HR (95% CI): 2.81 (1.46–5.38), p = 0.002 respectively. This is, higher levels of either ABCA1, ACSL1, AGPAT1 or SCD is associated with worse clinical outcome of the patients as independent molecular factors, further supporting the strength of their combined analysis as ColoLipidGene metabolic biomarker.
Additionally, to further validate the prognosis prediction ability of ColoLipidGene, we evaluate its prognostic value in public gene expression data of colon cancer patients from Gene Expression Omnibus Database. The public series was constituted for 566 patients with colon cancer, 264 out of the 566 with stage II colon cancer, including local and/or distant recurrence in 59 patients (22.34%). As it is shown in Figure 1, ColoLipidGene prognostic power was further confirmed in this group of independent stage II colon cancer patients (p Log Rank value < 0.005), identifying patients with almost 2-fold higher risk of relapse [HR (95% CI): 2.05 (1.23–3.42), p = 0.006]. 3-year DFS in patients from High risk group classified by ColoLipidGene was 73% (95% CI: 0.64–0.82) compared with 86% (95% CI: 0.80–0.92) in patients from Low risk group in these group of stage II colon cancer patients from public database. These results obtained in four independent groups of stage II colon cancer patients obtained in different time points and locations, confirm the potential use of these metabolic biomarker as a prognostic tool in early-stage colon cancer patients.
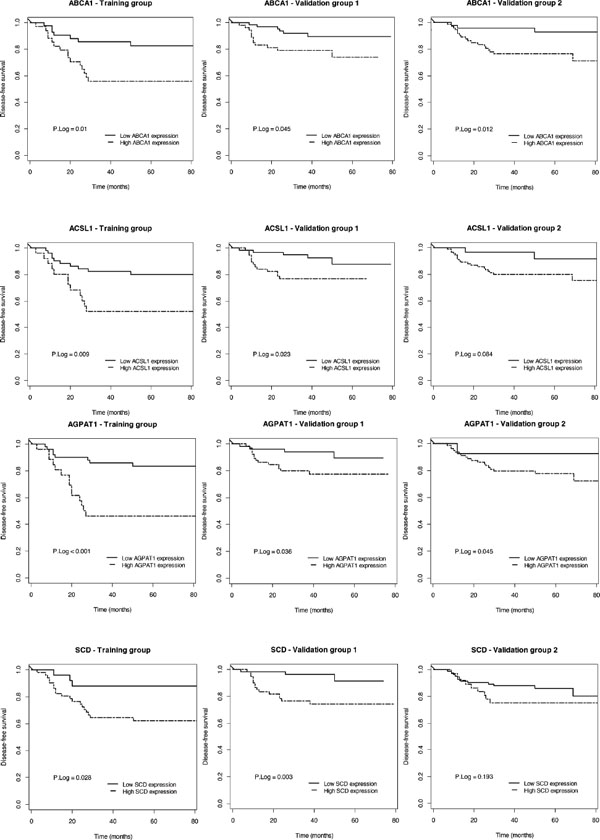
Figure 2: Prognostic value of individual genes constituting ColoLipidGene in the different group of patients. Kaplan-Meier plots for individual genes of ColoLipidGene and p Log Rank value in the training group and validation groups I and II are shown.
DISCUSSION
Currently, outcome prediction in CRC is based on TNM or Dukes staging classification system, insufficient for accurately predicting survival of stage II-CRC patients, in which chemotherapy administration is one of the decision to make in patient management. Thus, new biomarkers to better stratify and correctly prescribe the best treatment for precise patients to optimize outcome, reduce adverse toxicity events, reduce cost-effectiveness ratios is a necessary demand for early-stage CRC patients.
Several studies have recently proposed complex gene expression profiles to predict OS and DFS in CRC patients, but neither of them is focused on lipid metabolism [4–7]. Most of these proposed molecular biomarkers contain a large number of genes that might complicate the experimental application, with limited biological significance of the combination of genes that might also complicate the interpretation of results. Wang and colleagues developed a 23-gene expression signature studied in 74 stage II-CRC [15]. However, a completely different 30-gene expression signature was proposed by Barrier and colleagues in another group of stage II colon cancer patients by using the same Genechip and different results were obtained when they studied the predictive value of the 23-gene expression signature proposed by Wang and colleagues in their patients [16]. Oncotype Dx Colon Cancer test is based on mRNA expression of 12 target genes, and was validated in a large clinical trial of primary CRC cases, finding clinical utility when used as a complement to T stage and mismatch repair status, specifically for patients who have T3, MMR-proficient, stage II disease [17, 18]. The ColoPrint gene signature uses 18 genes on a microarray platform. The classifier was applied in a training set (n = 188) of stage I, II and III, but they didn't show significant prognostic value for DFS within each stage, and the robustness of the signature is awaiting evaluation in a prospective trial [6]. Currently, only one prognosis test for stage II and III CRC patients, the ColoGuidePro, has been designed with less than 8 genes. However, this 7-gene expression signature only stratified stage III CRC patients, whereas prediction of relapse of stage-II patients was not validated [7]. Thus, evidence stand out the necessity of understanding the biological significance of a biomarker to properly applied obtained information, and recent research has been focused on defining molecular subtypes (including “mesenchymal” and “stem cell”) [19]. In this sense, different metabolic profiles might provide not only information regarding molecular subtypes related to energetic capacity of tumoral cells, but also might provide new therapeutic options involving the inhibition of these pathways, pointing at the putative clinical relevance of this study.
Altered cellular metabolism is considered an important hallmark of cancer [8] and several enzymes involved in lipid metabolism have been shown to be involved in tumor malignancy [11, 12]. Here, we analyzed for the first time the putative association between global expression of lipid metabolism-related genes and prediction of outcome in early-stage CRC patients. Results from three different groups of patients recruited within different time points and by hospitals located in different regions, and from public whole human genome Microarray data of colon cancer patients from Gene Expression Omnibus Database, point at activation of ABCA1, ACSL1, AGPAT1 and SCD as main relevant metabolic factors in malignant progression. ATP-Binding Cassette Subfamily-A Member 1 (ABCA1), identified as a major regulator of phospholipid homeostasis, is involved in transport of cellular cholesterol from peripheral cells and tissues. The expression of ABC transporters (including ABCA1) have been associated with deregulation in one of the most drug-resistant cancers, the pancreatic ductal adenocarcinoma (PDAC) [20]. In addition, reported data suggest that ABCA1 gene might contribute to a more aggressive growth of multiple drug resistant melanomas [21], and the individual association of ABCA1 with a more aggressive phenotype of colorectal tumors has been also identified in an additional study focused on the relationship between metabolic syndrome and colorectal cancer (Vargas T et al., 2014) [22]. On the other hand, ACSL1 is an isozyme of Acyl-CoA synthetase (ACS) family, known to play an important role in lipid metabolism, cancer cell survival and apoptosis inhibition [11]. ACS converts long-chain fatty acids to acyl-CoA, a crucial step in several lipid metabolism pathways. Previous reports have indicated that other ACS isozymes, such as ACSL4 and ACSL5, are overexpressed in various types of cancer, including colon adenocarcinoma [11, 14, 23–27]. Namely, Triacsin C (a potent inhibitor of ACS, including ACSL1 [28]) induce massive apoptosis and selective cytotoxicity in cancer cells [11]. AGPAT1 encodes an enzyme that converts lysophosphatidic acid (LPA) into phosphatidic acid (PA), phospholipids involved in signal transduction and in lipid biosynthesis. While several studies have suggested the association between enhanced transcription of AGPAT2 and certain cancers or inflammation-associated diseases, neither of them have described the influence of AGPAT1 isoform on cancer prognosis [29]. Finally, the products of SCD (Stearoyl-CoA-desaturase 1) represent important precursors for the formation of complex lipids, and human SCD was found to be up-regulated in transformed cells and overexpressed in a variety of human cancers, being recently proposed as a potential target for cancer therapy [30]. These results suggest that activation of lipid metabolism through different metabolic steps is an essential event to facilitate early-stage tumor progression, probably due to both structural and energetic requirements of tumoral cells, as it has been previously proposed [12]. Thus, the combined activation of these four genes might ensure tumoral cells a competitive advantage through a quick supply of metabolic-related precursors through fatty acid and cholesterol metabolisms, and on the other hand avoiding lipidic-related toxicity through the alteration of the desaturase SCD.
We have identified a gene expression signature constituted of only 4 genes, as an independent prognostic biomarker of tumor progression for stage-II CRC patients, that exhibited better prognostic prediction within the same pathological stage even when compared with American Society of Clinical Oncology (ASCO) clinical risk criteria, suggesting its potential relevance as a complementary approach in clinical decision-making for this group of patients. Though further in vitro and in vivo work has still to be done to understand the contribution of ABCA1, ACSL1, AGPAT1 and SCD in tumor progression, it is important to note that the prognostic prediction ability of this profile was confirmed in different sets of cancer patients, including an independent series of public gene expression microarray data of colon cancer patients from Gene Expression Omnibus Database, reinforcing the relevance of ColoLipidGene as a reliable prognostic tool in stage II colon cancer patients. These results together with the reduced number of genes constituting the signature, the advantage of ColoLipidGene vs the other identified signatures lies on the fact that the four genes constituting ColoLipidGene are involved in a specific biological process (lipid metabolism), establishing an hypothesis that support the role of this signature in the aggressiveness of the tumors. Finally, ColoLipidGene is constituted by key metabolic “druggable” enzymes, pointing at them as main promising therapeutic targets for these patients.
MATERIALS AND METHODS
Study design and patients
80 stage II CRC patients undergoing surgery between 2000 and 2004 in La Paz University Hospital were enrolled in the training group for this retrospective study. Three of them were discarded because of the quality material obtained. Inclusion criteria: Age ≥ 18, completely resected rectal cancer or colon adenocarcinoma located at ≥ 15 cm of the anal verge as determined by endoscopy or above the peritoneal reflection in the surgical resection, confirmed Stage II AJCC/UICC primary CRC and follow-up of at least 36 months. Exclusion criteria: death within 30 days after surgery, other cancers in previous 5 years and inflammatory bowel disease or specific gene-related cancer.
We validated the results in two different sets of patients. The validation group I was composed of 119 stage II CRC patients recruited in different time period (between 2004 and 2008) from La Paz University Hospital (Madrid). Results were externally validated in an additional set of 120 patients with stage II CRC (validation group II) from Clinic University Hospital (Barcelona), La Fe University Hospital (Valencia) and the Oncologic Institute of Valencia (IVO). For all groups of patients, Formalin-Fixed, Paraffin-Embedded (FFPE) samples were obtained with the approval of the human research Ethics review Committee of the hospitals involved (HULP-PI-1452). Clinico-histopathological data of patients were prospectively collected on clinical history and were confirmed by oncologists of the hospitals implicated in this study. All FFPE samples were revised by an anatomic pathologist ensuring > 85% of tumoral cells in each sample. Patients in all groups were classified following the clinical risk criteria of American Society of Clinical Oncology (ASCO). Since all patients included were within the same clinicopathological stage II, this clinical classifier was considered as the standard for determining patient prognosis. No other reference standard is applicable in this study since on similar molecular biomarker is currently applied for CRC patients with these characteristics. The reference clinical classifier consider patients with high risk of relapse if any of the following events: numbers of lymph nodes examined ≤ 12; T4; poor histological grade; emergency presentation with obstruction or perforation; perineural or lymphovascular invasion [31].
Additionally, we tested the prognostic power of ColoLipidGene in public whole human genome Microarray data of colon cancer patients from Gene Expression Omnibus Database. Raw gene expression data corresponding to the GSE39582 series was downloaded from the source as original CEL files. The 566 Affymetrix U133Plus2 arrays included in the dataset were processed together locally by using the aroma.affymetrix R package [32]. Robust Multichip Average (RMA) method was applied for background correction and normalization. Thus, we selected the stage II colon cancer patients (n = 264) and evaluated the prediction ability of ColoLipidGene in these public gene expression series of colon cancer patients.
Gene expression assays
Samples were deparaffinated and total RNA was extracted using RNeasy FFPE Kit (Qiagen Gmbh, Germany). 1 μg of total RNA was reverse transcribed by High Capacity cDNA Archive Kit (Applied Biosystems) for 2 h at 37°C. A Taq-Man Low Density Array (Applied Biosystems) was specifically designed for this experiment and was composed of 70 lipid metabolism-related genes (Table 1). These 70 genes within all genes present in pathways related with lipid metabolism were selected due to their key role as master regulators of cell metabolism, key steps of interconnection among lipid pathways or their reported role in biological processes associated with cancer. Gene-expression assays were performed in a HT–7900 Fast Real time PCR. The geometric mean of the internal control genes (GAPDH and B2M) was used as endogenous control. RT-StatMiner software (Integromics® Inc., Madison, USA) was used to detect and determine the quality control and differential expression analyses of data.
Statistical analysis
The primary endpoint of the study was the relationship between gene expression and disease-free survival (DFS). Quantification of gene expression was calculated with the 2−ΔCt method. Time to relapse was obtained for the analysis of 3-year DFS, defined from the time of surgical procedure. The Kaplan-Meier method was used to estimate DFS. Log-rank test for Univariate Cox regression analysis was performed to test association between DFS and individual gene expression. To assess the effect on survival with adjustment for potential confounding factors, proportional hazards Cox regression modeling was used. Multivariate analysis included only variables that were significant (p < 0.05) in the Univariate analysis and age > 70 as main nonmodifiable risk factor. Hazard ratios (HR) and 95% CI were calculated from the Cox regression model. The threshold for dichotomization of the expression data of each gene into a low and a high value was selected based on the cutoff point with largest prediction ability, evaluated by the c-index using 100 times 5-fold cross-validation (CV). Data were blind and independently analyzed by two different groups of experts in the field (Biostatistics and Bioinformatics Unit, IMDEA Food Institute and Bioinformatics and Functional Genomics Research Group, Cancer Research Center (CSIC-USAL).
The prognostic gene expression signature was developed analyzing the prediction ability for all possible Cox regression models with genes found within the range of significance in the univariate analysis, and selecting the multivariate model with largest c-index (> 0.75) implemented using 100 times 5-fold CV [33]. The threshold value was chosen such that the frequency of the high risk group was as the “observed recurrence risk”. Determined threshold value in the training set of patients was further applied to validation sets of patients. All reported p values were two-sided. Statistical significance was defined as p < 0.05. The statistical analyses were done by use of the R statistical software v2.15 (http://www.r-project.org).
ACKNOWLEDGMENTS
This work was supported by Ministerio de Economía y Competitividad del Gobierno de España (Plan Nacional I+D+i AGL2013–48943-C2–2-R and IPT-2011–1248-060000), Comunidad de Madrid (P2013/ABI-2728. ALIBIRD-CM) and European Union Structural Funds. CIBEREHD is funded by the Instituto de Salud Carlos III. This is a collaborative study between the Molecular Oncology Unit of The Institute of Advanced Studies of Madrid IMDEA-Food and the Grupo Español Multidisciplinar en Cáncer Digestivo (GEMCAD). JdlR's work was supported by ISCiii (project PI12/00624).
DISCLOSE ANY POTENTIAL CONFLICTS OF INTEREST
The authors declared no potential conflicts of interest.
Sources of support
This work was supported by Ministerio de Ciencia e Innovación del Gobierno de España (Plan Nacional I + D + i AGL2013–48943-C2–2-R and IPT-2011–1248-060000), Comunidad de Madrid (P2013/ABI-2728. ALIBIRD-CM) and European Union Structural Funds. CIBEREHD is funded by the Instituto de Salud Carlos III. This is a collaborative study between the Molecular Oncology Unit of The Institute of Advanced Studies of Madrid IMDEA-Food and the Grupo Español Multidisciplinar en Cáncer Digestivo (GEMCAD).
REFERENCES
1. Al-Sohaily S, Biankin A, Leong R, Kohonen-Corish M, Warusavitarne J. Molecular pathways in colorectal cancer. J Gastroenterol Hepatol. 2012; 27:1423–1431.
2. Zavoral M, Suchanek S, Zavada F, Dusek L, Muzik J, Seifert B, Fric P. Colorectal cancer screening in Europe. World J Gastroenterol. 2009; 15:5907–5915.
3. O'Connell JB, Maggard MA, Ko CY. Colon cancer survival rates with the new American Joint Committee on Cancer sixth edition staging. J Natl Cancer Inst. 2004; 96:1420–1425.
4. Agesen TH, Sveen A, Merok MA, Lind GE, Nesbakken A, Skotheim RI, Lothe RA. ColoGuideEx: a robust gene classifier specific for stage II colorectal cancer prognosis. Gut. 2012; 61:1560–1567.
5. Eschrich S, Yang I, Bloom G, Kwong KY, Boulware D, Cantor A, Coppola D, Kruhoffer M, Aaltonen L, Orntoft TF, Quackenbush J, Yeatman TJ. Molecular staging for survival prediction of colorectal cancer patients. Journal of clinical oncology : official journal of the American Society of Clinical Oncology. 2005; 23:3526–3535.
6. Salazar R, Roepman P, Capella G, Moreno V, Simon I, Dreezen C, Lopez-Doriga A, Santos C, Marijnen C, Westerga J, Bruin S, Kerr D, Kuppen P, van de Velde C, Morreau H, Van Velthuysen L, et al. Gene expression signature to improve prognosis prediction of stage II and III colorectal cancer. Journal of clinical oncology : official journal of the American Society of Clinical Oncology. 2011; 29:17–24.
7. Sveen A, Agesen TH, Nesbakken A, Meling GI, Rognum TO, Liestol K, Skotheim RI, Lothe RA. ColoGuidePro: a prognostic 7-gene expression signature for stage III colorectal cancer patients. Clin Cancer Res. 2012; 18:6001–6010.
8. Hanahan D, Weinberg RA. Hallmarks of cancer: the next generation. Cell. 2011; 144:646–674.
9. Fan TW, Lane AN, Higashi RM, Farag MA, Gao H, Bousamra M, Miller DM. Altered regulation of metabolic pathways in human lung cancer discerned by (13)C stable isotope-resolved metabolomics (SIRM). Mol Cancer. 2009; 8:41.
10. Santos CR, Schulze A. Lipid metabolism in cancer. FEBS J. 2012; 279:2610–2623.
11. Mashima T, Sato S, Okabe S, Miyata S, Matsuura M, Sugimoto Y, Tsuruo T, Seimiya H. Acyl-CoA synthetase as a cancer survival factor: its inhibition enhances the efficacy of etoposide. Cancer Sci. 2009; 100:1556–1562.
12. Ramirez de Molina A, Sarmentero-Estrada J, Belda-Iniesta C, Taron M, Ramirez de Molina V, Cejas P, Skrzypski M, Gallego-Ortega D, de Castro J, Casado E, Garcia-Cabezas MA, Sanchez JJ, Nistal M, Rosell R, Gonzalez-Baron M, Lacal JC. Expression of choline kinase alpha to predict outcome in patients with early-stage non-small-cell lung cancer: a retrospective study. Lancet Oncol. 2007; 8:889–897.
13. Roongta UV, Pabalan JG, Wang X, Ryseck RP, Fargnoli J, Henley BJ, Yang WP, Zhu J, Madireddi MT, Lawrence RM, Wong TW, Rupnow BA. Cancer cell dependence on unsaturated fatty acids implicates stearoyl-CoA desaturase as a target for cancer therapy. Mol Cancer Res. 2011; 9:1551–1561.
14. Monaco ME, Creighton CJ, Lee P, Zou X, Topham MK, Stafforini DM. Expression of Long-chain Fatty Acyl-CoA Synthetase 4 in Breast and Prostate Cancers Is Associated with Sex Steroid Hormone Receptor Negativity. Transl Oncol. 2010; 3:91–98.
15. Wang Y, Jatkoe T, Zhang Y, Mutch MG, Talantov D, Jiang J, McLeod HL, Atkins D. Gene expression profiles and molecular markers to predict recurrence of Dukes' B colon cancer. Journal of clinical oncology: official journal of the American Society of Clinical Oncology. 2004; 22:1564–1571.
16. Barrier A, Boelle PY, Roser F, Gregg J, Tse C, Brault D, Lacaine F, Houry S, Huguier M, Franc B, Flahault A, Lemoine A, Dudoit S. Stage II colon cancer prognosis prediction by tumor gene expression profiling. Journal of clinical oncology : official journal of the American Society of Clinical Oncology. 2006; 24:4685–4691.
17. Gray RG, Quirke P, Handley K, Lopatin M, Magill L, Baehner FL, Beaumont C, Clark-Langone KM, Yoshizawa CN, Lee M, Watson D, Shak S, Kerr DJ. Validation study of a quantitative multigene reverse transcriptase-polymerase chain reaction assay for assessment of recurrence risk in patients with stage II colon cancer. Journal of clinical oncology : official journal of the American Society of Clinical Oncology. 2011; 29:4611–4619.
18. Quasar Collaborative G, Gray R, Barnwell J, McConkey C, Hills RK, Williams NS, Kerr DJ. Adjuvant chemotherapy versus observation in patients with colorectal cancer: a randomised study. Lancet. 2007; 370:2020–2029.
19. Sadanandam A, Wang X, de Sousa EMF, Gray JW, Vermeulen L, Hanahan D, Medema JP. Reconciliation of classification systems defining molecular subtypes of colorectal cancer: interrelationships and clinical implications. Cell cycle. 2014; 13:353–357.
20. Mohelnikova-Duchonova B BV, Oliverius M, Honsova E, Kala Z, Muckova K, Soucek P. Differences in transcript levels of ABC transporters between pancreatic adenocarcinoma and nonneoplastic tissues. Pancreas. 2013; 42:707–716.
21. Bachmeier BE IC, Killian PH, Kronski E, Mirisola V, Angelini G, Jochum M, Nerlich AG, Pfeffer U. Overexpression of the ATP binding cassette gene ABCA1 determines resistance to Curcumin in M14 melanoma cells. Mol Cancer. 2009; 23:129.
22. Vargas T, Moreno-Rubio J, Herranz J, Cejas P, Molina S, Gonzalez-Vallinas M, Ramos R, Burgos E, Aguayo C, Custodio AB, Reglero G, Feliu J, Ramirez de Molina A. Genes associated with metabolic syndrome predict disease-free survival in stage II colorectal cancer patients. A novel link between metabolic dysregulation and colorectal cancer. Molecular oncology. 2014; 8:1469–1481.
23. Cao Y, Dave KB, Doan TP, Prescott SM. Fatty acid CoA ligase 4 is up-regulated in colon adenocarcinoma. Cancer Res. 2001; 61:8429–8434.
24. Hu C, Chen L, Jiang Y, Li Y, Wang S. The effect of fatty acid-CoA ligase 4 on the growth of hepatic cancer cells. Cancer Biol Ther. 2008; 7:131–134.
25. Liang YC, Wu CH, Chu JS, Wang CK, Hung LF, Wang YJ, Ho YS, Chang JG, Lin SY. Involvement of fatty acid-CoA ligase 4 in hepatocellular carcinoma growth: roles of cyclic AMP and p38 mitogen-activated protein kinase. World J Gastroenterol. 2005; 11:2557–2563.
26. Mashek DG, Li LO, Coleman RA. Rat long-chain acyl-CoA synthetase mRNA, protein, and activity vary in tissue distribution and in response to diet. J Lipid Res. 2006; 47:2004–2010.
27. Sung YK, Hwang SY, Park MK, Bae HI, Kim WH, Kim JC, Kim M. Fatty acid-CoA ligase 4 is overexpressed in human hepatocellular carcinoma. Cancer Sci. 2003; 94:421–424.
28. Kim JH, Lewin TM, Coleman RA. Expression and characterization of recombinant rat Acyl-CoA synthetases 1, 4, and 5. Selective inhibition by triacsin C and thiazolidinediones. J Biol Chem. 2001; 276:24667–24673.
29. DW L. The structure and functions of human lysophosphatidic acid acyltransferases. Front Biosci. 2001; 1:D944–953.
30. Igal RA. Stearoyl-CoA desaturase-1: a novel key player in the mechanisms of cell proliferation, programmed cell death and transformation to cancer. Carcinogenesis. 2010; 31:1509–1515.
31. Benson AB 3rd, Schrag D, Somerfield MR, Cohen AM, Figueredo AT, Flynn PJ, Krzyzanowska MK, Maroun J, McAllister P, Van Cutsem E, Brouwers M, Charette M, Haller DG. American Society of Clinical Oncology recommendations on adjuvant chemotherapy for stage II colon cancer. Journal of clinical oncology : official journal of the American Society of Clinical Oncology. 2004; 22:3408–3419.
33. Harrell FE Jr., Lee KL, Mark DB. Multivariable prognostic models: issues in developing models, evaluating assumptions and adequacy, and measuring and reducing errors. Statistics in medicine. 1996; 15:361–387.