
Introduction
Leiomyosarcomas (LMS) are aggressive heterogeneous mesenchymal neoplasms that account for 10–20% of soft tissue sarcomas [1]. LMS arise from the smooth muscle cells of different structures and organs including the uterus, retroperitoneum, abdomen, large and medium blood vessels, trunk, and extremities [1]. Newly diagnosed patients are at high risk of distant recurrence and poor disease-specific survival [2]. The 5-year survival rate is 42% for all stages and only 14% with distant spread, based on data from the Surveillance, Epidemiology, and End Results Program (SEER) datasets. Recurrence and/or metastasis occurs in ~40% of the cases [3], limiting the treatment options to standard chemotherapy [1]; however, response to first-line systemic chemotherapy is low, ranging from 5% to 33% [4–8]. Current treatments for metastatic disease (doxorubicin, trabectidin, dacarbazine, pazopanib) are either traditional chemotherapies or a targeted tyrosine kinase inhibitor [9]. The approval of tazemetostat for patients with metastatic epithelioid sarcomas has been the first time an epigenetic modifier was shown to have a role in the treatment of soft tissue sarcomas [10]. There is little data regarding factors that influence survival in LMS patients underscoring the need for studies to understand the genetic and epigenetic factors involved in LMS which influence treatment response.
Based on the site of origin, LMS subtypes have been described including uterine LMS (ULMS) and non-uterine soft tissue LMS (STLMS) [1]. Only a limited number of studies have compared the outcomes based on LMS subtypes despite obvious clinical differences. Based on the limited literature, patients with ULMS often present with larger tumors, metastatic disease, and worse overall survival [7]. Despite this, other studies have shown that the site of origin of LMS has no impact on outcomes [11, 12]. Histologically ULMS and STLMS appear similar and share distinct features of the smooth muscle lineage with no available diagnostic or prognostic biomarkers to inform clinical management [1]. Furthermore, as both subtypes are treated similarly, studies are needed to understand if molecular profiling and subtype-specific therapeutic targeting can improve survival.
Prior studies have made limited attempts to subtype LMS using exome-based, gene expression microarray-based, or RNA-seq-based profiling approaches [13–19]. However, only few studies have focused on characterizing the epigenetic profiles of LMS and investigating the role of epigenetic changes in LMS subtype progression [18, 20, 21]. In oncogenesis, gene expression can be regulated epigenetically through changes in DNA methylation, histone modifications, and chromatin structure [22]. Methylation changes include hypomethylation of intergenic regions and hypermethylation of CpG islands along with upstream methylation of shores and shelves resulting in transcriptional changes [23, 24]. Promoter hypermethylation of p16 tumor suppressor protein and death-associated protein kinase (DAP kinase) has been associated with decreased protein expression in STLMS [25, 26]. Epigenetic regulators (HIST3H3, SETD7, KMT2C) are implicated in driving LMS tumor mutational heterogeneity [13]. Furthermore, epigenetic therapies may be promising candidates for managing sarcomas and other tumor types [27–29]. A previous study in our laboratory demonstrated the potential therapeutic application of hypomethylating agents such as DNA methyltransferase inhibitors (DNMTi) in in vitro and in vivo models of LMS [28]. These findings suggest the need for detailed epigenetic profiling of LMS tumors, exploring the roles of epigenetic alterations in oncogenesis and investigating the utility of epigenetics-based therapeutic targeting.
In this study, we performed an integrated analysis of 98 clinically derived LMS samples and 11 controls using three publicly available datasets to identify epigenetic changes which characterize LMS subtypes and may be used as clinical biomarkers and therapeutic targets. The Cancer Genome Atlas-Sarcoma (TCGA-SARC) dataset (n = 80, 27 ULMS and 53 STLMS) [18] was used to comprehensively understand the epigenetic and transcriptomic differences between ULMS and STLMS to identify genes that are differentially methylated and differentially expressed in different LMS subtypes. These findings were compared to two independent DNA methylation datasets, GSE140686 (n = 24 samples, 8 controls and 16 STLMS) [20] and GSE68312 (n = 5 samples, 3 controls and 2 ULMS) [30] to identify the epigenetic changes that are associated with tumorigenesis compared to controls.
Our findings reveal that LMS tumors are associated with distinct epigenetic alterations and gene expression changes. Unsupervised hierarchical clustering analysis demonstrated that LMS tumor samples are associated with two main clusters: ULMS-enriched cluster and STLMS-enriched cluster, suggesting that distinct DNA methylation changes and gene expression changes underlie the biology of each cluster. Furthermore, genes with an inverse correlation between promoter CpG island hypermethylation and gene expression were identified suggesting the epigenetic regulation of the gene expression.
Results
ULMS and STLMS are epigenetically distinct tumor subtypes
Data from LMS primary tumor samples from the TCGA-SARC cohort was used for comparative DNA methylation analysis (Figure 1). After pre-filtering and statistical filtering, 8,502 differentially methylated CpG regions (DMRs) were found to be statistically significant (q-value < 0.05, ΔβULMS-STLMS > |0.2|) between ULMS and STLMS and used for further analysis (Figure 2). Principal Component Analysis (PCA) of the DNA methylation data revealed separation between ULMS and STLMS. The majority of the STLMS and ULMS samples segregated apart and formed spatially distinct clusters (Figure 2A). Heatmap representation of an unsupervised hierarchical clustering analysis (HCA) based on the DMRs demonstrated that the majority of the LMS samples segregate into two main clusters based on the subtype status: ULMS-enriched cluster and STLMS-enriched cluster (Figure 2B).
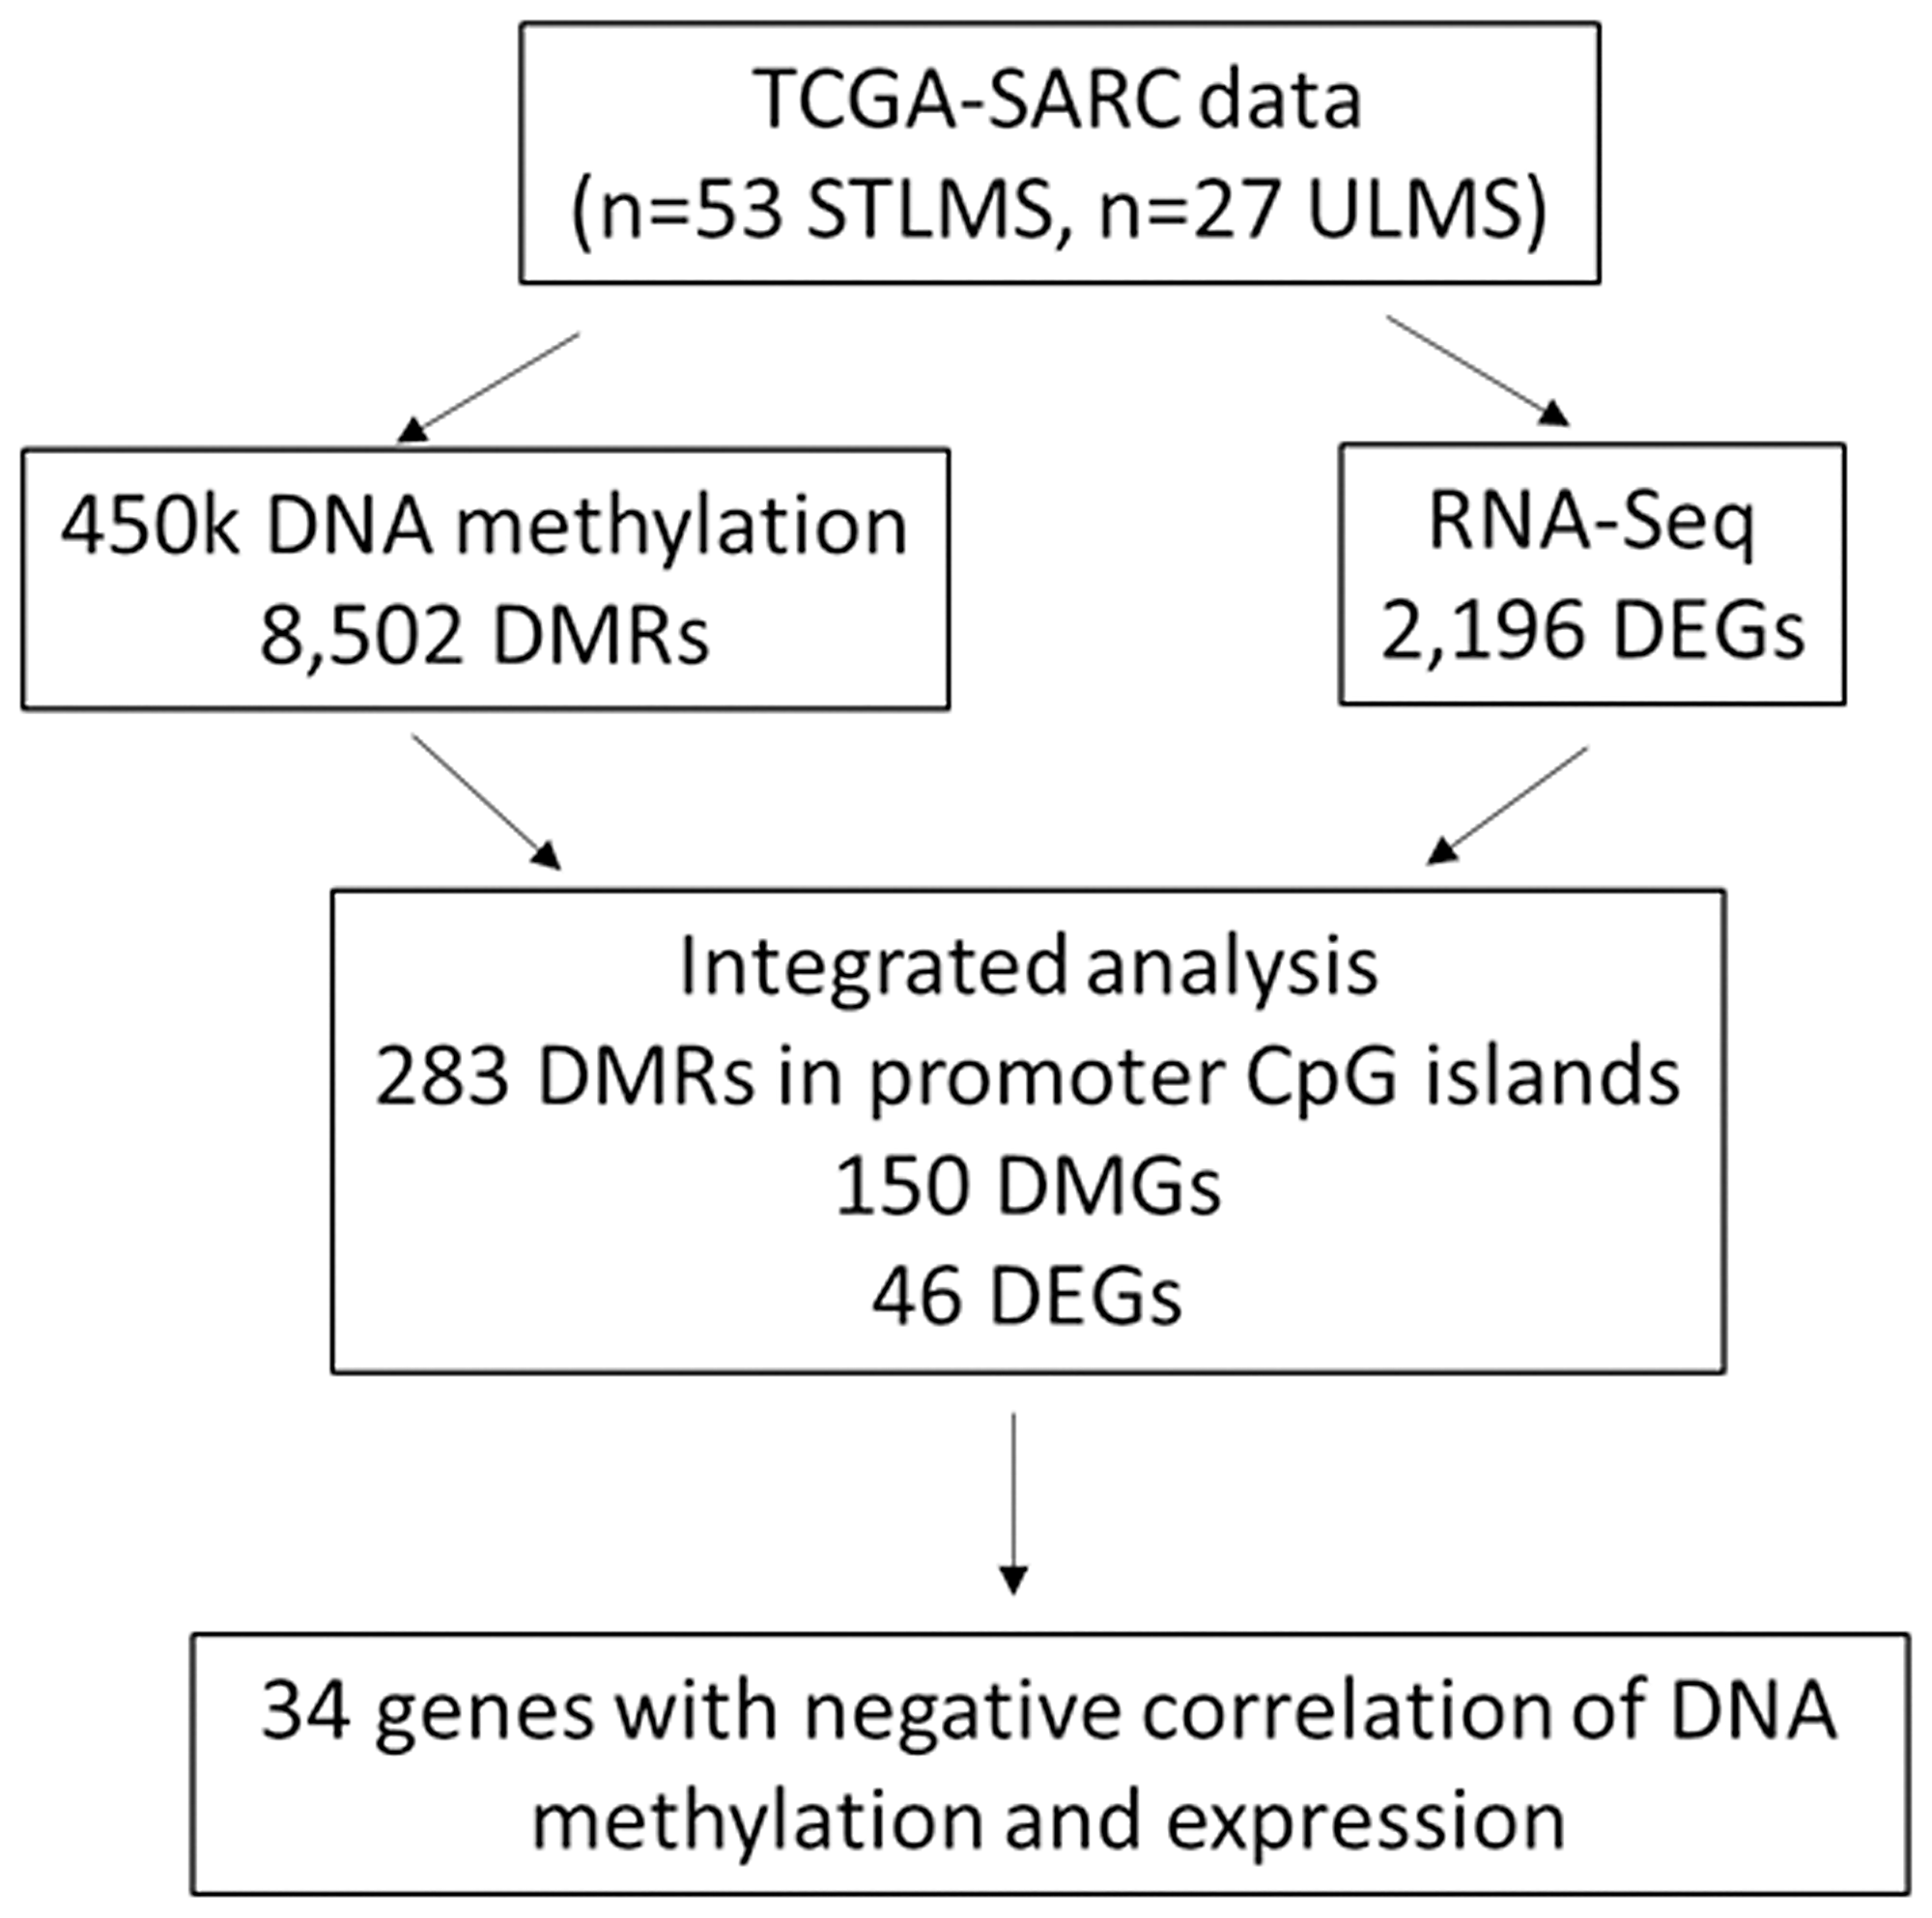
Figure 1: Overview of the analysis. Leiomyosarcoma (LMS) samples from the TCGA-SARC dataset were compared to identify the differentially methylated regions (DMRs), differentially methylated genes (DMGs) and differentially expressed genes (DEGs) in ULMS and STLMS.
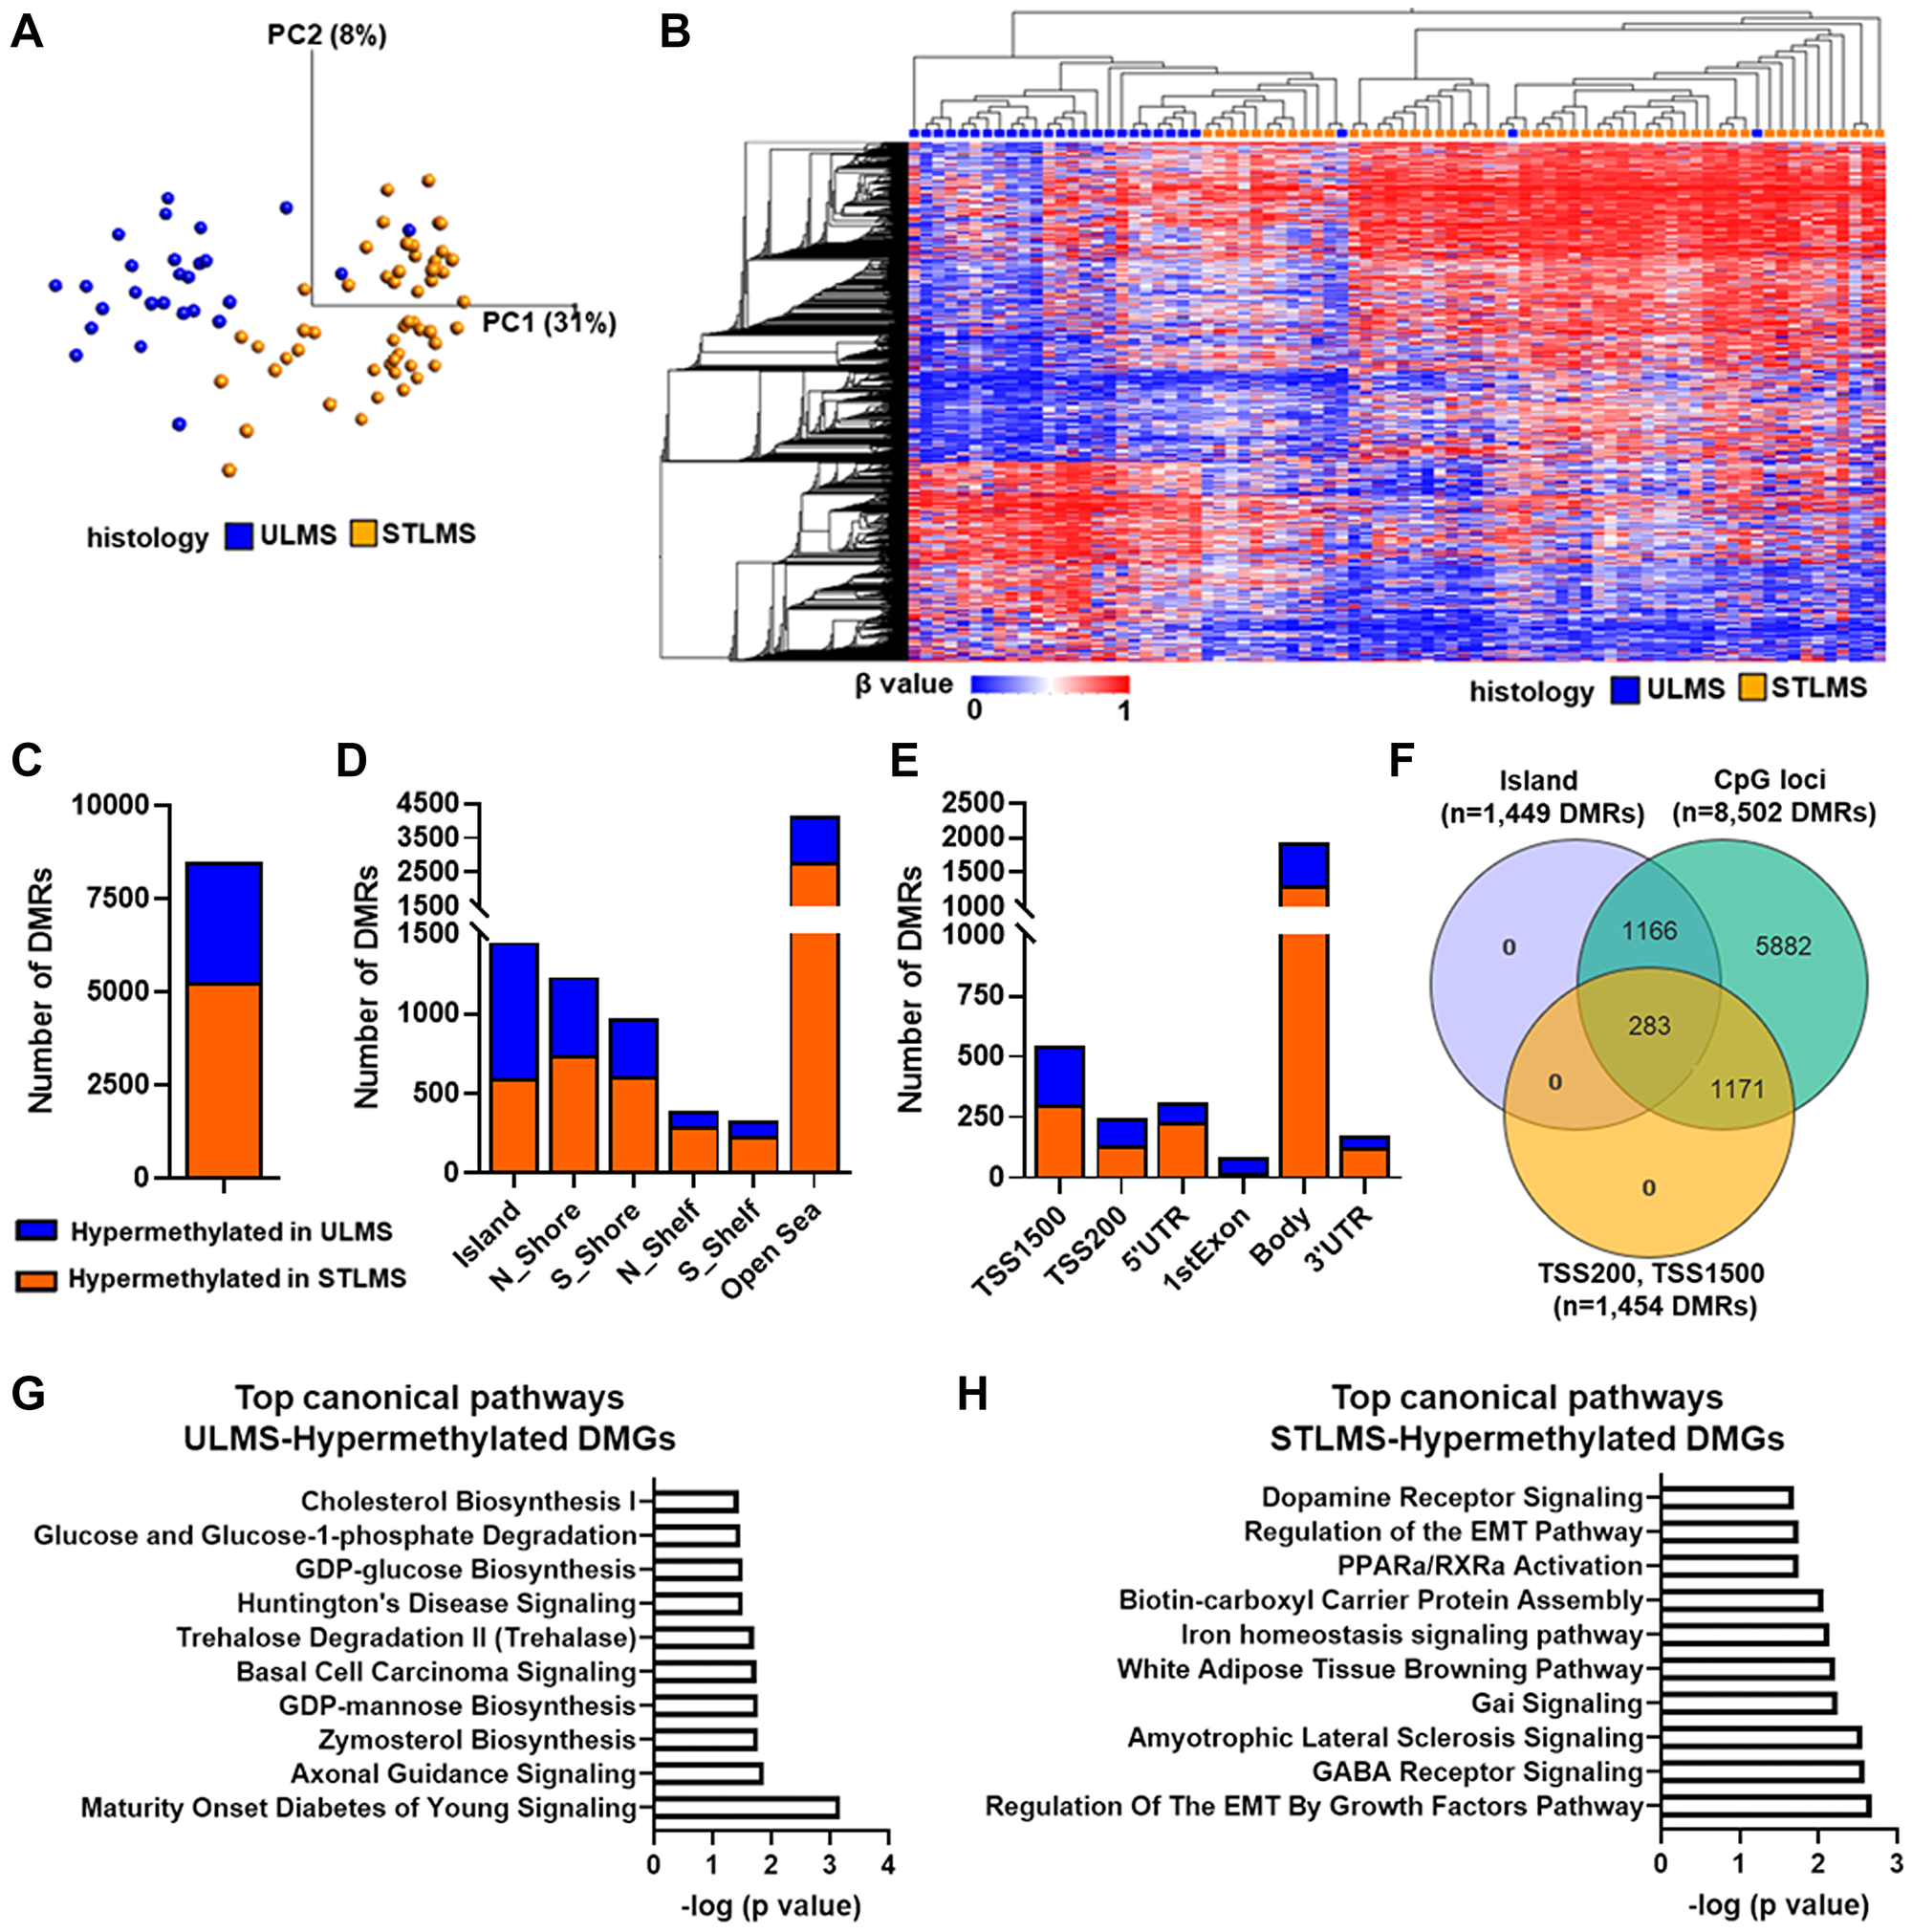
Figure 2: DNA methylation landscape of LMS. (A) Principal Component Analysis of STLMS (orange) and ULMS (blue) samples based on DMRs (n = 8,502). x- and y-axis show the principal components (PCs). Numbers in brackets indicate the percentage variance for each PC. (B) Unsupervised hierarchical clustering analysis of DMRs in ULMS and STLMS. Samples are presented in columns and the DMRs (n = 8,502) are presented in rows. Variables were sorted by hierarchical clustering on both the x-axis and the y-axis. The heatmap scale for methylation is based on β values (ranging from 0 (unmethylated) to 1 (methylated)). (A, B) Analysis was performed using the following filters in Qlucore: 5% variance, q-value < 0.05 (t-test) and β difference (Δβ (βULMS − βSTLMS) > |0.2|). (C) Distribution of DMRs based on methylation status. (D) Distribution of DMRs in different genomic regions relative to CpG islands including CpG islands, CpG shores and CpG shelves. (E) Distribution of DMRs relative to gene region features (TSS1500, TSS200, 5’UTR, 1st exon, gene body, and 3’UTR). Probes binding to multiple different gene regions and intergenic probes are not included in this graph. Please see Supplementary Table 2 for detailed distribution of the DMRs. (F) Venn diagram of the DMRs (n = 8,502), DMRs mapped to the island region (n = 1,449) and DMRs mapped to TSS200-TSS1500 regions (including probes binding to multiple regions that include TSS 200 and/or TSS 1500) (n = 1,454)). (G) Top 10 canonical pathways associated with ULMS-hypermethylated DMGs (n = 77). (H) Top 10 canonical pathways associated with STLMS-hypermethylated DMGs (n = 73). (G, H) Analysis was performed in Ingenuity Pathway Analysis using the following cutoffs: −log (p-value) >1.3. A detailed list of the canonical pathways is shown in Supplementary Table 4 and Supplementary Table 6.
Next, we classified these DMRs based on their methylation levels. Among the 8,502 DMRs that passed the statistical filtering, 5,239 (51.6%) were hypermethylated in STLMS, and 3,263 (38.4%) were hypermethylated in ULMS (Figure 2C). Heatmap representation of an unsupervised HCA based on the 3,263 DMRs hypermethylated in ULMS demonstrated the distinct separation of ULMS and STLMS samples (Supplementary Figure 1). The DMRs were further analyzed in reference to the CpG island loci. Of the 8,502 DMRs, 1,449 DMRs were located in the Island regions, 717 DMRs in the Shelf regions, and 2,197 DMRs in the Shore regions. Interestingly, ULMS was associated with a higher percentage of hypermethylated DMRs (26.2%) located in the Island regions compared to STLMS (11.3%) (Figure 2D, Supplementary Table 1). Next, we analyzed the distribution profile of the DMRs in reference to the gene regions (Figure 2E, Supplementary Table 2). A higher percentage of DMRs mapping to TSS1500, TSS200, 1st Exon regions were hypermethylated in ULMS, whereas a higher percentage of DMRs mapping to 5’UTR, 3’UTR and Body regions were hypermethylated in STLMS (Figure 2E, Supplementary Table 2). We next focused on the promoter-associated CpG island regions and identified 283 DMRs that were associated with 150 differentially methylated genes (DMGs) (Figure 2F, Supplementary Table 3), of which 77 were hypermethylated in ULMS and 73 were hypermethylated in STLMS.
Ingenuity pathway analysis was used to classify the canonical pathways associated with these DMGs. First, we performed pathway analysis using the 77 ULMS-Hypermethylated DMGs and identified 18 canonical pathways (Figure 2G, Supplementary Table 4), primarily associated with metabolic pathways and signaling, axonal guidance and basal cell carcinoma signaling. Interestingly, the top upstream regulators included chromatin modifying enzymes (KAT6A, KMT2A, EZH2) and chromatin/DNA binding proteins (CTNNB1, PBX3, SATB1, MEIS, COMMD1-BMI1) suggesting the possible involvement of chromatin modulation in regulating the DNA methylation of these DMGs (Supplementary Table 5). Pathway analysis of the 73 STLMS-Hypermethylated DMGs revealed 21 canonical pathways (Figure 2H, Supplementary Table 6) associated with EMT, metabolic pathways, and signaling. The top upstream regulators again included chromatin modifying enzymes (KMT2A, EZH2) and chromatin/DNA binding proteins (MLLT1, HOXA11, LBX1, PHF1, SIX1, GSC) (Supplementary Table 7).
Characterization of differential transcriptional signatures between ULMS and STLMS
Next, we determined the transcriptional differences between ULMS and STLMS by comparing the RNA-seq data of the LMS samples from the TCGA-SARC database. With filtering criteria of q-value < 0.05 and log2 fold change (FC) > |1.5|), 2,196 differentially expressed genes (DEGs) were identified (Figure 3A). Similar to the DNA-methylation based clustering, the majority of the STLMS and ULMS samples segregated apart and formed spatially distinct clusters on the PCA plot (Figure 3B). Unsupervised HCA again demonstrated two main clusters on the heatmap: ULMS-enriched cluster and STLMS-enriched cluster (Figure 3C). 1,353 DEGs had lower expression in ULMS, whereas 843 DEGs had lower expression in STLMS. Pathway analysis of the DEGs with lower expression in STLMS revealed 60 canonical pathways (p < 0.05), including metabolic pathways, estrogen signaling, neuronal signaling, and development (Figure 3D, Supplementary Table 8). On the other hand, pathway analysis of the DEGs with lower expression in ULMS revealed 199 canonical pathways (p < 0.05), the top pathways being associated with neuronal signaling and immune pathways (Figure 3E, Supplementary Table 9).
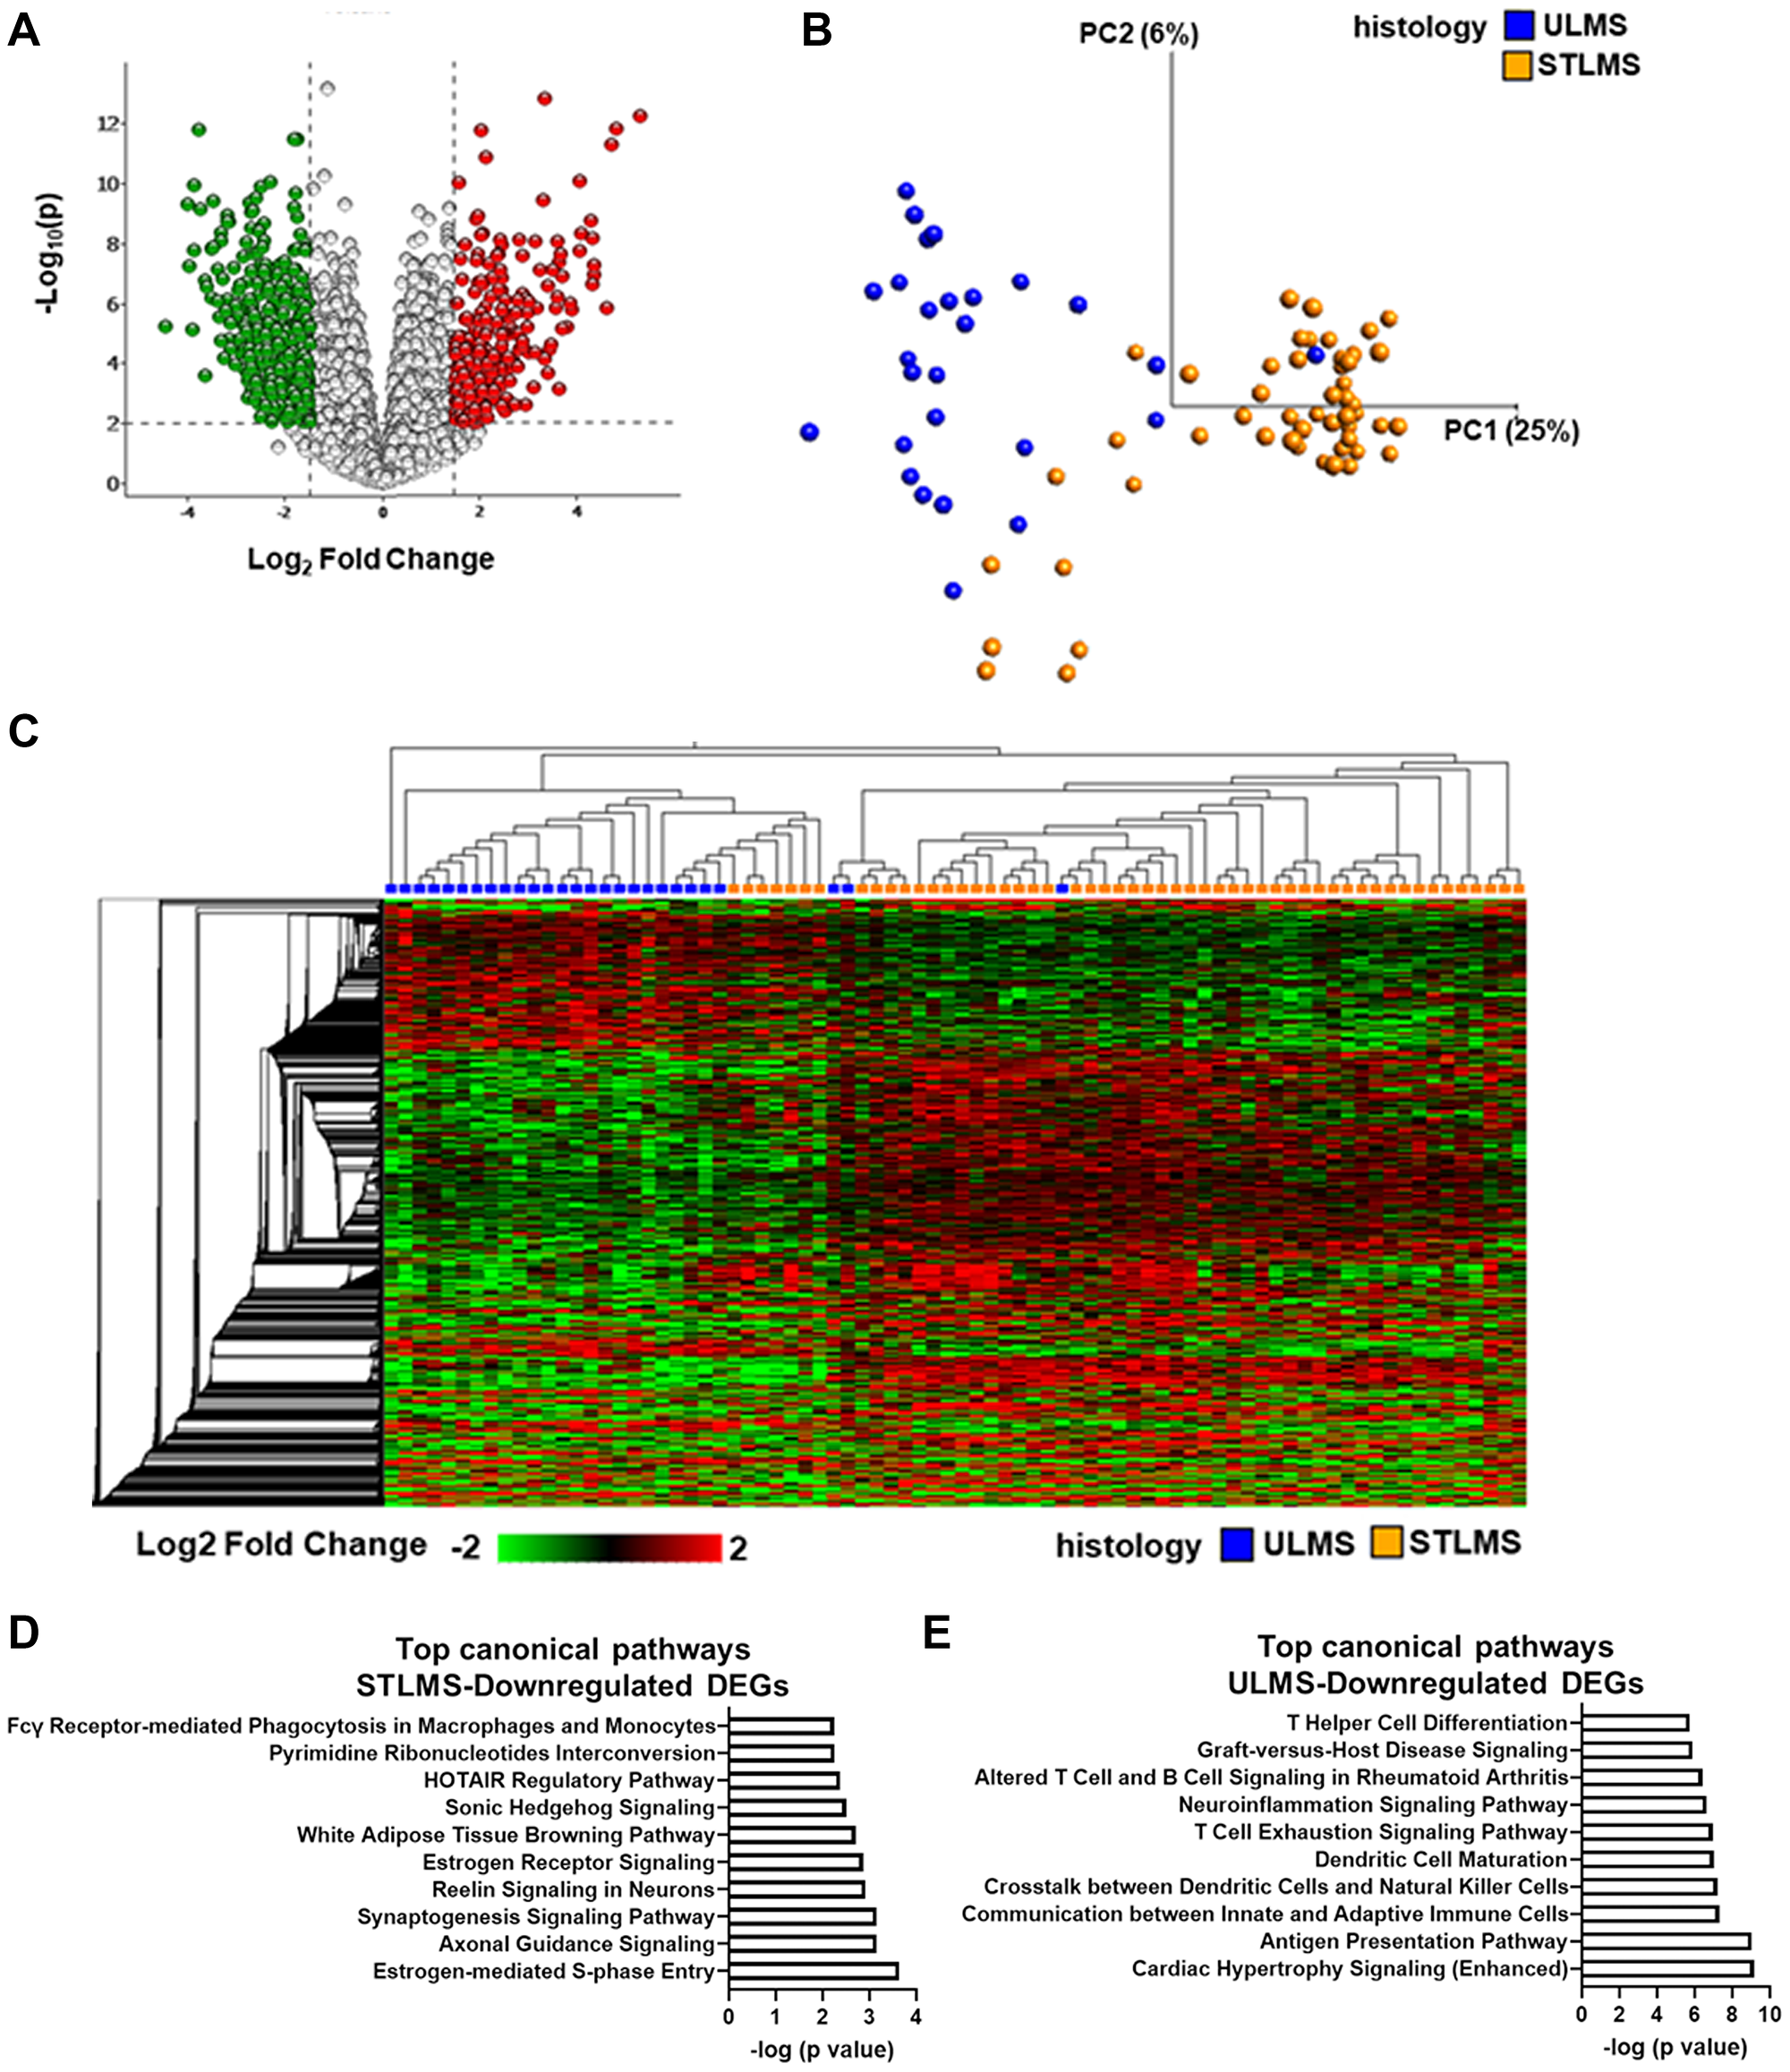
Figure 3: Profiling of differentially expressed genes in LMS. (A) Volcano plot of the global transcriptional changes in ULMS relative to STLMS. Each circle represents one gene. Statistical cut-off values are indicated by the grey lines: p ≤ 0.01 (corresponding to q-value < 0.05) and log2 fold change (FC) > |1.5|. The colored circles are the DEGs that pass the statistical filtering step (n = 2,196) (red-higher expression in ULMS (lower expression in STLMS), green-lower expression in ULMS (higher expression in STLMS)). y-axis indicates the minus log10 of p-value for gene, and x-axis shows the log2 FC between ULMS and STLMS. (B) Principal Component Analysis of STLMS (orange) and ULMS (blue) samples. x- and y-axis show the PCs. Numbers in brackets indicate the percentage variance for each PC. (C) Unsupervised heatmap representing color-coded expression levels of DEGs in ULMS relative to STLMS. Variables were sorted by hierarchical clustering on both the x-axis and the y-axis. The heatmap colors are based on gene expression, with red being upregulated and green being downregulated. Analysis in B–C was performed using the following filters in Qlucore: 5% variance, q-value < 0.05 (t-test), log2 FC > |1.5|. (D) Top 10 canonical pathways associated with STLMS-downregulated DEGs (n = 843). (E) Top 10 canonical pathways associated with ULMS-downregulated DEGs (n = 1,343). (G, H) Analysis was performed in Ingenuity Pathway Analysis using the following cutoffs: q-value < 0.05, log2 FC > |1.5|, −log (p-value) > 1.3. A detailed list of the canonical pathways is shown in Supplementary Table 8 and Supplementary Table 9.
Integrated analysis of differentially methylated and expressed genes
Analysis of the DNA methylation profiles of ULMS and STLMS revealed 283 promoter CpG island-associated DMRs corresponding to 150 DMGs (Figure 4A). Integrated analysis of the DEGs identified 46 genes to be both differentially methylated and differentially expressed (DM-DEGs) (Figure 4B), that were further grouped into two categories: ULMS-Hypermethylated-Downregulated (10 genes) and STLMS-Hypermethylated-Downregulated (24 genes) (Figure 4C). Overall, 34 genes out of the 46 DM-DEGs (73.9%) demonstrated the expected inverse correlation between promoter CpG island methylation and gene expression. The supervised analysis demonstrated that these DM-DEGs can distinguish between ULMS and STLMS (Figure 4D, Figure 4E). The remaining 12 out of the 46 genes had a positive correlation between DNA methylation and gene expression, suggesting that the regulation of gene expression is a complicated process and can involve other epigenetic mechanisms, such as chromatin structure, and non-epigenetic mechanisms.
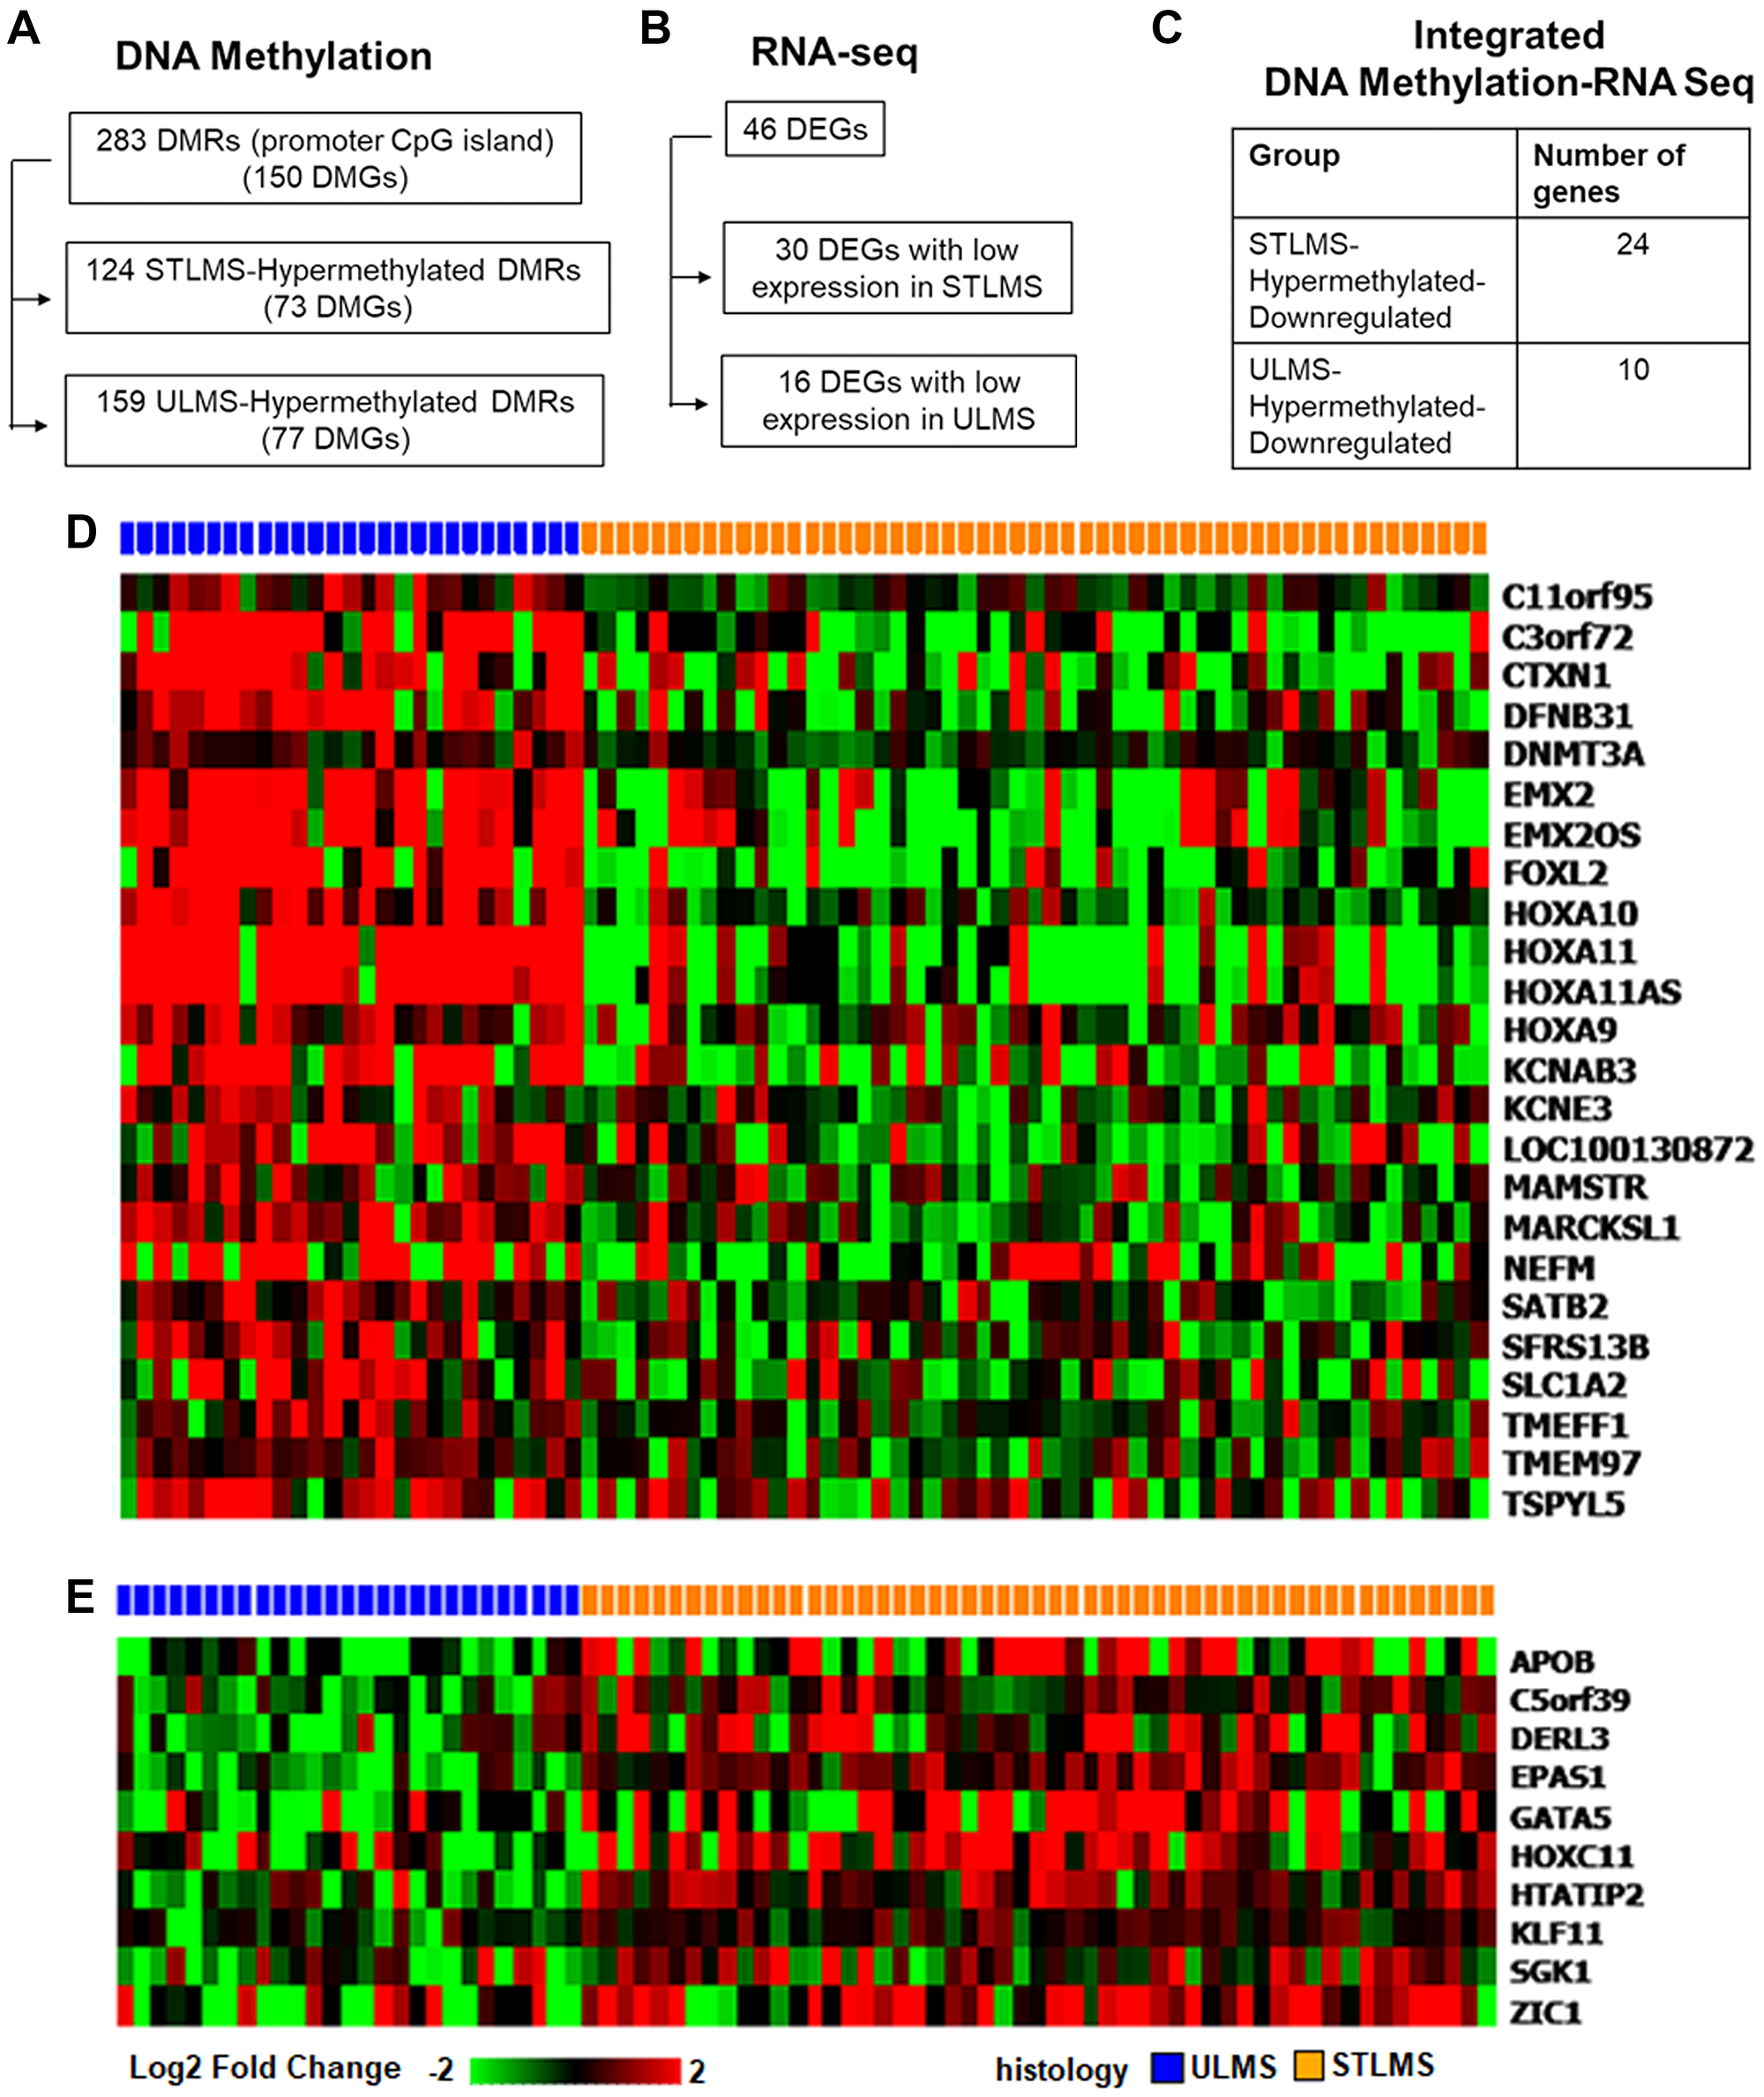
Figure 4: Integrated analysis of differentially methylated and expressed genes in ULMS and STLMS. (A) Summary of DMRs mapped to CpG island regions and TSS200/TSS1500 regions (q-value < 0.05, Δβ > |0.2|). (B) Summary of DEGs corresponding to DMGs in panel A (q < 0.05, log2 FC > |1.5|). (C) Genes grouped according to the methylation and expression changes in ULMS and STLMS. (D) Supervised clustering of hypermethylated and downregulated genes in STLMS. (E) Supervised clustering of hypermethylated and downregulated genes in ULMS.
Next, we assessed the correlation between DNA methylation and gene expression in the ULMS-Hypermethylated-Downregulated and STLMS-Hypermethylated-Downregulated groups by determining the Pearson correlation coefficient (r). Moderate correlation (|0.5| < r < |0.7|) was found for genes in both ULMS (DERL3, HOXC11, HTATIP2, and C5orf39) and STLMS (KCNAB3, KCNE3, TSPYL5, HOXA11, HOXA11AS, HOX9, LOC100130872) (Figure 5A, Figure 5B, Supplementary Table 10).
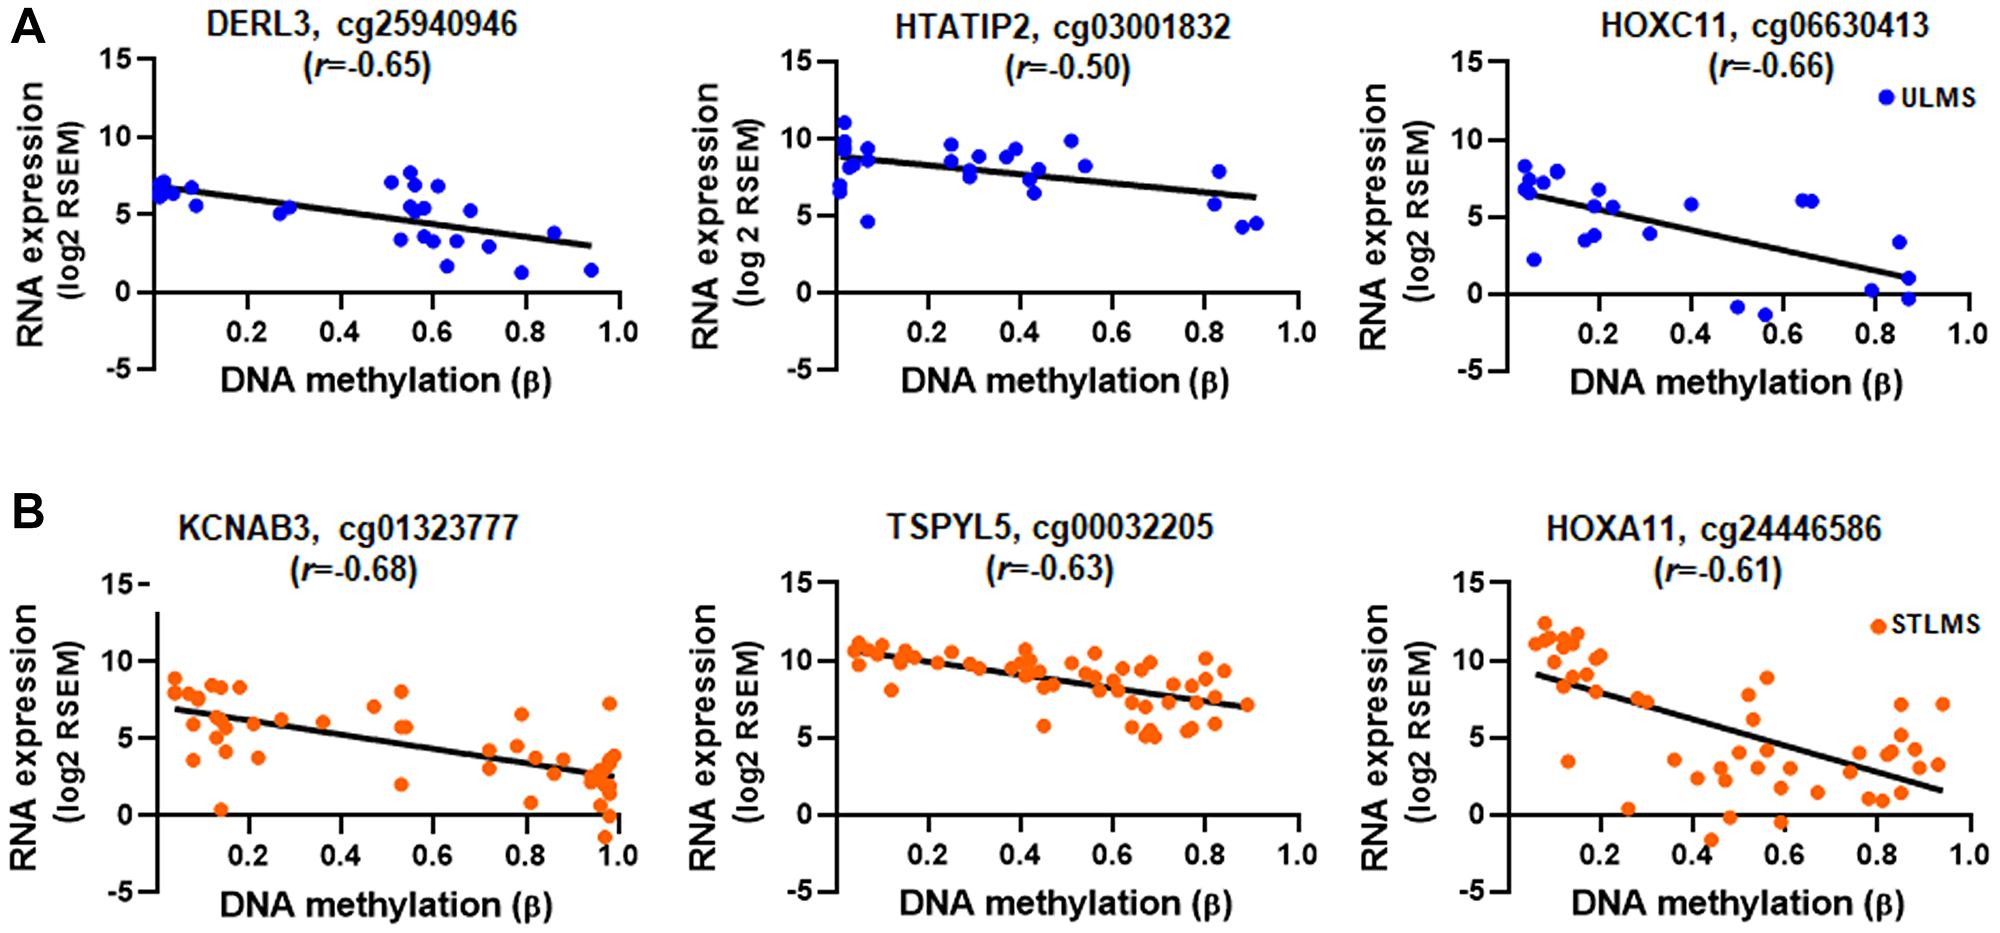
Figure 5: Correlation between gene expression and DNA methylation. RNA expression and DNA methylation values for the genes with moderate correlation ((|0.5| < r < |0.7|), p < 0.01) for ULMS-Hypermethylated-Downregulated (A) and STLMS-Hypermethylated-Downregulated group (B). Shown are the top 3 genes in each group. RNA expression values are plotted as log2 RSEM and DNA methylation are plotted as β values. Detailed analysis results are shown in Supplementary Table 10.
Interaction network analysis of the DM-DEGs revealed two networks associated with the STLMS-Hypermethylated-Downregulated group and one network associated with the ULMS-Hypermethylated-Downregulated group (Figure 6). Potential interacting proteins that emerged in the STLMS-Hypermethylated-Downregulated group again included proteins related to epigenetic regulation (EZH2, Histone H3, KMT2A-AFDN, BRD4, HDAC, HDAC4), neurofilament/neuronal signaling (NEFM, NGF, APP), growth factors (NGF, FGF2, PDGFA, GDNF), metastasis (ZEB2), and hormonal receptors (ESR1) (Figure 6A, Figure 6B). Potential interacting proteins in the ULMS-Hypermethylated-Downregulated group included genes related to transcriptional regulation (SMAD4), signaling (Akt, ERK1/2), and epigenetic regulation (Histone H3) (Figure 6C).
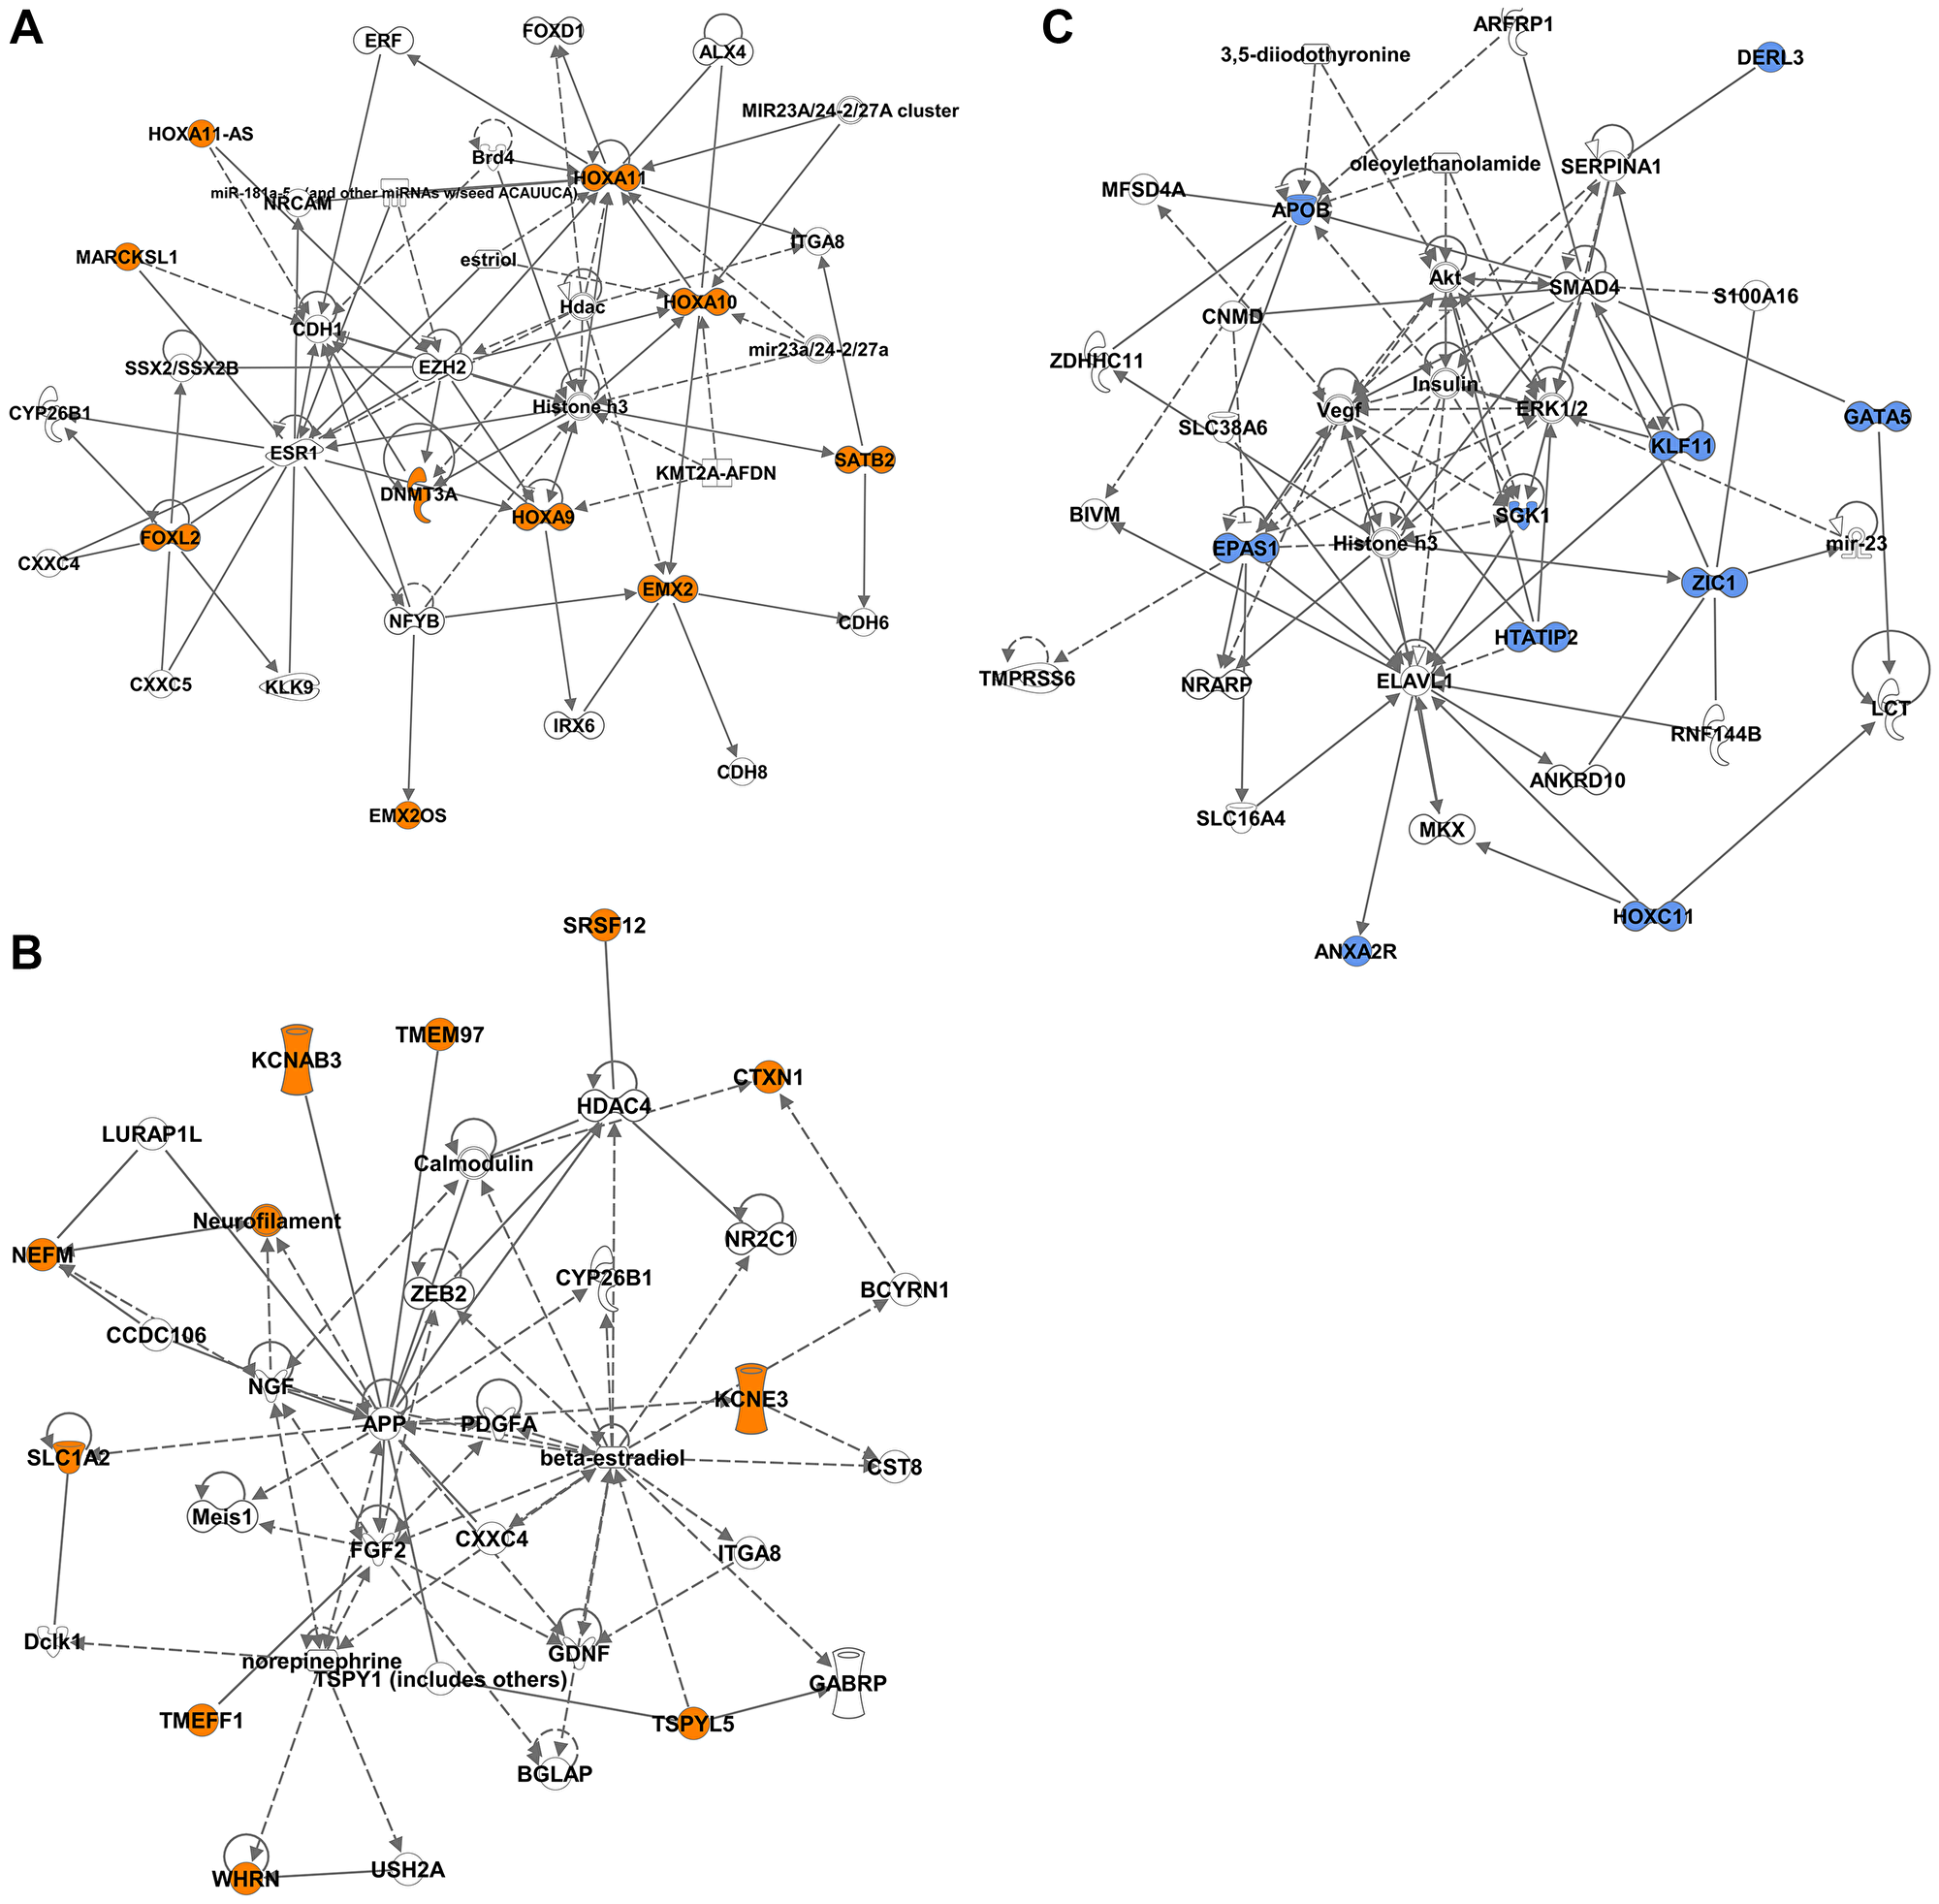
Figure 6: Network analysis of the DM-DEGs associated with STLMS-Hypermethylated-Downregulated and ULMS-Hypermethylated-Downregulated groups. Ingenuity network analysis was used to plot the gene relationships. The colored shapes indicate the downregulated genes in the STLMS-Hypermethylated-Downregulated group (orange color) (A, B) and the ULMS-Hypermethylated-Downregulated groups (blue color) (C). Genes that do not have corresponding colors, were not identified as differentially expressed in our analysis, and were integrated based on the Ingenuity Pathway Analysis evidence indicating a relevance to this network.
DISCUSSION
LMS is associated with a poor prognosis due to its aggressive nature, heterogeneous origin, and high risk for recurrence and metastasis. LMS may arise from uterine tissues or a wide array of soft tissues and has a variable prognosis. However, limited research has been done to understand if these are distinct tumors. A previous study by the TCGA across all soft tissue sarcoma subtypes showed that soft tissue sarcomas have a low somatic mutation burden and predominant copy number alterations [18]. Unsupervised analysis of the TCGA-SARC data using the iCluster approach clustered soft tissue sarcomas to five clusters. STLMS and ULMS clustered together as a spatially distinct cluster compared to other sarcomas, showing that ULMS and STLMS shared similar profiles. The analysis also showed that ULMS and STLMS shared different methylation and mRNA expression profiles.
Studies on the epigenetic regulation of LMS have been limited so far [18, 20, 21, 30, 31]. Most of the studies have focused on the characterization of epigenetic profiles of all sarcoma subtypes. Analysis of DNA methylation data from different sarcoma subtypes and other tumors revealed that LMS samples clustered separately and suggested that DNA methylation data could be used as a diagnostic tool [20, 21, 31]. A previous study by our group also revealed that LMS has exquisite sensitivity to epigenetic drugs such as hypomethylating agents [28]. Thus, epigenetic profiling of LMS can lead to the identification of novel drug targets and biomarkers as shown by multiple studies by our group and others in different cancer types [32, 33].
In this study, we performed a comprehensive analysis and compared the DNA methylation and RNA expression profiles of ULMS and STLMS samples from the TCGA-SARC study. Unsupervised hierarchical clustering of DMRs showed the presence of two main clusters: ULMS-enriched cluster and STLMS-enriched cluster. The ULMS-enriched cluster contained a subset of the STLMS samples (11 out of 53, 20.7%). This data is in agreement with the previous study showing the presence of two clusters of STLMS with different methylation profiles [18]. Further analysis identified 283 DMRs in the promoter-associated CpG island sites that differ between ULMS and STLMS. Upstream regulator analysis of the DMGs through Ingenuity Pathway Analysis revealed chromatin-modifying enzymes, DNA-binding and chromatin-binding proteins suggesting the possible involvement of chromatin modulation in the oncogenesis of LMS subtypes. Studies in other solid tumors also pointed to the role of chromatin dysregulation in cancer formation [34]. Majority of the canonical pathways associated with the DMGs pointed to metabolic pathways, neuronal pathways, and EMT signaling (Figure 2). Furthermore, methylation of promoter-associated CpG islands has been shown to downregulate expression and we identified 34 DM-DEGs with the expected negative correlation between promoter CpG island methylation and gene expression (Figure 4, Table 1). Of interest, majority of these genes are transcriptional regulators (13 out of 34, 38.2%), strongly suggestive of different tumor biology driving the subtypes of LMS, and likely different therapeutic targets. In addition, we also noticed that one of the genes is a DNA methyltransferase enzyme suggesting the potential epigenetic regulation of LMS subtypes. Network analysis of the DM-DEGs also pointed to their potential interaction with proteins involved in epigenetic regulation (Figure 6). Further studies will be needed to study the possible roles of these proteins as potential biomarkers or targets for epigenetic drugs.
Table 1: List of the genes associated with differential DNA methylation and gene expression in ULMS and STLMS
| Gene name | Gene expression (log2 FC relative to STLMS) | DNA methylation (Δβ (βULMS- βSTLMS) > 0.2) | Entrez Gene Name | Location | Type(s) |
| APOB | 0.23 | 0.34 | apolipoprotein B | Extracellular Space | transporter |
| DERL3 | 0.27 | 0.29 | derlin 3 | Cytoplasm | other |
| EPAS1 | 0.30 | 0.21 | endothelial PAS domain protein 1 | Nucleus | transcription regulator |
| HOXC11 | 0.23 | 0.22 | homeobox C11 | Nucleus | transcription regulator |
| HTATIP2 | 0.32 | 0.24 | HIV-1 Tat interactive protein 2 | Nucleus | transcription regulator |
| KLF11 | 0.61 | 0.31 | Kruppel like factor 11 | Nucleus | transcription regulator |
| SGK1 | 0.56 | 0.25 | serum/glucocorticoid regulated kinase 1 | Cytoplasm | kinase |
| ZIC1 | 0.11 | 0.26 | Zic family member 1 | Nucleus | transcription regulator |
| C5orf39 | 0.50 | 0.29 | Annexin A2 receptor (ANXA2R) | Plasma Membrane | other |
| GATA5 | 0.17 | 0.27 | GATA binding protein 5 | Nucleus | transcription regulator |
| Gene name | Gene expression (log2 FC relative to ULMS) | DNA methylation (Δβ (βSTLMS- βULMS) > 0.2) | Entrez Gene Name | Location | Type(s) |
| C11orf95 | 0.54 | 0.22 | chromosome 11 open reading frame 95 | Other | other |
| C3orf72 | 0.07 | 0.23 | FOXL2 neighbor (FOXL2NB) | Other | other |
| CTXN1 | 0.14 | 0.26 | cortexin 1 | Other | other |
| DFNB31 | 0.18 | 0.23 | whirlin | Plasma Membrane | other |
| DNMT3A | 0.61 | 0.21 | DNA methyltransferase 3 alpha | Nucleus | enzyme |
| EMX2* | 0.08 | 0.25 | empty spiracles homeobox 2 | Nucleus | transcription regulator |
| EMX2OS* | 0.08 | 0.25 | EMX2 opposite strand/antisense RNA | Other | other |
| HOXA10 | 0.24 | 0.30 | homeobox A10 | Nucleus | transcription regulator |
| HOXA11* | 0.03 | 0.30 | homeobox A11 | Nucleus | transcription regulator |
| HOXA11AS* | 0.04 | 0.30 | HOXA11 antisense RNA | Other | other |
| HOXA9 | 0.44 | 0.27 | homeobox A9 | Nucleus | transcription regulator |
| KCNAB3 | 0.13 | 0.32 | potassium voltage-gated channel subfamily A regulatory beta subunit 3 | Plasma Membrane | ion channel |
| KCNE3 | 0.56 | 0.23 | potassium voltage-gated channel subfamily E regulatory subunit 3 | Plasma Membrane | ion channel |
| LOC100130872 | 0.28 | 0.38 | uncharacterized | other | other |
| MAMSTR | 0.52 | 0.20 | MEF2 activating motif and SAP domain containing transcriptional regulator | Nucleus | transcription regulator |
| MARCKSL1 | 0.32 | 0.22 | MARCKS like 1 | Cytoplasm | other |
| NEFM | 0.15 | 0.24 | neurofilament medium | Plasma Membrane | other |
| SATB2 | 0.44 | 0.23 | SATB homeobox 2 | Nucleus | transcription regulator |
| SFRS13B | 0.43 | 0.22 | serine and arginine rich splicing factor 12 (SFRS12) | Nucleus | other |
| SLC1A2 | 0.36 | 0.29 | solute carrier family 1 member 2 | Plasma Membrane | transporter |
| TMEFF1 | 0.58 | 0.22 | transmembrane protein with EGF like and two follistatin like domains 1 | Plasma Membrane | other |
| TMEM97 | 0.61 | 0.24 | transmembrane protein 97 | Extracellular Space | other |
| FOXL2 | 0.06 | 0.23 | forkhead box L2 | Nucleus | transcription regulator |
| TSPYL5 | 0.42 | 0.22 | TSPY like 5 | other | other |
12 DM-DEGs were associated with a positive correlation between methylation of promoter-associated CpG islands and gene expression. 6 DM-DEGs were hypomethylated and upregulated in STLMS and 6 DM-DEGs were hypomethylated and upregulated in ULMS, suggesting that the expression of these genes might be regulated through other mechanisms. Other studies have also pointed to a positive association of DNA methylation and gene expression in cancer [35, 36], suggesting the diversity in epigenetic regulation.
The canonical pathway analysis of DMGs revealed multiple metabolic pathways (Figure 2G, Figure 2H). Numerous studies have pointed to the importance of tumor metabolism and treatment response [37]. Variety of drugs targeting the tumor metabolism are already available [38] and can potentially be combined with immunotherapy agents to facilitate metabolic reprogramming and enhance the antitumor response.
A possible explanation for the epigenetic differences is the tissue sites from which the tumors were derived. Comprehensive studies comparing normal tissue and tumor tissue are needed to further delineate the cancer-specific epigenetic changes at each tissue site. A recent study focused on the DNA methylation-based profiling of sarcomas and included samples corresponding to control tissue and STLMS [20]. We compared these two groups and identified 92 promoter CpG island-associated DMRs that were shared with the DMRs identified in the ULMS-STLMS comparison (Supplementary Table 11). 56 of these DMRs were associated with hypermethylation in STLMS compared to control and hypermethylation in STLMS compared to ULMS. Another study utilizing a small number of samples has demonstrated the differences in DNA methylation and gene expression between normal myometrium and ULMS [30]. We compared these two groups and identified 15 promoter CpG island-associated DMRs common with the DMRs identified in the ULMS-STLMS comparison (Supplementary Table 12). 14 of these DMRs were associated with hypomethylation in ULMS compared to STLMS and hypomethylation in ULMS compared to control. Although the number of common DMRs is small, these comparisons pointed to possible epigenetic regulation through hypermethylation or hypomethylation of promoter CpG island-associated DMRs in ULMS and STLMS compared to control tissues. Similar studies need to be performed with a larger number of LMS and control tissue samples to delineate the LMS-specific molecular changes independent of the site of origin.
In summary, we show evidence for differential DNA methylation profiles between ULMS and STLMS suggesting that differential epigenetic profiles are associated with LMS subtypes and may be responsible for differences seen in clinical outcomes. These findings suggest that epigenetic profiles can be used to stratify patients and apply therapeutic agents targeting the epigenetic mechanisms for LMS management. We identified several DM-DEGs and associated pathways. These findings can be used to improve our understanding of epigenetic regulation and clinical outcomes in LMS subtypes and guide biomarker development or targeted therapies.
Materials and Methods
Datasets used in the study
We used data corresponding to the LMS cases from the TCGA-SARC data. Both the DNA methylation data (Illumina Infinium HumanMethylation450 BeadChip, level 3) and normalized expression data (RNA-seqV2, level 3) for ULMS and STLMS cases (n = 80 samples, 27 ULMS, 53 STLMS) were downloaded from the Broad Institute GDAC FireBrowse portal. The analysis focused on primary tumor samples and the tumor subtype classification was defined by the TCGA clinical data [18]. The tumor sites for ULMS included uterus (n = 24) and abdomen (n = 3), whereas the tumor sites for STLMS included abdomen, primarily retroperitoneum (n = 36), extremities (14) and other regions (n = 3).
Additional public datasets were interrogated for DNA methylation including GSE140686 (n = 24 samples; 8 controls, 16 STLMS; Illumina HumanMethylation450 BeadChips or Illumina Infinium HumanMethylation850 BeadChips) [20] and GSE68312 (n = 5 samples; 3 controls, 2 ULMS Stage I; Illumina Infinium HumanMethylation450 BeadChip [30] and were downloaded from the Gene Expression Omnibus (http://www.ncbi.nlm.nih.gov/geo/).
Analysis of DNA methylation data
DNA methylation data for the TCGA-SARC dataset was analyzed as follows. First, the following CpG sites were removed from the analysis: 1. CpG sites with missing values >80% across the LMS cohort, 2. CpG sites on the X and Y chromosomes (potential bias due to female gender association with ULMS), 3. CpG sites on single nucleotide polymorphisms (SNPs), and 4. Cross-reactive probes [39]. A final set of 249,163 CpG sites was further analyzed. DNA methylation levels of CpG sites were calculated as β values. Probes were subjected to analysis with Qlucore Omics Explorer (v 3.6). Missing values were reconstructed using the average function. For stringent data filtering and visualization, data was first sorted by a variance of 5%. The average β values of the STLMS samples and the ULMS samples were calculated. Statistical filtering (q-value < 0.05 and ΔβULMS-STLMS > |0.2|) was applied to identify the differentially methylated regions (DMRs) between ULMS and STLMS groups. The DMRs were divided into two main groups: ULMS-hypermethylated (ΔβULMS-STLMS > 0.2) and STLMS-hypermethylated (ΔβSTLMS-ULMS > 0.2) and classified into subcategories depending on the 1. Location relative to the CpG island (CpG island, N_Shore, S_Shore, N_Shelf, S_Shelf, and Open Sea) and 2. Location based on the gene features (TSS1500, TSS200, 5’UTR, 1st Exon, Gene Body, 3’UTR, intergenic region). CpG site and gene mapping files were downloaded from https://www.illumina.com/. Genes with DMRs were described as differentially methylated genes (DMGs).
DNA methylation data for control muscle samples (reference samples 1-8) and STLMS samples (reference samples 116–120, 185, 186, 261, 391, 397, 680–683, 931, 1050) were extracted from the GSE140686 dataset [20]. Variables were analyzed with Qlucore Omics Explorer (v 3.6) using the following settings: variance = 5%, q-value < 0.05 and ΔβSTLMS-CONTROL > |0.2|) to identify the DMRs in STLMS compared to control groups.
DNA methylation data for control normal myometrium (samples 1-3) and ULMS (stage I, samples 2–3) were extracted from the GSE68312 dataset [30]. Variables were analyzed with Qlucore Omics Explorer (v 3.6) using the following settings: variance = 5%, q-value < 0.05 and ΔβULMS-CONTROL > |0.2|) to identify the differentially methylated regions (DMRs) between ULMS and control groups.
Analysis of gene expression data
Transcripts with missing values >80% across the LMS cohort were removed. A final set of 16,179 transcripts was further analyzed. Differential gene expression was determined using Qlucore Omics Explorer (v 3.6). A threshold of 0.01 was used and missing values were reconstructed using the average function. Log2 transformed RSEM values were used for all calculations and data representation. For stringent data filtering and visualization, data was first sorted by variance of 5%. Then, statistical filtering using q-value < 0.05 and log2 fold change > |1.5| was applied to determine the differentially expressed genes (DEGs) between ULMS and STLMS. Fold change was calculated as 2 to the power of the average difference between the two groups.
Integrated analysis of DNA methylation and gene expression
Normalized gene expression and DNA methylation array data were integrated based on the common genes identified as DEGs in the gene expression analysis and DMGs in the DNA methylation array. For this integrated analysis only DMGs with DMRs in CpG island regions upstream of TSS (within 1500 bp) were included. To study the relationship between gene methylation and expression, DM-DEGs (the genes in the intersection of DMGs and DEGs) were classified into two distinct groups: ULMS-Hypermethylated-Downregulated and STLMS-Hypermethylated- Downregulated.
Ingenuity pathway analysis for DNA methylation data
DNA methylation difference and q-value data comparing ULMS and STLMS was derived from Qlucore Omics Explorer (v 3.6). The DMGs corresponding to DMRs associated with promoter CpG islands (q-value < 0.05, ΔβULMS-STLMS > |0.2|) were uploaded to Ingenuity Pathway Analysis (Qiagen) for canonical pathway and upstream regulator analysis. Data for 77 ULMS-Hypermethylated DMGs and 73 STLMS-Hypermethylated DMGs were used. Canonical pathways with a p-value < 0.05 (-log (p-value) < 1.3) were considered as statistically significant.
Ingenuity pathway analysis for RNA-seq data
Log2 fold change and q-value data comparing ULMS and STLMS was derived from Qlucore Omics Explorer (v 3.6) and uploaded to Ingenuity Pathway Analysis (Qiagen)for pathway analysis. DEGs were filtered based on q-value < 0.05 and log2 fold change > |1.5| and used for further analysis. Canonical pathways with a p-value < 0.05 (or -log (p-value) < 1.3) were considered statistically significant.
Abbreviations
LMS: Leiomyosarcoma; ULMS: Uterine Leiomyosarcoma; STLMS: Soft Tissue Leiomyosarcoma; TCGA: The Cancer Genome Atlas; PCA: Principal Component Analysis; HCA: Hierarchical Clustering Analysis; FC: Fold Change; DMRs: Differentially Methylated Regions; DMGs: Differentially Methylated Genes; DEGs: Differentially Expressed Genes.
ACKNOWLEDGMENTS
The results shown here are in whole or part based upon data generated by the TCGA Research Network: https://www.cancer.gov/tcga.
CONFLICTS OF INTEREST
N.A. has received grant funding from Cepheid and Astex and has served as consultant to Ethicon. N.A. has licensed methylation biomarkers to Cepheid. H.D. is/was scientific advisor/consultant for Daiichi Sankyo, Inc., Deciphera, Eisai-Differentiated Thyroid Cancer (DTC), Bristol-Myers Squibb and Lilly. The funders had no role in the design of the study; in the collection, analyses, or interpretation of data; in the writing of the manuscript, or in the decision to publish the results. The other authors declare no conflict of interest.
FUNDING
This research was funded by the National Institutes of Health/National Cancer Institute, grant number P30 CA016359.
References
1. George S, Serrano C, Hensley ML, Ray-Coquard I. Soft Tissue and Uterine Leiomyosarcoma. J Clin Oncol. 2018; 36:144–50. https://doi.org/10.1200/JCO.2017.75.9845. [PubMed].
2. Coindre JM, Terrier P, Guillou L, Le Doussal V, Collin F, Ranchère D, Sastre X, Vilain MO, Bonichon F, N’Guyen Bui B. Predictive value of grade for metastasis development in the main histologic types of adult soft tissue sarcomas: a study of 1240 patients from the French Federation of Cancer Centers Sarcoma Group. Cancer. 2001; 91:1914–26. https://doi.org/10.1002/1097-0142(20010515)91:10<1914::aid-cncr1214>3.0.co;2-3. [PubMed].
3. Gladdy RA, Qin LX, Moraco N, Agaram NP, Brennan MF, Singer S. Predictors of survival and recurrence in primary leiomyosarcoma. Ann Surg Oncol. 2013; 20:1851–57. https://doi.org/10.1245/s10434-013-2876-y. [PubMed].
4. Edmonson JH, Blessing JA, Cosin JA, Miller DS, Cohn DE, Rotmensch J. Phase II study of mitomycin, doxorubicin, and cisplatin in the treatment of advanced uterine leiomyosarcoma: a Gynecologic Oncology Group study. Gynecol Oncol. 2002; 85:507–10. https://doi.org/10.1006/gyno.2002.6661. [PubMed].
5. Hensley ML, Blessing JA, Degeest K, Abulafia O, Rose PG, Homesley HD. Fixed-dose rate gemcitabine plus docetaxel as second-line therapy for metastatic uterine leiomyosarcoma: a Gynecologic Oncology Group phase II study. Gynecol Oncol. 2008; 109:323–28. https://doi.org/10.1016/j.ygyno.2008.02.024. [PubMed].
6. Hensley ML, Blessing JA, Mannel R, Rose PG. Fixed-dose rate gemcitabine plus docetaxel as first-line therapy for metastatic uterine leiomyosarcoma: a Gynecologic Oncology Group phase II trial. Gynecol Oncol. 2008; 109:329–34. https://doi.org/10.1016/j.ygyno.2008.03.010. [PubMed].
7. Lamm W, Natter C, Schur S, Köstler WJ, Reinthaller A, Krainer M, Grimm C, Horvath R, Amann G, Funovics P, Brodowicz T, Polterauer S. Distinctive outcome in patients with non-uterine and uterine leiomyosarcoma. BMC Cancer. 2014; 14:981. https://doi.org/10.1186/1471-2407-14-981. [PubMed].
8. Oosten AW, Seynaeve C, Schmitz PI, den Bakker MA, Verweij J, Sleijfer S. Outcomes of first-line chemotherapy in patients with advanced or metastatic leiomyosarcoma of uterine and non-uterine origin. Sarcoma. 2009; 2009:348910. https://doi.org/10.1155/2009/348910. [PubMed].
9. Singhi EK, Moore DC, Muslimani A. Metastatic Soft Tissue Sarcomas: A Review Of Treatment and New Pharmacotherapies. P T. 2018; 43:410–29. [PubMed].
10. Gounder M, Schöffski P, Jones RL, Agulnik M, Cote GM, Villalobos VM, Attia S, Chugh R, Chen TW, Jahan T, Loggers ET, Gupta A, Italiano A, et al. Tazemetostat in advanced epithelioid sarcoma with loss of INI1/SMARCB1: an international, open-label, phase 2 basket study. Lancet Oncol. 2020; 21:1423–32. https://doi.org/10.1016/S1470-2045(20)30451-4. [PubMed].
11. Farid M, Ong WS, Tan MH, Foo LS, Lim YK, Chia WK, Soh LT, Poon D, Lee MJ, Ho ZC, Jeevan R, Chin F, Teo M, Quek R. The influence of primary site on outcomes in leiomyosarcoma: a review of clinicopathologic differences between uterine and extrauterine disease. Am J Clin Oncol. 2013; 36:368–74. https://doi.org/10.1097/COC.0b013e318248dbf4. [PubMed].
12. Worhunsky DJ, Gupta M, Gholami S, Tran TB, Ganjoo KN, van de Rijn M, Visser BC, Norton JA, Poultsides GA. Leiomyosarcoma: One disease or distinct biologic entities based on site of origin? J Surg Oncol. 2015; 111:808–12. https://doi.org/10.1002/jso.23904. [PubMed].
13. Chudasama P, Mughal SS, Sanders MA, Hübschmann D, Chung I, Deeg KI, Wong SH, Rabe S, Hlevnjak M, Zapatka M, Ernst A, Kleinheinz K, Schlesner M, et al. Integrative genomic and transcriptomic analysis of leiomyosarcoma. Nat Commun. 2018; 9:144. https://doi.org/10.1038/s41467-017-02602-0. [PubMed].
14. Beck AH, Lee CH, Witten DM, Gleason BC, Edris B, Espinosa I, Zhu S, Li R, Montgomery KD, Marinelli RJ, Tibshirani R, Hastie T, Jablons DM, et al. Discovery of molecular subtypes in leiomyosarcoma through integrative molecular profiling. Oncogene. 2010; 29:845–54. https://doi.org/10.1038/onc.2009.381. [PubMed].
15. Guo X, Forgó E, van de Rijn M. Molecular subtyping of leiomyosarcoma with 3’ end RNA sequencing. Genom Data. 2015; 5:366–67. https://doi.org/10.1016/j.gdata.2015.06.029. [PubMed].
16. Guo X, Jo VY, Mills AM, Zhu SX, Lee CH, Espinosa I, Nucci MR, Varma S, Forgó E, Hastie T, Anderson S, Ganjoo K, Beck AH, et al. Clinically Relevant Molecular Subtypes in Leiomyosarcoma. Clin Cancer Res. 2015; 21:3501–11. https://doi.org/10.1158/1078-0432.CCR-14-3141. [PubMed].
17. Hemming ML, Fan C, Raut CP, Demetri GD, Armstrong SA, Sicinska E, George S. Oncogenic Gene-Expression Programs in Leiomyosarcoma and Characterization of Conventional, Inflammatory, and Uterogenic Subtypes. Mol Cancer Res. 2020; 18:1302–14. https://doi.org/10.1158/1541-7786.MCR-20-0197. [PubMed].
18. Abeshouse A, Adebamowo C, Adebamowo SN, Akbani R, Akeredolu T, Ally A, Anderson ML, Anur P, Appelbaum EL, Armenia J, Auman JT, Bailey MH, Baker L, et al, and Cancer Genome Atlas Research Network. Comprehensive and Integrated Genomic Characterization of Adult Soft Tissue Sarcomas. Cell. 2017; 171:950–65.e28. https://doi.org/10.1016/j.cell.2017.10.014. [PubMed].
19. Choi J, Manzano A, Dong W, Bellone S, Bonazzoli E, Zammataro L, Yao X, Deshpande A, Zaidi S, Guglielmi A, Gnutti B, Nagarkatti N, Tymon-Rosario JR, et al. Integrated mutational landscape analysis of uterine leiomyosarcomas. Proc Natl Acad Sci U S A. 2021; 118:e2025182118. https://doi.org/10.1073/pnas.2025182118. [PubMed].
20. Koelsche C, Schrimpf D, Stichel D, Sill M, Sahm F, Reuss DE, Blattner M, Worst B, Heilig CE, Beck K, Horak P, Kreutzfeldt S, Paff E, et al. Sarcoma classification by DNA methylation profiling. Nat Commun. 2021; 12:498. https://doi.org/10.1038/s41467-020-20603-4. [PubMed].
21. Renner M, Wolf T, Meyer H, Hartmann W, Penzel R, Ulrich A, Lehner B, Hovestadt V, Czwan E, Egerer G, Schmitt T, Alldinger I, Renker EK, et al. Integrative DNA methylation and gene expression analysis in high-grade soft tissue sarcomas. Genome Biol. 2013; 14:r137. https://doi.org/10.1186/gb-2013-14-12-r137. [PubMed].
22. Easwaran H, Tsai HC, Baylin SB. Cancer epigenetics: tumor heterogeneity, plasticity of stem-like states, and drug resistance. Mol Cell. 2014; 54:716–27. https://doi.org/10.1016/j.molcel.2014.05.015. [PubMed].
23. Baylin SB, Jones PA. A decade of exploring the cancer epigenome - biological and translational implications. Nat Rev Cancer. 2011; 11:726–34. https://doi.org/10.1038/nrc3130. [PubMed].
24. Kerachian MA, Javadmanesh A, Azghandi M, Mojtabanezhad Shariatpanahi A, Yassi M, Shams Davodly E, Talebi A, Khadangi F, Soltani G, Hayatbakhsh A, Ghaffarzadegan K. Crosstalk between DNA methylation and gene expression in colorectal cancer, a potential plasma biomarker for tracing this tumor. Sci Rep. 2020; 10:2813. https://doi.org/10.1038/s41598-020-59690-0. [PubMed].
25. Kawaguchi K, Oda Y, Saito T, Yamamoto H, Takahira T, Tamiya S, Iwamoto Y, Tsuneyoshi M. Death-associated protein kinase (DAP kinase) alteration in soft tissue leiomyosarcoma: Promoter methylation or homozygous deletion is associated with a loss of DAP kinase expression. Hum Pathol. 2004; 35:1266–71. https://doi.org/10.1016/j.humpath.2004.07.007. [PubMed].
26. Kawaguchi K, Oda Y, Saito T, Yamamoto H, Tamiya S, Takahira T, Miyajima K, Iwamoto Y, Tsuneyoshi M. Mechanisms of inactivation of the p16INK4a gene in leiomyosarcoma of soft tissue: decreased p16 expression correlates with promoter methylation and poor prognosis. J Pathol. 2003; 201:487–95. https://doi.org/10.1002/path.1419. [PubMed].
27. Bates SE. Epigenetic Therapies for Cancer. N Engl J Med. 2020; 383:650–63. https://doi.org/10.1056/NEJMra1805035. [PubMed].
28. De Carvalho Fischer C, Hu Y, Morreale M, Lin WY, Wali A, Thakar M, Karunasena E, Sen R, Cai Y, Murphy L, Zahnow CA, Keer H, Thakar M, Ahuja N. Treatment with epigenetic agents profoundly inhibits tumor growth in leiomyosarcoma. Oncotarget. 2018; 9:19379–95. https://doi.org/10.18632/oncotarget.25056. [PubMed].
29. Nacev BA, Jones KB, Intlekofer AM, Yu JSE, Allis CD, Tap WD, Ladanyi M, Nielsen TO. The epigenomics of sarcoma. Nat Rev Cancer. 2020; 20:608–23. https://doi.org/10.1038/s41568-020-0288-4. [PubMed].
30. Miyata T, Sonoda K, Tomikawa J, Tayama C, Okamura K, Maehara K, Kobayashi H, Wake N, Kato K, Hata K, Nakabayashi K. Genomic, Epigenomic, and Transcriptomic Profiling towards Identifying Omics Features and Specific Biomarkers That Distinguish Uterine Leiomyosarcoma and Leiomyoma at Molecular Levels. Sarcoma. 2015; 2015:412068. https://doi.org/10.1155/2015/412068. [PubMed].
31. Koelsche C, Stichel D, Griewank KG, Schrimpf D, Reuss DE, Bewerunge-Hudler M, Vokuhl C, Dinjens WNM, Petersen I, Mittelbronn M, Cuevas-Bourdier A, Buslei R, Pfister SM, et al. Genome-wide methylation profiling and copy number analysis in atypical fibroxanthomas and pleomorphic dermal sarcomas indicate a similar molecular phenotype. Clin Sarcoma Res. 2019; 9:2. https://doi.org/10.1186/s13569-019-0113-6. [PubMed].
32. Jung G, Hernández-Illán E, Moreira L, Balaguer F, Goel A. Epigenetics of colorectal cancer: biomarker and therapeutic potential. Nat Rev Gastroenterol Hepatol. 2020; 17:111–30. https://doi.org/10.1038/s41575-019-0230-y. [PubMed].
33. Lomberk G, Dusetti N, Iovanna J, Urrutia R. Emerging epigenomic landscapes of pancreatic cancer in the era of precision medicine. Nat Commun. 2019; 10:3875. https://doi.org/10.1038/s41467-019-11812-7. [PubMed].
34. Ando M, Saito Y, Xu G, Bui NQ, Medetgul-Ernar K, Pu M, Fisch K, Ren S, Sakai A, Fukusumi T, Liu C, Haft S, Pang J, et al. Chromatin dysregulation and DNA methylation at transcription start sites associated with transcriptional repression in cancers. Nat Commun. 2019; 10:2188. https://doi.org/10.1038/s41467-019-09937-w. [PubMed].
35. Rauluseviciute I, Drabløs F, Rye MB. DNA hypermethylation associated with upregulated gene expression in prostate cancer demonstrates the diversity of epigenetic regulation. BMC Med Genomics. 2020; 13:6. https://doi.org/10.1186/s12920-020-0657-6. [PubMed].
36. Wan J, Oliver VF, Wang G, Zhu H, Zack DJ, Merbs SL, Qian J. Characterization of tissue-specific differential DNA methylation suggests distinct modes of positive and negative gene expression regulation. BMC Genomics. 2015; 16:49. https://doi.org/10.1186/s12864-015-1271-4. [PubMed].
37. Cerezo M, Rocchi S. Cancer cell metabolic reprogramming: a keystone for the response to immunotherapy. Cell Death Dis. 2020; 11:964. https://doi.org/10.1038/s41419-020-03175-5. [PubMed].
38. Luengo A, Gui DY, Vander Heiden MG. Targeting Metabolism for Cancer Therapy. Cell Chem Biol. 2017; 24:1161–80. https://doi.org/10.1016/j.chembiol.2017.08.028. [PubMed].
39. Chen YA, Lemire M, Choufani S, Butcher DT, Grafodatskaya D, Zanke BW, Gallinger S, Hudson TJ, Weksberg R. Discovery of cross-reactive probes and polymorphic CpGs in the Illumina Infinium HumanMethylation450 microarray. Epigenetics. 2013; 8:203–09. https://doi.org/10.4161/epi.23470. [PubMed].