
Introduction
Recurrent or metastatic head and neck cancer (HNSC) that includes tumors of oral cavity, paranasal sinuses, nasal cavity, pharynx, and larynx is associated with poor patient outcome, tumor aggressiveness and is characterized by early metastasis to the regional lymph nodes [1]. It is the 6th most common cancer worldwide and has a 5-year survival rate of less than 50% which is one of the lowest among major cancers [2]. Recurrence of HNSC is the primary clinical event limiting success of therapeutic interventions after surgical tumor resection [3]. Additionally, patients with HNSC often have limited options therapy as tumors in this region show profound drug and chemoresistance warranting development of new therapies [4]. Integrated analysis of multi-dimensional transcriptomic data is important to our understanding of cancer metastasis and could provide valuable clues to tumor stage progression, dysregulated cellular pathways and survival outcome [4]. A high proportion of patients who do not respond to standard treatment could get a benefit from personalized therapy based on the molecular diagnostics or targeted therapies to a particular tumor grade or stage and specific patterns of dissemination [5]. Studies have established several risk factors such as tobacco use and HPV status as primary risk agents for HNSC [6]. In HNSC, metastatic dissemination to regional lymph nodes has been shown to be a major prognostic indicator for disease progression, and positive lymph node association reduces survival by 50% [7]. Lymphovascular invasion (LVI) (defined as the presence of tumor cells within a definite endothelial-lined space (lymphatics or blood vessels), is a key predictor of metastatic spread [8]. LVI of tumor cells is a prerequisite for the dissemination via the lymphatic or blood vascular system and increased lymphatic vessels density (or lymphangiogenesis) near tumor cells are more likely to promote tumor spread to lymph nodes and to distant sites [9, 10]. LVI is a histopathological feature that established as an independent predictor of poor prognosis and lymph node metastasis (LNM) in several solid tumors. Although different molecular signatures are associated with HNSCC, most studies have typically overlooked the association of any molecular, genetic or clinical features with LVI and the factors contributing to LVI remain very poorly understood [11–13].
Large scale genome sequencing projects by The Cancer Genome Atlas (TCGA) have established extensive patient datasets of HNSC with detailed information of molecular characteristics of the tumor [14]. As cancer cell behavior is governed by multiple, nonlinear, interacting pathways, integrated analysis of multidimensional transcriptomic data provides valuable clues to tumor stage progression, cell signaling and survival outcome [15]. Several biomarkers for HNSC have been defined but most of these have failed to have prognostic value for recurrent disease, possibly because of any lack of association with lymph node metastasis. Recently miRNAs, that are small non-coding RNA about 18–22 nucleotides long have emerged as significant predictors of different disease outcomes and have established their efficacy as therapeutic biomarkers [16]. miRNAs modulate specific gene expression by inhibiting specific genes or gene networks and thereby affect an entire biological pathway. Several studies have identified various miRNAs to be dysregulated in HNSC, and are shown to be involved in regulation of various molecular pathways and cellular processes that contribute to tumor progression and metastasis in HNSC [17–19]. However, the correlation between miRNA expression and regulation of genes involved in promoting LVI and subsequently metastatic disease, in particular lymph node metastasis, remains grossly understudied. There is thus a considerable knowledge gap in the application of miRNAs as potential biomarkers or prognostic indicators for LVI and thus eludes development of targeted therapeutic strategies. Further, since miRNAs target several groups of genes during cancer progression [20], identification of miRNA clusters that are closely predictive or associated with LVI maybe more clinically relevant than identifying single miRNA as they would provide critical information about specific pathways that are dysregulated during progression of LVI and subsequent metastasis.
Hence, in this paper, we address this critical gap and use sophisticated machine learning and clustering approaches to systematically identify specific clusters of miRNAs that are predictive of and show significant association with LVI and thus could be further evaluated as prognostic indicators of tumor spread in HNSCC. Further, a novel aspect of these studies was that as lymphangiogenesis or growth of new lymphatic vessels is a critical event that promotes LVI and subsequently lymph node metastasis (LNM), we also evaluated whether these miRNAs showed correlation with specific lymphangiogenic genes.
Results
Based on the 5% significance level criteria, we have selected 61 out of 496 miRNAs that are strongly associated with the LVI status. The odds ratio estimate and the 95% confidence interval for the association between LVI and the 61 miRNAs are given in Table 1.
Table 1: The odds ratio estimate and the 95%Wald’s confidence interval from the univariate logistic regression analyses, for all 61 miRNAs
| mimiRNA.Name | OR | Lower limit (95% CI) | Upper limit (95% CI) |
|---|---|---|---|
| hsa-miR-203a-3p | 0.60 | 0.47 | 0.76 |
| hsa-miR-30a-5p | 1.60 | 1.25 | 2.04 |
| hsa-miR-30a-3p | 1.58 | 1.25 | 2.01 |
| hsa-miR-10a-5p | 1.59 | 1.25 | 2.03 |
| hsa-miR-1293 | 0.65 | 0.51 | 0.83 |
| hsa-miR-30c-2-3p | 1.52 | 1.19 | 1.92 |
| hsa-let-7d-5p | 1.52 | 1.19 | 1.94 |
| hsa-miR-28-5p | 1.50 | 1.18 | 1.91 |
| hsa-miR-128-3p | 1.48 | 1.16 | 1.88 |
| hsa-miR-3913-5p | 1.49 | 1.17 | 1.90 |
| hsa-miR-1266-5p | 1.46 | 1.16 | 1.84 |
| hsa-miR-194-5p | 1.44 | 1.14 | 1.82 |
| hsa-miR-9-5p | 1.42 | 1.13 | 1.79 |
| hsa-miR-106b-5p | 1.42 | 1.12 | 1.80 |
| hsa-miR-25-3p | 1.43 | 1.12 | 1.81 |
| hsa-miR-204-5p | 1.41 | 1.11 | 1.77 |
| hsa-miR-218-5p | 1.40 | 1.11 | 1.77 |
| hsa-miR-101-3p | 1.40 | 1.11 | 1.78 |
| hsa-miR-92b-3p | 1.39 | 1.10 | 1.76 |
| hsa-miR-181c-3p | 1.39 | 1.10 | 1.76 |
| hsa-miR-31-3p | 0.73 | 0.58 | 0.91 |
| hsa-miR-192-5p | 1.39 | 1.10 | 1.75 |
| hsa-miR-1287-5p | 1.39 | 1.10 | 1.76 |
| hsa-miR-584-5p | 0.72 | 0.57 | 0.91 |
| hsa-miR-181d-5p | 1.37 | 1.09 | 1.73 |
| hsa-miR-30d-3p | 1.38 | 1.09 | 1.76 |
| hsa-miR-95-3p | 1.36 | 1.08 | 1.72 |
| hsa-miR-9-3p | 1.34 | 1.07 | 1.68 |
| hsa-miR-101-5p | 1.36 | 1.07 | 1.71 |
| hsa-miR-187-3p | 0.75 | 0.59 | 0.94 |
| hsa-miR-497-5p | 1.35 | 1.06 | 1.70 |
| hsa-miR-217-5p | 1.33 | 1.06 | 1.68 |
| hsa-miR-1910-5p | 0.74 | 0.58 | 0.95 |
| hsa-miR-130b-3p | 1.33 | 1.05 | 1.68 |
| hsa-miR-141-5p | 1.33 | 1.05 | 1.69 |
| hsa-miR-455-3p | 0.75 | 0.60 | 0.95 |
| hsa-miR-31-5p | 0.76 | 0.61 | 0.95 |
| hsa-miR-193b-5p | 0.75 | 0.60 | 0.95 |
| hsa-miR-340-5p | 1.32 | 1.04 | 1.66 |
| hsa-miR-20b-5p | 1.31 | 1.04 | 1.64 |
| hsa-miR-592 | 1.31 | 1.04 | 1.65 |
| hsa-miR-28-3p | 1.31 | 1.04 | 1.66 |
| hsa-miR-374a-3p | 1.32 | 1.04 | 1.68 |
| hsa-miR-374b-5p | 1.30 | 1.03 | 1.65 |
| hsa-miR-378c | 1.30 | 1.03 | 1.63 |
| hsa-miR-34a-5p | 1.30 | 1.03 | 1.64 |
| hsa-miR-370-5p | 1.29 | 1.03 | 1.63 |
| hsa-miR-6720-3p | 1.29 | 1.03 | 1.63 |
| hsa-miR-194-3p | 1.29 | 1.02 | 1.62 |
| hsa-miR-769-5p | 1.29 | 1.02 | 1.62 |
| hsa-miR-6892-5p | 0.76 | 0.60 | 0.98 |
| hsa-miR-1304-3p | 0.75 | 0.58 | 0.97 |
| hsa-miR-374b-3p | 1.28 | 1.01 | 1.61 |
| hsa-miR-30b-5p | 1.27 | 1.01 | 1.61 |
| hsa-let-7d-3p | 1.28 | 1.01 | 1.62 |
| hsa-miR-195-3p | 1.27 | 1.01 | 1.60 |
| hsa-miR-151a-3p | 1.27 | 1.01 | 1.60 |
| hsa-miR-215-5p | 1.26 | 1.00 | 1.59 |
| hsa-miR-4677-3p | 1.26 | 1.00 | 1.59 |
| hsa-miR-1468-5p | 1.26 | 1.00 | 1.59 |
| hsa-let-7f-1-3p | 1.26 | 1.00 | 1.59 |
Identification of important miRNAs by univariate logistic regression analysis
For the purpose of illustration here we explain the odds ratio of the most significant miRNA, hsa-miR-203a-3p, in terms of the association between the miRNA and the LVI status. The result implies that the odds of having LVI decreases by 40% for one unit increase of the scaled hsa-miR-203a-3p. This is indicated in the side-by-side boxplot as shown in Figure 1, where the distribution of hsa-miR-203a-3p for the LVI = 1 group is shifted downward compared to that for group LVI = 0.
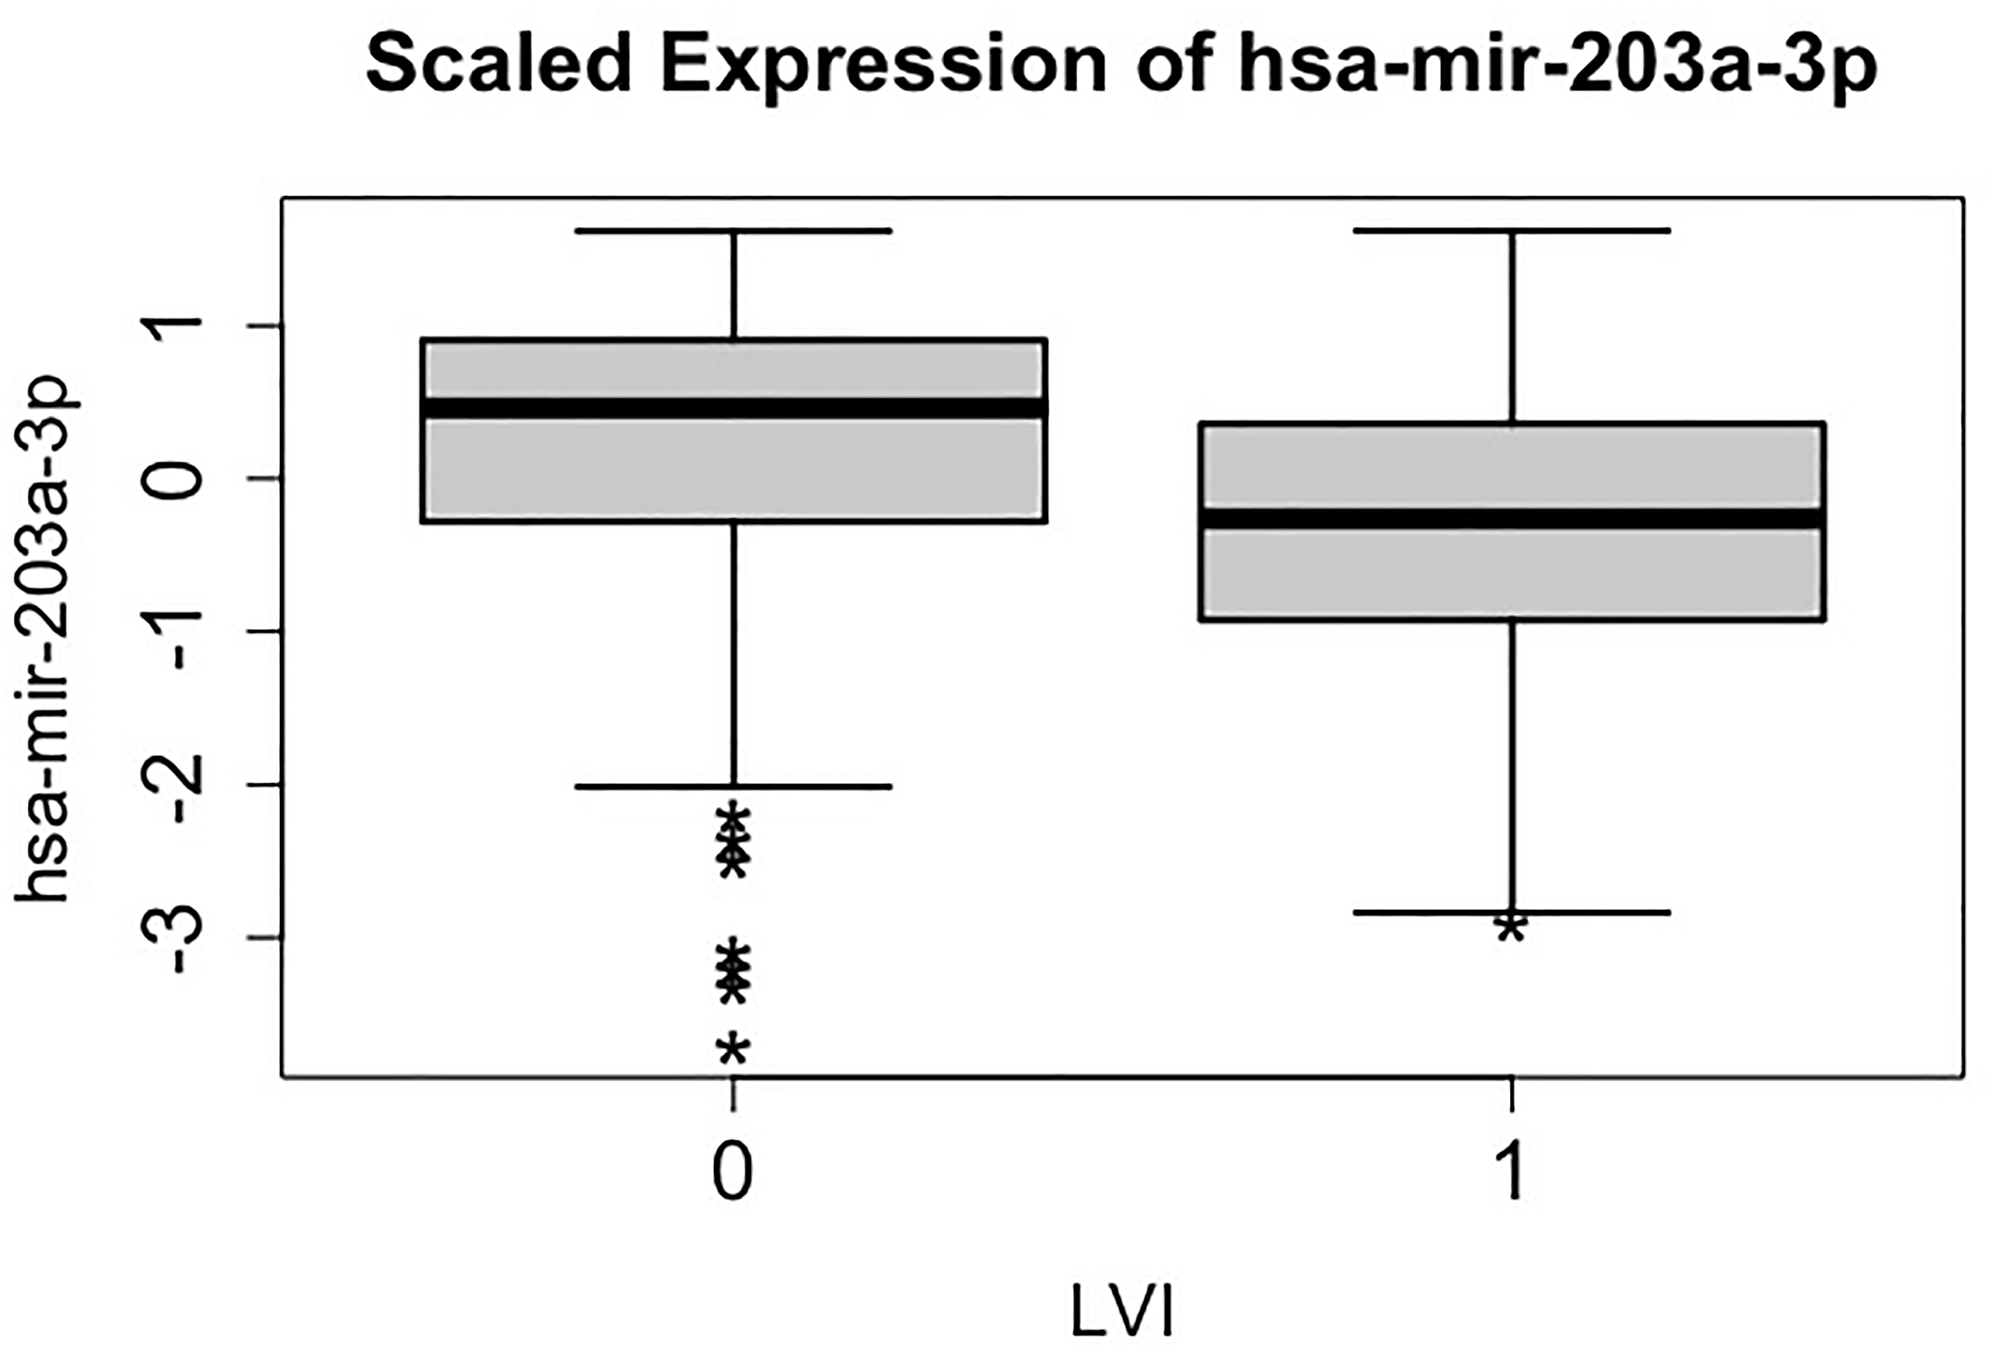
Figure 1: Side-by-side boxplots (distribution) of the scaled expression of hsa-mir-203a-3p against lymphovascular invasion (LVI) status. LVI value 1 and 0 indicate groups having and not having lymphovascular invasion respectively.
Identification of predictive miRNAs using logistic LASSO screening and multiple logistic regression
For identifying a predictive model for LVI, next we regressed LVI on the 57 miRNAs (after eliminating the 4 miRNAs that showed high correlation as described above). We used a multiple logistic regression method, and used the LASSO (Least Absolute Shrinkage and Selection Operator) approach to obtain regularized parameter estimates [21]. The LASSO method helps to select important features among many while sets the coefficients corresponding to unimportant features to zero. For the HNSC data, only 20 miRNAs got selected. These include hsa-let-7d-5p, hsa-miR-30a-5p, hsa-miR-30a-3p, hsa-miR-95-3p, hsa-miR-10a-5p, hsa-miR-187-3p, hsa-miR-203a-3p, hsa-miR-128-3p, hsa-miR-92b-3p, hsa-let-7f-1-3p, hsa-miR-30d-3p, hsa-miR-141-5p, hsa-miR-194-3p, hsa-miR-455-3p, hsa-miR-1910-5p, hsa-miR-3913-5p, hsa-miR-1304-3p, hsa-miR-6720-3p, hsa-miR-370-5p, hsa-miR-6892-5p. Based on these selected 20 miRNAs we ran a multiple logistic regression with LVI as the response variable. The predictive power of this multiple logistic model is presented through the ROC curve (Figure 2) with the area under the curve 77%.
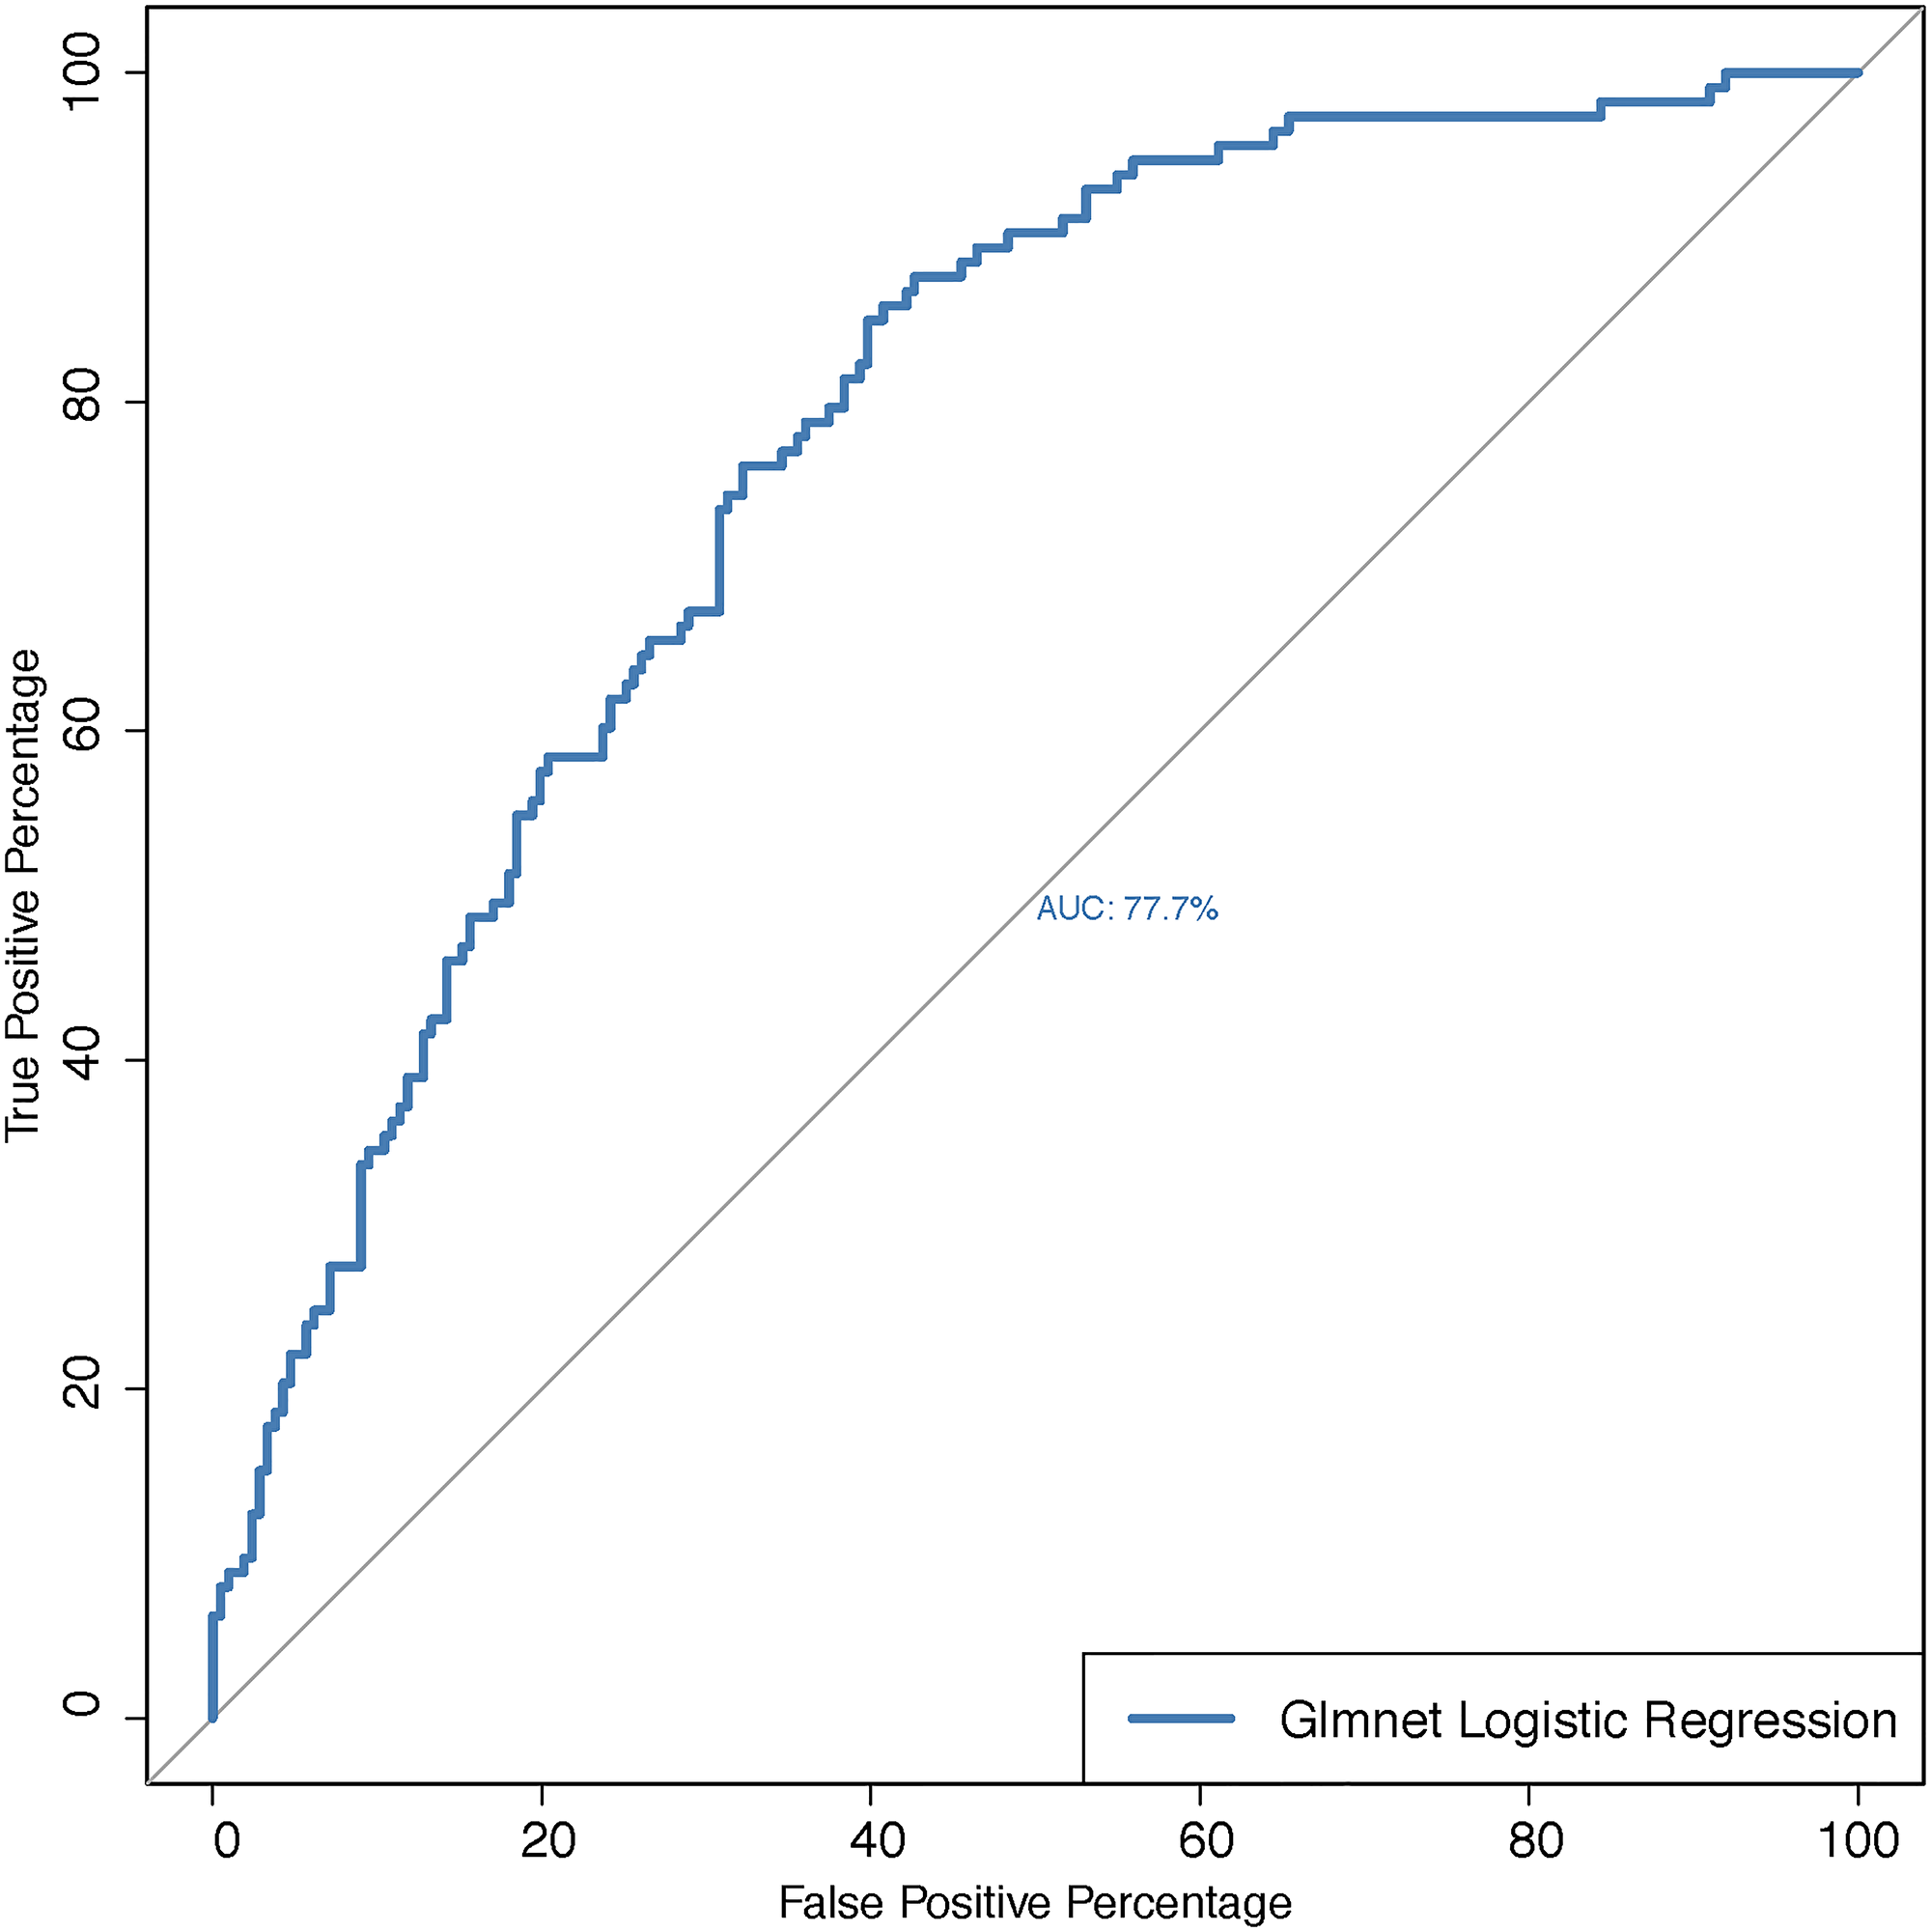
Figure 2: ROC-curve for predicting lymphovascular invasion status for the multiple logistic regression with the set of miRNAs as predictors that are selected via the LASSO method. Abbreviations: AUC: Area under the curve; GLMNET: Regularized Generalized Linear Model.
Clustering of the selected miRNAs reveals three distinct miRNA clusters that associate with LVI in HNSC
Using the gap statistic, we found that the optimal number of clusters is three. Table 2 shows all the miRNAs in three unsupervised individual clusters. We then used 3 as the number of clusters in the supervised clustering method Wilma. Among the 57 miRNAs, Wilma recognized 35 miRNAs as significant for prediction of LVI status and clustered them into three different and distinct clusters. Figure 3 shows the univariate logistic regression coefficients of the miRNAs grouped into three clusters. A positive value (grey bar) of a regression coefficient indicates that the chance of LVI increases with the expression value of the corresponding miRNAs. Similarly, a negative coefficient (black bar) indicates that the chance of LVI decreases as the expression of the corresponding miRNAs increases. Cluster 1 has seventeen miRNAs, cluster 2 has eight, and cluster 3 has ten miRNAs (Figure 4). The Wilma results suggest that 35 out of 57 miRNAs are important for predicting the risk of LVI.
Table 2: Table of the miRNA clusters based on the K-means unsupervised approach
| Cluster 1 | Cluster 2 | Cluster 3 |
|---|---|---|
| hsa-let-7d-5p | hsa-miR-31-5p | hsa-miR-28-5p |
| hsa-miR-25-3p | hsa-miR-187-3p | hsa-miR-30a-5p |
| hsa-miR-34a-5p | hsa-miR-203a-3p | hsa-miR-30a-3p |
| hsa-miR-30b-5p | hsa-miR-584-5p | hsa-miR-95-3p |
| hsa-miR-9-5p | hsa-miR-193b-5p | hsa-miR-101-3p |
| hsa-miR-106b-5p | hsa-miR-455-3p | hsa-miR-10a-5p |
| hsa-miR-130b-3p | hsa-miR-1293 | hsa-miR-204-5p |
| hsa-miR-20b-5p | hsa-miR-1910-5p | hsa-miR-215-5p |
| hsa-miR-592 | hsa-miR-1304-3p | hsa-miR-217-5p |
| hsa-let-7d-3p | hsa-miR-6892-5p | hsa-miR-218-5p |
| hsa-miR-28-3p | hsa-miR-128-3p | |
| hsa-miR-30d-3p | hsa-miR-194-5p | |
| hsa-miR-141-5p | hsa-miR-151a-3p | |
| hsa-miR-194-3p | hsa-miR-497-5p | |
| hsa-miR-374a-3p | hsa-miR-181d-5p | |
| hsa-miR-374b-5p | hsa-miR-92b-3p | |
| hsa-miR-374b-3p | hsa-miR-769-5p | |
| hsa-miR-1266-5p | hsa-let-7f-1-3p | |
| hsa-miR-4677-3p | hsa-miR-101-5p | |
| hsa-miR-181c-3p | ||
| hsa-miR-195-3p | ||
| hsa-miR-340-5p | ||
| hsa-miR-1287-5p | ||
| hsa-miR-1468-5p | ||
| hsa-miR-378c | ||
| hsa-miR-3913-5p | ||
| hsa-miR-6720-3p | ||
| hsa-miR-370-5p |
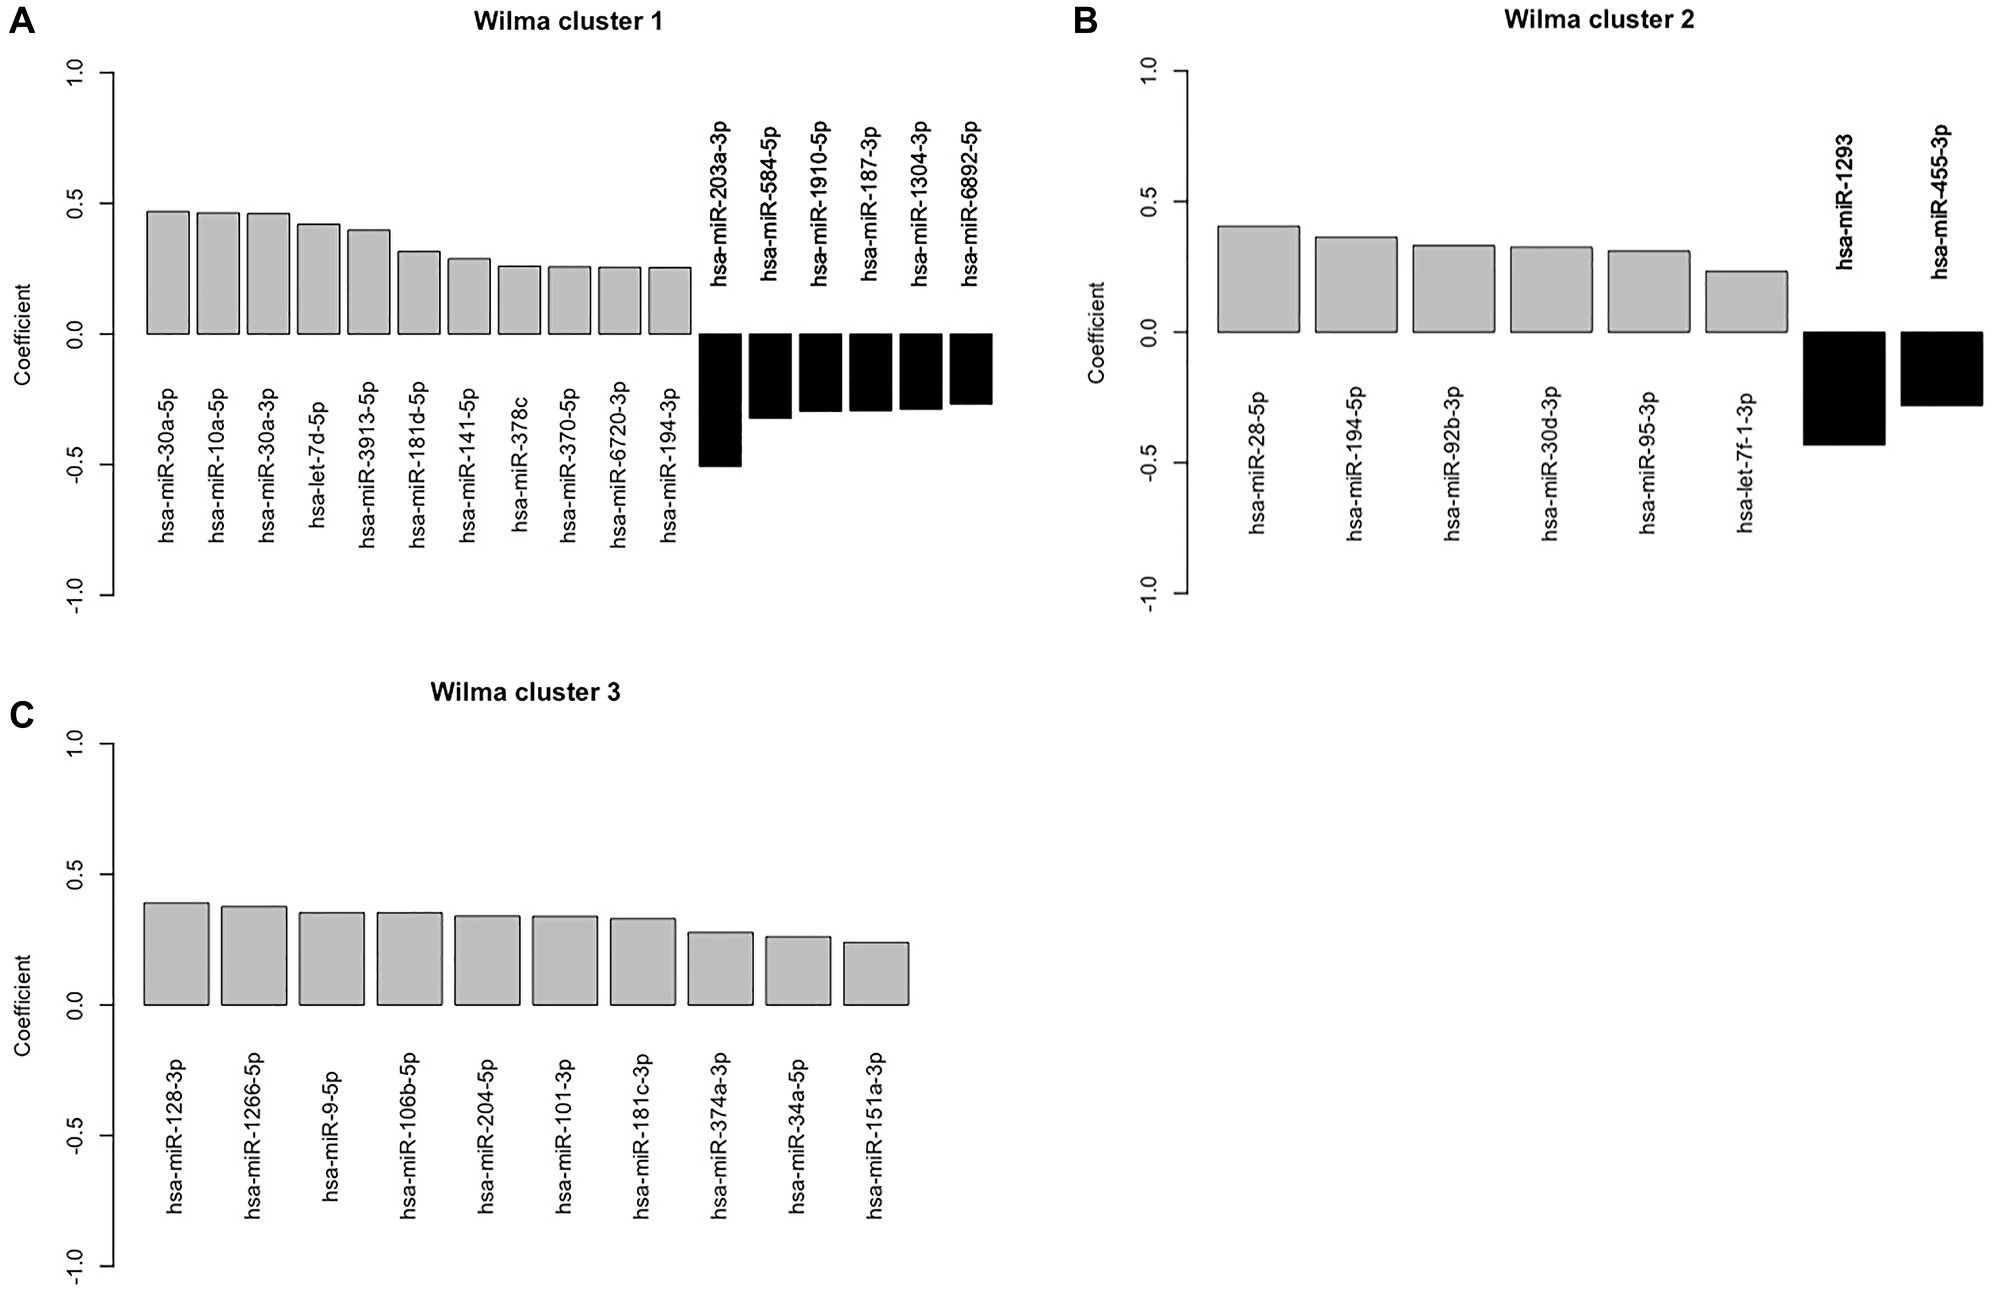
Figure 3: Plot of the estimated regression parameter of the univariate logistic regression for lymphovascular invasion against corresponding to each of the miRNAs that are selected by the supervised clustering method. (A–C) A positive value (grey bar) of a regression coefficient indicates that the chance of LVI increases with the expression value of the corresponding miRNAs. Similarly, a negative coefficient (black bar) indicates that the chance of LVI decreases as the expression of the corresponding miRNAs increases.
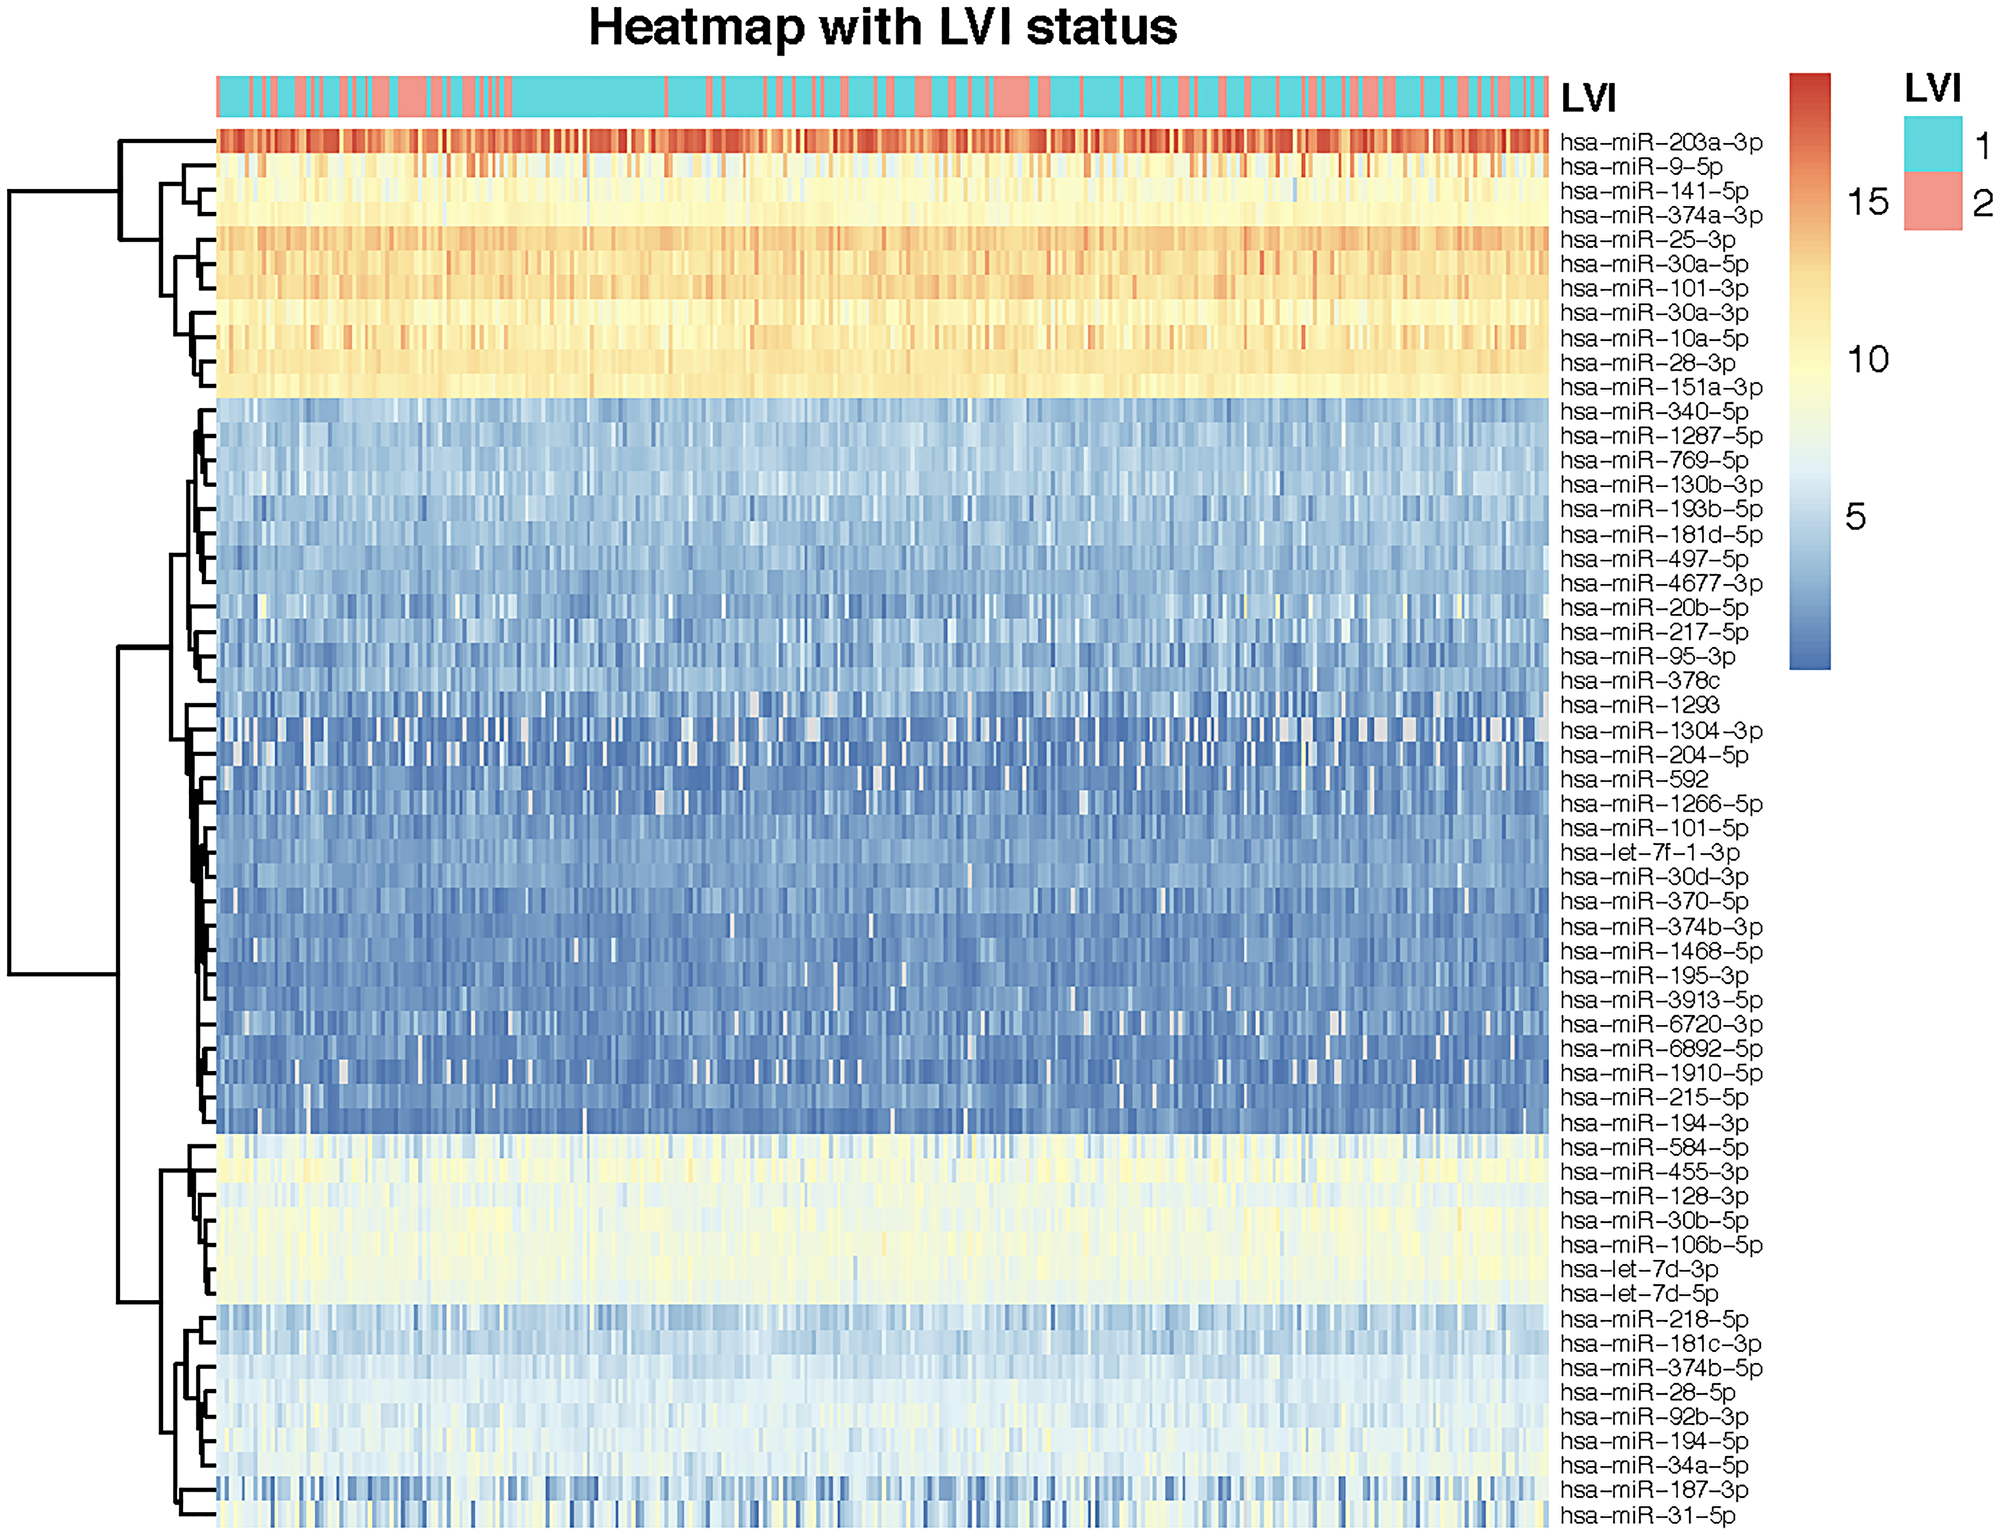
Figure 4: Heatmap of miRNA expressions for 324 patients showing unsupervised clustering of miRNAs. miRNAs are represented across rows while patients are represented across columns. The dendrogram depicting unsupervised clustering of miRNAs is shown on the left column of the heatmap. The LVI status of patients is shown on the top of the rows. Blue represents patients not having invasion while red represents patients that do report LVI.
For comparing the prediction power of each of the three supervised clusters, we fit a multiple logistic regression model for LVI on the miRNAs of each of the clusters separately. This resulted in three multiple logistic regression models and corresponding to each model we calculated the area under the ROC curve (Figure 5A–5C). Our results showed that miRNAs belonging to Cluster 1 have the highest predictive power (77%) while miRNAs in cluster 2 have the second highest predictive power (70%). It is important to note that despite a smaller size of cluster 2 compared to cluster 3, cluster 2 shows a much higher predictive performance than that of cluster 3. Further, it is important to note that the predictive power of cluster 1 is the same as the predictive power of the multiple logistic regression model where all 57 miRNAs were included as predictors (Figure 2).
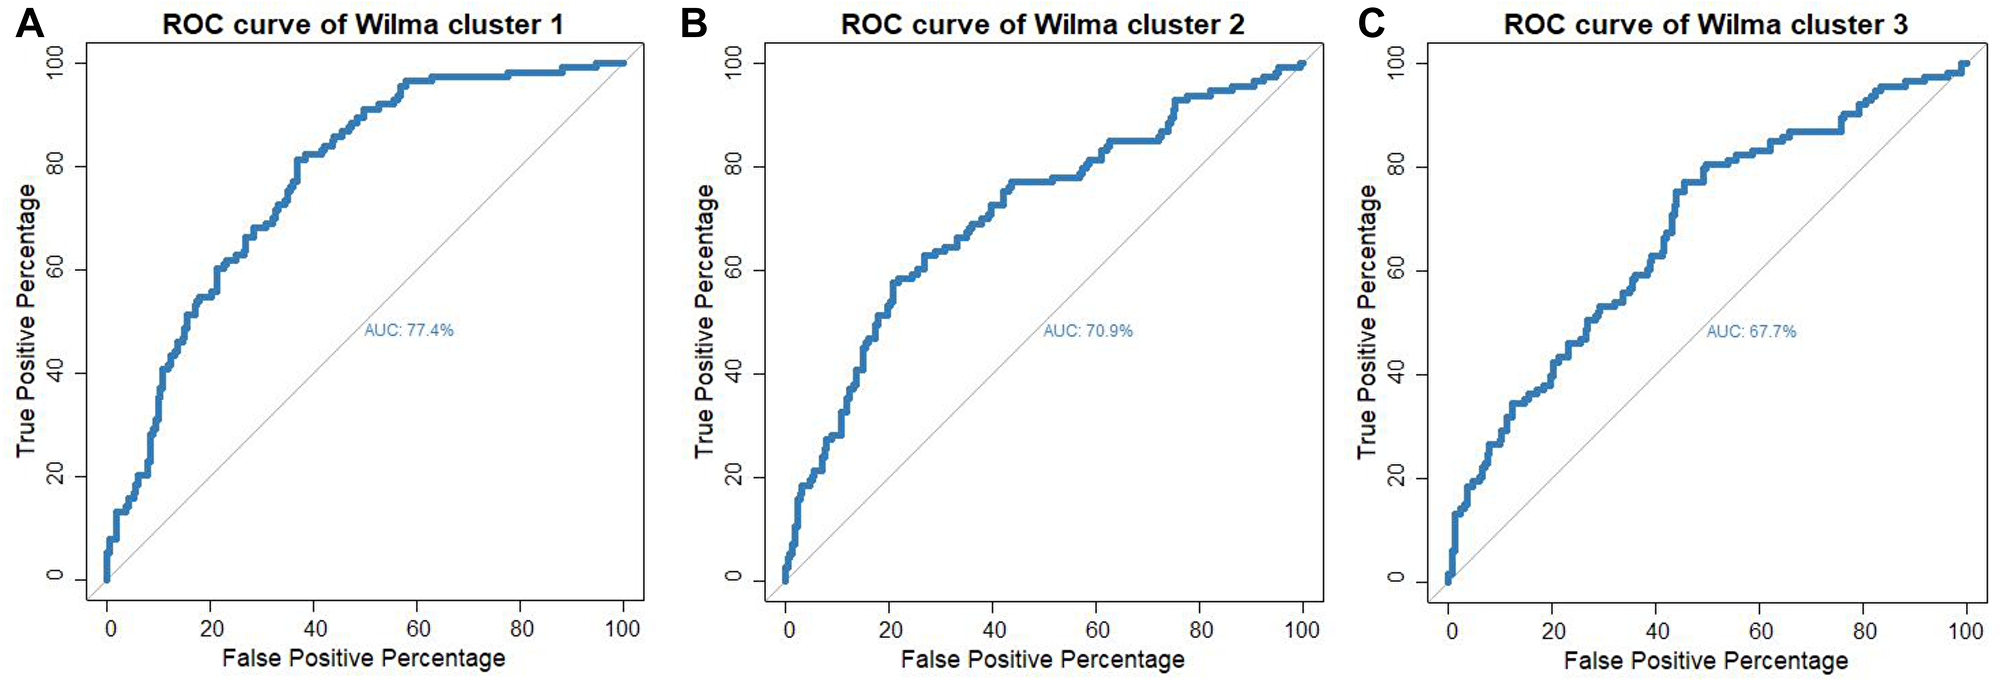
Figure 5: ROC-curve for predicting lymphovascular invasion status for the multiple logistic model with the set of miRNAs as predictors that are in (A) supervised cluster 1 (B) supervised cluster 2 and (C) supervised cluster 3.
Further, an unsupervised hierarchical clustering of the 57 miRNAs were also represented as a heatmap along with the LVI status (Yes or No) (Figure 4). Both the k-means and hierarchical clustering seem to indicate that there are three major clusters (Figures 4 and 9).
Random forest analysis identifies hsa-miR-203a-3p, hsa-mir-10a-5p, hsa-miR-194-5p to be strongly associated with LVI
Further, to determine the most important miRNAs out of these 35 miRNAs that are identified by the Wilma cluster, we performed a random forest (RF) analysis as described earlier [22]. In the RF analysis, we used LVI as the binary response variable and used all 35 miRNAs as potential predictors. We first randomly split the data of 324 subjects into training and test sets consisting of 80% and 20% data, respectively. This resulted in 259 and 65 subjects in the training and test data. Then RF analysis was applied on the training data, and the resulting output contains the importance table of the miRNAs. The Mean Decrease Accuracy for a predictor measures how much the average prediction accuracy is decreased if the predictor is dropped from the model. Obviously, the predictor with a higher value of mean decrease of accuracy is more important than a lower value in terms of prediction performance. The mean decrease in Gini coefficient is another measure to rank predictors based on their prediction power. A predictor with a higher value of the Mean Decrease Gini represents a higher prediction power, consequently, a predictor with the least mean decrease of Gini possesses the lowest prediction power [23]. The miRNA that appears in the first row of the importance table has the highest importance in prediction of LVI. Similarly, the miRNA appearing in the second row of the table is the second most important in the prediction (Table 3). This importance table revealed that hsa-miR-203a-3p, hsa-miR-30a-3p, hsa-miR-10a-5p, hsa-miR-28-5p, hsa-miR-1266-5p, hsa-miR-187-3p, hsa-miR-584-5p, hsa-miR-194-5p, hsa-miR-30a-5p and hsa-miR-3913-5p are the 10 most important miRNAs. However, due to the random selection of the training set, the output results are altered between individual runs. Hence, to ensure robustness of our data, we have re-analyzed our data five times using the RF method. We record the top 10 important miRNAs from each of the analysis, and found that three miRNAs, hsa-miR-203a-3p, hsa-mir-10a-5p, hsa-miR-194-5p, appear consistently among the 10 most important miRNAs in all 5 analyses. Interestingly all of these 3 miRNAs belong to Wilma cluster 1 as shown in Figure 3.
Table 3: Random forest analysis importance Table 5
| miRNA name | X0 | X1 | MeanDecrease Accuracy | MeanDecrease Gini |
|---|---|---|---|---|
| hsa-miR-203a-3p | 13.26 | 14.30 | 18.93 | 7.94 |
| hsa-miR-30a-3p | 11.88 | 5.30 | 12.16 | 5.35 |
| hsa-miR-10a-5p | 7.10 | 5.04 | 8.76 | 4.48 |
| hsa-miR-28-5p | 5.40 | 6.08 | 8.15 | 4.40 |
| hsa-miR-1266-5p | 7.43 | 2.86 | 7.49 | 3.56 |
| hsa-miR-187-3p | 2.49 | 5.88 | 5.81 | 3.96 |
| hsa-miR-584-5p | 8.15 | –1.93 | 5.42 | 3.19 |
| hsa-miR-194-5p | 7.24 | –0.59 | 5.40 | 3.83 |
| hsa-miR-30a-5p | 4.03 | 3.28 | 5.26 | 3.60 |
| hsa-miR-3913-5p | 4.91 | 2.08 | 5.24 | 3.71 |
| hsa-miR-1293 | 5.59 | 1.09 | 5.20 | 3.11 |
| hsa-miR-370-5p | 1.01 | 6.16 | 4.78 | 3.64 |
| hsa-miR-101-3p | 0.91 | 6.09 | 4.77 | 3.91 |
| hsa-let-7d-5p | 3.57 | 2.96 | 4.47 | 3.71 |
| hsa-miR-95-3p | 3.63 | 2.34 | 4.08 | 3.28 |
| hsa-miR-181c-3p | 5.39 | –0.67 | 4.07 | 3.15 |
| hsa-miR-455-3p | 3.67 | 1.44 | 3.74 | 3.40 |
| hsa-miR-34a-5p | 3.26 | 1.46 | 3.21 | 2.73 |
| hsa-miR-9-5p | 2.13 | 2.34 | 2.97 | 3.08 |
| hsa-miR-378c | 2.89 | 0.39 | 2.61 | 3.46 |
| hsa-miR-128-3p | 0.67 | 2.64 | 2.19 | 3.24 |
| hsa-miR-30d-3p | 2.31 | 0.59 | 2.17 | 3.11 |
| hsa-miR-1910-5p | 2.78 | –0.44 | 1.86 | 2.61 |
| hsa-miR-141-5p | 5.52 | –4.55 | 1.63 | 2.95 |
| hsa-miR-374a-3p | 3.17 | –1.81 | 1.56 | 2.66 |
| hsa-miR-151a-3p | 0.53 | 1.28 | 1.14 | 2.47 |
| hsa-miR-204-5p | 0.49 | 0.55 | 0.80 | 2.28 |
| hsa-miR-92b-3p | 0.59 | 0.01 | 0.59 | 3.03 |
| hsa-miR-6720-3p | 0.37 | 0.27 | 0.54 | 2.63 |
| hsa-miR-106b-5p | 1.46 | –1.42 | 0.44 | 2.40 |
| hsa-miR-181d-5p | 0.14 | –0.63 | –0.20 | 2.51 |
| hsa-miR-6892-5p | –0.15 | –0.47 | –0.31 | 2.36 |
| hsa-miR-194-3p | 0.35 | –1.73 | –0.75 | 2.35 |
| hsa-let-7f-1-3p | –1.95 | –0.40 | –1.89 | 2.45 |
| hsa-miR-1304-3p | –2.85 | –0.91 | –2.84 | 2.37 |
Besides the association between the miRNAs and LVI, we also wanted to figure out the dependence among the miRNAs. For that we calculated partial correlation among the 35 miRNAs selected by the supervised clustering method. The partial correlation between two generic miRNAs, x and y, signifies the correlation between the two after eliminating out the effect of the rest 33 miRNAs. Thus, high partial correlations can be indicators of a possible causal link. It is important to note that partial correlation provides better evidence for regulatory genetic links than the pairwise correlation [24]. Based on the partial correlation matrix we found that hsa-miR-194-5p and hsa-miR-194-3p, hsa-miR-181c-3p and hsa-miR-181d-5p, and hsa-miR-30a-5p are hsa-miR-30a-3p are very highly dependent with the partial correlation of 0.69, 0.72, and 0.88 respectively.
miRNAs showing increased association with LVI also show increased correlation with lymphangiogenic genes
Since miRNAs directly regulate gene expressions by inhibiting the expression of specific mRNAs, in the next step we wanted to examine if there was any correlation between the 57 shortlisted miRNAs and some of the genes that play an important role in new lymphatic vessel formation or lymphangiogenesis [25] that could be predictive of LVI. To achieve the above-mentioned goal an association study was performed between the selected 57 miRNAs and the following six lymphangiogenic genes, Ephrin B2 (EFNB2), Fibroblast Growth Factor 2 (FGF2), Lymphatic Vessel Endothelial Hyaluronan Receptor 1 (LYVE1), notch receptor 1 (NOTCH1), Neuropilin-2 (NRP2), and Prospero Homeobox 1 (PROX1). To determine the above-mentioned association, we considered each gene and regressed its standardized expression on the 57 miRNAs using the multiple linear regression method. As shown in Figure 6, the top-left plot shows the estimated regression coefficients for the statistically significant miRNAs for EFNB2. Similarly, the other plots of this figure correspond to the genes FGF2, LYVE1, NOTCH1, NRP2, and PROX1 respectively. From this analysis it emerged that hsa-miR-203a-3p has a negative effect on the gene expression values of FGF2 and NRP2. Also, hsa-miR-204-5p has a positive effect on the gene expression values of FGF2 and PROX1. Both hsa-miR-141-5p and hsa-miR-34a-5p have a negative effect on the gene expression values of LYVE1 and PROX1.
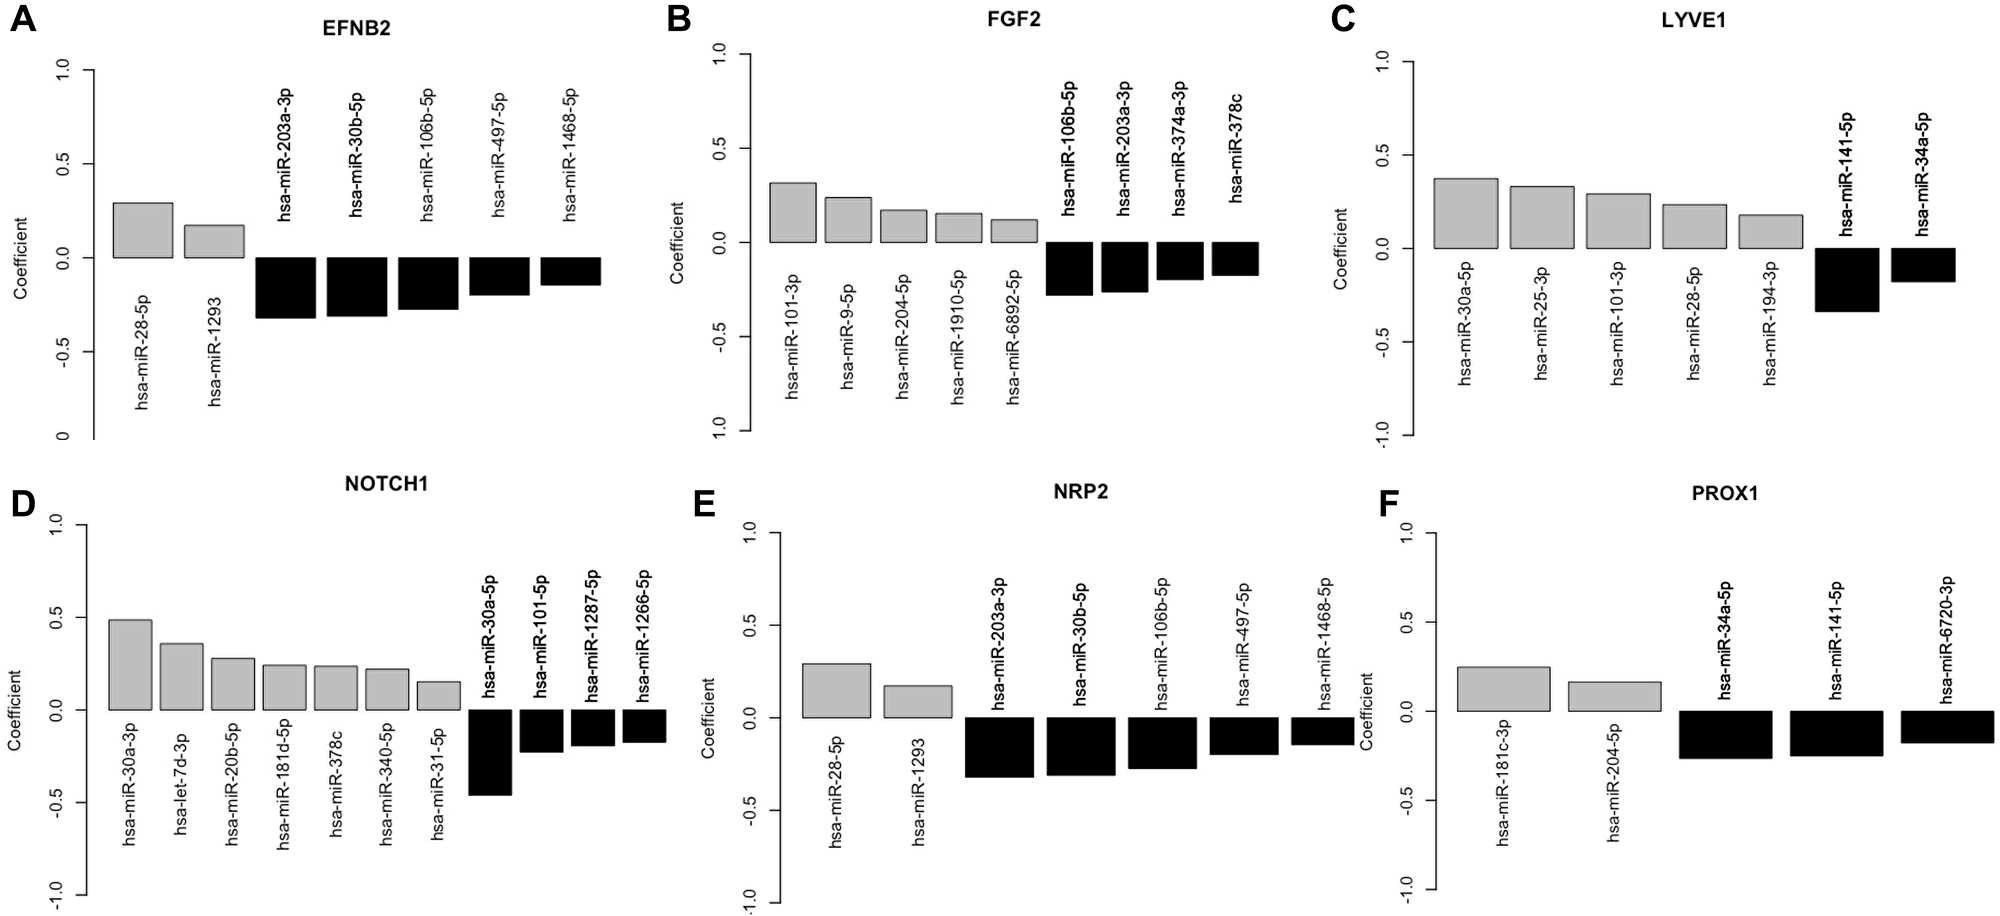
Figure 6: Plot of the regression coefficient of statistically significant miRNAs in the linear regression of the lymphangiogenic genes. The height of the bars represents the estimated regression parameter. Six lymphangiogenic genes EFNB2, FGF2, LYVE1, NOTCH1, NRP2, and PROX1 were considered and regressed its standardized expression on the 57 miRNAs using the multiple linear regression method. (A) The top-left plot shows the estimated regression coefficients for the statistically significant miRNAs for EFNB2. Similarly, the other plots of this figure correspond to the genes (B) FGF2, (C) LYVE1, (D) NOTCH1, (E) NRP2, and (F) PROX1 respectively. Black bars depict a negative association while the grey bars depict a positive association of individual miRNA with the gene.
Pathway analysis and target prediction identified several cellular pathways associated with tumor progression and lymph node metastasis
The miRNAs in cluster 1 show highest association with LVI and are likely to regulate multiple genes and cellular pathways. Hence pathway analysis was carried out for the miRNAs in Wilma cluster 1 that showed highest association with LVI using the DIANA tools mirPath V3 [26]. The miRNAs that showed a positive correlation with LVI were found to be involved in TGF-β signalling pathway, ECM-receptor interaction, cyclic AMP (cAMP) signaling pathway among the top regulated pathways and the 6 miRNA that has a negative association with LVI in cluster 1 were found to be involved in fatty acid biosynthesis and metabolism, viral carcinogenesis as shown in Supplementary Table 1. Pathway analysis of the two miRNAs hsa-mir-10a-5p, hsa-miR-194-5p that was consistently shown by random forest to be significantly associated with LVI and also identified as positively regulated with LVI in Wilma cluster 1 were found to be involved in regulation of several important cancer associated pathways such as Hippo signaling, adherens junction, fatty acid metabolism, circadian rhythm, TGF-β and p53 signaling pathways (Table 4). Gene target analysis for miR 203a-3p, mir-10a-5p, miR-194-5p was also carried out using the target prediction databases, miRTarBase (https://bio.tools/mirtarbase), and miRDB (http://www.mirdb.org/) [27] and the top 15 target genes for each miRNA showed that the genes are involved in multiple cellular mechanisms (Supplementary Table 2). Further, overlapping interactions of these three miRNAs with multiple genes was also analyzed using miRNet 2.0 (https://www.mirnet.ca) [28] and the total interactive gene regulatory network is shown in Figure 7A. The shortest path network filter was applied to visualize the minimum critical interaction network for these miRNAs and their target genes (Figure 7B).
Table 4: Cellular pathways regulated by miR-194-5p and miR-10a-3p
| KEGG pathway (Tarbase) | p-value | #genes | #miRNAs |
|---|---|---|---|
| Fatty acid biosynthesis | 1.73E-23 | 1 | 1 |
| Ubiquitin mediated proteolysis | 1.26E-06 | 25 | 2 |
| Hippo signaling pathway | 6.29E-05 | 18 | 2 |
| Adherens junction | 7.94E-05 | 13 | 2 |
| Fatty acid metabolism | 0.001 | 2 | 2 |
| Circadian rhythm | 0.003 | 9 | 2 |
| Endocytosis | 0.009 | 24 | 2 |
| Steroid biosynthesis | 0.010 | 2 | 2 |
| TGF-beta signaling pathway | 0.035 | 13 | 2 |
| p53 signaling pathway | 0.036 | 11 | 2 |
| Bacterial invasion of epithelial cells | 0.036 | 9 | 2 |
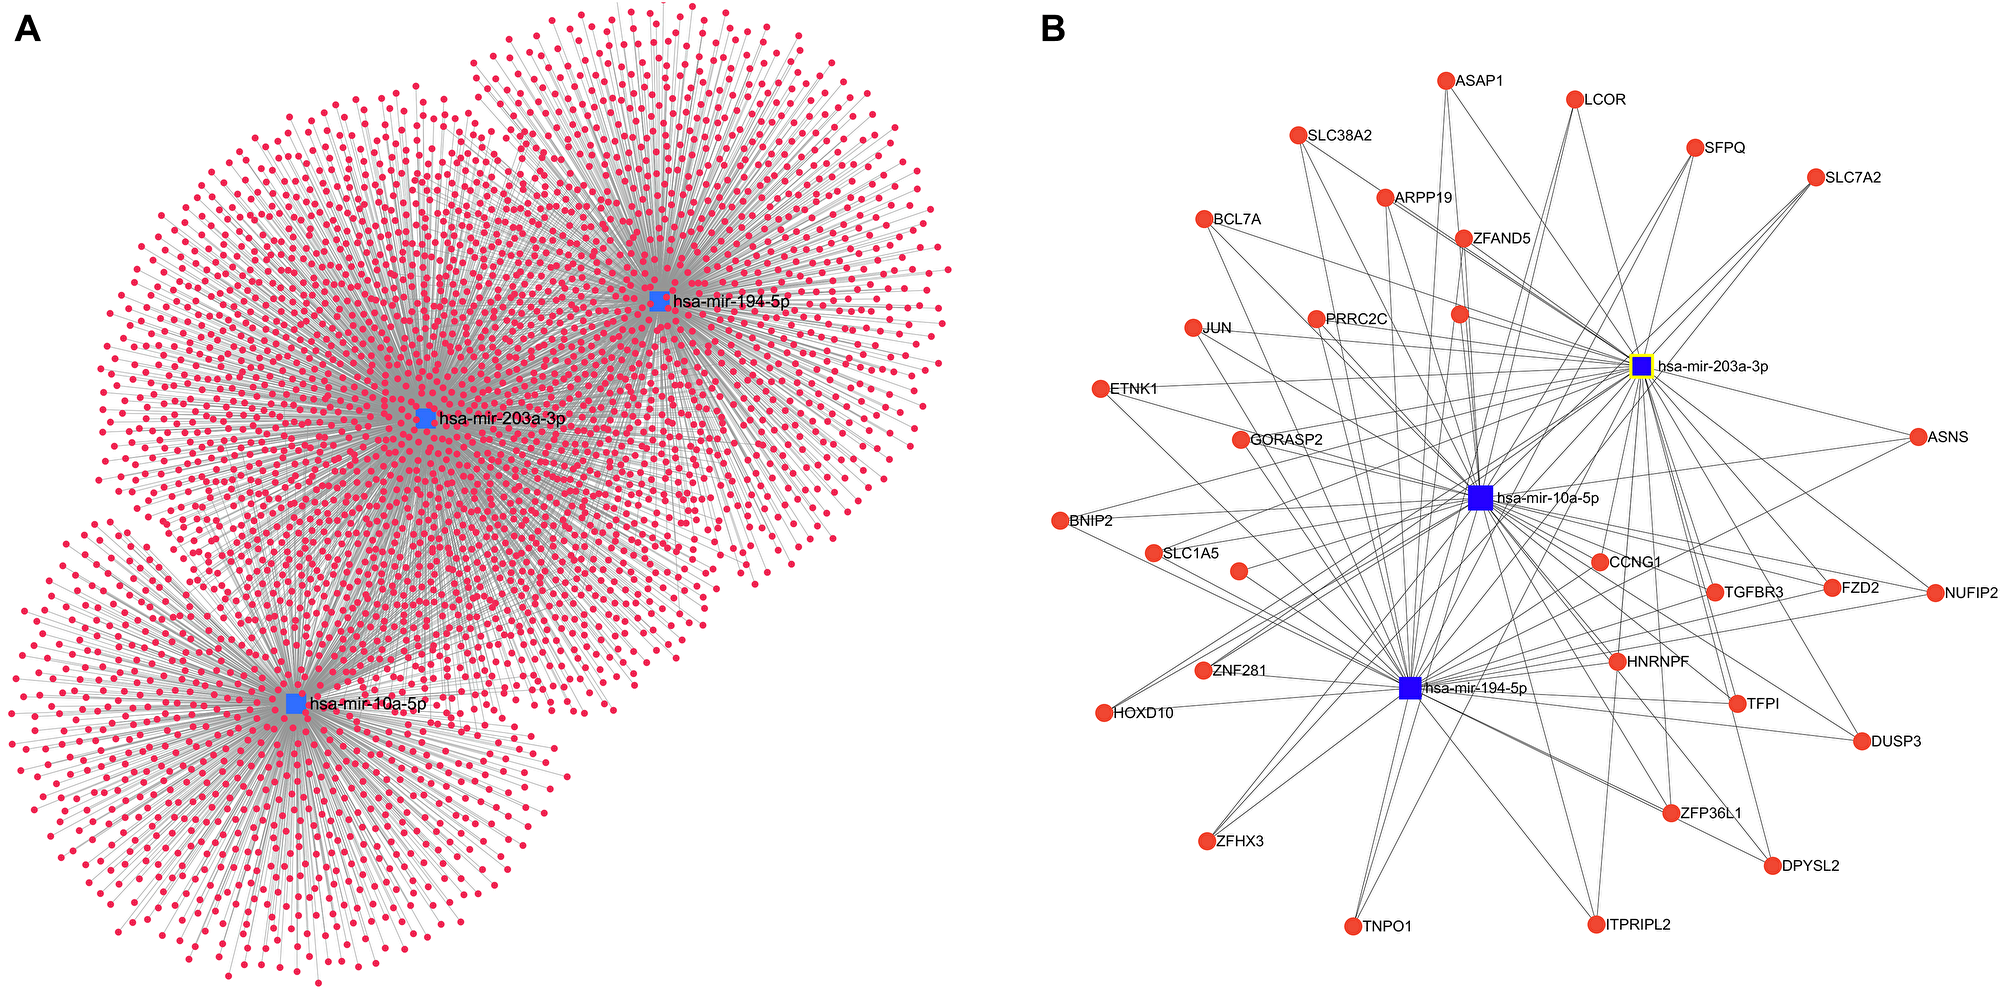
Figure 7: miRNAs and associated interaction with target genes. Network of regulatory genes interacting with miR-194, miR-203a and miR 10a-5p were constructed using miRNET. (A) Target genes (3420) interacting with these miRNAs are depicted. (B) The minimum gene regulatory network interacting with these three miRNAs are shown. The nodes highlighted in blue represent the miRNAs and the genes are represented by red circles.
DISCUSSION
LVI has been established as an important indicator of disease outcome and treatment modalities in several cancers [8, 29]. In HNSC, LVI is a well-known clinic-pathological feature that tends to adversely influence disease prognosis and negatively affect patient survival and is the primary indicator of lymph node metastasis [11, 13]. Increased lymphangiogenesis is closely related with enhanced LVI and subsequent distant dissemination [10]. Recently, miRNA expression signatures related to prognosis have been found in a number of malignancies [30]. Several miRNAs have been associated with onset, progression and metastasis of HNSC [19, 31]. However, only few studies have evaluated the prognostic significance of dysregulated miRNA expression with increased LNM [32–34]. To the best of our knowledge this is the first study associating the miRNAs that show high correlation with LVI to also be associated with key lymphangiogenic genes. Previous characterization of molecular features in HNSC particularly with the aid of large-scale cancer genomics initiatives such as The Cancer Genome Atlas (TCGA) [14, 35] have generated important insights for stratifying HNSCs and delineating tumor subtypes. However, these studies have typically overlooked association with lymph node or LVI.
It is important to note that metastasis is a complex process involving alterations in several cellular signaling pathways, dysregulation of multiple genes and involves a number of sequential steps not all of which are clearly defined. LVI is an important indicator of metastatic progression and in this study, our primary goal was to delineate the association between miRNA expression and LVI status and identify whether these important miRNAs grouped together in functional clusters that were associated with LVI. The supervised clustering technique is a novel way to achieve both goals. This method allows identification of groups of miRNAs that associate with LVI and likely regulate similar pathways thereby defining biologically relevant pathways that could be targeted to suppress LVI and thereby metastasis.
In our analysis, the preprocessing step obtained by discarding lowly expressed miRNAs followed by step two pruning using the univariate logistic regression to reduce the noise as well as increase the power of detecting significant association. Thus, we obtain the probability of the presence of LVI for a new HNSC cancer patient based on the expression level of their preselected miRNA. Further downstream analysis involved supervised clustering to group miRNAs based on how the miRNAs are affecting the LVI status. The clustering function wilma makes use of the Wilcoxon sign-rank test statistic, adjusted by a well-defined margin function [36]. It is critical to note that Wilma does supervised clustering and clusters only those features that are important with respect to the response, LVI [36]. The unsupervised clustering approach used in this study provided an indication of the optimal number of clusters which was then used in the supervised clustering method that clustered miRNAs incorporating their link with the LVI status. Therefore, our discussion is concentrated on the supervised clusters (Wilma clusters 1, 2, and 3), and the miRNAs within these clusters. Wilma cluster 1 showed the highest predictive power and association with LVI status. The robustness and predictive power of our analyses is revealed by the fact that in addition to the three miRNAs showing the highest correlation with LVI in HNSCC, several of the seventeen miRNAs identified in cluster 1 of the Wilma clustering have been previously associated with HNSCC [37]. For example, miR-30a has been associated as a tumor suppressor in HNSCC [38], high let-7d influences HNSCC growth [39], miR-3913 and miR-6892 have been associated with immune signature and candidate prognostic marker in HNSCC [40], miR-181d is shown to be predictive of risk in HNSCC [41], miR-141 suppresses growth and metastatic potential [42]; miR-370 has been shown to regulate insulin sensitivity and modulate tumor growth [43], miR-378 [44], miR-1910 and miR-187 are shown to be induced in HNSCC [10, 45]. However, we also noted that three of the miRNAs, miR-6720, miR-584, and miR-1304-3p have not been shown to be associated with HNSCC as a prognostic indicator. This is an interesting finding as it also underscores the power of these predictive models to identify novel miRNAs that are associated with LVI in HNSCC.
Hence, for the purpose of analyzing the cellular pathways affected we focused on that cluster. According to the functional pathway analysis of the miRNAs in Wilma cluster 1, we found that the target genes of these miRNAs that were positively associated with LVI were associated with several important tumor enhancing processes, including TGF-β signaling pathway and ECM-receptor interaction mechanisms. This is significant as the TGF-β signaling pathway plays an important role in tumor metastasis and is involved in mediating early lymph node metastasis in multiple cancers [46, 47]. TGF-β exerts a complex dual regulation of the lymphangiogenic processes [48]. Tumor cells, can promote tumor lymphangiogenesis and lymph node metastasis by activating mechanisms through TGF-β to increase the expression of lymphangiogenic molecules as Vascular Endothelial Growth Factor C (VEGF-C) [49] while direct effects of TGF-β on lymphangiogenesis is inhibitory [49]. Alteration in the extracellular matrix components significantly modulate the tumor microenvironment and contributes to metastasis and has been associated with increased LVI in several other cancers [50, 51]. Our heatmap also pointed to 3 main clusters of the miRNAs.
Using RF approach, we identified several miRNAs that strongly correlated to LVI. Interestingly, almost all of the miRNAs that were identified by our random forest analysis to be significantly associated with LVI have also been independently identified in a number of studies in HNSC giving further credibility to our RF model. We focus our discussion here on the three miRNA (miR-203a-3p, hsa-miR-194-5p, miR-10a-5p,) that were consistently identified by the multiple iterations of RF analysis and also belong to Wilma cluster 1 that shows highest predictive association with LVI. These miRNAs were chosen based on the fact that they were validated as the highest predictors across multiple analyses. We want to point out that our main three important miRNAs hsa-miR-203a-3p, hsa-mir-10a-5p, hsa-miR-194-5p fell in two different clusters based on the heatmap- hsa-mir-203-3p and hsa-mir-10a-5p in one cluster and hsa-mir-194-5p in other. This is not a surprise as the heatmap (for hierarchical clustering) did unsupervised clustering whereas Wilma provided supervised clustering. Secondly, the heatmap was based on the unscaled expression values whereas the k-means clustering and the Wilma clustering were applied on the scaled expression values. Our analysis showed that miR-203a-3p was negatively associated with LVI. This fits well with other studies where miR-203a-3p has been reported as a tumor suppressor and dysregulated in many malignancies including nasopharyngeal carcinoma [52], gastric cancer [53] and bladder cancer [54]. miR-203 has also been shown to be downregulated in animal models of oral cancer-a subtype of HNSCC [37]. However, it also functions as an oncomiR in breast cancer [55] and hepatocellular cancers [56] depending on the genes targeted. Significantly, miR-203a-3p suppresses expression of SOCS3 that has been shown to be closely associated with lymph node metastasis in breast cancers [57]. One of the predicted targets of miR-203a in our analysis was Semaphorin 5a that is associated with lymph node metastasis and adverse prognosis [58]. Integrative Analysis of miRNAs in HNSCC has previously identified miR-194 to be associated with the epithelial sub-type of HNSCC [59]. However, to the best of our knowledge no study has shown the role of miR-203, miR-194 and miR-10a as a prognostic indicator of LVI in HNSCC. miR-194 has been proved as a tumor promoting factor in various cancers and regulates the EMT mechanisms promoting cancer growth [60]. It has been reported to be significantly elevated in lymph node metastatic tissues from colorectal cancer patients [60]. miR-10a-5p has been reported to be overexpressed and to act as an important mediator of metastasis formation in PDAC [61]. Aberrant expression of miR-10a has been reported in head and neck cancers [62] and increased expression of miR-10a-5p has been shown to be associated with clinicopathological characteristics such as age and gender in laryngeal cancer [63]. In gastric cancer, miR-10a has been shown to have an important role in the metastasis from primary GC to lymph nodes [64]. Also, one of the top 20 miRNAs that showed strong correlation with survival as well as showed a significant positive correlation with LVI was miR-9 that we have previously demonstrated to be an important regulator of lymphangiogenesis and lymphatic tube formation, which is the first step to promote tumor spread through lymphatics [65]. Further, overexpression of miR-9 has been associated with poor prognosis in several cancers [66] and it has also been associated with increased lymph node metastasis in breast cancers [67]. KEGG pathway analysis of miR-194 and miR-10 which are positively corelated with LVI, revealed several pathways such as Fatty Acid synthesis, Hippo signaling, p53 pathways, TGF-β pathways and others. Aberrant production of fatty acids is associated with poor prognosis in human cancers and inhibition of this pathway has been associated with decreased LNM [68]. The Hippo signaling pathway is particularly significant as it is involved in control of tumorigenesis, and has recently been linked to metabolic reprogramming in metastatic lymph nodes [69–71]. Thus, regulation of these pathways could have significant impact on LVI and subsequent lymph node metastasis and patient outcome. In one study, weighted gene co-expression network analysis was used to construct gene co-expression networks and investigate the relationship between key modules and the LVI clinical phenotype and identified 24 genes in the metabolic and immune reprogramming [13]. This is interesting all the miRNAs (miR-194, miR-10a and miR 203a) that show significant association with LVI in our study also regulate metabolic pathways and alteration of immune cell response that are known to remodel the metastatic lymph node [72–74].
Tumor cells express high amounts of angiogenic molecules (that promote growth of new blood vessels) or lymphangiogenic molecules (that promote growth of new lymphatic vessels) that are critical for metastasis [75]. However, existing work in this area often does not take into account the dynamics of these interactions between miRNAs and regulators of angiogenic or lymphangiogenic pathways that promote lymph node invasion and hence makes therapeutic targeting of metastatic cancers a critical challenge. Our miRNA correlation data with lymphangiogenic genes corroborates with other independent studies with miRNA target validation in literature. FGF2 has been validated as a direct target of miR-203. It has been shown that miR 203 inhibits renal cancer cell proliferation, migration and invasion by targeting of FGF2 [76]. Although studies have not directly established LYVE1 as a target for either miR-141 or miR-34a, increased LYVE1 expression has been shown to be associated with increased rate of LNM in oral cancer [77]. Hence therapeutic targeting of LYVE 1 may suppress LNM in oral and HNSC. Both miR-141 and miR-34 are actively involved in regulation of epithelial-mesenchymal transition (EMT) mechanisms and recent studies suggest that LYVE and PROX1 are also involved in EMT that promotes LNM [78]. The association of miR-141 with both LYVE1 and PROX1 could potentially be a novel axis unraveled by our analysis that could provide new mechanistic links in EMT pathways in LNM progression. However, further studies are warranted. Our data shows that specific miRNAs (i.e., miR-141, miR-34a) show a negative association with two key lymphangiogenic genes PROX1 and LYVE. On the other hand, some specific miRNAs show positive association with LYVE1 (miR-30a, miR-25, miR-101) vs PROX1 (miR-181, miR-204). These are critical findings as it suggests that these miRNAs suppress expression of genes that maybe novel regulators that could positively or negatively regulate these lymphangiogenic genes in a context dependent manner. Interestingly, miR-203 expression was negatively associated with three of the six lymphangiogenic genes studied (EFNB2, NRP2 and FGF) suggesting that downregulation of miR-203 potentiates lymphangiogenic mechanisms. Further, our data showed that miR-204-5p is positively co-related with FGF-2 and PROX1. It has been shown that miR-204-5p promotes tumor angiogenesis through regulation of thrombospondin 1 [79] and similar mechanisms could be at play in the regulation of lymphangiogenesis. Further analysis is warranted to identify some of these mechanisms and could lead to some novel new targets.
In conclusion, our results showed that specific miRNA clusters significantly associate with LVI. The identified miRNA clusters regulate multiple biological pathways that are involved in progression of LNM and could be potential predictors of metastatic disease. In addition, RF analysis revealed three miRNAs hsa-miR-203a-3p, hsa-mir-10a-5p, hsa-miR-194-5p to be most strongly associated with LVI and can be used as important prognostic indicators. Further, we also find that each of these miRNAs have association with significant molecular pathways as cell proliferation, metabolism and lymphangiogenesis that further promotes tumor progression. In addition, all of the identified miRNAs are associated with metabolic pathways as well as immune cell responses that define alterations in a metastatic lymph node so it also potentiates development of specific targeted interventions to these pathways that may distinguish a metastatic from a naïve lymph node. Different miRNAs regulate different aspects of metastatic progression and identification of specific miRNA linked with LVI, lymphangiogenesis and subsequent nodal metastasis may help in identification of patients at early stages of disease progression. Specific miRNA agonists (mimics) or antagonists (inhibitors) can be evaluated further in pre-clinical trials to evaluate their efficacy in inhibition of HNSCC progression when detected in earlier stages. Further studies are warranted to determine the functional relevance of these findings and evaluate the downstream targets in tumor models of HNSCC metastasis.
Materials and Methods
TCGA data retrieval
We used the Head and Neck squamous cell carcinoma (HNSC) cohort of the TCGA data portal. The overall steps of the workflow are depicted in Figure 8. To download and integrate the clinical and genomic data from TCGA we have used the web-based platform, University of California Santa Cruz Xena Browser (https://xenabrowser.net/). We obtained mature miRNA sequences (IlluminaHiseq) referenced with a miMAT accession number. Particularly, the sequences are level-3 data, and log2(total RPM+1), where total RPM represents the total of all isoform expressions for the same miRNA mature strand. The clinical data on subjects are also obtained through UCSC Xena, with the major focus on lymphovascular invasion status among many other phenotypic variables and in the downloaded data it was named as lymphovascular_invasion_present. This variable is referred to as LVI. Although the clinical data had information on 604 subjects, after removing subjects without any LVI information we were left with only 411 patients. Matching the miRNA sequence data with their corresponding clinical data, we obtained a total of 351 patients. The TCGA consortium contains data from five different sample types [80]. Out of these patients’ samples, we considered only the primary solid tumor tissue, and that left us with 324 patients. After the analysis, we retrieved the information of mature miRNA corresponding to the miMAT accession number using the R package miRBaseConverter available from https://www.bioconductor.org [81]. The HNSC data contains expression data of 2246 miRNAs. The variable of interest LVI is a binary variable. Value zero indicates that the tumor cell doesn’t invade through the lymphatic vessels yet while value one indicates the invasion of cancer to lymphatic vessels. Among 324 patients, 211 patients did not have LVI (LVI) while 113 patients show LVI. Table 5 summarizes clinical information including gender, age, race, LVI, clinical stages, alcohol and tobacco smoking history, and anatomical site information of the patients. Association of the demographic and clinical information with LVI was also calculated.
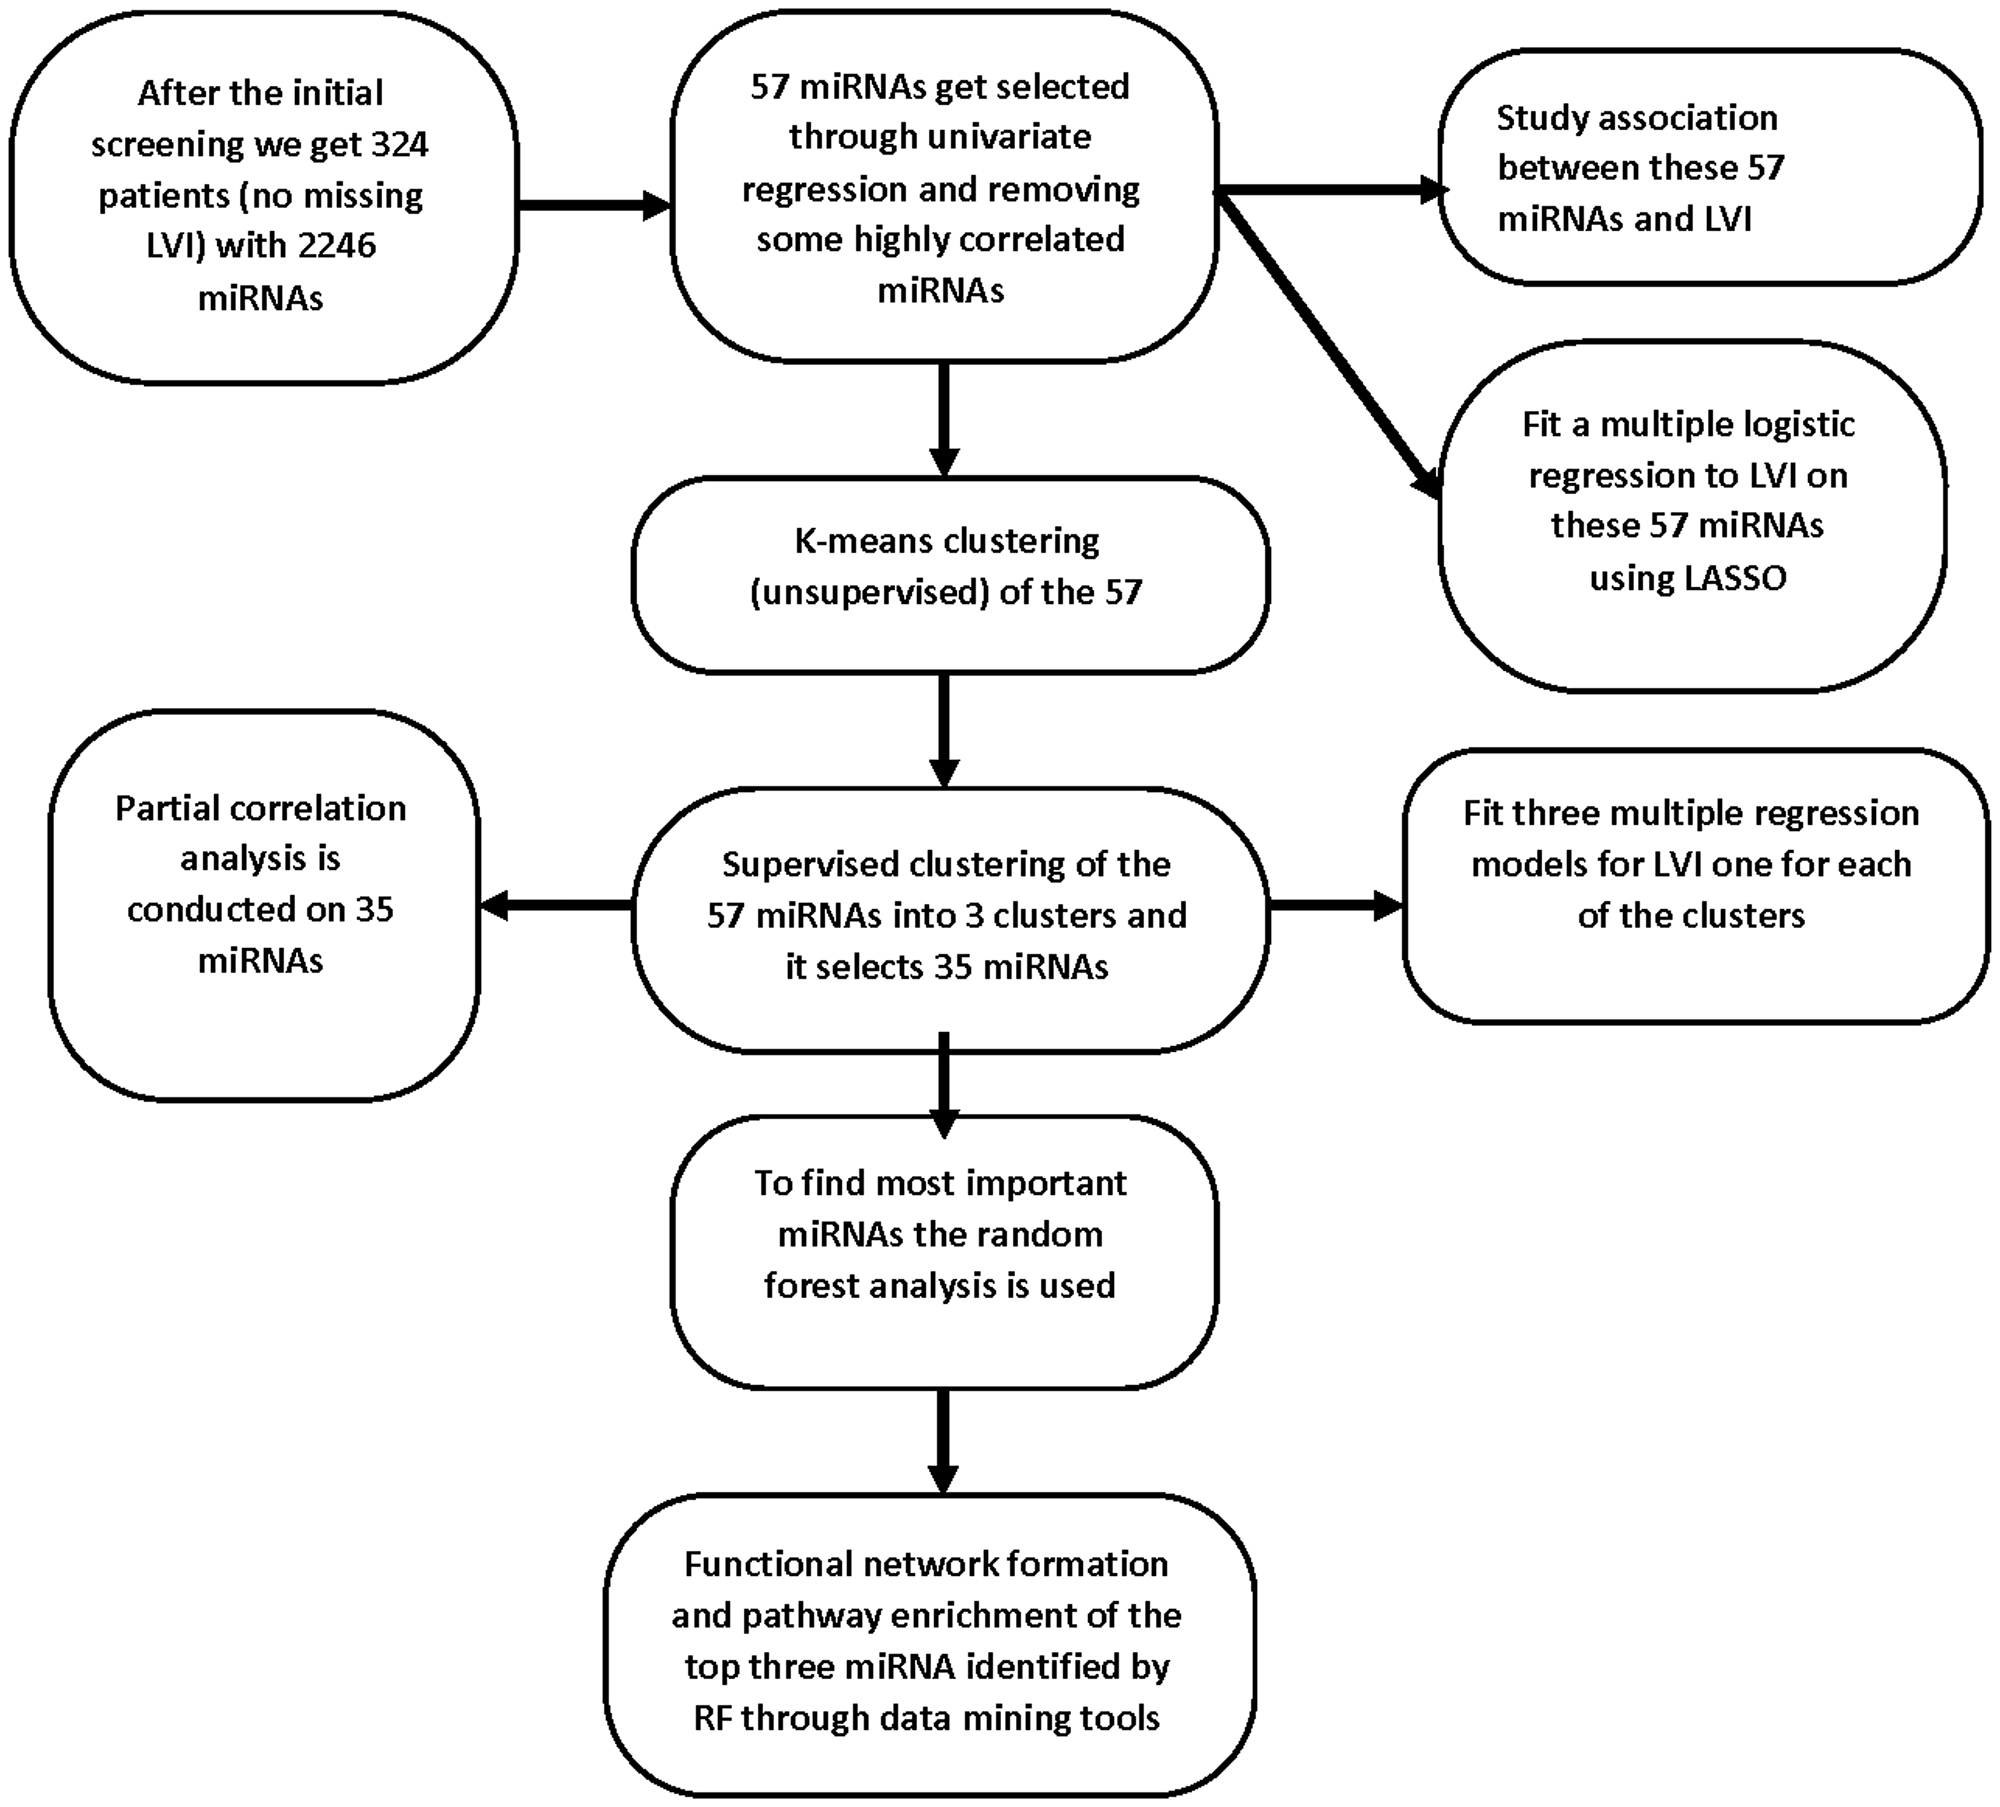
Figure 8: Flow chart showing the overall workflow describing the steps used to develop the prognostic model and identification of miRNAs that are predictive of LVI. Abbreviations: TCGA: The Cancer Genome Atlas; HNSCC: head and neck squamous cell carcinoma; OS: overall survival; ROC: receiver operating characteristic; LASSO: least absolute shrinkage and selection operator regression.
Table 5: Clinico-pathological features of HNSC patients grouped by the lymphovascular invasion status (LVI) in TCGA study cohort
| LVI- No (211) | LVI-Yes (113) | p-value | ||
|---|---|---|---|---|
| Gender | Female | 68 | 23 | 0.033 |
| Male | 143 | 90 | ||
| Age of initial diagnosis | Minimum | 24 years | 26 years | 0.061 |
| Maximum | 87 years | 87 years | ||
| Median | 61 years | 59 years | ||
| Average | 61.5 years | 59.1 years | ||
| Alcohol history documented | No | 70 | 31 | 0.304 |
| Yes | 136 | 81 | ||
| NA | 5 | 1 | ||
| Alcohol consumption per day | 0 | 34 | 15 | 0.001 |
| 1 | 10 | 11 | ||
| (1, 3) | 22 | 11 | ||
| more than 3 | 25 | 22 | ||
| NA | 120 | 54 | ||
| Tobacco smoking history indicator | 1 | 60 | 22 | 0.002 |
| 2 | 61 | 44 | ||
| 3 | 33 | 8 | ||
| 4 | 51 | 35 | ||
| 5 | 1 | 1 | ||
| NA | 5 | 3 | ||
| Clinical stage | Stage I | 12 | 4 | 0.109 |
| Stage II | 46 | 10 | ||
| Stage III | 51 | 22 | ||
| Stage IVA | 89 | 72 | ||
| Stage IVB | 4 | 1 | ||
| Stage IVC | 2 | 0 | ||
| NA | 7 | 4 | ||
| Anatomical neoplasm subdivision | Alveolar ridge | 9 | 5 | 0.119 |
| Base of tongue | 6 | 5 | ||
| Buccal mucosa | 10 | 6 | ||
| Floor of mouth | 32 | 18 | ||
| Hard palate | 4 | 0 | ||
| Hypopharynx | 3 | 1 | ||
| Larynx | 35 | 34 | ||
| Lip | 1 | 0 | ||
| Oral cavity | 29 | 10 | ||
| Oral tongue | 70 | 25 | ||
| Oropharynx | 4 | 2 | ||
| Tonsil | 8 | 7 |
Statistical analysis and preprocessing of miRNA
For the statistical analyses, R software, version 3.6.2 was used. As a first step of pre-processing the data, we only considered miRNAs whose mean value across the patients were greater than one to avoid miRNAs with very low expression. After this exclusion, 496 miRNAs fit the criteria for further association studies. Finally, we standardized each miRNA expression to have zero mean and unit variance. Standardized values of every miRNA were obtained by subtracting the mean and then dividing by the standard deviation of the respective miRNA. The primary goal of our analysis was to identify the important miRNAs based on their association with LVI, or predictive power of the LVI status using statistical methods, and investigate their biological role in this context. At the very first stage, instead of working with all available miRNAs, we performed a second level of preprocessing to preselect a subset of miRNAs that are significantly associated with the binary LVI status based on the univariate logistic regression model. Specifically, we used the glm function to run the logistic regression. Based on the 5% significance level, we screened out important miRNAs that will be used for downstream analyses. Next, we computed the pairwise correlation among the miRNAs, and removed a handful of miRNAs that are highly correlated with others. Then, to find a best predictive model we fitted a multiple logistic regression model to LVI on all the miRNAs that were selected in the previous step. Since a large number of miRNAs are included simultaneously as predictors we used the penalized estimation method, the least absolute shrinkage and selection operator (LASSO) technique [21], to select the important miRNAs for the best predictive model.
Supervised and unsupervised clustering of miRNA
Besides finding a good predictive model, we wanted to examine if these miRNAs would show more connection with others and show functional clusters that are indicative of increased risk for LVI. Hence, clustering of miRNAs is a novel component of our analyses. Most of the supervised techniques rely on prior knowledge on the number of clusters [82]. Therefore, we first implement unsupervised K-means clustering with the gap statistic (using the clusGap function) to determine the optimal number of clusters. K-means uses a distance measurement to calculate the similarity between miRNAs. The gap statistic compares the total within-cluster variation for different values of k with their expected values under a null reference distribution of the data. The reference dataset is generated using Monte Carlo simulations of the sampling process. Figure 9 shows the gap statistic corresponding to different values of the number of clusters. Next, we used the Wilma function of the supclust package of R [83] to do supervised clustering using the miRNAs that were selected based on the 5% significance level of the univariate logistic regression and after eliminating the miRNAs that were highly correlated with others. The clustering function Wilma makes use of the Wilcoxon sign-rank test statistic, adjusted by a well-defined margin function to implement the above-mentioned algorithm [36]. The optimal number of clusters of the unsupervised method was used in the Wilma function. We used Bioconductor package supclust to perform supervised clustering [36]. The mentioned package needs a user-specified cluster number that was three in our case as indicated by K-means clustering with the Gap statistic as shown in Figure 9. The supervised algorithm tries to find miRNAs clusters, so that the average expression profile of each cluster has a great potential for explaining the LVI status. At the initial step, the algorithm starts out with the best single miRNAs in explaining invasion status and then adds one after another to the existing cluster. We then compared the predictive power of each of the Wilma clusters of miRNAs through the multiple logistic regression analysis and the ROC curve. Following the request of a reviewer, a hierarchical clustering of the non-standardized log2 transformed miRNAs expression in correlation to LVI status was created. For this we used the pheatmap function of R Package Version 1.0.12. (https://CRAN.R-project.org/package=pheatmap) [84].
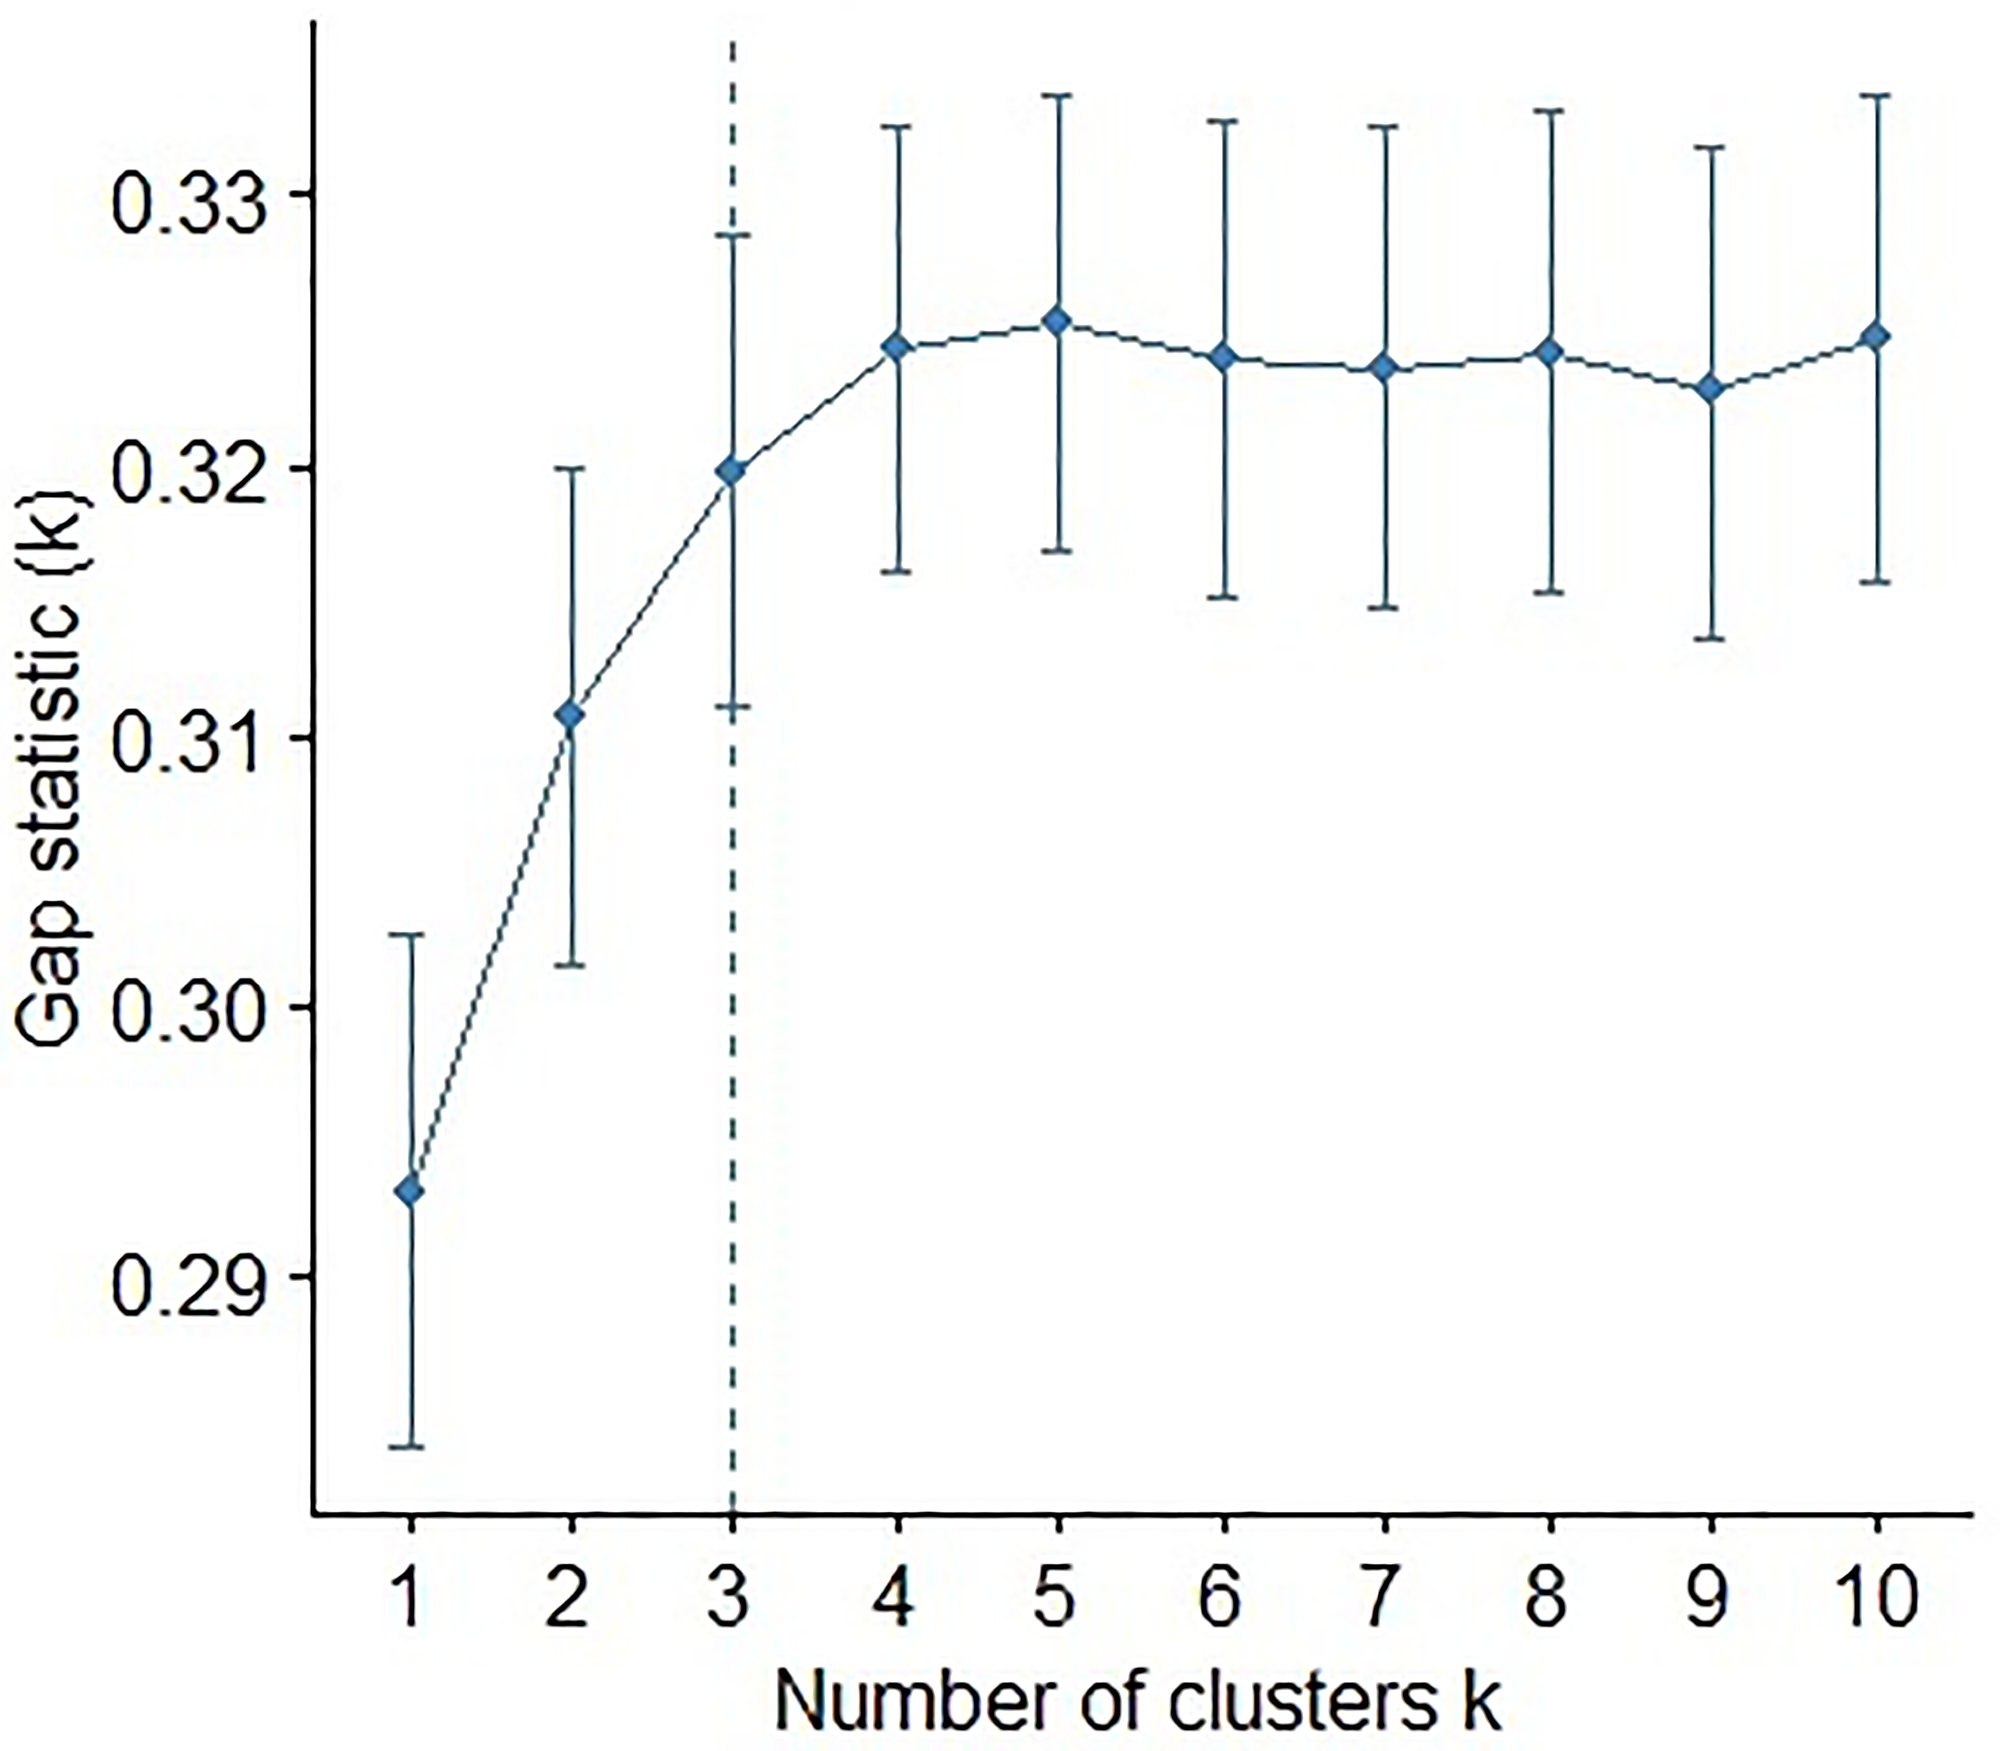
Figure 9: Plot of the gap statistic against the number of clusters in an unsupervised k-means clustering of the miRNAs. Bars at every point represent the +/– 1 standard error of the gap statistic.
Random forest analysis
To determine the most important miRNAs from the set of miRNAs identified by the Wilma cluster, we performed a random forest (RF) analysis [22]. To identify which of the miRNAs have prognostic value, in the RF analysis, we used LVI as the binary response and implemented a machine learning strategy. RF orders miRNAs according to their importance in predicting the LVI status based on a decision-tree based approach. For a RF analysis of a dataset, first the observations of the dataset are randomly divided into two parts, such as 80% and 20%. The larger portion is then used as a training dataset and the smaller set is used as a test dataset. The training data are used to tune the decision tree-based algorithm. The test data are used for checking the predictive capability of the algorithm. The RF and the multiple logistic regression based on the Least absolute shrinkage and selection operator (LASSO) penalty are analogous approaches as both are used for identifying predictive miRNAs, but one is model based and the other is model-free approach.
Abbreviations
HNSC: Head and neck cancers; miRNAs: microRNAs; TCGA: The Cancer Genome Atlas; LVI: Lymphovascular Invasion; Lasso: Least absolute shrinkage and selection operator; RF: Random forest; EFNB2: Ephrin B2; FGF2: Fibroblast Growth Factor 2; LYVE1: Lymphatic Vessel Endothelial Hyaluronan Receptor 1; NOTCH1: notch receptor 1; NRP2: Neuropilin-2; PROX1: Prospero Homeobox 1; cAMP: cyclic AMP; LNM: lymph node metastasis; EMT: epithelial-mesenchymal transition.
ACKNOWLEDGMENTS
We would like to thank Dr Roger Zoh, Indiana University School of Public Health for helpful discussions.
CONFLICTS OF INTEREST
Authors have no conflicts of interest to declare.
FUNDING
This work was supported by Auf-X-Grant Award from Texas A&M University Health Science and Research Enhancement Grant from department of Medical Physiology to S.C.
References
1. Cho JK, Hyun SH, Choi N, Kim MJ, Padera TP, Choi JY, Jeong HS. Significance of lymph node metastasis in cancer dissemination of head and neck cancer. Transl Oncol. 2015; 8:119–25. https://doi.org/10.1016/j.tranon.2015.03.001. [PubMed].
2. Ferlay J, Shin HR, Bray F, Forman D, Mathers C, Parkin DM. Estimates of worldwide burden of cancer in 2008: GLOBOCAN 2008. Int J Cancer. 2010; 127:2893–917. https://doi.org/10.1002/ijc.25516. [PubMed].
3. Cramer JD, Burtness B, Le QT, Ferris RL. The changing therapeutic landscape of head and neck cancer. Nat Rev Clin Oncol. 2019; 16:669–83. https://doi.org/10.1038/s41571-019-0227-z. [PubMed].
4. Beaubier N, Bontrager M, Huether R, Igartua C, Lau D, Tell R, Bobe AM, Bush S, Chang AL, Hoskinson DC, Khan AA, Kudalkar E, Leibowitz BD, et al. Integrated genomic profiling expands clinical options for patients with cancer. Nat Biotechnol. 2019; 37:1351–60. https://doi.org/10.1038/s41587-019-0259-z. [PubMed].
5. Kaidar-Person O, Gil Z, Billan S. Precision medicine in head and neck cancer. Drug Resist Updat. 2018; 40:13–16. https://doi.org/10.1016/j.drup.2018.09.001. [PubMed].
6. Worsham MJ. Identifying the risk factors for late-stage head and neck cancer. Expert Rev Anticancer Ther. 2011; 11:1321–25. https://doi.org/10.1586/era.11.135. [PubMed].
7. Shah JP, Candela FC, Poddar AK. The patterns of cervical lymph node metastases from squamous carcinoma of the oral cavity. Cancer. 1990; 66:109–13. https://doi.org/10.1002/1097-0142(19900701)66:1<109::aid-cncr2820660120>3.0.co;2-a. [PubMed].
8. Aleskandarany MA, Sonbul SN, Mukherjee A, Rakha EA. Molecular Mechanisms Underlying Lymphovascular Invasion in Invasive Breast Cancer. Pathobiology. 2015; 82:113–23. https://doi.org/10.1159/000433583. [PubMed].
9. Schoppmann SF, Bayer G, Aumayr K, Taucher S, Geleff S, Rudas M, Kubista E, Hausmaninger H, Samonigg H, Gnant M, Jakesz R, Horvat R, and Austrian Breast and Colorectal Cancer Study Group. Prognostic value of lymphangiogenesis and lymphovascular invasion in invasive breast cancer. Ann Surg. 2004; 240:306–12. https://doi.org/10.1097/01.sla.0000133355.48672.22. [PubMed].
10. Zhang S, Zhang D, Gong M, Wen L, Liao C, Zou L. High lymphatic vessel density and presence of lymphovascular invasion both predict poor prognosis in breast cancer. BMC Cancer. 2017; 17:335. https://doi.org/10.1186/s12885-017-3338-x. [PubMed].
11. Karahatay S, Thomas K, Koybasi S, Senkal CE, Elojeimy S, Liu X, Bielawski J, Day TA, Gillespie MB, Sinha D, Norris JS, Hannun YA, Ogretmen B. Clinical relevance of ceramide metabolism in the pathogenesis of human head and neck squamous cell carcinoma (HNSCC): attenuation of C(18)-ceramide in HNSCC tumors correlates with lymphovascular invasion and nodal metastasis. Cancer Lett. 2007; 256:101–11. https://doi.org/10.1016/j.canlet.2007.06.003. [PubMed].
12. Kawada K, Taketo MM. Significance and mechanism of lymph node metastasis in cancer progression. Cancer Res. 2011; 71:1214–18. https://doi.org/10.1158/0008-5472.CAN-10-3277. [PubMed].
13. Zhang J, Lin H, Jiang H, Jiang H, Xie T, Wang B, Huang X, Lin J, Xu A, Li R, Zhang J, Yuan Y. A key genomic signature associated with lymphovascular invasion in head and neck squamous cell carcinoma. BMC Cancer. 2020; 20:266. https://doi.org/10.1186/s12885-020-06728-1. [PubMed].
14. Perez Sayans M, Chamorro Petronacci CM, Lorenzo Pouso AI, Padin Iruegas E, Blanco Carrion A, Suarez Penaranda JM, Garcia Garcia A. Comprehensive Genomic Review of TCGA Head and Neck Squamous Cell Carcinomas (HNSCC). J Clin Med. 2019; 8:1896. https://doi.org/10.3390/jcm8111896. [PubMed].
15. Cieslik M, Chinnaiyan AM. Cancer transcriptome profiling at the juncture of clinical translation. Nat Rev Genet. 2018; 19:93–109. https://doi.org/10.1038/nrg.2017.96. [PubMed].
16. Hayes J, Peruzzi PP, Lawler S. MicroRNAs in cancer: biomarkers, functions and therapy. Trends Mol Med. 2014; 20:460–69. https://doi.org/10.1016/j.molmed.2014.06.005. [PubMed].
17. Childs G, Fazzari M, Kung G, Kawachi N, Brandwein-Gensler M, McLemore M, Chen Q, Burk RD, Smith RV, Prystowsky MB, Belbin TJ, Schlecht NF. Low-level expression of microRNAs let-7d and miR-205 are prognostic markers of head and neck squamous cell carcinoma. Am J Pathol. 2009; 174:736–45. https://doi.org/10.2353/ajpath.2009.080731. [PubMed].
18. Rock LD, Minatel BC, Marshall EA, Guisier F, Sage AP, Barros-Filho MC, Stewart GL, Garnis C, Lam WL. Expanding the Transcriptome of Head and Neck Squamous Cell Carcinoma Through Novel MicroRNA Discovery. Front Oncol. 2019; 9:1305. https://doi.org/10.3389/fonc.2019.01305. [PubMed].
19. Yang CX, Sedhom W, Song J, Lu SL. The Role of MicroRNAs in Recurrence and Metastasis of Head and Neck Squamous Cell Carcinoma. Cancers (Basel). 2019; 11:395. https://doi.org/10.3390/cancers11030395. [PubMed].
20. Kim J, Yao F, Xiao Z, Sun Y, Ma L. MicroRNAs and metastasis: small RNAs play big roles. Cancer Metastasis Rev. 2018; 37:5–15. https://doi.org/10.1007/s10555-017-9712-y. [PubMed].
21. Wu TT, Chen YF, Hastie T, Sobel E, Lange K. Genome-wide association analysis by lasso penalized logistic regression. Bioinformatics. 2009; 25:714–21. https://doi.org/10.1093/bioinformatics/btp041. [PubMed].
22. Chen X, Ishwaran H. Random forests for genomic data analysis. Genomics. 2012; 99:323–29. https://doi.org/10.1016/j.ygeno.2012.04.003. [PubMed].
23. Touw WG, Bayjanov JR, Overmars L, Backus L, Boekhorst J, Wels M, van Hijum SA. Data mining in the Life Sciences with Random Forest: a walk in the park or lost in the jungle? Brief Bioinform. 2013; 14:315–26. https://doi.org/10.1093/bib/bbs034. [PubMed].
24. Wu X, Subramanian K. Interactive Analysis of Gene Interactions Using Graphical Gaussian Model. Proceedings of the ACM SIGKDD Workshop on Data Mining in Bioinformatics. 2003; 3:63–69.
25. Tammela T, Alitalo K. Lymphangiogenesis: Molecular mechanisms and future promise. Cell. 2010; 140:460–76. https://doi.org/10.1016/j.cell.2010.01.045. [PubMed].
26. Vlachos IS, Zagganas K, Paraskevopoulou MD, Georgakilas G, Karagkouni D, Vergoulis T, Dalamagas T, Hatzigeorgiou AG. DIANA-miRPath v3.0: deciphering microRNA function with experimental support. Nucleic Acids Res. 2015; 43:W460–66. https://doi.org/10.1093/nar/gkv403. [PubMed].
27. Chen Y, Wang X. miRDB: an online database for prediction of functional microRNA targets. Nucleic Acids Res. 2020; 48:D127–31. https://doi.org/10.1093/nar/gkz757. [PubMed].
28. Chang L, Zhou G, Soufan O, Xia J. miRNet 2.0: network-based visual analytics for miRNA functional analysis and systems biology. Nucleic Acids Res. 2020; 48:W244–51. https://doi.org/10.1093/nar/gkaa467. [PubMed].
29. Kang YJ, Kim HS, Jang WS, Kwon JK, Yoon CY, Lee JY, Cho KS, Ham WS, Choi YD. Impact of lymphovascular invasion on lymph node metastasis for patients undergoing radical prostatectomy with negative resection margin. BMC Cancer. 2017; 17:321. https://doi.org/10.1186/s12885-017-3307-4. [PubMed].
30. Calin GA, Croce CM. MicroRNA signatures in human cancers. Nat Rev Cancer. 2006; 6:857–66. https://doi.org/10.1038/nrc1997. [PubMed].
31. Lubov J, Maschietto M, Ibrahim I, Mlynarek A, Hier M, Kowalski LP, Alaoui-Jamali MA, da Silva SD. Meta-analysis of microRNAs expression in head and neck cancer: uncovering association with outcome and mechanisms. Oncotarget. 2017; 8:55511–24. https://doi.org/10.18632/oncotarget.19224. [PubMed].
32. Hess J, Unger K, Maihoefer C, Schüttrumpf L, Wintergerst L, Heider T, Weber P, Marschner S, Braselmann H, Samaga D, Kuger S, Pflugradt U, Baumeister P, et al. A Five-MicroRNA Signature Predicts Survival and Disease Control of Patients with Head and Neck Cancer Negative for HPV Infection. Clin Cancer Res. 2019; 25:1505–16. https://doi.org/10.1158/1078-0432.CCR-18-0776. [PubMed].
33. Lu L, Wu Y, Feng M, Xue X, Fan Y. A novel seven-miRNA prognostic model to predict overall survival in head and neck squamous cell carcinoma patients. Mol Med Rep. 2019; 20:4340–48. https://doi.org/10.3892/mmr.2019.10665. [PubMed].
34. Nunez Lopez YO, Victoria B, Golusinski P, Golusinski W, Masternak MM. Characteristic miRNA expression signature and random forest survival analysis identify potential cancer-driving miRNAs in a broad range of head and neck squamous cell carcinoma subtypes. Rep Pract Oncol Radiother. 2018; 23:6–20. https://doi.org/10.1016/j.rpor.2017.10.003. [PubMed].
35. Leemans CR, Snijders PJF, Brakenhoff RH. The molecular landscape of head and neck cancer. Nat Rev Cancer. 2018; 18:269–82. https://doi.org/10.1038/nrc.2018.11. [PubMed].
36. Dettling M, Buhlmann P. Supervised clustering of genes. Genome Biol. 2002; 3:RESEARCH0069. https://doi.org/10.1186/gb-2002-3-12-research0069. [PubMed].
37. Shiiba M, Uzawa K, Tanzawa H. MicroRNAs in Head and Neck Squamous Cell Carcinoma (HNSCC) and Oral Squamous Cell Carcinoma (OSCC). Cancers (Basel). 2010; 2:653–69. https://doi.org/10.3390/cancers2020653. [PubMed].
38. Saleh AD, Cheng H, Martin SE, Si H, Ormanoglu P, Carlson S, Clavijo PE, Yang X, Das R, Cornelius S, Couper J, Chepeha D, Danilova L, et al. Integrated Genomic and Functional microRNA Analysis Identifies miR-30-5p as a Tumor Suppressor and Potential Therapeutic Nanomedicine in Head and Neck Cancer. Clin Cancer Res. 2019; 25:2860–73. https://doi.org/10.1158/1078-0432.CCR-18-0716. [PubMed].
39. Lamperska KM, Kolenda T, Teresiak A, Kowalik A, Kruszyna-Mochalska M, Jackowiak W, Bliźniak R, Przybyła W, Kapałczyńska M, Kozlowski P. Different levels of let-7d expression modulate response of FaDu cells to irradiation and chemotherapeutics. PLoS One. 2017; 12:e0180265. https://doi.org/10.1371/journal.pone.0180265. [PubMed].
40. Ma B, Li H, Qiao J, Meng T, Yu R. Immune-related miRNA signature identifies prognosis and immune landscape in head and neck squamous cell carcinomas. Biosci Rep. 2020; 40:BSR20201820. https://doi.org/10.1042/BSR20201820. [PubMed].
41. Avissar M, Christensen BC, Kelsey KT, Marsit CJ. MicroRNA expression ratio is predictive of head and neck squamous cell carcinoma. Clin Cancer Res. 2009; 15:2850–55. https://doi.org/10.1158/1078-0432.CCR-08-3131. [PubMed].
42. Zhao Z, Gao D, Ma T, Zhang L. MicroRNA-141 suppresses growth and metastatic potential of head and neck squamous cell carcinoma. Aging (Albany NY). 2019; 11:921–32. https://doi.org/10.18632/aging.101791. [PubMed].
43. Chang KW, Chu TH, Gong NR, Chiang WF, Yang CC, Liu CJ, Wu CH, Lin SC. miR-370 modulates insulin receptor substrate-1 expression and inhibits the tumor phenotypes of oral carcinoma. Oral Dis. 2013; 19:611–19. https://doi.org/10.1111/odi.12046. [PubMed].
44. Scapoli L, Palmieri A, Lo Muzio L, Pezzetti F, Rubini C, Girardi A, Farinella F, Mazzotta M, Carinci F. MicroRNA expression profiling of oral carcinoma identifies new markers of tumor progression. Int J Immunopathol Pharmacol. 2010; 23:1229–34. https://doi.org/10.1177/039463201002300427. [PubMed].
45. Lin SC, Kao SY, Chang JC, Liu YC, Yu EH, Tseng SH, Liu CJ, Chang KW. Up-regulation of miR-187 modulates the advances of oral carcinoma by targeting BARX2 tumor suppressor. Oncotarget. 2016; 7:61355–65. https://doi.org/10.18632/oncotarget.11349. [PubMed].
46. Imai K, Minamiya Y, Koyota S, Ito M, Saito H, Sato Y, Motoyama S, Sugiyama T, Ogawa J. Inhibition of dendritic cell migration by transforming growth factor-β1 increases tumor-draining lymph node metastasis. J Exp Clin Cancer Res. 2012; 31:3. https://doi.org/10.1186/1756-9966-31-3. [PubMed].
47. Leivonen SK, Kahari VM. Transforming growth factor-beta signaling in cancer invasion and metastasis. Int J Cancer. 2007; 121:2119–24. https://doi.org/10.1002/ijc.23113. [PubMed].
48. Noordhuis MG, Fehrmann RS, Wisman GB, Nijhuis ER, van Zanden JJ, Moerland PD, Ver Loren van Themaat E, Volders HH, Kok M, ten Hoor KA, Hollema H, de Vries EG, de Bock GH, et al. Involvement of the TGF-beta and beta-catenin pathways in pelvic lymph node metastasis in early-stage cervical cancer. Clin Cancer Res. 2011; 17:1317–30. https://doi.org/10.1158/1078-0432.CCR-10-2320. [PubMed].
49. Oka M, Iwata C, Suzuki HI, Kiyono K, Morishita Y, Watabe T, Komuro A, Kano MR, Miyazono K. Inhibition of endogenous TGF-beta signaling enhances lymphangiogenesis. Blood. 2008; 111:4571–79. https://doi.org/10.1182/blood-2007-10-120337. [PubMed].
50. Chen J, Alexander JS, Orr AW. Integrins and their extracellular matrix ligands in lymphangiogenesis and lymph node metastasis. Int J Cell Biol. 2012; 2012:853703. https://doi.org/10.1155/2012/853703. [PubMed].
51. Klahan S, Wong HS, Tu SH, Chou WH, Zhang YF, Ho TF, Liu CY, Yih SY, Lu HF, Chen SC, Huang CC, Chang WC. Identification of genes and pathways related to lymphovascular invasion in breast cancer patients: A bioinformatics analysis of gene expression profiles. Tumour Biol. 2017; 39:1010428317705573. https://doi.org/10.1177/1010428317705573. [PubMed].
52. Jiang N, Jiang X, Chen Z, Song X, Wu L, Zong D, Song D, Yin L, Wang D, Chen C, Bian X, He X. MiR-203a-3p suppresses cell proliferation and metastasis through inhibiting LASP1 in nasopharyngeal carcinoma. J Exp Clin Cancer Res. 2017; 36:138. https://doi.org/10.1186/s13046-017-0604-3. [PubMed].
53. Wang Z, Zhao Z, Yang Y, Luo M, Zhang M, Wang X, Liu L, Hou N, Guo Q, Song T, Guo B, Huang C. MiR-99b-5p and miR-203a-3p Function as Tumor Suppressors by Targeting IGF-1R in Gastric Cancer. Sci Rep. 2018; 8:10119. https://doi.org/10.1038/s41598-018-27583-y. [PubMed].
54. Na XY, Shang XS, Zhao Y, Ren PP, Hu XQ. MiR-203a functions as a tumor suppressor in bladder cancer by targeting SIX4. Neoplasma. 2019; 66:211–21. https://doi.org/10.4149/neo_2018_180512N312. [PubMed].
55. Cai KT, Feng CX, Zhao JC, He RQ, Ma J, Zhong JC. Upregulated miR-203a-3p and its potential molecular mechanism in breast cancer: A study based on bioinformatics analyses and a comprehensive meta-analysis. Mol Med Rep. 2018; 18:4994–5008. https://doi.org/10.3892/mmr.2018.9543. [PubMed].
56. Huo W, Du M, Pan X, Zhu X, Gao Y, Li Z. miR-203a-3p.1 targets IL-24 to modulate hepatocellular carcinoma cell growth and metastasis. FEBS Open Bio. 2017; 7:1085–91. https://doi.org/10.1002/2211-5463.12248. [PubMed].
57. Nakagawa T, Iida S, Osanai T, Uetake H, Aruga T, Toriya Y, Takagi Y, Kawachi H, Sugihara K. Decreased expression of SOCS-3 mRNA in breast cancer with lymph node metastasis. Oncol Rep. 2008; 19:33–39. [PubMed].
58. Xiao JB, Li XL, Liu L, Wang G, Hao SN, Dong HJ, Wang XM, Zhang YF, Liu HD. The association of semaphorin 5A with lymph node metastasis and adverse prognosis in cervical cancer. Cancer Cell Int. 2018; 18:87. https://doi.org/10.1186/s12935-018-0584-1. [PubMed].
59. Holt J, Walter V, Yin X, Marron D, Wilkerson MD, Choi HY, Zhao X, Jo H, Hayes DN, Ko YH. Integrative Analysis of miRNAs Identifies Clinically Relevant Epithelial and Stromal Subtypes of Head and Neck Squamous Cell Carcinoma. Clin Cancer Res. 2021; 27:831–42. https://doi.org/10.1158/1078-0432.CCR-20-0557. [PubMed].
60. Cai HK, Chen X, Tang YH, Deng YC. MicroRNA-194 modulates epithelial-mesenchymal transition in human colorectal cancer metastasis. Onco Targets Ther. 2017; 10:1269–78. https://doi.org/10.2147/OTT.S125172. [PubMed].
61. Xiong G, Huang H, Feng M, Yang G, Zheng S, You L, Zheng L, Hu Y, Zhang T, Zhao Y. MiR-10a-5p targets TFAP2C to promote gemcitabine resistance in pancreatic ductal adenocarcinoma. J Exp Clin Cancer Res. 2018; 37:76. https://doi.org/10.1186/s13046-018-0739-x. [PubMed].
62. Liu CJ, Tsai MM, Hung PS, Kao SY, Liu TY, Wu KJ, Chiou SH, Lin SC, Chang KW. miR-31 ablates expression of the HIF regulatory factor FIH to activate the HIF pathway in head and neck carcinoma. Cancer Res. 2010; 70:1635–44. https://doi.org/10.1158/0008-5472.CAN-09-2291. [PubMed].
63. Hu Y, Liu H. MicroRNA-10a-5p and microRNA-34c-5p in laryngeal epithelial premalignant lesions: differential expression and clinicopathological correlation. Eur Arch Otorhinolaryngol. 2015; 272:391–99. https://doi.org/10.1007/s00405-014-3299-5. [PubMed].
64. Lu Y, Wei G, Liu L, Mo Y, Chen Q, Xu L, Liao R, Zeng D, Zhang K. Direct targeting of MAPK8IP1 by miR-10a-5p is a major mechanism for gastric cancer metastasis. Oncol Lett. 2017; 13:1131–36. https://doi.org/10.3892/ol.2016.5544. [PubMed].
65. Chakraborty S, Zawieja DC, Davis MJ, Muthuchamy M. MicroRNA signature of inflamed lymphatic endothelium and role of miR-9 in lymphangiogenesis and inflammation. Am J Physiol Cell Physiol. 2015; 309:C680–92. https://doi.org/10.1152/ajpcell.00122.2015. [PubMed].
66. Khafaei M, Rezaie E, Mohammadi A, Shahnazi Gerdehsang P, Ghavidel S, Kadkhoda S, Zorrieh Zahra A, Forouzanfar N, Arabameri H, Tavallaie M. miR-9: From function to therapeutic potential in cancer. J Cell Physiol. 2019 Jan 28. https://doi.org/10.1002/jcp.28210. [Epub ahead of print]. [PubMed]
67. Wang J, Zhao H, Tang D, Wu J, Yao G, Zhang Q. Overexpressions of microRNA-9 and microRNA-200c in human breast cancers are associated with lymph node metastasis. Cancer Biother Radiopharm. 2013; 28:283–88. https://doi.org/10.1089/cbr.2012.1293. [PubMed].
68. Carvalho MA, Zecchin KG, Seguin F, Bastos DC, Agostini M, Rangel AL, Veiga SS, Raposo HF, Oliveira HC, Loda M, Coletta RD, Graner E. Fatty acid synthase inhibition with Orlistat promotes apoptosis and reduces cell growth and lymph node metastasis in a mouse melanoma model. Int J Cancer. 2008; 123:2557–65. https://doi.org/10.1002/ijc.23835. [PubMed].
69. Janse van Rensburg HJ, Yang X. The roles of the Hippo pathway in cancer metastasis. Cell Signal. 2016; 28:1761–72. https://doi.org/10.1016/j.cellsig.2016.08.004. [PubMed].
70. Lee CK, Jeong SH, Jang C, Bae H, Kim YH, Park I, Kim SK, Koh GY. Tumor metastasis to lymph nodes requires YAP-dependent metabolic adaptation. Science. 2019; 363:644–49. https://doi.org/10.1126/science.aav0173. [PubMed].
71. Zhang X, Zhao H, Li Y, Xia D, Yang L, Ma Y, Li H. The role of YAP/TAZ activity in cancer metabolic reprogramming. Mol Cancer. 2018; 17:134. https://doi.org/10.1186/s12943-018-0882-1. [PubMed].
72. Cho YK, Son Y, Kim SN, Song HD, Kim M, Park JH, Jung YS, Ahn SY, Saha A, Granneman JG, Lee YH. MicroRNA-10a-5p regulates macrophage polarization and promotes therapeutic adipose tissue remodeling. Mol Metab. 2019; 29:86–98. https://doi.org/10.1016/j.molmet.2019.08.015. [PubMed].
73. Tian H, Liu C, Zou X, Wu W, Zhang C, Yuan D. MiRNA-194 Regulates Palmitic Acid-Induced Toll-Like Receptor 4 Inflammatory Responses in THP-1 Cells. Nutrients. 2015; 7:3483–96. https://doi.org/10.3390/nu7053483. [PubMed].
74. Wang T, Frangou C, Zhang J. Fatty acid oxidation (FAO) metabolic switch: metastasis in lymph nodes driven by yes-associated protein (YAP) activation. Biotarget. 2019; 3:13. https://doi.org/10.21037/biotarget.2019.07.03. [PubMed].
75. Gomes FG, Nedel F, Alves AM, Nör JE, Tarquinio SB. Tumor angiogenesis and lymphangiogenesis: tumor/endothelial crosstalk and cellular/microenvironmental signaling mechanisms. Life Sci. 2013; 92:101–07. https://doi.org/10.1016/j.lfs.2012.10.008. [PubMed].
76. Xu M, Gu M, Zhang K, Zhou J, Wang Z, Da J. miR-203 inhibition of renal cancer cell proliferation, migration and invasion by targeting of FGF2. Diagn Pathol. 2015; 10:24. https://doi.org/10.1186/s13000-015-0255-7. [PubMed].
77. Arimoto S, Hasegawa T, Takeda D, Saito I, Amano R, Akashi M, Komori T. Lymphangiogenesis and Lymph Node Metastasis in Oral Squamous Cell Carcinoma. Anticancer Res. 2018; 38:6157–62. https://doi.org/10.21873/anticanres.12968. [PubMed].
78. Agnihotri NS, Astekar M. The role of novel prognostic markers PROX1 and FOXC2 in carcinogenesis of oral squamous cell carcinoma. J Exp Ther Oncol. 2018; 12:171–84. [PubMed].
79. Chen X, Mangala LS, Mooberry L, Bayraktar E, Dasari SK, Ma S, Ivan C, Court KA, Rodriguez-Aguayo C, Bayraktar R, Raut S, Sabnis N, Kong X, et al. Identifying and targeting angiogenesis-related microRNAs in ovarian cancer. Oncogene. 2019; 38:6095–108. https://doi.org/10.1038/s41388-019-0862-y. [PubMed].
80. Silva TC, Colaprico A, Olsen C, D'Angelo F, Bontempi G, Ceccarelli M, Noushmehr H. TCGA Workflow: Analyze cancer genomics and epigenomics data using Bioconductor packages. F1000Res. 2016; 5:1542. https://doi.org/10.12688/f1000research.8923.2. [PubMed].
81. Xu T, Su N, Liu L, Zhang J, Wang H, Zhang W, Gui J, Yu K, Li J, Le TD. miRBaseConverter: an R/Bioconductor package for converting and retrieving miRNA name, accession, sequence and family information in different versions of miRBase. BMC Bioinformatics. 2018 (Suppl 19); 19:514. https://doi.org/10.1186/s12859-018-2531-5. [PubMed].
82. Vidman L, Kallberg D, Ryden P. Cluster analysis on high dimensional RNA-seq data with applications to cancer research - An evaluation study. PLoS One. 2019; 14:e0219102. https://doi.org/10.1371/journal.pone.0219102. [PubMed].
83. Oyelade J, Isewon I, Oladipupo F, Aromolaran O, Uwoghiren E, Ameh F, Achas M, Adebiyi E. Clustering Algorithms: Their Application to Gene Expression Data. Bioinform Biol Insights. 2016; 10:237–53. https://doi.org/10.4137/bbi.s38316. [PubMed].
84. Lloyd-Price J, Arze C, Ananthakrishnan AN, Schirmer M, Avila-Pacheco J, Poon TW, Andrews E, Ajami NJ, Bonham KS, Brislawn CJ, Casero D, Courtney H, Gonzalez A, et al. Multi-omics of the gut microbial ecosystem in inflammatory bowel diseases. Nature. 2019; 569:655–62. https://doi.org/10.1038/s41586-019-1237-9. [PubMed].