
Introduction
Acute Myeloid Leukemia (AML) is a heterogeneous malignancy, most commonly affecting individuals ≥60 years of age [3, 4]. Technological and molecular advances have led to further classification and stratification of this disease by cytogenetic and mutational features, as well as the eventual development of many targeted therapies. A subtype of AML, classified by the presence of a FLT3-Internal Tandem Duplication (ITD) mutation, tends to have a worse prognosis with early relapse and death [5]. FLT3 is a class III receptor tyrosine kinase, most often expressed in hematopoietic stem, progenitor, and dendritic cells. Of particular interest in myeloid malignancies, FLT3 plays an important role in hematopoietic proliferation, differentiation and survival. ITD mutations in FLT3 occur within the juxtamembrane domain and lead to constitutive receptor activation [6].
FLT3 mutations occur in approximately 30% of de novo AML cases, of which, 25% are ITD mutations and 5% are tyrosine kinase domain (TKD) point mutations [7–9]. Per the 2017 European Leukemia Network (ELN) Guidelines, a complete diagnostic work-up should include screening for the presence of FLT3 mutations, as well as mutant-to-wild-type allelic ratios. A low allelic ratio is <0.5 while a high allelic ratio is >0.5, and allows for appropriate stratification into favorable, intermediate, or adverse risk classifications [10, 11]. With the increasing attention and importance that has been placed on FLT3 mutant AML, many targeted therapies have been designed to combat it [4, 8]. There are many past and present clinical trials examining the activity of tyrosine kinase inhibitors (TKIs) against FLT3 mutant AML, including sunitinib, midostaurin, lestaurtinib, sorafenib, ponatinib, crenolanib, gilteritinib, and quizartinib [8, 12–18].
Among the FLT3 inhibitors, midostaurin was the first to receive FDA approval and has FLT3-ITD and FLT3-TKD activity and also acts as a multi-kinase inhibitor. When combined with standard induction therapy, midostaurin provides a successful overall survival rate of 51.4% compared to 44.3% in placebo [2]. Despite an overall survival benefit, only 59% to 80% of patients treated with midostaurin achieve complete remission (CR)/complete remission with incomplete hematological recovery (CRi) with a fraction of these continuing on to develop resistance [19–21]. Thus, while patients with FLT3 mutations have improved outcomes, both primary and secondary resistance remains unfortunately still common. Factors predictive of the development of resistance include the initial presence of multiple leukemic clones, low FLT3-mutant allelic ratio, or additional primary mutations in the FLT3 kinase domain [5, 8, 11, 22].
We hypothesized that there are additional genomic alterations and gene expression changes outside of FLT3-ITD mutations that can influence AML sample resistance or sensitivity to midostaurin and aimed to further characterize these factors. Here, we provide evidence from an ex vivo drug sensitivity screen to suggest that KRAS or TP53 mutant samples have greater resistance to midostaurin as do FLT3-ITD mutant samples with RGL4 overexpression. Further, independent of FLT3 status, we identify a distinct gene signature correlating with midostaurin sensitivity.
Results
Cohort
To understand the impact of different genomic alterations on midostaurin response, we identified a cohort of 193 Primary and 21 Relapse AML samples from the Beat AML published dataset [23]. This corresponds to 214 patients that were functionally assessed with midostaurin and annotated for FLT3 status. Unique samples per patient were chosen by prioritizing samples extracted from bone marrow aspirates over peripheral blood extractions and primary over relapsed disease status at the time of sample collection. Ultimately, 59% of samples were from bone marrow aspirates, 38% from peripheral blood, and 3% from leukapheresis (Supplementary Table 1). Median age was 61 years (interquartile range 44–71), with 52% male and 48% female (Table 1). Within this group, 73 samples were favorable risk, 59 samples intermediate, and 68 were adverse based on the 2017 ELN risk groups. Further, 12 samples did not have available data for their FLT3-ITD allelic ratio and thus were classified as having an indeterminate ELN risk. We found the commonly mutated genes NPM1, FLT3-ITD, FLT3-TKD, and DNMT3A to be mutated at 33%, 23%, 7%, and 16% in our cohort, respectively, consistent with previously reported prevalence [24].
Table 1: Patient characteristics
| Characteristic | Count | Percent |
|---|---|---|
| No. | 214 | |
| Type | ||
| Primary | 193 | 90% |
| Relapse | 21 | 10% |
| Gender | ||
| Male | 111 | 52% |
| Female | 102 | 48% |
| Age at diagnosis | 61.2 (44 - 71) | |
| White blood cell count | 33.4 (12.8 - 69.9) | |
| Percent blasts blood | 49.5 (20.8 - 80.0) | |
| ELN Risk | ||
| Favorable | 73 | 34% |
| Intermediate | 59 | 28% |
| Adverse | 68 | 32% |
| Indeterminate | 12 | 6% |
| NCCN Karyotype Risk | ||
| Better-risk | 20 | 9% |
| Intermediate-risk | 155 | 72% |
| Poor-risk | 39 | 18% |
| Fusions | ||
| CBFB-MYH11; inv (16)(p13q22) | 15 | 7% |
| MLLT3-KMT2A; t (9;11)(p21; q23) | 8 | 4% |
| RUNX1-RUNX1T1; t (8;21)(q22; q22) | 7 | 3% |
| RPN-EVI1; inv (3)(q21q26.2) | 4 | 2% |
| Gene Mutations | ||
| NPM1 | 70 | 33% |
| FLT3-ITD | 50 | 23% |
| DNMT3A | 34 | 16% |
| NRAS | 28 | 13% |
| CEBPA | 24 | 11% |
| TET2 | 22 | 10% |
| IDH2 | 21 | 10% |
| ASXL1 | 18 | 8% |
| SRSF2 | 16 | 7% |
| WT1 | 16 | 7% |
| FLT3-D835 | 14 | 7% |
| KMT2A | 14 | 7% |
| PTPN11 | 13 | 6% |
| RUNX1 | 12 | 6% |
| TP53 | 12 | 6% |
| KRAS | 12 | 6% |
| IDH1 | 11 | 5% |
Mutation analysis
To assess the impact of somatic mutations on midostaurin sensitivity, we compared all somatic alterations present in at least five percent of the samples. As expected we identified an increase in midostaurin sensitivity in FLT3-ITD positive patients compared with FLT3-ITD wild-type (Figure 1A and 1B). This is consistent with midostaurin’s mechanism of action as a FLT3 inhibitor [1]. Within FLT3-ITD mutations we did not observe a strong association between FLT3-ITD allele frequency and midostaurin AUC values via a continuous analysis (Figure 1C) though did observe a small but significant difference when split by the commonly used allelic ratio of 0.7 (p < 0.05) (Supplementary Figure 1) [2]. Mutated FLT3-ITD samples had a median AUC of 59.8 while non-mutated had an AUC of 73.2. The full dataset had a median AUC of 69.9 (IQR 48.0 to 91.8 with full range of 0 to 100). Further, we did not see an association of drug sensitivity to FLT3-TKD mutations (N = 14; Supplementary Figure 2).
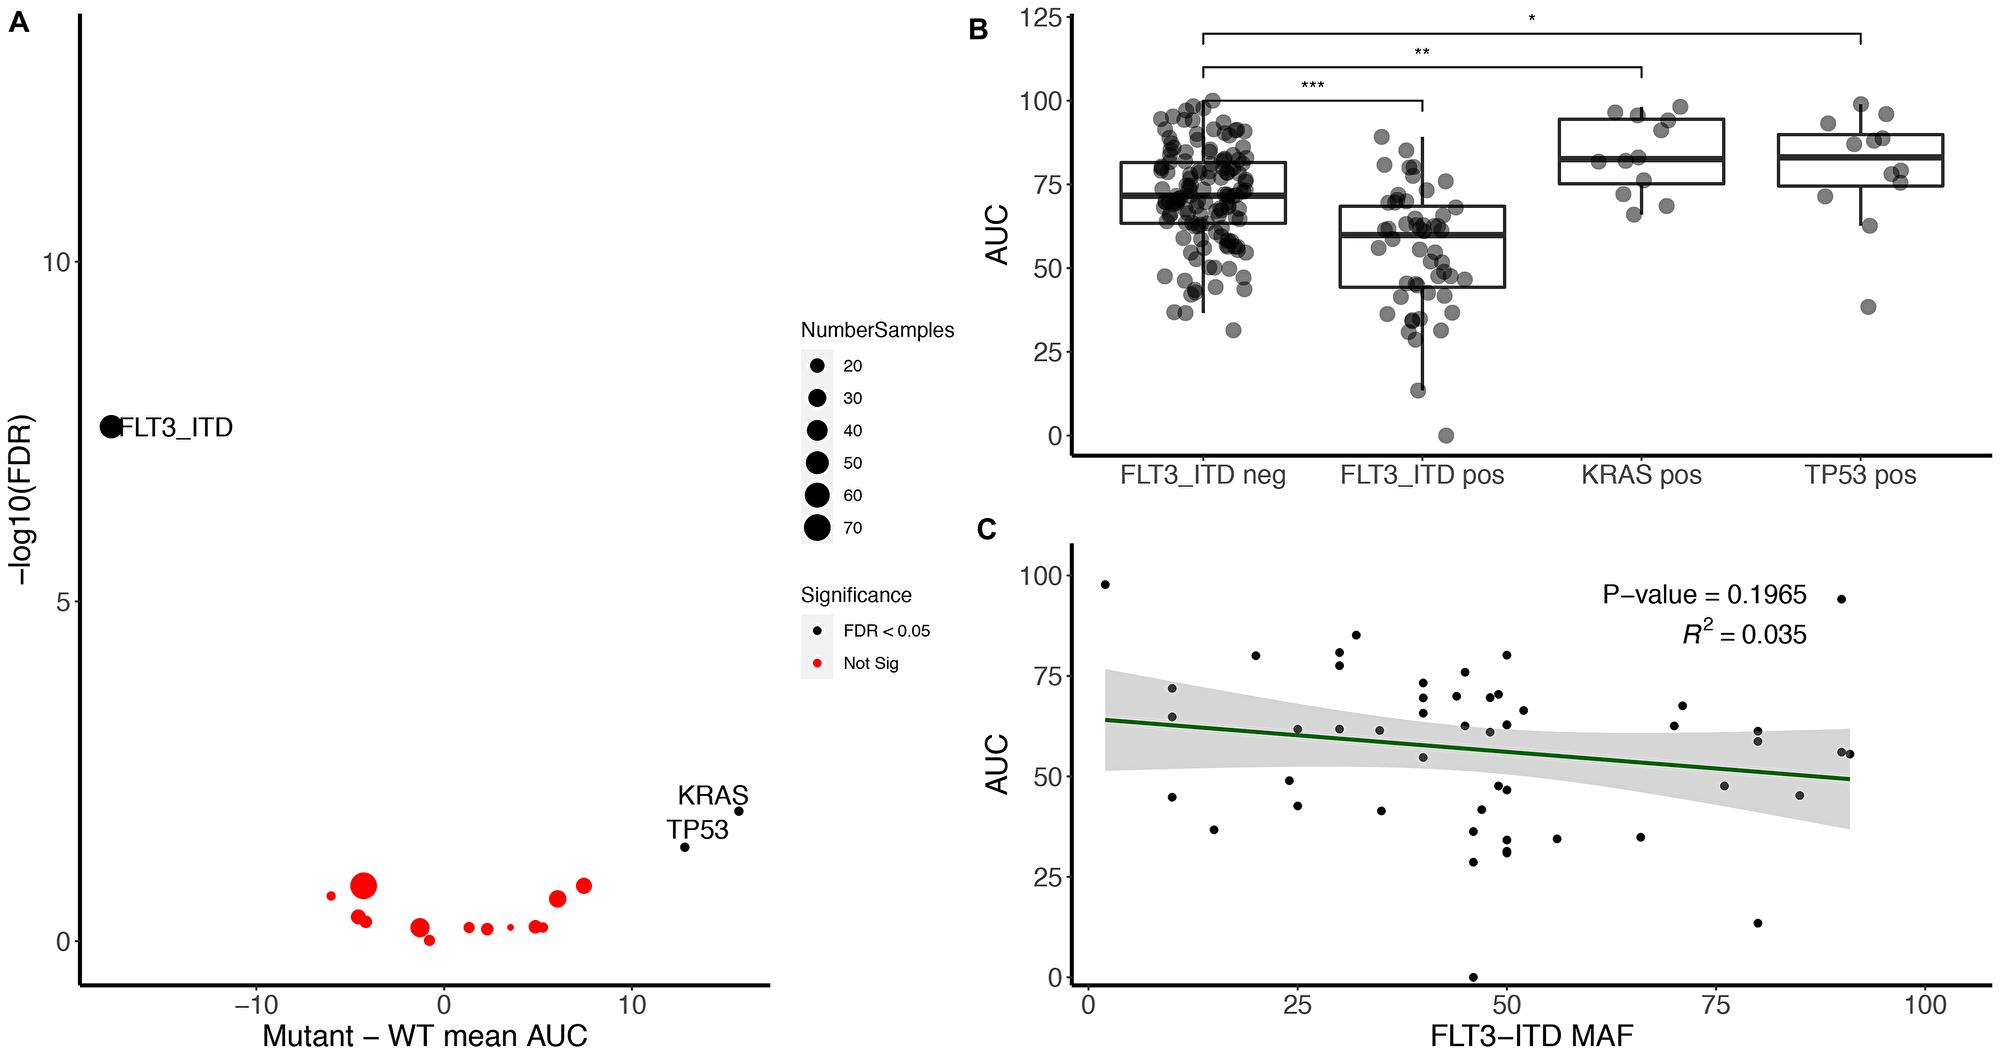
Figure 1: FLT3-ITD associates with midostaurin sensitivity while KRAS and TP53 mutations associate with midostaurin resistance. (A) Volcano plot representing the difference between mutant and wild-type midostaurin AUC for each gene present in at least 5% of the samples (Number of genes = 17; Number of mutant samples within that gene is annotated by circle size). Significance was calculated using Kruskal–Wallis H test and false discovery rate was used to correct for multiple hypothesis testing. (B) FLT3-ITD, KRAS, and TP53 mutant samples compared to FLT3-ITD negative cohort. Significance determined by Kruskal–Wallis (***, **, and *represent < 0.001, < 0.01, and < 0.05, respectively). (C) FLT3-ITD minor allele frequency compared to midostaurin AUC. Linear regression R-squared of 0.035, negative slope of 0.17 (p > 0.05).
Outside of FLT3-ITD, we observed an increase in resistance to midostaurin for samples with pathogenic KRAS and TP53 mutations (Figure 1A, right side). In contrast, NRAS was not significantly associated with an increase in resistance (Supplementary Table 2). When excluding FLT3-ITD from the cohort, we still saw an increase in drug resistance within samples with KRAS and TP53 mutations compared to non-mutated samples. There was an increase of median AUC from 72.9 to 82.5 for KRAS and 71.5 to 87.0 for mutated TP53 (Figure 1B). However, there was no correlation between allelic frequency and degree of midostaurin response (Supplementary Figure 3). To confirm the correlation of these mutations to midostaurin response, we identified an independent cohort of 43 FLT3-ITD negative samples collected under the Beat AML protocol however outside the initial data freeze. Nine were KRAS mutant, 34 KRAS wild-type, 11 TP53 mutant and 31 TP53 wild-type (one had unknown TP53 status). Given the expected variance in the dataset and difference between cohorts, we were powered at 80% to detect a difference in KRAS AUC and saw a similar trend towards increased drug resistance in KRAS mutant samples (p = 0.09, Supplementary Figure 4). There was no association found with TP53 in these samples.
RNA-Seq analysis
Next, we sought to evaluate the impact of gene expression on drug sensitivity. We selected all de novo primary AML samples (N = 193) with RNA-Sequencing which provided a cohort of 170 patients of both FLT3-ITD mutated and non-mutated samples. We identified 47 differentially expressed genes between sensitive and resistance cohorts (false discovery rate corrected p < 0.01, See methods; Figure 2). Sensitive samples were defined as those samples below the 20th percentile of AUC (N = 34) and resistance samples were samples above the 80th percentile (N = 34). Midostaurin sensitive samples were enriched for FLT3-ITD mutant samples, however there remained 16 / 34 sensitive samples that were FLT3-ITD wild-type.
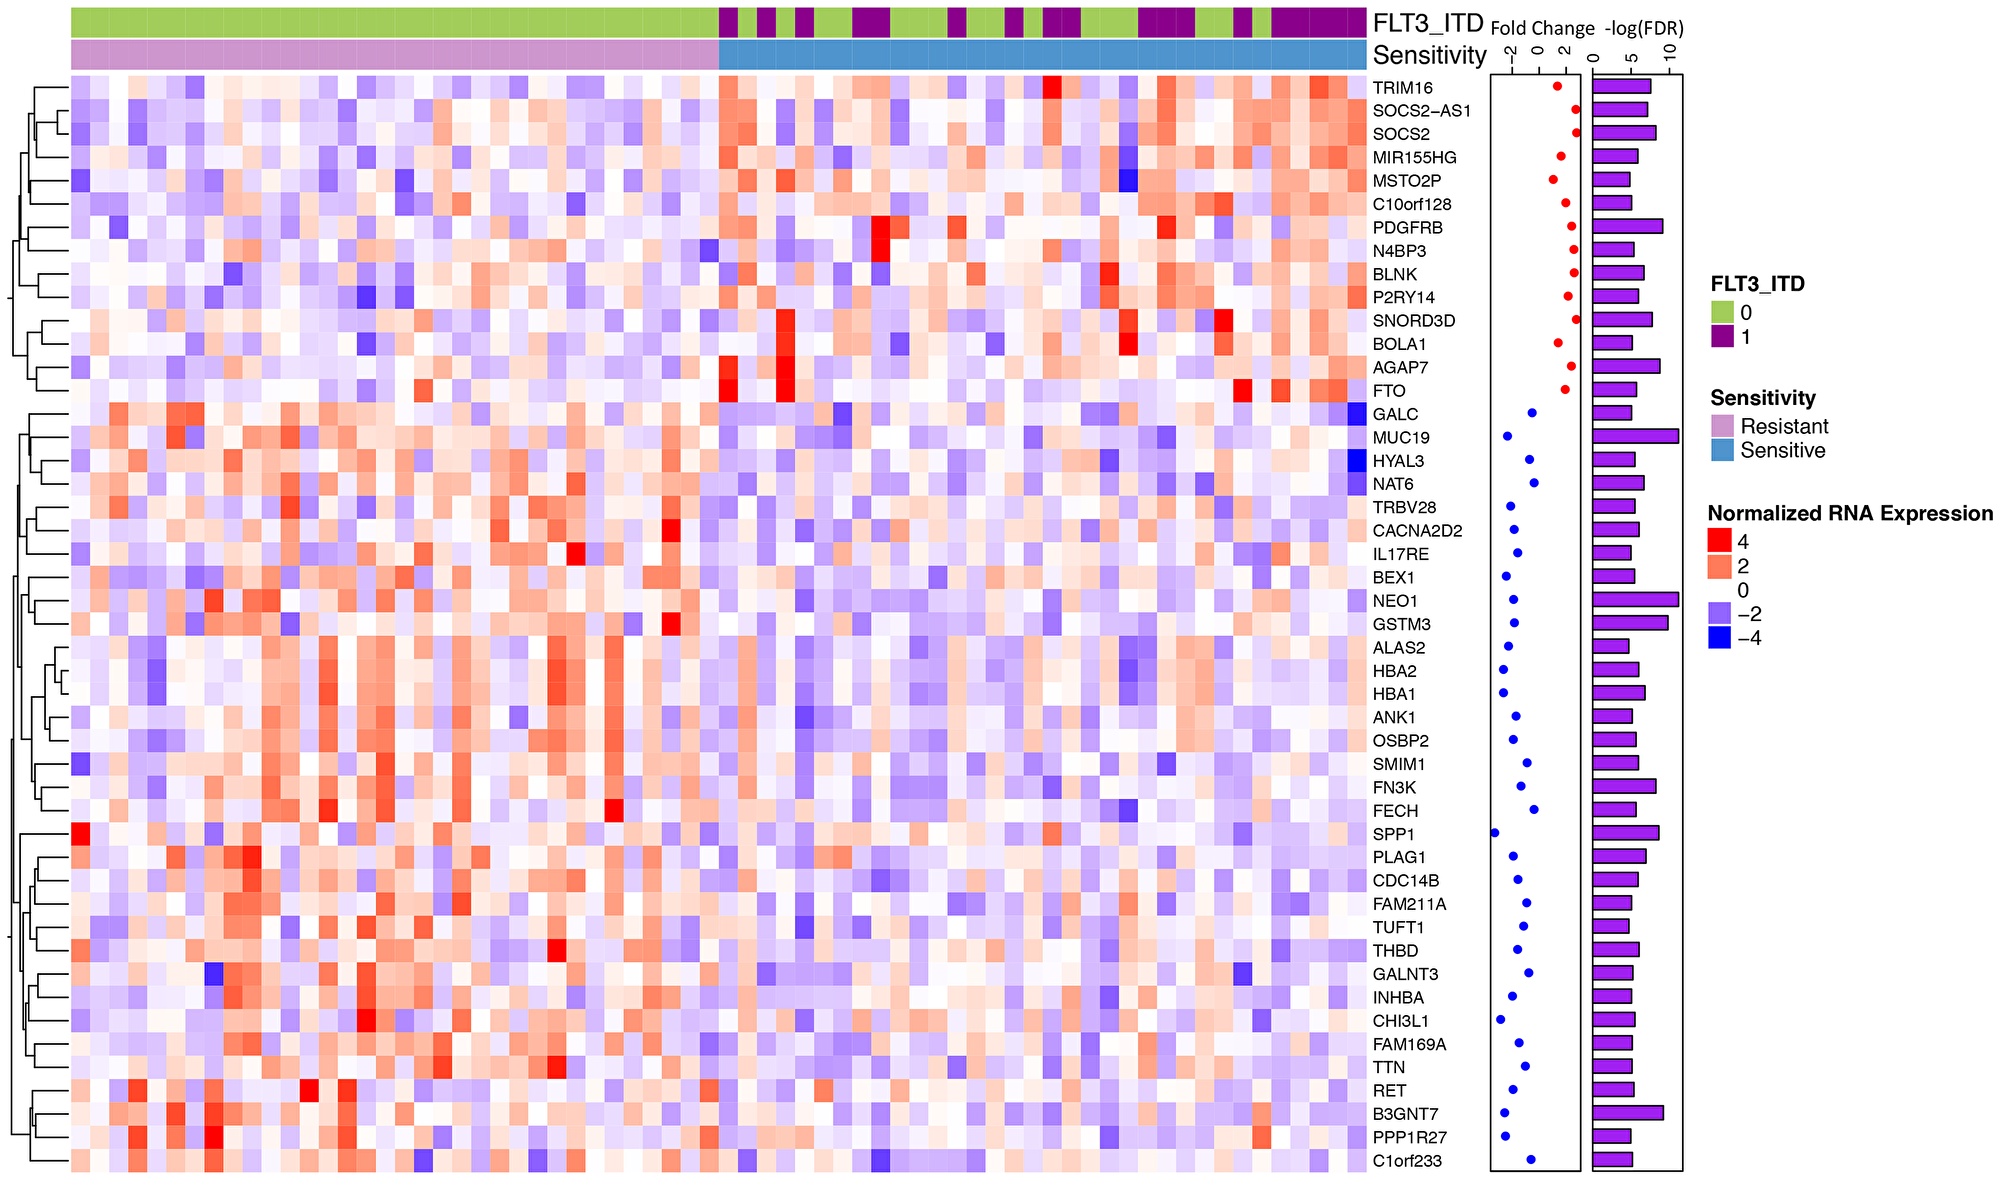
Figure 2: Differential gene expression for midostaurin sensitive vs. resistant samples identifies a unique signature. Normalized RNA expression for midostaurin sensitive (< 20th quartile AUC) and resistant (> 80th quartile) samples (34 sensitive, 34 resistant). Significantly differentially expressed genes shown (N = 47, FDR < 0.01). Overexpressed genes are shown by shades of red with under expressed genes by shades of blue. Fold change calculated between the two cohorts is annotated; with red representing those overexpressed in the sensitive compared to the resistant cohort and blue those that are under expressed.
Differentially expressed genes can be interpreted in two groups: those that have a change in expression in samples that are both mutant FLT3-ITD and sensitive and those that have a change between sensitive and resistant regardless of FLT3-ITD status. Within the FLT3-ITD mutated, sensitive cohort we observe known genes found to be over-expressed in FLT3-ITD mutated samples including SOCS2, TRIM16, MIR155HG, and C10orf128 (Figure 3A and 3B) [25–30]. However, we also observed a number of genes that had significant differential expression between sensitive and resistant cohorts that was not dependent on FLT3 status (Figure 3C). We found enrichment for overexpression of genes involved in heme metabolism in the resistant cohort (FDR corrected p = 0.0125) [31]. Additional genes that were overexpressed in the resistant samples (down regulated in the sensitive cohort) included those related to growth and mobility such as B3GNT7 known to be involved in cell migration and invasion and SPP1 (encoding for osteopontin) which is both a marker of poor survival in AML and related to adhesion, stemness, and differentiation [32–34]. Further, ANK1, a gene involved in erythropoiesis is known to be under-expressed in FLT3-ITD mutated samples, was downregulated in the midostaurin sensitive cohort regardless of mutation status [35] (Figure 3A).
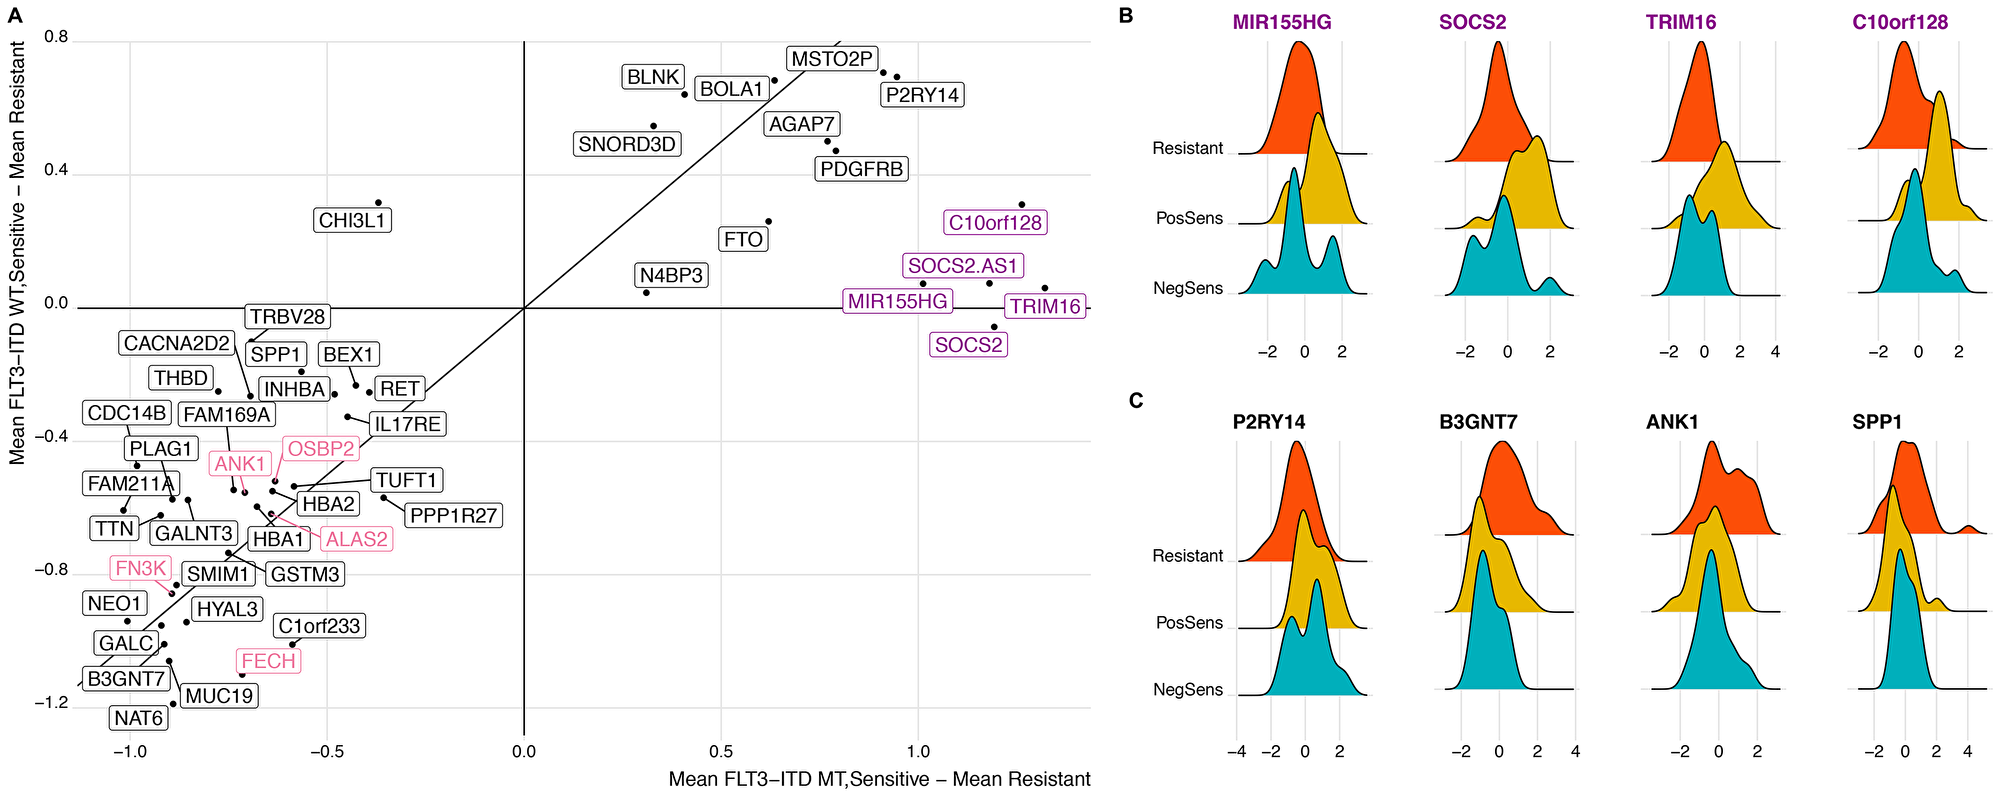
Figure 3: Distinct differential gene expression signature correlates with midostaurin expression regardless of FLT3-ITD status. (A) Scatter plot comparing all significantly expressed genes (N = 47). X-axis is calculated as the difference in the mean gene expression between sensitive and resistant samples within the FLT3-ITD mutant cohort. Y-axis displays the difference in mean gene expression between sensitive and resistant samples within the FLT3-ITD wild-type cohort. Highlighted are genes enriched in heme-metabolism and those known to associate with FLT3 status. (B and C) Distribution of midosaturin AUC between midostaurin-resistant, FLT3-ITD positive midostaurin-sensitive, and FLT3-ITD negative midostaurin-sensitive cohorts. Genes included are representative of those known to associate with FLT3-ITD status (B) and those independent of FLT3-ITD status (C).
We also identified genes that were upregulated in the midostaurin sensitive samples regardless of FLT3-ITD status. P2RY14, a G protein-coupled receptor, is part of the PI3K/mTOR pathway downstream of FLT3 suggesting a possible signaling event related to FLT3 activation targetable by midosaturin aside from FLT3-ITD mutations [15, 36].
Further, within the FLT3-ITD positive samples, there was a range of responses with AUC values ranging from 0 to 89.2 (median 59.9, IQR 35.7–84.1). We sought to identify expression changes within the mutant cohort that stratified the patient by midostaurin response (Figure 4A). Performing differential gene expression, we identified RGL4 to be over-expressed in the FLT3-ITD positive, midostaurin-resistant cohort, and further showed that there was a positive correlation between AUC and RGL4 expression (Figure 4B and 4C). RGL4 (ral guanine nucleotide dissociation stimulator like 4) encodes for a guanine nucleotide exchange factor similar to Ral which causes activation of the downstream Ras-Raf-MEK-ERK pathway [37].
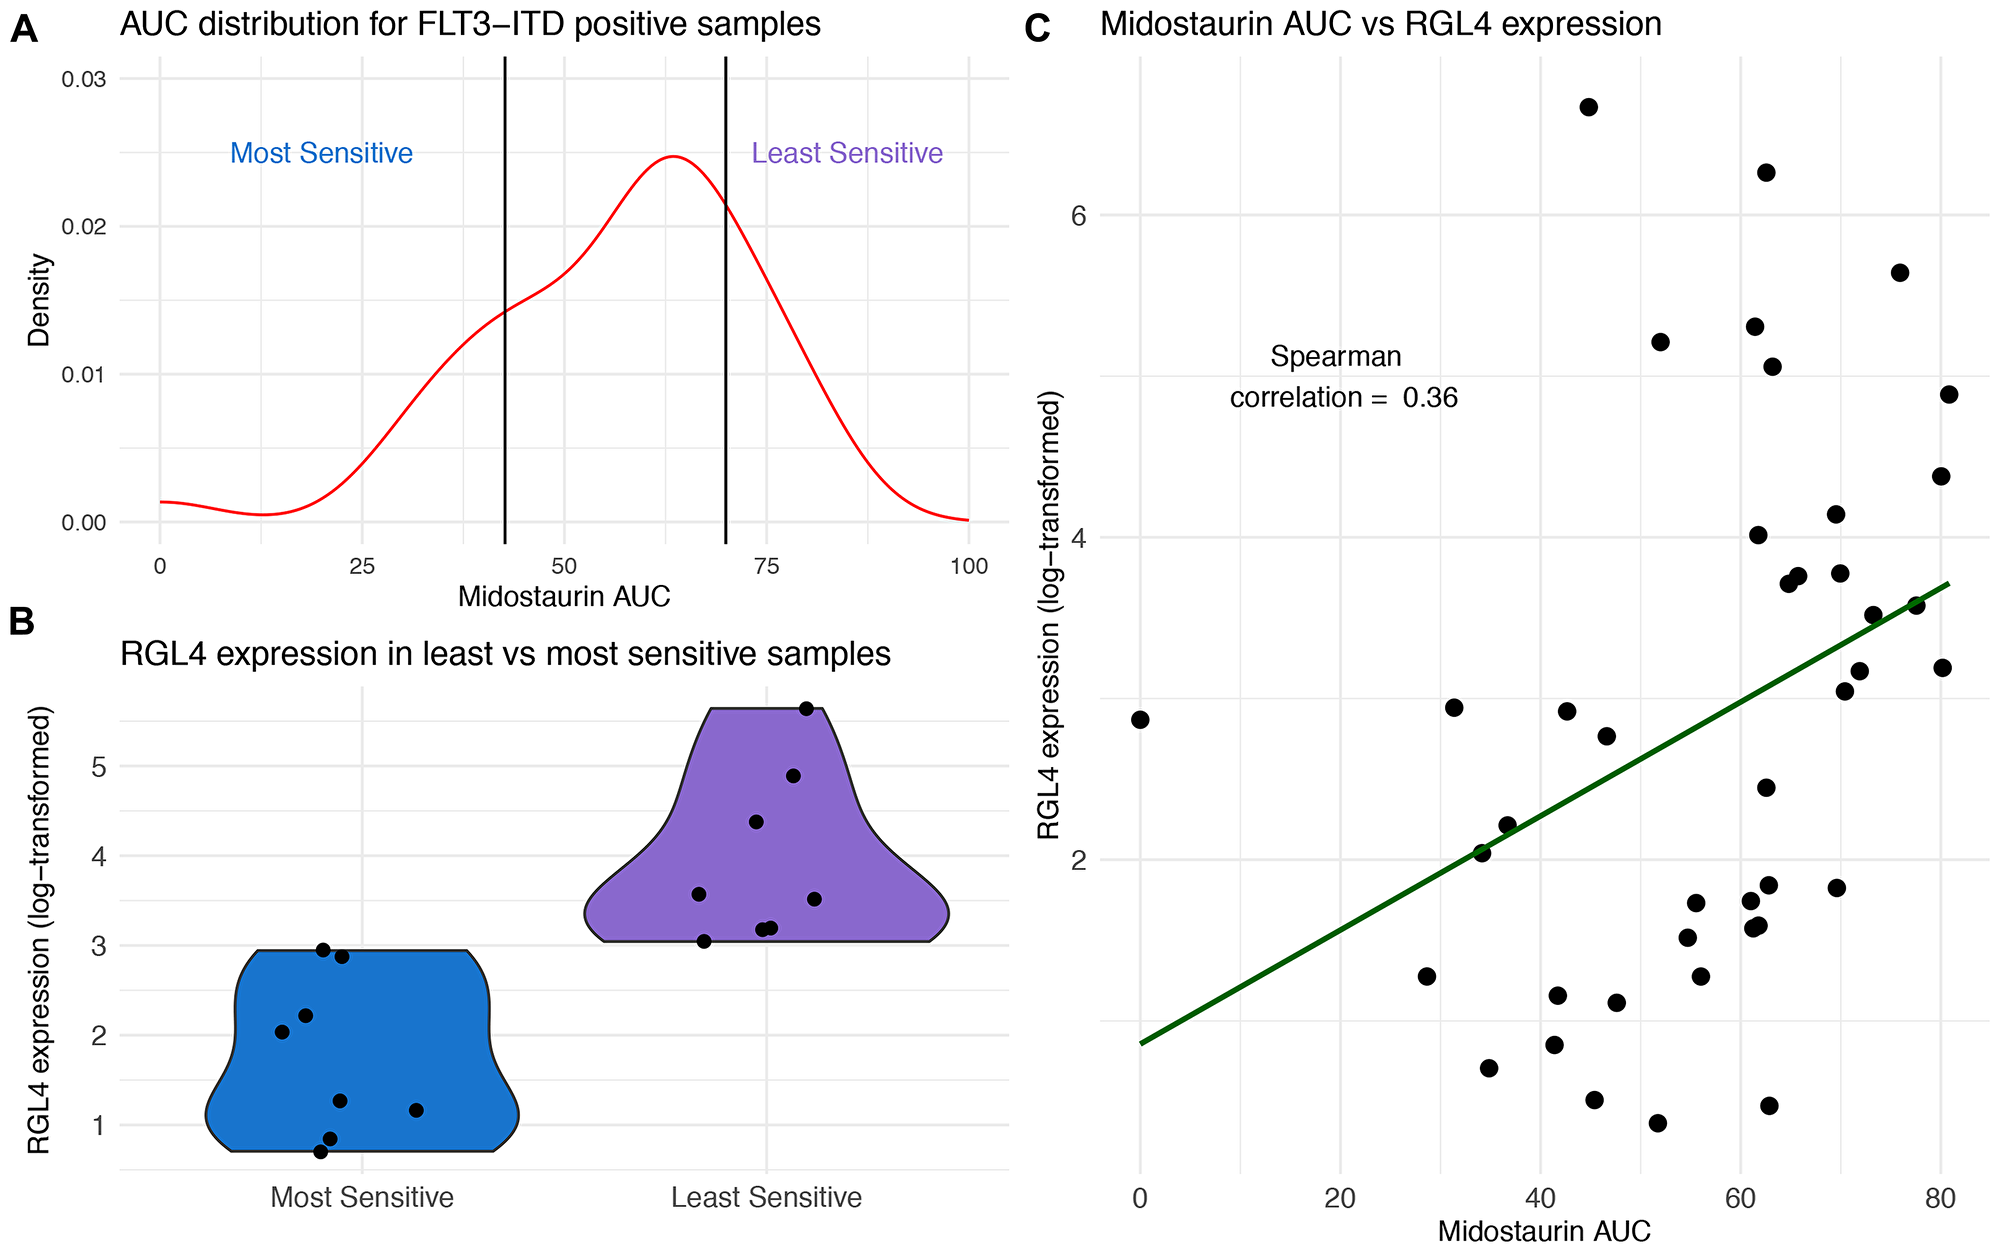
Figure 4: RGL4 expression correlates with response to midostaurin in FLT3-ITD positive samples. (A) Distribution of midostaurin AUC for FLT3-ITD positive samples with breakpoints for most and least sensitive set at the 20th and 80th AUC percentile, respectively (N = 41). (B) Violin plots of RGL4 expression in midostaurin sensitive and least sensitive samples. (C) Positive correlation (Spearman rho = 0.36) between midostaurin AUC and RGL4 expression across all FLT3-ITD positive samples (N = 41).
To confirm these findings, RGL4 expression was measured in 21 FLT3-ITD positive independent samples. Indeed, RGL4 over-expression within these samples correlated with increased midostaurin resistance (Supplementary Figure 5).
DISCUSSION
Our research explored the multi-targeted nature of midostaurin and suggested a number of molecular mutational patterns that correlated with midostaurin drug sensitivity and resistance in both FLT3-ITD mutated and FLT3-ITD wild-type AML patient samples. In line with its known mechanism and previous reports, we observed that FLT3-ITD mutated patients had increased sensitivity to midostaurin though we did not identify an association with FLT3-TKD possibly due to the limited number of FLT3-TKD samples in our cohort. Further, we noted specific point mutations and gene expression patterns that may better explain the range of response to midostaurin treatment.
Within the FLT3-ITD positive cohort, an increased expression of RGL4, an oncogene and upstream regulator of the Ras-Raf-MEK-ERK cascade, correlated with a decrease in midostaurin response. Additionally, within the FLT3-ITD negative cohort, KRAS mutations correlated with a poorer midostaurin response. We did not have sufficient samples to investigate the impact of KRAS within FLT3-ITD AML. Leveraging the Genomics of Drug Sensitivity database (https://www.cancerrxgene.org/), RAS mutations were also seen to confer resistance in AML cell lines with NRAS mutations significantly mutated in midostaurin resistant cell lines (p = 0.003) [38] Combined, these findings suggest the involvement of Ras-Raf-MEK-ERK pathway as a possible escape mechanism for midostaurin therapy. RAS mutations as an escape mechanism have been established in the literature for other FLT3 inhibitors as well as additional small molecule inhibitors. Both KRAS and NRAS mutations have been shown to correlate with quizartinib resistance [39, 40] and NRAS with gilteritinib resistance [39, 40]. Further, co-occurring mutations in NRAS confer resistance to the IDH2 inhibitor enasidenib and activation of the RAS pathway is an escape mechanism for venetoclax [41, 42]. Here, we add the increased expression of RGL4 as a contributor to the RAS pathway of resistance. Additional functional studies are necessary to further elucidate this mechanism of resistance. Moreover, the impact of RGL4 expression as a primary and secondary resistance mechanism should be further investigated in larger retrospective cohorts or prospective studies.
Within our cohort we initially suggested TP53 as a marker of resistance, however were unable to confirm such correlation in a similar demographic validation set. This may have been due to a smaller effect size or larger variance than initially predicted. Additionally, given the limited number of samples in the validation set, there may have been non-annotated characteristics that influenced the results. To further investigate this mutation, we identified TP53 mutations as significantly mutated in midostaurin resistant AML cell lines (p = 0.0335) from the Genomics of Drug Sensitivity database [38]. It would be interesting to further explore this in a larger, independent patient cohort. Additionally, as TP53 is an established marker of adverse outcomes in AML and overall chemoresistance, it is likely that this resistance isn’t limited to midostaurin [43, 44].
We also observed that 16 / 34 of the most sensitive samples did not harbor a FLT3 mutation and a majority of differentially expressed genes were independent of FLT3 status. Given the non-specific nature of midostaurin, these patterns would suggest the efficacy of midostaurin outside of FLT3 mutant samples and highlights that additional biological factors, separate from presence or absence of FLT3 mutations, should be considered in predicting midostaurin response. Alternatively, these may also represent samples that are universally sensitive to a broad spectrum of inhibitors. However, additional functional studies are required to better characterize the mechanisms by which these mutations and expression patterns lead to the varied response patterns.
Midostaurin was the first new FDA approved agent for AML patients in over a decade and it is now standard of care to treat FLT3-ITD positive primary AML patients in combination with chemotherapy [45]. Alternative FLT3 inhibitors have been developed, with gilteritinib recently approved for treatment of adult patients with FLT3 mutated relapsed or refractory AML [12, 46]. With multiple FLT3 inhibitors available, it is important to understand the sensitivity mechanisms of each to better personalize therapy in chemo-refractory or relapsed patients. Here, we have leveraged an ex vivo drug sensitivity screen to propose sensitivity mechanisms based on individual mutations and gene expression patterns for both FLT3-ITD positive and FLT3-ITD wild-type samples. For FLT3-ITD positive samples, the increased numbers of patients currently being treated clinically with midostaurin will enable in vivo investigations of these suggested mechanisms, and, while not currently used clinically, these results might suggest the benefit of midostaurin in select FLT3-ITD wild-type patients as well.
Overall, we identify genomic alterations that correlate with midsotaurin response independent of FLT3-ITD status, propose that Ras-Raf-MEK-ERK inhibition in combination therapy could limit resistance to midostaurin, and suggest that within the overall AML population there may be therapeutic benefit of midostaurin in patients with certain expression profiles.
Materials and Methods
Patients
All patients gave consent to participate in this study which leverages an existing dataset from the Beat AML cohort in addition to clinical targeted deep sequencing performed at Oregon Health & Science University (OHSU). Sample collection protocols received approval and guidance from the institutional review boards at OHSU, University of Utah, University of Texas Medical Center (UT Southwestern), Stanford University, University of Miami, University of Colorado, University of Florida, National Institutes of Health (NIH), Fox Chase Cancer Center and University of Kansas (KUMC).
Briefly, peripheral blood, bone marrow, and leukapheresis samples were extracted from all AML patients. Mononuclear cells (MNCs) were isolated by Ficoll gradient centrifugation and cell pellets were snap frozen in liquid nitrogen for subsequent DNA isolation (Qiagen, DNeasy Blood & Tissue Kit). Freshly pelleted cells were lysed immediately in GTC lysate for subsequent RNA isolation (Qiagen, RNeasy Mini Kit), and freshly isolated mononuclear cells were plated into ex vivo drug sensitivity assays within 24 hours of draw (described below).
Skin punch biopsies were collected at the site of Jamshidi needle insertion for subsequent bone marrow biopsies and genomic DNA was isolated for use as matched normal controls for exome sequencing (Qiagen, DNeasy Blood & Tissue Kit).
Drug sensitivity screen
The extracted MNCs were exposed to escalating dose concentration gradients of small-molecule inhibitors – including midostaurin – at a concentration of 0.014, 0.041, 0.123, 0.37, 1.11, 3.33, and 10 μm. The cells were then incubated for 72 hours at 37° C in 5% CO2. Cell viability was then measured by determining the relative number of remaining MNCs via a tetrazolium-based colorimetric assay (CellTiter AQueous One Solution Cell Proliferation Assay; Promega, Madison, WI, USA).
Custom gene panel (GeneTrails) sequencing and variant detection
Sequencing on a gene panel of 42 genes was performed as part of standard clinical care through the CLIA certified Cancer Diagnostics Laboratory at OHSU (GeneTrails). The custom capture panel of 42 genes is a set known to play a role in leukemia pathogenesis, prognosis, or response to therapy and include: ABL1, ASXL1, BCOR, CBL, CBLB, CEBPA, CREBBP, CSF3R, DNMT3A, ETV6, EZH2, FBXW7, FLT3, GATA1, GATA2, HRAS, IDH1, IDH2, IKZF1, IL7R, JAK1, JAK2, JAK3, KDM6A, KIT, KRAS, MPL, NOTCH1, NPM1 NRAS, PAX5, PTPN11, RUNX1, SF3B1, SRSF2, STAT3, SUZ12, TET2, TP53, U2AF1, WT1, and ZRSR2.
Genomic DNA was extracted and purified from blood or bone marrow, and sequenced by next-generation sequencing (NGS) using multiplexed PCR (AmpliSeq primers) and emulsion PCR, followed by semiconductor-based sequencing on an Ion Torrent PGM. Gene segments that were not easily covered by NGS are covered instead by Sanger dideoxy sequencing methods.
The minimum detection for the GeneTrails assay is 5% to 15% mutant allele fraction depending on sequence read depth, with a minimum sequence coverage depth of 100 ×.
Exome sequencing and variant detection
A subset of samples within the Beat AML dataset possessed whole exome sequencing as well. In brief, Illumina Nextera RapidCapture Exome capture probes and protocol were used, giving coverage of 37 Mb of DNA coding regions. Libraries were run on a Hiseq protocol (2500 paired ends, 100 cycle) with five or six lanes per capture group [23].
For genotyping, AML paired/skin biopsies were realigned together and then somatic point mutations were identified with Mutect v1.1.7 and insertions/deletions were called using Varscan2 v2.4.1 [47, 48]. Further filtering for mutations in the paired samples, and in the samples that did not have a matched normal control, is described in the Beat AML cohort [23].
Mutations were combined with GeneTrails by prioritizing those calls identified by GeneTrails and then augmenting any samples without GeneTrails sequencing with the mutations identified by exome sequencing. While the Beat AML dataset included exome-wide mutations, this study focused on those genes mutated in at least 5% of the cohort.
Internal FLT3-ITD and NPM1 mutation detection
Due to the challenge of identifying FLT3-ITD and the common NPM1 four-base pair insertion using the GeneTrails NGS protocol, FLT3-ITD and NPM1 mutation status was confirmed using an internally run PCR assay and capillary electrophoresis as described previously [23].
Derivation of FLT3-ITD and NPM1 consensus calls
FLT3-ITD and NPM1 mutations identified using the internal capillary PCR test (described above) were prioritized over the CLIA/CAP laboratory sequencing (GeneTrails) when available. When GeneTrails results disagreed with the internal testing, samples underwent manual review.
RNA sequencing
The Beat AML dataset was leveraged for RNA-Sequencing across a subset of the samples in the cohort. Briefly, RNA-Sequencing was performed using the Agilent SureSelect Strand-Specific RNA Library Preparation Kit, and sequenced on an Illumina HiSeq 2500 as described previously [23]. The final raw sequencing counts were then used for downstream analyses.
RNA-Seq expression analysis
RNA-Seq analyses were postprocessed using EdgeR v3.7 [49]. Counts per transcript were normalized through conversion to counts per million (cpm). Transcripts were retained if they had values > 1 cpm in at least in 25 of the resistant and 25 of the sensitive samples. The greatest expression transcript per gene was chosen to represent the expression value of that gene. Trimmed mean of M-values (TMM) normalization was applied to account for compositional differences between libraries. Differential expression was performed using glmfit in EdgeR which uses a negative binomial generalized log-linear model to model the normalized read counts for each gene. Significance was determined with an alpha of 0.01 for FDR corrected p-values.
Ex vivo functional drug screens
Ex vivo functional drug screens were performed on freshly isolated mononuclear cells from AML samples as previously described [50]. The tetrazolium-based colorimetric assay produced absorbance values (optical density) that were used to calculate cell viability. For each sample, the cells were incubated with inhibitors in a seven-dose dilution series (from 10 μM, at 1:3 ratio, to 0.014 μM) and viability on day three was normalized to the average all-kill well optical density in each plate. These normalized values were confined to a 0-100 range to produce a response variable that represented the percentage of the average control well viability.
Drug sensitivity was quantified as area under the curve (AUC) with the concentration on log-scale, and calculated via average cell viability across all concentrations. AUC was calculated as the area under the fitted probit curve (via direct integration) using all seven doses as x-values and cell viability with limits from 0 to 100% as the y-value, and then normalizing the AUC values to a 0 to 100 scale.
Statistical analysis
Kruskal–Wallis H test was used to determine significance of differences in drug sensitivity measures between mutant and wild-type groups. P-values were corrected for multiple hypothesis testing using FDR. Statistical analysis was performed in R v.3.4.0.
ACKNOWLEDGMENTS
We would like to acknowledge and thank all the patients who donated their tissues samples.
CONFLICTS OF INTEREST
B.J.D. potential competing interests; SAB: Aileron Therapeutics, Therapy Architects (ALLCRON), Cepheid, Vivid Biosciences, Celgene, RUNX1 Research Program, EnLiven Therapeutics, Gilead Sciences (inactive), Monojul (inactive); SAB & Stock: Aptose Biosciences, Blueprint Medicines, Iterion Therapeutics, Third Coast Therapeutics, GRAIL (SAB inactive); Scientific Founder: MolecularMD (inactive, acquired by ICON); Board of Directors & Stock: Amgen; Board of Directors: Burroughs Wellcome Fund, CureOne; Joint Steering Committee: Beat AML LLS; Founder: VB Therapeutics; Clinical Trial Funding: Novartis, Bristol-Myers Squibb, Pfizer; Royalties from Patent 6958335 (Novartis exclusive license) and OHSU and Dana-Farber Cancer Institute (one Merck exclusive license). C.E.T. potential competing interests; SRA Ignyta Pharmaceuticals (inactive).
FUNDING
This work and M.R. were supported by the American Society of Hematology Physician Scientist Career Development Award. B.J.D. and C.E.T. received support from HHMI. K.W-S was supported through an R01 to B.J.D (NCI R01 CA214428). B.J.D and J.W.T were supported by a U54 (NCI U54 CA224019). The Beat AML dataset was supported by a Leukemia & Lymphoma Society to B.J.D. and J.W.T. and by additional support provided by the Knight Cancer Research Institute (Oregon Health & Science University, OHSU).
References
1. Gallogly MM, Lazarus HM, Cooper BW. Midostaurin: a novel therapeutic agent for patients with FLT3-mutated acute myeloid leukemia and systemic mastocytosis. Ther Adv Hematol. 2017; 8:245–61. https://doi.org/10.1177/2040620717721459. [PubMed].
2. Stone RM, Mandrekar SJ, Sanford BL, Laumann K, Geyer S, Bloomfield CD, Thiede C, Prior TW, Döhner K, Marcucci G, Lo-Coco F, Klisovic RB, Wei A, et al. Midostaurin plus chemotherapy for acute myeloid leukemia with a FLT3 mutation. N Engl J Med. 2017; 377:454–64. https://doi.org/10.1056/NEJMoa1614359. [PubMed].
3. Lam SS, He AB, Leung AY. Treatment of acute myeloid leukemia in the next decade - towards real-time functional testing and personalized medicine. Blood Rev. 2017; 31:418–25. https://doi.org/10.1016/j.blre.2017.08.001. [PubMed].
4. Garcia JS, Stone RM. The development of FLT3 inhibitors in acute myeloid leukemia. Hematol Oncol Clin North Am. 2017; 31:663–80. https://doi.org/10.1016/j.hoc.2017.03.002. [PubMed].
5. Pratz KW, Levis M. How I treat FLT3-mutated AML. Blood. 2017; 129:565–71. https://doi.org/10.1182/blood-2016-09-693648. [PubMed].
6. Nguyen B, Williams AB, Young DJ, Ma H, Li L, Levis M, Brown P, Small D. FLT3 activating mutations display differential sensitivity to multiple tyrosine kinase inhibitors. Oncotarget. 2017; 8:10931–44. https://doi.org/10.18632/oncotarget.14539. [PubMed].
7. Marhäll A, Heidel F, Fischer T, Rönnstrand L. Internal tandem duplication mutations in the tyrosine kinase domain of FLT3 display a higher oncogenic potential than the activation loop D835Y mutation. Ann Hematol. 2018; 97:773–80. https://doi.org/10.1007/s00277-018-3245-5. [PubMed].
8. Larrosa-Garcia M, Baer MR. FLT3 inhibitors in acute myeloid leukemia: current status and future directions. Mol Cancer Ther. 2017; 16:991–1001. https://doi.org/10.1158/1535-7163.MCT-16-0876. [PubMed].
9. Fathi AT, Chen YB. Treatment of FLT3-ITD acute myeloid leukemia. Am J Blood Res. 2011; 1:175–89. [PubMed].
10. Ferrara F, Schiffer CA. Acute myeloid leukaemia in adults. Lancet. 2013; 381:484–95. https://doi.org/10.1016/S0140-6736(12)61727-9. [PubMed].
11. Döhner H, Estey E, Grimwade D, Amadori S, Appelbaum FR, Büchner T, Dombret H, Ebert BL, Fenaux P, Larson RA, Levine RL, Lo-Coco F, Naoe T, et al. Diagnosis and management of AML in adults: 2017 ELN recommendations from an international expert panel. Blood. 2017; 129:424–47. https://doi.org/10.1182/blood-2016-08-733196. [PubMed].
12. Perl AE, Altman JK, Cortes J, Smith C, Litzow M, Baer MR, Claxton D, Erba HP, Gill S, Goldberg S, Jurcic JG, Larson RA, Liu C, et al. Selective inhibition of FLT3 by gilteritinib in relapsed or refractory acute myeloid leukaemia: a multicentre, first-in-human, open-label, phase 1-2 study. Lancet Oncol. 2017; 18:1061–75. https://doi.org/10.1016/S1470-2045(17)30416-3. [PubMed].
13. Cortes J, Perl AE, Döhner H, Kantarjian H, Martinelli G, Kovacsovics T, Rousselot P, Steffen B, Dombret H, Estey E, Strickland S, Altman JK, Baldus CD, et al. Quizartinib, an FLT3 inhibitor, as monotherapy in patients with relapsed or refractory acute myeloid leukaemia: an open-label, multicentre, single-arm, phase 2 trial. Lancet Oncol. 2018; 19:889–903. https://doi.org/10.1016/S1470-2045(18)30240-7. [PubMed].
14. Randhawa JK, Kantarjian HM, Borthakur G, Thompson PA, Konopleva M, Daver N, Pemmaraju N, Jabbour E, Kadia TM, Estrov Z, Ramachandran A, Paradela J, Andreef M, et al. Results of a Phase II Study of Crenolanib in Relapsed/Refractory Acute Myeloid Leukemia Patients (Pts) with Activating FLT3 Mutations. Blood. 2014; 124:389. https://doi.org/10.1182/blood.V124.21.389.389.
15. El Fakih R, Rasheed W, Hawsawi Y, Alsermani M, Hassanein M. Targeting FLT3 Mutations in Acute Myeloid Leukemia. Cells. 2018; 7:4. https://doi.org/10.3390/cells7010004. [PubMed].
16. Fiedler W, Kayser S, Kebenko M, Janning M, Krauter J, Schittenhelm M, Götze K, Weber D, Göhring G, Teleanu V, Thol F, Heuser M, Döhner K, et al. A phase I/II study of sunitinib and intensive chemotherapy in patients over 60 years of age with acute myeloid leukaemia and activating FLT3 mutations. Br J Haematol. 2015; 169:694–700. https://doi.org/10.1111/bjh.13353. [PubMed].
17. Knapper S, Burnett AK, Littlewood T, Kell WJ, Agrawal S, Chopra R, Clark R, Levis MJ, Small D. A phase 2 trial of the FLT3 inhibitor lestaurtinib (CEP701) as first-line treatment for older patients with acute myeloid leukemia not considered fit for intensive chemotherapy. Blood. 2006; 108:3262–70. https://doi.org/10.1182/blood-2006-04-015560. [PubMed].
18. Uy GL, Mandrekar SJ, Laumann K, Marcucci G, Zhao W, Levis MJ, Klepin HD, Baer MR, Powell BL, Westervelt P, DeAngelo DJ, Stock W, Sanford B, et al. A phase 2 study incorporating sorafenib into the chemotherapy for older adults with FLT3-mutated acute myeloid leukemia: CALGB 11001. Blood Adv. 2017; 1:331–40. https://doi.org/10.1182/bloodadvances.2016003053. [PubMed].
19. Schlenk RF, Weber D, Fiedler W, Salih HR, Wulf G, Salwender H, Schroeder T, Kindler T, Lübbert M, Wolf D, Westermann J, Kraemer D, Götze KS, et al, and German-Austrian AML Study Group. Midostaurin added to chemotherapy and continued single-agent maintenance therapy in acute myeloid leukemia with FLT3-ITD. Blood. 2019; 133:840–51. https://doi.org/10.1182/blood-2018-08-869453. [PubMed].
20. Berger T, Rozovski U, Moshe Y, Yaari S, Frisch A, Hellmann I, Apel A, Aviram A, Koren-Michowitz M, Yeshurun M, Ram R, Raanani P, Ofran Y, Wolach O. Midostaurin in combination with intensive chemotherapy is safe and associated with improved remission rates and higher transplantation rates in first remission-a multi-center historical control study. Ann Hematol. 2019; 98:2711–17. https://doi.org/10.1007/s00277-019-03795-8. [PubMed].
21. Maziarz RT, Patnaik MM, Scott BL, Mohan SR, Deol A, Rowley SD, Kim DD, Haines K, Bonifacio G, Rine P, Fernandez HF. Radius: A Phase 2, Randomized Trial of Standard of Care (SOC) with or without Midostaurin to Prevent Relapse Following Allogeneic Hematopoietic Stem Cell Transplant (alloHSCT) in Patients (pts) with FLT3-Itd-Mutated Acute Myeloid Leukemia (AML). Blood. 2016; 128:2248. https://doi.org/10.1182/blood.V128.22.2248.2248.
22. Abbas HA, Alfayez M, Kadia T, Ravandi-Kashani F, Daver N. Midostaurin in acute myeloid leukemia: an evidence-based review and patient selection. Cancer Manag Res. 2019; 11:8817–28. https://doi.org/10.2147/CMAR.S177894. [PubMed].
23. Tyner JW, Tognon CE, Bottomly D, Wilmot B, Kurtz SE, Savage SL, Long N, Schultz AR, Traer E, Abel M, Agarwal A, Blucher A, Borate U, et al. Functional genomic landscape of acute myeloid leukaemia. Nature. 2018; 562:526–31. https://doi.org/10.1038/s41586-018-0623-z. [PubMed].
24. Patel JP, Gönen M, Figueroa ME, Fernandez H, Sun Z, Racevskis J, Van Vlierberghe P, Dolgalev I, Thomas S, Aminova O, Huberman K, Cheng J, Viale A, et al. Prognostic relevance of integrated genetic profiling in acute myeloid leukemia. N Engl J Med. 2012; 366:1079–89. https://doi.org/10.1056/NEJMoa1112304. [PubMed].
25. Reddy PN, Sargin B, Choudhary C, Stein S, Grez M, Müller-Tidow C, Berdel WE, Serve H, Brandts CH, and Study Alliance Leukemia (SAL). SOCS1 cooperates with FLT3-ITD in the development of myeloproliferative disease by promoting the escape from external cytokine control. Blood. 2012; 120:1691–702. https://doi.org/10.1182/blood-2010-08-301416. [PubMed].
26. Janke H, Pastore F, Schumacher D, Herold T, Hopfner KP, Schneider S, Berdel WE, Büchner T, Woermann BJ, Subklewe M, Bohlander SK, Hiddemann W, Spiekermann K, Polzer H. Activating FLT3 mutants show distinct gain-of-function phenotypes in vitro and a characteristic signaling pathway profile associated with prognosis in acute myeloid leukemia. PLoS One. 2014; 9:e89560. https://doi.org/10.1371/journal.pone.0089560. [PubMed].
27. Valk PJ, Verhaak RG, Beijen MA, Erpelinck CA, Barjesteh van Waalwijk van Doorn-Khosrovani S, Boer JM, Beverloo HB, Moorhouse MJ, van der Spek PJ, Löwenberg B, Delwel R. Prognostically useful gene-expression profiles in acute myeloid leukemia. N Engl J Med. 2004; 350:1617–28. https://doi.org/10.1056/NEJMoa040465. [PubMed].
28. Jacamo R, Ling X, Wang Z, Ma W, Zhang M, Ruvolo PP, Ruvolo VR, Lowe SW, Zuber J, Konopleva M, Davis RE, Andreeff M. AML Genotype-Specific and Non-Specific Regulation of Mesenchymal Stromal Cell Transcriptome in the Bone Marrow Microenvironment. Blood. 2014; 124:1586. https://doi.org/10.1182/blood.V124.21.1586.1586.
29. Bullinger L, Döhner K, Kranz R, Stirner C, Fröhling S, Scholl C, Kim YH, Schlenk RF, Tibshirani R, Döhner H, Pollack JR. An FLT3 gene-expression signature predicts clinical outcome in normal karyotype AML. Blood. 2008; 111:4490–95. https://doi.org/10.1182/blood-2007-09-115055. [PubMed].
30. Cauchy P, James SR, Zacarias-Cabeza J, Ptasinska A, Imperato MR, Assi SA, Piper J, Canestraro M, Hoogenkamp M, Raghavan M, Loke J, Akiki S, Clokie SJ, et al. Chronic FLT3-ITD signaling in acute myeloid leukemia is connected to a specific chromatin signature. Cell Rep. 2015; 12:821–36. https://doi.org/10.1016/j.celrep.2015.06.069. [PubMed].
31. Subramanian A, Tamayo P, Mootha VK, Mukherjee S, Ebert BL, Gillette MA, Paulovich A, Pomeroy SL, Golub TR, Lander ES, Mesirov JP. Gene set enrichment analysis: a knowledge-based approach for interpreting genome-wide expression profiles. Proc Natl Acad Sci USA. 2005; 102:15545–50. https://doi.org/10.1073/pnas.0506580102. [PubMed].
32. Llinàs-Arias P, Esteller M. Epigenetic inactivation of tumour suppressor coding and non-coding genes in human cancer: an update. Open Biol. 2017; 7:170152. https://doi.org/10.1098/rsob.170152. [PubMed].
33. Al-Asadi MG, Brindle G, Castellanos M, May ST, Mills KI, Russell NH, Seedhouse CH, Pallis M. A molecular signature of dormancy in CD34+ CD38- acute myeloid leukaemia cells. Oncotarget. 2017; 8:111405–18. https://doi.org/10.18632/oncotarget.22808. [PubMed].
34. Chen YB, Ren SM, Li SD, Du Z. Prognostic significance of osteopontin in acute myeloid leukemia: a meta-analysis. Mol Clin Oncol. 2017; 7:275–80. https://doi.org/10.3892/mco.2017.1302. [PubMed].
35. Whitman SP, Maharry K, Radmacher MD, Becker H, Mrózek K, Margeson D, Holland KB, Wu YZ, Schwind S, Metzeler KH, Wen J, Baer MR, Powell BL, et al. FLT3 internal tandem duplication associates with adverse outcome and gene- and microRNA-expression signatures in patients 60 years of age or older with primary cytogenetically normal acute myeloid leukemia: a Cancer and Leukemia Group B study. Blood. 2010; 116:3622–26. https://doi.org/10.1182/blood-2010-05-283648. [PubMed].
36. Shah K, Moharram SA, Kazi JU. Acute leukemia cells resistant to PI3K/mTOR inhibition display upregulation of P2RY14 expression. Clin Epigenetics. 2018; 10:83. https://doi.org/10.1186/s13148-018-0516-x. [PubMed].
37. Hernandez-Muñoz I, Malumbres M, Leonardi P, Pellicer A. The rgr oncogene (homologous to RalGDS) induces transformation and gene expression by activating ras, ral and rho mediated pathways. Oncogene. 2000; 19:2745–57. https://doi.org/10.1038/sj.onc.1203586. [PubMed].
38. Yang W, Soares J, Greninger P, Edelman EJ, Lightfoot H, Forbes S, Bindal N, Beare D, Smith JA, Thompson IR, Ramaswamy S, Futreal PA, Haber DA, et al. Genomics of drug sensitivity in cancer (GDSC): a resource for therapeutic biomarker discovery in cancer cells. Nucleic Acids Res. 2013; 41:D955–61. https://doi.org/10.1093/nar/gks1111. [PubMed].
39. McMahon CM. Mechanisms of Acquired Resistance to Gilteritinib Therapy in Relapsed and Refractory FLT3-Mutated Acute Myeloid Leukemia. Blood. 2017; 130:295.
40. Traer E, Martinez J, Javidi-Sharifi N, Agarwal A, Dunlap J, English I, Kovacsovics T, Tyner JW, Wong M, Druker BJ. FGF2 from marrow microenvironment promotes resistance to FLT3 inhibitors in acute myeloid leukemia. Cancer Res. 2016; 76:6471–82. https://doi.org/10.1158/0008-5472.CAN-15-3569. [PubMed].
41. Amatangelo MD, Quek L, Shih A, Stein EM, Roshal M, David MD, Marteyn B, Farnoud NR, de Botton S, Bernard OA, Wu B, Yen KE, Tallman MS, et al. Enasidenib induces acute myeloid leukemia cell differentiation to promote clinical response. Blood. 2017; 130:732–41. https://doi.org/10.1182/blood-2017-04-779447. [PubMed].
42. DiNardo CD, Tiong IS, Quaglieri A, MacRaild S, Loghavi S, Brown FC, Thijssen R, Pomilio G, Ivey A, Salmon JM, Glytsou C, Fleming SA, Zhang Q, et al. Molecular patterns of response and treatment failure after frontline venetoclax combinations in older patients with AML. Blood. 2020; 135:791–803. https://doi.org/10.1182/blood.2019003988. [PubMed].
43. Papayannidis C, Ferrari A, Paolini S, Baldazzi C, Sartor C, Chiara AM, Marconi G, Parisi S, Volpato F, Iacobucci I, Padella A, Guadagnuolo V. Very Poor Outcome and Chemoresistance of Acute Myeloid Leukemia Patients with TP53 Mutations: Correlation with Complex Karyotype and Clinical Outcome. Blood. 2014; 124:484. https://doi.org/10.1182/blood.V124.21.484.484.
44. Kadia TM, Jain P, Ravandi F, Garcia-Manero G, Andreef M, Takahashi K, Borthakur G, Jabbour E, Konopleva M, Daver NG, Dinardo C, Pierce S, Kanagal-Shamanna R, et al. TP53 mutations in newly diagnosed acute myeloid leukemia: clinicomolecular characteristics, response to therapy, and outcomes. Cancer. 2016; 122:3484–91. https://doi.org/10.1002/cncr.30203. [PubMed].
45. Levis M. Midostaurin approved for FLT3-mutated AML. Blood. 2017; 129:3403–06. https://doi.org/10.1182/blood-2017-05-782292. [PubMed].
46. U.S. Federal Drug Administration. FDA approves gilteritinib for relapsed or refractory acute myeloid leukemia (AML) with a FLT3 mutation. (2018).
47. Koboldt DC, Zhang Q, Larson DE, Shen D, McLellan MD, Lin L, Miller CA, Mardis ER, Ding L, Wilson RK. VarScan 2: somatic mutation and copy number alteration discovery in cancer by exome sequencing. Genome Res. 2012; 22:568–76. https://doi.org/10.1101/gr.129684.111. [PubMed].
48. Cibulskis K, Lawrence MS, Carter SL, Sivachenko A, Jaffe D, Sougnez C, Gabriel S, Meyerson M, Lander ES, Getz G. Sensitive detection of somatic point mutations in impure and heterogeneous cancer samples. Nat Biotechnol. 2013; 31:213–19. https://doi.org/10.1038/nbt.2514. [PubMed].
49. McCarthy DJ, Chen Y, Smyth GK. Differential expression analysis of multifactor RNA-seq experiments with respect to biological variation. Nucleic Acids Res. 2012; 40:4288–97. https://doi.org/10.1093/nar/gks042. [PubMed].
50. Tyner JW, Yang WF, Bankhead A 3rd, Fan G, Fletcher LB, Bryant J, Glover JM, Chang BH, Spurgeon SE, Fleming WH, Kovacsovics T, Gotlib JR, Oh ST, et al. Kinase pathway dependence in primary human leukemias determined by rapid inhibitor screening. Cancer Res. 2013; 73:285–96. https://doi.org/10.1158/0008-5472.CAN-12-1906. [PubMed].