
Introduction
Gliomas originate in the brain and are the most common type of malignant primary brain tumor. High grade gliomas are comprised of histologic grade III (anaplastic astrocytoma, and anaplastic oligodendroglioma) and grade IV (glioblastoma multiforme) tumors and account for the majority of diffuse gliomas. Despite being histologic grade II, low-grade gliomas eventually progress and transform to a higher grade. Therefore, it is increasingly appreciated that histologic grade alone does not account for the variability in outcome among patients with these cancers. In fact, disease prognosis depends on multiple factors including both clinical and molecular features of the tumor.
Patients with mutation of the isocitrate dehydrogenase (IDH) gene demonstrate markedly improved clinical outcomes compared to those with the wild-type tumor [1]. IDH status has been recognized to be of central biologic and prognostic import, and is now incorporated in the diagnostic deifinition of diffuse gliomas in the updated Word Health Organization diagnostic compendium for CNS tumors [2]. The presence of IDH mutation plays a significant role in response to treatment including extent of surgical resection [3] and chemoradiation [4]. Stratification of patients based on IDH status in certain clinical trials may be indicated [5]. Patients with wild type tumors also show lower cognitive function compared to the mutant variant [6]. Therefore, baseline prediction of IDH status is of great clinical importance for therapeutic decision making, including choice of therapeutic intervention such as IDH inhibitors and the decision to initiate treatment early. Additionally, presurgical knowledge of IDH genotype would be invaluable for risk stratification in clinical research and clinical counseling surrounding the individual patient’s disease.
IDH genotype is typically determined from biopsy or resection. However, several studies have demonstrated that conventional, pre-operative MRI can be used to non-invasively predict IDH status [7–10]. These radiomic approaches involve extracting relevant radiographic features believed to be associated with aspects of tumor phenotype. Multimodal imaging sequences are typically employed including FLAIR, T2, T1 pre-contrast, T1 post-contrast and DWI. Feature extraction focuses on tumor regions of interest. Other methods include MRS detection of 2-hydroxyglutarate accumulation in the tumor, which is associated with mutation [11].
However, our group and others have demonstrated that focal tumors are accompanied by widespread disruption of the entire brain [6, 12]. Importantly, we have shown a discriminable pattern of large-scale connectome organization associated with IDH status suggesting that brain networks reflect the molecular properties of the tumor [6]. The brain incorporates both biologic and environmental processes in a bidirectional manner, providing a uniquely parsimonious and sometimes more sensitive summary of key diagnostic and prognostic features. Brain network organization is highly associated with age, gender, education level and socioeconomic status [13–16] and reflects effects of cancer pathogenesis and treatment [17]. These are all known prognostic factors in diffuse glioma represented within whole-brain network organization.
Connectomes are graphs that model the brain as a network of nodes (regions) and edges (connections). Nodes typically reflect some discrete parcellation of cortical and subcortical processing units and can be defined microscopically to macroscopically. Edges are defined anatomically (e.g. measurable white matter pathway) and/or statistically (e.g. correlation between functional time series). Our group and others have demonstrated significant connectome disorganization in patients with diffuse glioma [6, 12]. One previous study showed that pre-surgical, whole brain connectome features were accurate predictors of high grade glioma survival [18] and another indicated that connectome properties were correlated with progression-free survival [12].
For this study, we aimed to use gray matter connectomes obtained from non-contrast, T1-weighted MRI scans. T1 MRI is routinely acquired pre-surgically as part of standard of care for patients with brain tumors. T1 MRI is used ubiquitously in neuroimaging research to measure brain volumes and there exist coordinated variations in gray matter volumes that make connectome construction possible [19]. These structural covariance networks are highly heritable and are believed to reflect underlying axonal connections as well as common neurodevelopmental and neuroplastic processes [19]. Robust alterations in gray matter connectomes are regularly observed in various neurologic syndromes [20]. As noted above, we demonstrated that gray matter connectomes can be used to distinguish between IDH variants of high grade glioma [6]. We hypothesized that pre-surgical gray matter connectome features would accurately predict IDH status in patients with diffuse glioma.
Results
As shown in Table 1, the mean age of patients was 43.85 +/– 15.12 years and 62% of patients were male. All histologic grades of diffuse glioma were represented: grade II (43%), grade III (27%), and grade IV (30%). The majority were of astrocytic histology (73%), and over half were IDH mutant (63%). Glioma involvement of the frontal lobe was most common (50%) followed by temporal lobe (28%) and 14% of patients had a multifocal tumor. A minority (N = 41, 18%) had MGMT status available and only 21% had available preoperative KPS (within 3 days prior to surgery).
Table 1: Patient characteristics
| N = 234 | |
| IDH (Mutant) | 148 (63%) |
| Age | Mean = 43.85 +/– 15.12 Range = 18–82 |
| Sex (Male) | 146 (62%) |
| Grade II | 101 (43%) |
| Grade III | 63 (27%) |
| Grade IV | 70 (30%) |
| Oligodendroglioma | 57 (24%) |
| Astrocytoma | 170 (73%) |
| Oliogoastrocytoma | 7 (3%) |
| Tumor Hemisphere (Left) | 168 (72%) |
| Tumor Location (Primary) | |
| Frontal | 117 (50%) |
| Insular | 17 (7%) |
| Occipital | 1 (.4%) |
| Parietal | 34 (15%) |
| Temporal | 65 (28%) |
| Multifocal Tumor | 33 (14%) |
| MGMT Promoter Methylation (N = 41) | Positive: 24 (59%) Negative: 17 (41%) |
| KPS (N = 51) | 100: 15 (29%) 90: 21 (41%) 80: 11 (22%) 70: 4 (8%) |
MLP and RF classifiers demonstrated the best performance in predicting IDH genotype with AUCs of 0.85 and 0.94, respectively. LR and SVM showed lower accuracies with AUCs of 0.76 and 0.77, respectively (Table 3, Figure 1).
Table 2: Machine learning approaches
| Classifier | Description | Advantages | Tuning Parameters |
|---|---|---|---|
| Random Forest (RF) [44] | Ensemble of decision trees each trained on a random subset of features | Aggregates multiple independent classifiers, scale invariant, implicit feature selection, resistant to overfitting | ntree = 1000 mtry = 7 [log2(nfeats)+1] |
| Support Vector Machine (SVM) [45] | Defines an optimal hyperplane that maximizes the margin between classes | Kernel trick can solve complex problems, can handle imbalanced classes by weighting misclassification penalty | C = 1.0 |
| Logistic Regression (LR) [46] | Multinomial logistic regression model with a ridge estimator | Simple, highly interpretable | ridge value = 1.0E-8 |
| Multilayer Perceptron (MLP) [47] | Simple model of a biological brain that implements backpropagation | Can generalize in non-local ways akin to intelligent behavior, inherent feature selection | learning rate = 0.3 momentum = 0.2 |
Table 3: Machine learning model performance
| Features | Model | Accuracy | Sensitivity | Specificity | AUC |
|---|---|---|---|---|---|
| 90 connectome efficiencies, brain volume, network degree, network size | RF | 86% | 89% | 83% | .94 |
| SVM | 77% | 79% | 75% | .77 | |
| LR | 78% | 84% | 73% | .76 | |
| MLP | 80% | 84% | 77% | .85 | |
| 90 connectome efficiencies, brain volume, network degree, network size, age, tumor hemisphere, tumor lobe | RF | 89% | 90% | 89% | .95 |
| Age, tumor hemisphere, tumor lobe | RF | 77% | 79% | 76% | .87 |
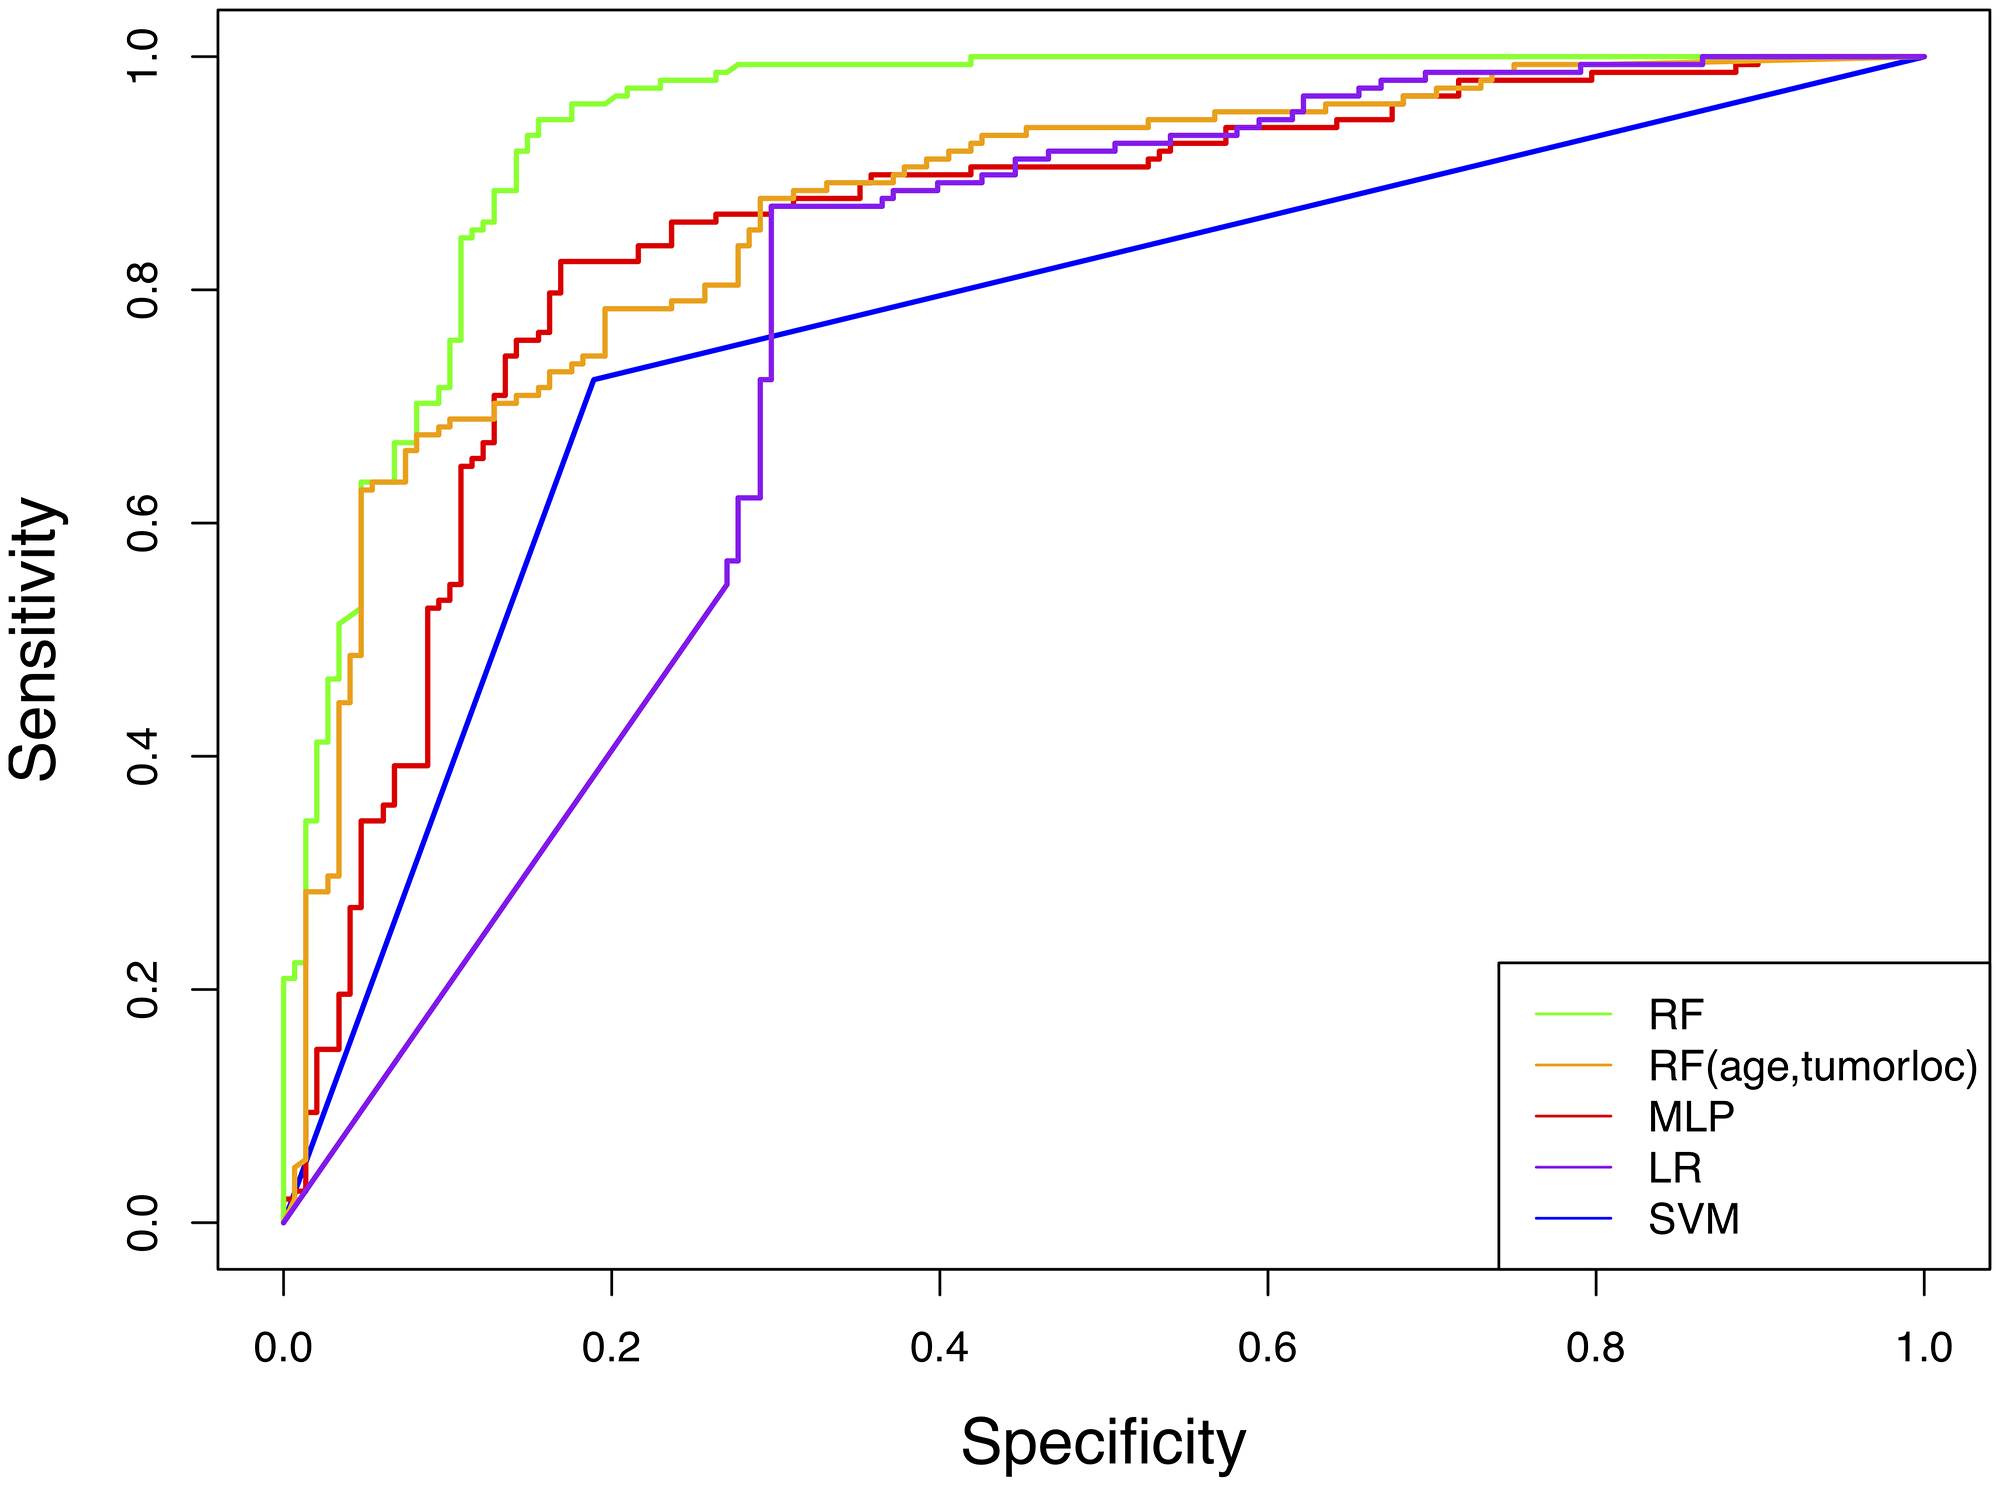
Figure 1: Receiver operator characteristic (ROC) curves for machine learning models predicting IDH genotype from connectome features. RF = random forest, MLP = multilayer perceptron, LR = logistic regression, SVM = support vector machine.
The RF AUC was significantly higher than that of LR (p < 0.001), SVM (p < 0.001) and MLP (p = 0.012). MLP AUC was moderately higher than SVM (p = 0.042).
Feature selection did not seem to affect RF performance. Mean AUC for RFE was 0.91 +/– 0.05 and 0.92 +/– 0.04 for elastic net (Figure 2).
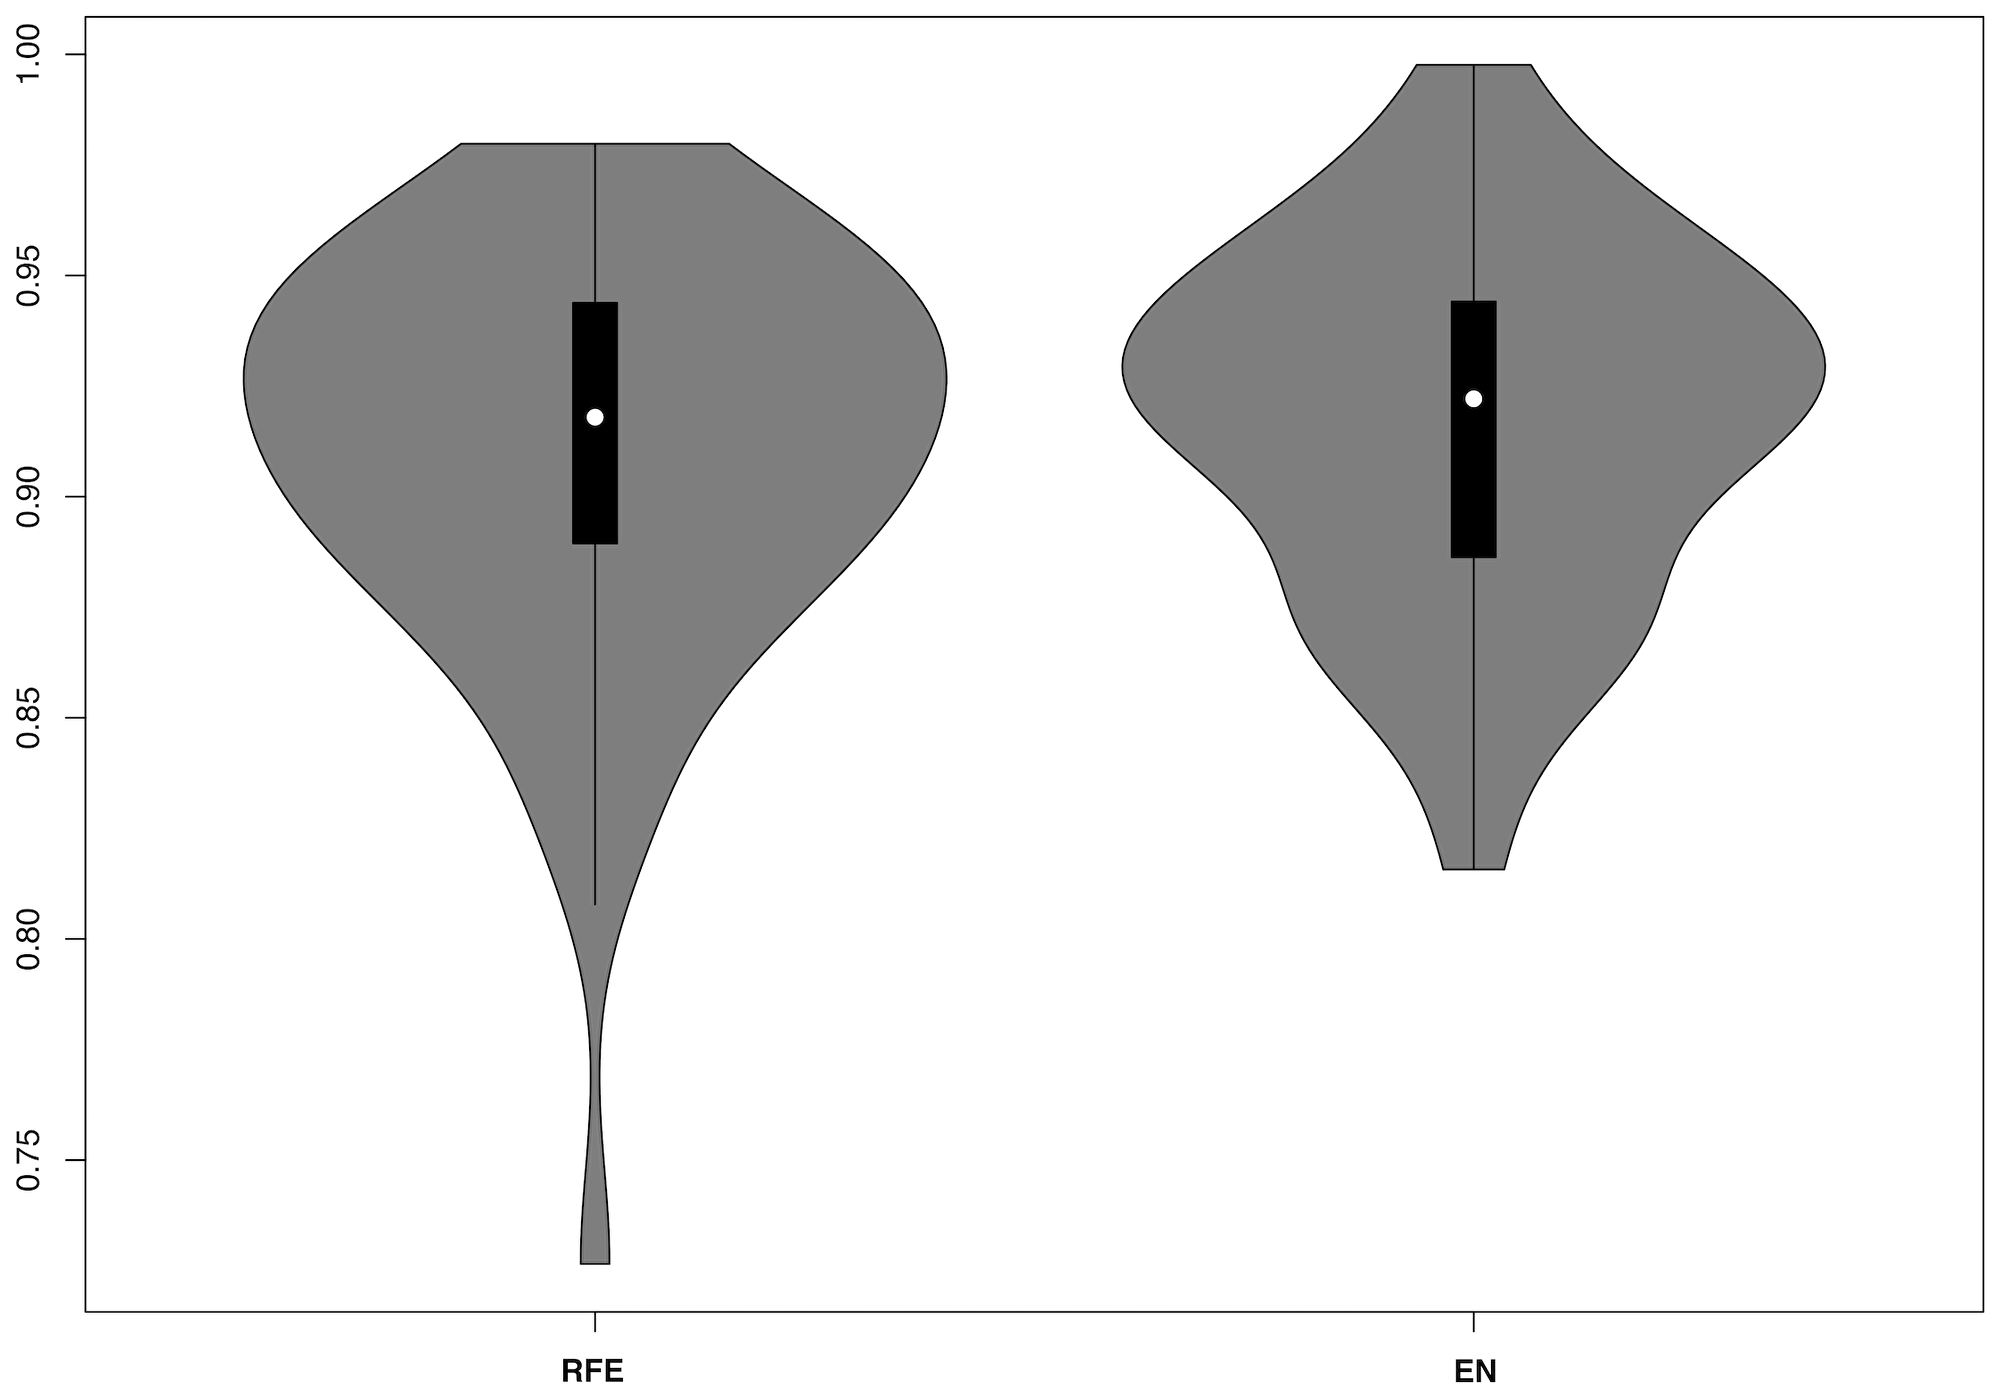
Figure 2: Violin plots for RF model AUCs including nested recursive feature elimination (RFE) or elastic net (EN) regression.
Adding age and tumor location to the RF model slightly increased accuracy (AUC = 0.95) but not significantly (p = 0.413). An RF model with only age and tumor location yielded an AUC of 0.87 (Table 3, Figure 1), which was significantly lower than the connectome RF model (p = 0.004).
Discussion
We innovatively evaluated whole-brain connectome features with common machine learning algorithms to predict IDH genotype in 234 patients with diffuse glioma. Classifiers achieved AUCs of 0.76 to 0.94, with RF demonstrating the best performance. Our approach yielded results that were highly similar to those of radiomic methods. Zhang et al. reported an RF AUC of 0.92 for predicting IDH status from preoperative MRI radiomic features in 120 patients with grades III or IV glioma [8]. A study of 165 patients with low grade tumors showed an RF AUC of 0.79 [21]. Lu and colleagues reported higher accuracies (89–92%) for their RF radiomic models but in small, separate samples of high (N = 18) and low grade (N = 12) glioma [22]. Distinct from these studies, our method was applied across all histologic grades and phenotypes of diffuse gliomas. A recent radiomics study that also combined patients with low and high grade gliomas (N = 126) demonstrated a comparable RF AUC of 0.93 [10].
In addition to the equal or better performance of our models, our connectome approach presents potential advantages. Our method requires a single, standard of care, non-contrast MRI sequence that can be acquired in 5 minutes or less. Tumor segmentation required for radiomics feature extraction is typically manual or semi-manual which can be very time-consuming and complex. There are established, open source connectome software tools currently available [23] that could be integrated into clinical workflows and connectome measurement is computationally efficient. Connectome properties can provide insight regarding other factors important for clinical management of patients with glioma including cognitive outcomes. However, connectome features are affected by factors including choice of parcellation scheme, topological property and thresholding method, which should be carefully considered.
Our findings support the assertion by Wu et al. that RF be the preferred approach for predicting IDH genotype in patients with gliomas [10]. In addition to the advantages listed in Table 2, RF models are versatile, have low computational cost, involve simplistic implementation, are able to handle nonlinear data, high dimensional data and small sample sizes, and exhibit high performance even without parameter tuning [24]. The main disadvantage of RF is the “black box” nature, meaning the resultant models are very difficult to interpret given that they reflect a combination of multiple decision trees. We did not observe an advantage for using feature selection in the RF model. Radiomics tends to produce a much larger feature set necessitating feature reduction in most cases. However, the use of larger parcellation schemes and/or smaller sample sizes may require feature reduction when predicting IDH status from connectomes in patients with gliomas. The addition of age and tumor location to the RF model resulted in a marginal, nonsignificant change in accuracy, consistent with a previous radiomics study showing that age had no effect on model accuracy [7]. The connectome RF model showed a 10% improvement in sensitivity over the clinical RF model (age, tumor location only), a difference that was statistically significant and also likely clinically meaningful to clinicians and patients. However, the clinical model’s performance was excellent and could potentially be improved in future studies such that imaging features are unnecessary. It is also important to note that the highest performance involved a combined connectome and clinical model. Imaging models are inherently more computationally intensive than clinical only models, but it cannot be concluded currently if one approach is robust enough to dismiss the other. All of our models, including the clinical model, require further validation in independent samples.
In addition to novel methods that contribute to ongoing refinement of preoperative IDH status prediction, applying connectomics to this line of research also provides insights regarding the potential neurobiologic effects of IDH mutation. As noted above, our previous study of patients with high grade astrocytoma demonstrated significantly greater connectome disruption and cognitive dysfunction in patients with an IDH wild type tumor compared to those with a mutant tumor, suggesting that differences in lesion momentum and infiltration can affect the entire connectome [6]. The specific mechanisms for these differential effects are currently unclear but may involve known molecular aspects of IDH mutation.
Genes that influence vascular biology, such as VEGF and TGF-β2, are highly expressed in IDH wild type tumors [25]. As a result, these tumors are more angiogenic, show greater cerebral blood volume, higher permeability, and alterations in pericyte and endothelial cell function in comparison to their IDH mutant counterparts [26]. While cerebral vessel disease affects brain structural connectivity [16], it remains to be proven that the vascular phenotype of IDH wild type gliomas contribute to disrupted connectivity differently than that of the mutant variant. IDH mutant tumors are more immunologically quiescent, with fewer tumor infiltrating lymphocytes and less PD-L1 receptors [27], and have reduced expression of genes fundamental to mounting a T-cell response in and around the tumor bed [28]. Inflammatory response is associated with a range of neuropathologies and is thought to contribute to neurodegeneration [29–31]. As activated immune cells are neurotoxic in the absence of any antigen specificity [32, 33], the contribution of a relatively inflammatory microenvironment in IDH wild type gliomas to brain connectivity and integrity warrants further exploration.
D(2)-hydroxyglutarate, a metabolite of IDH mutant cells, exerts an excitatory impact on cultured normal neurons through activation of NMDA receptors [34]. This finding was novel in our understanding of the relationship between glioma cells and the surrounding brain and supports the concept of oncometabolites influencing normal neuronal activity. Mutant IDH reduces the production of NADPH in gliomas [35]. NADPH oxidase has been identified as a major contributor to disease pathology in several neurologic conditions, including amyotrophic lateral sclerosis, Alzheimer’s disease, and Parkinson’s disease. Inhibition pharmacologically of NADPH oxidase enzymes is neuroprotective [36], whether the neurologic insult is degenerative, ischemic, or traumatic [37, 38]. As such, it may be inferred that IDH mutant gliomas, with less NADPH, may have less oxidative toxicity to the surrounding neurons.
In summary, non-invasively predicting IDH status in patients with gliomas from preoperative MRI is a promising line of research with significant clinical relevance. Connectomics is state-of-the art methodology in neuroimaging and neuroscience to date but few if any prior studies have evaluated connectomes to predict IDH genotype. Given the distinct trajectory dependent on IDH status, focusing on molecular profiles rather than histologic grade to determine clinical trials eligibility may become increasingly common, making early definition of IDH subtype imperative. Retrospective data also suggests that patients with IDH mutant gliomas may derive greater benefit from gross total resection than their wild type counterparts [39]. As such, knowledge of IDH subtype pre-operatively may have important implications for preoperative planning, and influence the neurosurgeon’s aggressiveness in removing all visible disease.
We examined four classic machine learning algorithms but there are many others that might apply. We were very vigilant regarding spatial normalization and did not experience any normalization failures, which many studies ignore or fail to mention. However, future connectome studies may require problematic scans to be considered for repair via lesion masking or even exclusion. We focused on connectome features based on prior literature but other connectome properties may be more important. There are also alternative methods for constructing connectomes with respect to node/edge definition, and thresholding, among others, and it is possible that multi-modal neuroimaging models would provide an advantage for prediction. Next generation sequencing for IDH genotype was not available for this retrospective sample and therefore some patients with mutation may have been misidentified. Finally, our connectome, clinical and connectome/clinical classification models require further validation using an independent dataset to determine their values in predicting IDH status relative to computational effort. Despite these limitations, our findings suggest that connectomics is a promising approach for predicting IDH genotype from conventional MRI. Importantly, given the prognostic and biologic information supplied by the connectome, it may serve as a valuable tool to follow therapeutic response through the disease course, offering greater depth of what is occurring with the tumor and surrounding brain than standard MRI sequences and clinical data alone.
Materials and Methods
Patient characteristics
We retrospectively identified adult (age 18 or older) patients with histopathologically confirmed WHO grade II–IV gliomas and known IDH genotype from biopsy/resection who were newly diagnosed and first treated at The University of Texas MD Anderson Cancer Center. A total of 234 patients met these criteria and also had an available pre-surgical, T1 MRI acquired at 3 Tesla. Patients were treated during the years of 1996–2018. MRI, demographics, genotype and other clinical data were extracted from the electronic medical record as well as the IRB-approved prospective Department of Neuro-Oncology protocol (PROACTIVE, 2012–0441). IDH status was determined via immunohistochemistry. This study was approved by the MD Anderson Cancer Center Institutional Review Board.
MRI preprocessing and connectome construction
Figure 3 summarizes MRI analysis procedures. Gray matter volumes were segmented from pre-surgical, T1-weighted MRI using voxel-based morphometry (VBM) via VBM8 Toolbox and Statistical Parametric Mapping 8 software (Wellcome Trust Centre for Neuroimaging, London, UK). We employed DARTEL, which uses a large deformation framework to preserve topology and employs customized, sample-specific templates resulting in superior image registration, even in lesioned brains, compared to other automated methods [40]. Successful normalization was confirmed using visual and quantitative quality assurance methods [6].
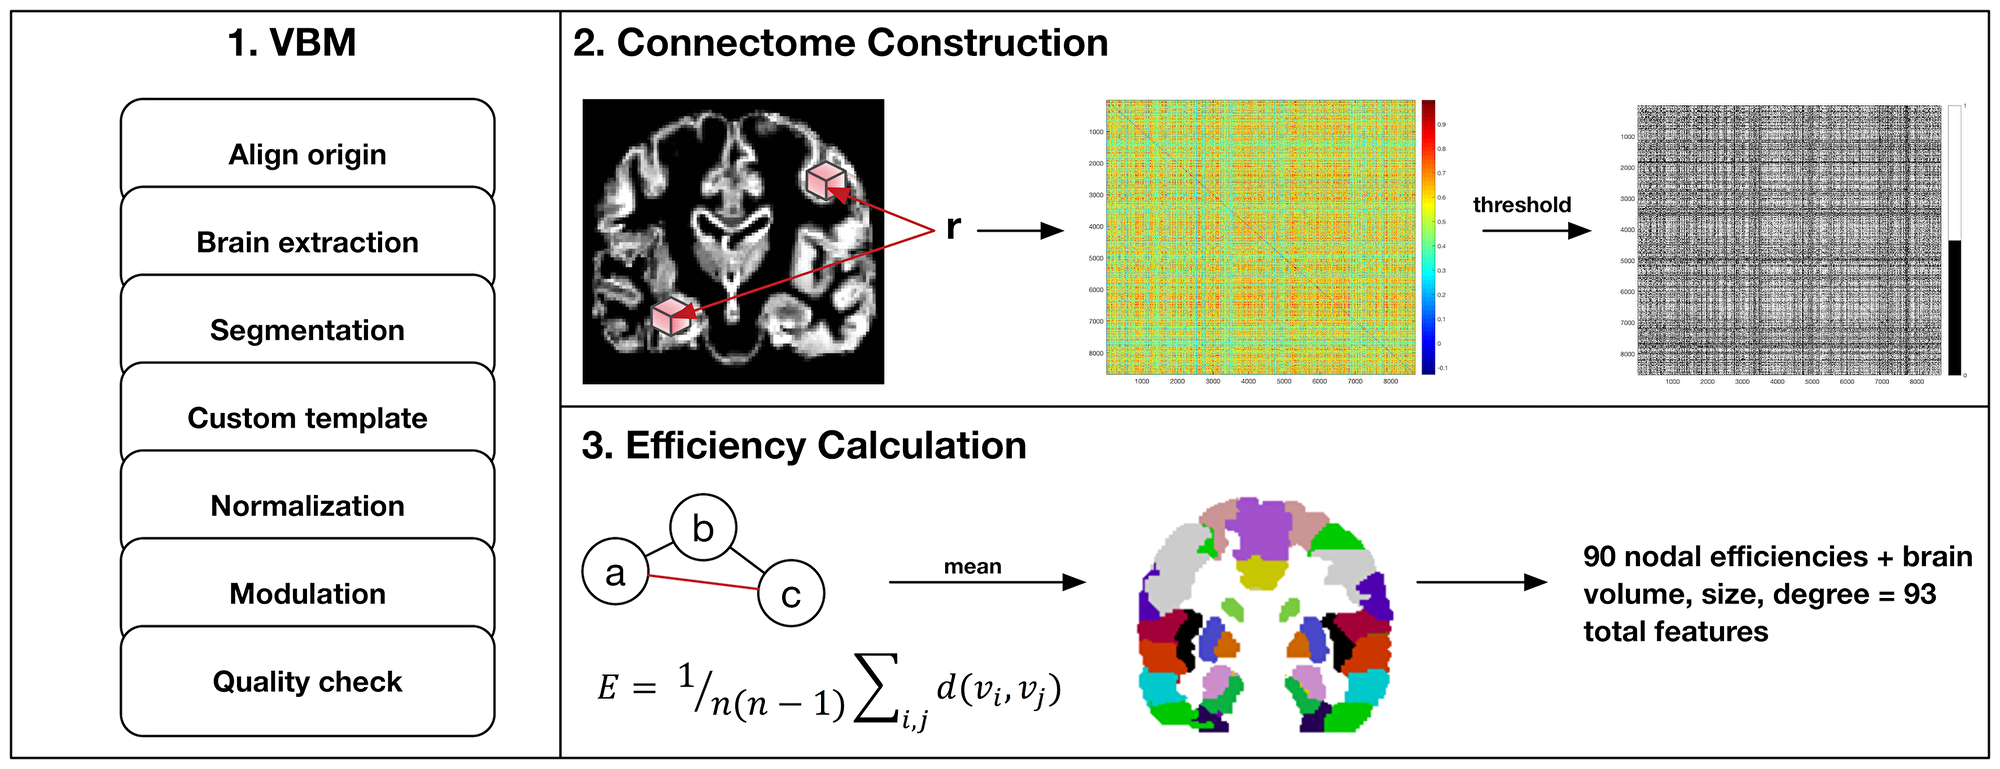
Figure 3: MRI preprocessing and connectome construction steps. First, voxel-based morphometry (VBM) involves standard procedures to extract gray matter volumes including reorientation to anterior and posterior commissure for improved spatial normalization, automated removal of skull, probabilistic segmentation into tissue classes (gray, white, CSF), creation of a sample-specific template via DARTEL, spatial normalization to standard Montreal Neurologic Institute (MNI) space, modulation using jacobian determinant and quality assurance checks. Second, modulated and normalized gray matter volumes were used to construct a connectome map for each patient as the correlation coefficients, r, between voxel values captured by all pairs of 3 × 3 × 3 voxel cubes (nodes) spanning the entire volume. This correlation, or similarity matrix was then thresholded to remove false positives resulting in a binary matrix where a connection (edge) between two nodes = 1. Third, the binary similarity matrix was submitted to graph theoretical analysis. Efficient information exchange is assumed to follow the shortest path between regions. As illustrated here, the shortest, most efficient path from node a to c is marked in red. Efficiency (E) is defined as the average inverse shortest path length across all regions in the network where n is the number of nodes and d(vi,vj) is the length of the shortest path between nodes i and j. Efficiencies were averaged across all cubic nodes with MNI coordinates within one of 90 discrete anatomic regions defined by the Automated Anatomical Labeling Atlas (AAL).
Gray matter covariance networks were constructed for each patient using a similarity-based extraction method [41]. Matrices were then submitted to graph theoretical analysis using Brain Connectivity Toolbox (https://sites.google.com/site/bctnet/) and in-house code (https://github.com/srkesler/bNets.git) implemented in Matlab v2016b (Mathworks, Inc, Natick, MA). We calculated connectome efficiency [42] for each node given that this property is consistently observed to be affected in patients with diffuse glioma [6]. We also computed total brain volume, network size (number of nodes) and degree (number of nodal connections) as these can influence connectome measurements. Network size naturally varies across individuals (mean = 7,158 +/– 43 nodes) so gray matter volumes were collapsed across 90 cortical and subcortical regions [43] to facilitate analyses [6]. Models included all 90 nodal efficiency values plus brain volume, size and degree for a total of 93 features. Random minority oversampling was employed to balance classes.
Prediction of IDH status
We evaluated the performance of four established machine learning classifiers (Table 2) to predict IDH genotype from pre-surgical MRI connectome features: random forest (RF), support vector machine (SVM) with a polynomial kernel, logistic regression (LR) and neural network (multilayer perceptron - MLP). These algorithms are routinely used in radiomic prediction of IDH status [8–10]. All models were implemented in the Waikato Environment for Knowledge Analysis (Weka) software v3.8.3 (Waikato University, New Zealand), an open source workbench for practical, accessible machine learning applications. Classifier performance was tested using leave-one-out cross-validation and quantified with the area under the receiver operator characteristic curve (AUC). Default Weka tuning parameters were used for simplicity and to increase reproducibility with the exception that number of trees for RF was set to 1000 vs. 100 as the latter is an uncommonly low number of trees in our experience (Table 2). We compared model AUCs using a bootstrapping method implemented in the R Environment for Statistical Computing v3.5.3 (R Foundation, Vienna, Austria), using the “pROC” library.
For the best performing model, we tested whether feature selection would further improve performance. We employed two common strategies, recursive feature elimination (RFE), a type of backward selection, and elastic net regression, a regularization technique that yields a sparse model (tuning parameter alpha = 0.5). Feature selection was nested within the cross-validation loop and the outer loop repeated 50 times. We then calculated the mean AUC across the 50 iterations. RFE was conducted in the “caret” library and elastic net was conducted using the “glmnet” library in R. Finally, we evaluated whether adding age and tumor location (lobe, hemisphere) would improve the best performing model and/or yield a best performing model independently of connectome features.
Abbreviations
IDH: isocitrate dehydrogenase; AUC: area under the curve; RF: random forest; MLP: multilayer perceptron; SVM: support vector machine; LR: linear regression; RFE: recursive feature elimination; VBM: voxel-based morphometry.
Conflicts of Interest
None.
FUNDING
None.
References
1. Hartmann C, Hentschel B, Wick W, Capper D, Felsberg J, Simon M, Westphal M, Schackert G, Meyermann R, Pietsch T. Patients with IDH1 wild type anaplastic astrocytomas exhibit worse prognosis than IDH1-mutated glioblastomas, and IDH1 mutation status accounts for the unfavorable prognostic effect of higher age: implications for classification of gliomas. Acta Neuropathol. 2010; 120:707–18. https://doi.org/10.1007/s00401-010-0781-z. [PubMed].
2. WHO Classification of Tumours of the Central Nervous System. (Lyon: IARC). 2016.
3. Beiko J, Suki D, Hess KR, Fox BD, Cheung V, Cabral M, Shonka N, Gilbert MR, Sawaya R, Prabhu SS, Weinberg J, Lang FF, Aldape KD, et al. IDH1 mutant malignant astrocytomas are more amenable to surgical resection and have a survival benefit associated with maximal surgical resection. Neuro Oncol. 2014; 16:81–91. https://doi.org/10.1093/neuonc/not159. [PubMed].
4. Okita Y, Narita Y, Miyakita Y, Ohno M, Matsushita Y, Fukushima S, Sumi M, Ichimura K, Kayama T, Shibui S. IDH1/2 mutation is a prognostic marker for survival and predicts response to chemotherapy for grade II gliomas concomitantly treated with radiation therapy. Int J Oncol. 2012; 41:1325–36. https://doi.org/10.3892/ijo.2012.1564. [PubMed].
5. Mandel JJ, Cachia D, Liu D, Wilson C, Aldape K, Fuller G, de Groot JF. Impact of IDH1 mutation status on outcome in clinical trials for recurrent glioblastoma. J Neurooncol. 2016; 129:147–54. https://doi.org/10.1007/s11060-016-2157-2. [PubMed].
6. Kesler SR, Noll K, Cahill DP, Rao G, Wefel JS. The effect of IDH1 mutation on the structural connectome in malignant astrocytoma. J Neurooncol. 2017; 131:565–74. https://doi.org/10.1007/s11060-016-2328-1. [PubMed].
7. Chang K, Bai HX, Zhou H, Su C, Bi WL, Agbodza E, Kavouridis VK, Senders JT, Boaro A, Beers A, Zhang B, Capellini A, Liao W, et al. Residual Convolutional Neural Network for the Determination of IDH Status in Low- and High-Grade Gliomas from MR Imaging. Clin Cancer Res. 2018; 24:1073–81. https://doi.org/10.1158/1078-0432.CCR-17-2236. [PubMed].
8. Zhang B, Chang K, Ramkissoon S, Tanguturi S, Bi WL, Reardon DA, Ligon KL, Alexander BM, Wen PY, Huang RY. Multimodal MRI features predict isocitrate dehydrogenase genotype in high-grade gliomas. Neuro Oncol. 2017; 19:109–17. https://doi.org/10.1093/neuonc/now121. [PubMed].
9. Villanueva-Meyer JE, Wood MD, Choi BS, Mabray MC, Butowski NA, Tihan T, Cha S. MRI Features and IDH Mutational Status of Grade II Diffuse Gliomas: Impact on Diagnosis and Prognosis. AJR Am J Roentgenol. 2018; 210:621–8. https://doi.org/10.2214/AJR.17.18457. [PubMed].
10. Wu S, Meng J, Yu Q, Li P, Fu S. Radiomics-based machine learning methods for isocitrate dehydrogenase genotype prediction of diffuse gliomas. J Cancer Res Clin Oncol. 2019; 145:543–50. https://doi.org/10.1007/s00432-018-2787-1. [PubMed].
11. Choi C, Ganji SK, DeBerardinis RJ, Hatanpaa KJ, Rakheja D, Kovacs Z, Yang XL, Mashimo T, Raisanen JM, Marin-Valencia I, Pascual JM, Madden CJ, Mickey BE, et al. 2-hydroxyglutarate detection by magnetic resonance spectroscopy in IDH-mutated patients with gliomas. Nat Med. 2012; 18:624–9. https://doi.org/10.1038/nm.2682. [PubMed].
12. Derks J, Dirkson AR, de Witt Hamer PC, van Geest Q, Hulst HE, Barkhof F, Pouwels PJ, Geurts JJ, Reijneveld JC, Douw L. Connectomic profile and clinical phenotype in newly diagnosed glioma patients. Neuroimage Clin. 2017; 14:87–96. https://doi.org/10.1016/j.nicl.2017.01.007. [PubMed].
13. Ingalhalikar M, Smith A, Parker D, Satterthwaite TD, Elliott MA, Ruparel K, Hakonarson H, Gur RE, Gur RC, Verma R. Sex differences in the structural connectome of the human brain. Proc Natl Acad Sci U S A. 2014; 111:823–8. https://doi.org/10.1073/pnas.1316909110. [PubMed].
14. Zhang Z, Allen G, Zhu H, Dunson D. Relationships between Human Brain Structural Connectomes and Traits. bioRxiv. 2018. https://doi.org/10.1101/256933.
15. Krishnadas R, Kim J, McLean J, Batty GD, McLean JS, Millar K, Packard CJ, Cavanagh J. The envirome and the connectome: exploring the structural noise in the human brain associated with socioeconomic deprivation. Front Hum Neurosci. 2013; 7:722. https://doi.org/10.3389/fnhum.2013.00722. [PubMed].
16. Sun J, Tong S, Yang GY. Reorganization of Brain Networks in Aging and Age-related Diseases. Aging Dis. 2012; 3:181–93. [PubMed].
17. Kesler SR, Adams M, Packer M, Rao V, Henneghan AM, Blayney DW, Palesh O. Disrupted brain network functional dynamics and hyper-correlation of structural and functional connectome topology in patients with breast cancer prior to treatment. Brain Behav. 2017; 7:e00643. https://doi.org/10.1002/brb3.643. [PubMed].
18. Liu L, Zhang H, Rekik I, Chen X, Wang Q, Shen D. Outcome Prediction for Patient with High-Grade Gliomas from Brain Functional and Structural Networks. Med Image Comput Comput Assist Interv. 2016; 9901:26–34. https://doi.org/10.1007/978-3-319-46723-8_4. [PubMed].
19. Alexander-Bloch A, Giedd JN, Bullmore E. Imaging structural co-variance between human brain regions. Nat Rev Neurosci. 2013; 14:322–36. https://doi.org/10.1038/nrn3465. [PubMed].
20. Tijms BM, Kate MT, Wink AM, Visser PJ, Ecay M, Clerigue M, Estanga A, Garcia Sebastian M, Izagirre A, Villanua J, Martinez Lage P, van der Flier WM, Scheltens P, et al. Gray matter network disruptions and amyloid beta in cognitively normal adults. Neurobiol Aging. 2016; 37:154–60. https://doi.org/10.1016/j.neurobiolaging.2015.10.015. [PubMed].
21. Zhou H, Vallieres M, Bai HX, Su C, Tang H, Oldridge D, Zhang Z, Xiao B, Liao W, Tao Y, Zhou J, Zhang P, Yang L. MRI features predict survival and molecular markers in diffuse lower-grade gliomas. Neuro Oncol. 2017; 19:862–70. https://doi.org/10.1093/neuonc/now256. [PubMed].
22. Lu CF, Hsu FT, Hsieh KL, Kao YJ, Cheng SJ, Hsu JB, Tsai PH, Chen RJ, Huang CC, Yen Y, Chen CY. Machine Learning-Based Radiomics for Molecular Subtyping of Gliomas. Clin Cancer Res. 2018; 24:4429–36. https://doi.org/10.1158/1078-0432.CCR-17-3445. [PubMed].
23. Rubinov M, Sporns O. Complex network measures of brain connectivity: uses and interpretations. Neuroimage. 2010; 52:1059–69. https://doi.org/10.1016/j.neuroimage.2009.10.003. [PubMed].
24. Svetnik V, Liaw A, Tong C, Wang T. Application of Breiman’s Random Forest to Modeling Structure-Activity Relationships of Pharmaceutical Molecules. (Berlin, Heidelberg: Springer Berlin Heidelberg). 2004; 3077:334–43.
25. Zhang L, He L, Lugano R, Roodakker K, Bergqvist M, Smits A, Dimberg A. IDH mutation status is associated with distinct vascular gene expression signatures in lower-grade gliomas. Neuro-Oncology. 2018; 20:1505–16. https://doi.org/10.1093/neuonc/noy088. [PubMed].
26. Guo H, Kang H, Tong H, Du X, Liu H, Tan Y, Yang Y, Wang S, Zhang W. Microvascular characteristics of lower-grade diffuse gliomas: investigating vessel size imaging for differentiating grades and subtypes. European Radiology. 2019; 29:1893–902. https://doi.org/10.1007/s00330-018-5738-y. [PubMed].
27. Berghoff AS, Kiesel B, Widhalm G, Wilhelm D, Rajky O, Kurscheid S, Kresl P, Wohrer A, Marosi C, Hegi ME, Preusser M. Correlation of immune phenotype with IDH mutation in diffuse glioma. Neuro Oncol. 2017; 19:1460–8. https://doi.org/10.1093/neuonc/nox054. [PubMed].
28. Kohanbash G, Carrera DA, Shrivastav S, Ahn BJ, Jahan N, Mazor T, Chheda ZS, Downey KM, Watchmaker PB, Beppler C, Warta R, Amankulor NA, Herold-Mende C, et al. Isocitrate dehydrogenase mutations suppress STAT1 and CD8+ T cell accumulation in gliomas. J Clin Invest. 2017; 127:1425–37. https://doi.org/10.1172/jci90644. [PubMed].
29. Perry VH, Cunningham C, Holmes C. Systemic infections and inflammation affect chronic neurodegeneration. Nat Rev Immunol. 2007; 7:161–7. https://doi.org/10.1038/nri2015. [PubMed].
30. Zipp F, Aktas O. The brain as a target of inflammation: common pathways link inflammatory and neurodegenerative diseases. Trends Neurosci. 2006; 29:518–27. https://doi.org/10.1016/j.tins.2006.07.006. [PubMed].
31. Centonze D, Muzio L, Rossi S, Furlan R, Bernardi G, Martino G. The link between inflammation, synaptic transmission and neurodegeneration in multiple sclerosis. Cell Death Differ. 2010; 17:1083–91. https://doi.org/10.1038/cdd.2009.179. [PubMed].
32. Allan SM, Tyrrell PJ, Rothwell NJ. Interleukin-1 and neuronal injury. Nat Rev Immunol. 2005; 5:629–40. https://doi.org/10.1038/nri1664. [PubMed].
33. Linker RA, Rott E, Hofstetter HH, Hanke T, Toyka KV, Gold R. EAE in beta-2 microglobulin-deficient mice: axonal damage is not dependent on MHC-I restricted immune responses. Neurobiol Dis. 2005; 19:218–28. https://doi.org/10.1016/j.nbd.2004.12.017. [PubMed].
34. Chen H, Judkins J, Thomas C, Wu M, Khoury L, Benjamin CG, Pacione D, Golfinos JG, Kumthekar P, Ghamsari F, Chen L, Lein P, Chetkovich DM, et al. Mutant IDH1 and seizures in patients with glioma. Neurology. 2017; 88:1805–13. https://doi.org/10.1212/wnl.0000000000003911. [PubMed].
35. Bleeker FE, Atai NA, Lamba S, Jonker A, Rijkeboer D, Bosch KS, Tigchelaar W, Troost D, Vandertop WP, Bardelli A, Van Noorden CJ. The prognostic IDH1(R132) mutation is associated with reduced NADP+-dependent IDH activity in glioblastoma. Acta Neuropathol. 2010; 119:487–94. https://doi.org/10.1007/s00401-010-0645-6. [PubMed].
36. Kim GH, Kim JE, Rhie SJ, Yoon S. The Role of Oxidative Stress in Neurodegenerative Diseases. Exp Neurobiol. 2015; 24:325–40. https://doi.org/10.5607/en.2015.24.4.325. [PubMed].
37. Gao HM, Zhou H, Hong JS. NADPH oxidases: novel therapeutic targets for neurodegenerative diseases. Trends Pharmacol Sci. 2012; 33:295–303. https://doi.org/10.1016/j.tips.2012.03.008. [PubMed].
38. Bedard K, Krause KH. The NOX family of ROS-generating NADPH oxidases: physiology and pathophysiology. Physiol Rev. 2007; 87:245–313. https://doi.org/10.1152/physrev.00044.2005. [PubMed].
39. Wijnenga MMJ, French PJ, Dubbink HJ, Dinjens WNM, Atmodimedjo PN, Kros JM, Smits M, Gahrmann R, Rutten GJ, Verheul JB, Fleischeuer R, Dirven CMF, Vincent AJPE, et al. The impact of surgery in molecularly defined low-grade glioma: an integrated clinical, radiological, and molecular analysis. Neuro Oncol. 2018; 20:103–12. https://doi.org/10.1093/neuonc/nox176. [PubMed].
40. Ripolles P, Marco-Pallares J, de Diego-Balaguer R, Miro J, Falip M, Juncadella M, Rubio F, Rodriguez-Fornells A. Analysis of automated methods for spatial normalization of lesioned brains. Neuroimage. 2012; 60:1296–306. https://doi.org/10.1016/j.neuroimage.2012.01.094. [PubMed].
41. Tijms BM, Series P, Willshaw DJ, Lawrie SM. Similarity-based extraction of individual networks from gray matter MRI scans. Cereb Cortex. 2012; 22:1530–41. https://doi.org/10.1093/cercor/bhr221. [PubMed].
42. Achard S, Bullmore E. Efficiency and cost of economical brain functional networks. PLoS Comput Biol. 2007; 3:e17. https://doi.org/10.1371/journal.pcbi.0030017. [PubMed].
43. Tzourio-Mazoyer N, Landeau B, Papathanassiou D, Crivello F, Etard O, Delcroix N, Mazoyer B, Joliot M. Automated anatomical labeling of activations in SPM using a macroscopic anatomical parcellation of the MNI MRI single-subject brain. Neuroimage. 2002; 15:273–89. https://doi.org/10.1006/nimg.2001.0978. [PubMed].
44. Breiman L. Random forests. Mach Learn. 2001; 45:5–32. https://doi.org/10.1023/A:1010933404324.
45. Cortes C, Vapnik V. Support-vector networks. Mach Learn. 1995; 20:273–97. https://doi.org/10.1023/A:1022627411411.
46. Le Cessie S, Van Houwelingen JC. Ridge estimators in logistic regression. J R Stat Soc Ser C Appl Stat. 1992; 41:191–201.
47. LeCun Y, Bengio Y, Hinton G. Deep learning. Nature. 2015; 521:436–44. https://doi.org/10.1038/nature14539. [PubMed].