
Introduction
Cancer-testis antigens (CTAs) are among the most enigmatic genes in animal and human genomes because their expression patterns are highly specific, but their cell functions remain unknown. CTAs are abundantly expressed in different types of cancer cells and involved in the regulation of proliferation [1–6], apoptosis [5, 7–9], the epithelia-mesenchymal transition [10, 11], and germ [12–16] and somatic cell [17–23] differentiation. Several CTA families’ members can induce spontaneous humoral and cytotoxic T-cell-mediated immune responses in cancer patients. Their immunotheraputic potential was studied in numerous clinical trials with CTA-based cancer vaccines [24–26].
The CTAs’ roles in normal and pathological cell processes are largely unclear [27–31]. In addition to cancer cells and testes [6, 16, 18, 28, 32], CTA expression was identified during the development of extra-embryonic structures and embryonic germ and somatic cells [17, 19–23, 33], as well as during pluripotent and multipotent stem cell differentiation [14, 28, 34, 35]. Previous studies revealed different CTA expression patterns in normal and cancer stem cells [34, 36–40]. Therefore, we hypothesized that CTA expression may be a part of the developmental programs of both the germ and somatic lineages. Changes in the characteristic CTA profiles (aberrant expression) of germ and somatic cells may be associated with abnormal differentiation and cancer transformation.
The CTAs of the Melanoma antigen (Mage) family identified in the human and mouse genomes belong to two classes, according to their expression patterns: Mage-a and Mage-b genes, which are expressed predominantly in spermatogenic and cancer cells; and the ubiquitously expressed Mage-d, Mage-e, Mage-h1, and Mage-l2 genes [20, 28, 29, 41–43]. Like other CTAs, Mage proteins are considered intrinsically disordered proteins that can transition to an ordered 3D-structure and can interact with nucleic acids or target proteins involved in the regulation of different cell processes [44]. Mage family proteins are widely involved in cancer progression and may be a driver of tumorigenesis [45]. Notwithstanding significant clinical interest in Mage antigens, the expression patterns and putative functional roles of the Mage family in mammalian development, cell differentiation and cancer transformation are poorly understood. Because of the high homology and co-expression of the Mage family genes, traditional studies using the gain- or loss-of-function mutations and gene knockdown approaches for individual members of the Mage family were insufficient for the disclosure of the functional role of the Mage family in normal and pathological cell processes. Therefore, gene co-expression analysis of the Mage family members and key regulator of pluripotency, self-renewal and differentiation may shed light on the unknown biological roles and functional importance of these genes in normal and cancer cells.
The present study is the first systematic co-expression analysis of both classes of Mage family genes in mouse embryonic stem (ESCs), embryonic germ (EGCs) and teratocarcinoma (ECCs) cells and early embryos in order to understand the possible involvement of Mage family genes in the regulation of stem cell self-renewal and differentiation and carcinogenesis. Possible functionally-related Mage gene modules were identified via clustering and analyzing the correlations between the expression patterns of the Mage genes and regulators of proliferation and differentiation in pluripotent stem and teratocarcinoma cells.
Results
Mage family expression profiles differ during self-renewal of pluripotent stem and malignant teratocarcinoma cells
In the undifferentiated ESCs R1, EGCs EGC-10, ECCs F9 and ECCs P19 there are similar cell cycle distributions, with most cells in the S-phase of the cell cycle (60–70%) and low number of cells in the G1-phase of the cell cycle (10–30%) (Figure 1A). Undifferentiated cells express E-ras and C-myc at similar levels and have similar expression patterns for the pluripotent stem cell marker Oct4 (Figure 1B–1D, Supplementary Table 1). However, the expression levels of the pluripotency markers Oct4 and Nanog and lineage-specific gene markers Mvh, Gata4, Pax6 and Bry significantly differ between pluripotent stem and teratocarcinoma cells (Figure 1D, Supplementary Table 1).
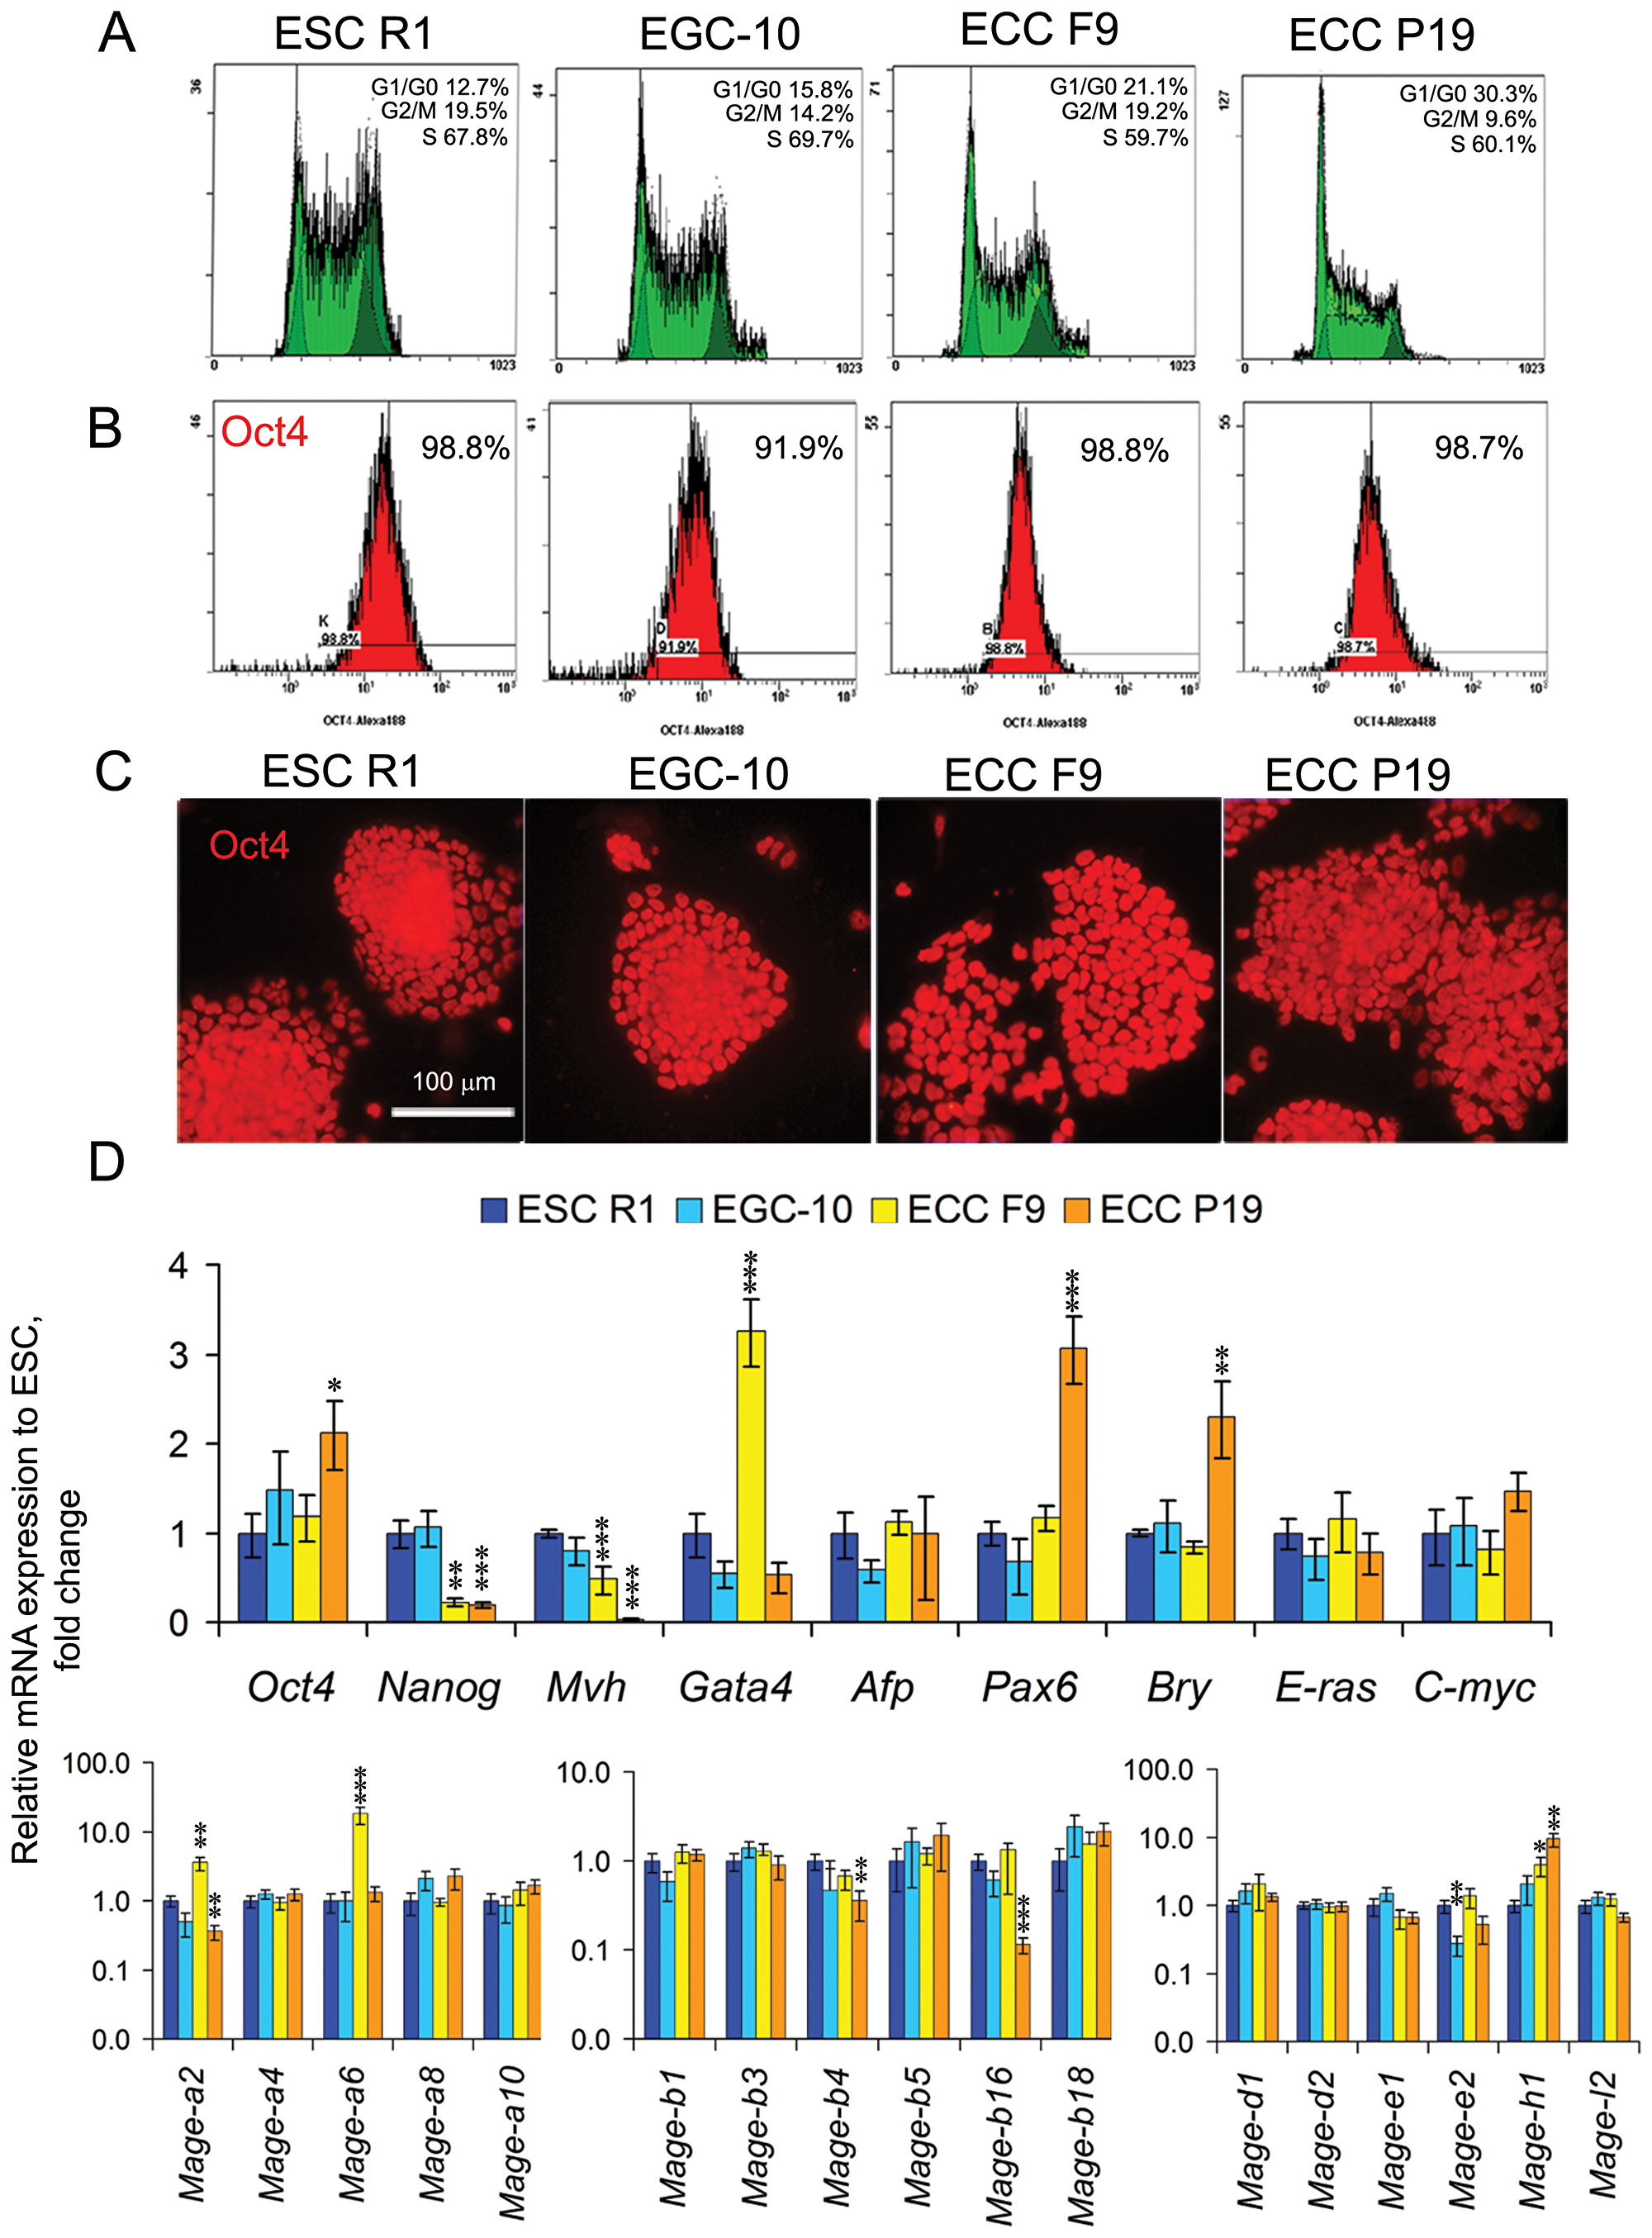
Figure 1: Characteristics and marker and Mage family gene expression patterns in undifferentiated ESCs, EGCs and ECCs. (A) Flow cytometric analysis of the distributions of the cell cycle stages and (B) number of Oct4-expressing cells in the populations of undifferentiated ESCs, EGCs and ECCs. (C) Staining of undifferentiated ESCs, EGCs and ECCs with antibodies against Oct4. Scale bar = 100 μm. (D) Quantitative PCR analysis of the expression profiles of markers of proliferative activity (C-myc, E-ras), pluripotency (Oct4, Nanog), embryonic lineages (Mvh, Gata4, Afp, Pax6, Bry) and Mage family genes in undifferentiated ESCs, EGCs and ECCs. The gene expression levels (fold change) in EGCs, ECCs F9 and ECCs P19 were evaluated relative to the gene expression levels in ESCs R1. The data are represented as the means ± s.d., *p < 0.05, **p < 0.01, ***p < 0.01, ANOVA.
The undifferentiated ESCs, EGCs and ECCs exhibit differential expression patterns for 6 of the 17 Mage genes (35%) and similar expression patterns for 11 Mage genes (65%) studied (Figure 1D, Supplementary Table 1). Only Mage-e2 is expressed at different levels in pluripotent EGCs and ESCs (p < 0.01), whereas the expression patterns of five Mage genes differs between pluripotent and teratocarcinoma cells. Both ECC lines express significantly higher level of Mage-h1 (p < 0.01) than pluripotent stem cells. Mage-a2 and Mage-a6 are expressed at significantly higher levels in ECCs F9 and Mage-a2, Mage-b4 and Mage-b16 are expressed at significantly lower levels in ECCs P19 than in pluripotent stem cells. The Mage family proteins are expressed in the majority of undifferentiated ESCs, EGCs and ECCs regardless of the cell cycle phase, and no substantial differences in the intensity or localization of Mage immunostaining signals in cells in different phases of the cell cycle were observed. (Supplementary Figure 1). Thus, despite significant similarity of the cell characteristics and expression level of proliferation regulators C-myc and E-ras, aberrant expression patterns for 11 of 26 (42%) Mage and marker genes were identified when comparing undifferentiated self-renewing pluripotent stem and teratocarcinoma cells.
Expression patterns of Mage family genes in ESCs, EGCs and ECCs dynamically change during the RA-stimulated differentiation
The differentiation potential of the pluripotent stem cells, ESCs R1 and EGCs-10, and teratocarcinoma cells, ECCs F9 and ECCs P19, was significantly different during spontaneous in vitro differentiation and after transplantation into Nude mice [46–48]. However, during RA-induced differentiation, the ESCs, EGCs and ECCs exhibited similar, nearly two-fold decreases in the number of cells in the S-phase of the cell cycle (30–40%) and the number of Oct4-expressing cells (50–60%) (Figure 2A–2C). In all cell lines, RA stimulates a significant down-regulation of E-ras, C-myc, Oct4 and Nanog expression and up-regulation of the expression of the germ and somatic lineage markers Mvh,Pax6, Afp, Bry and Gata4 (Figures 2C and 3, Supplementary Tables 1 and 2).
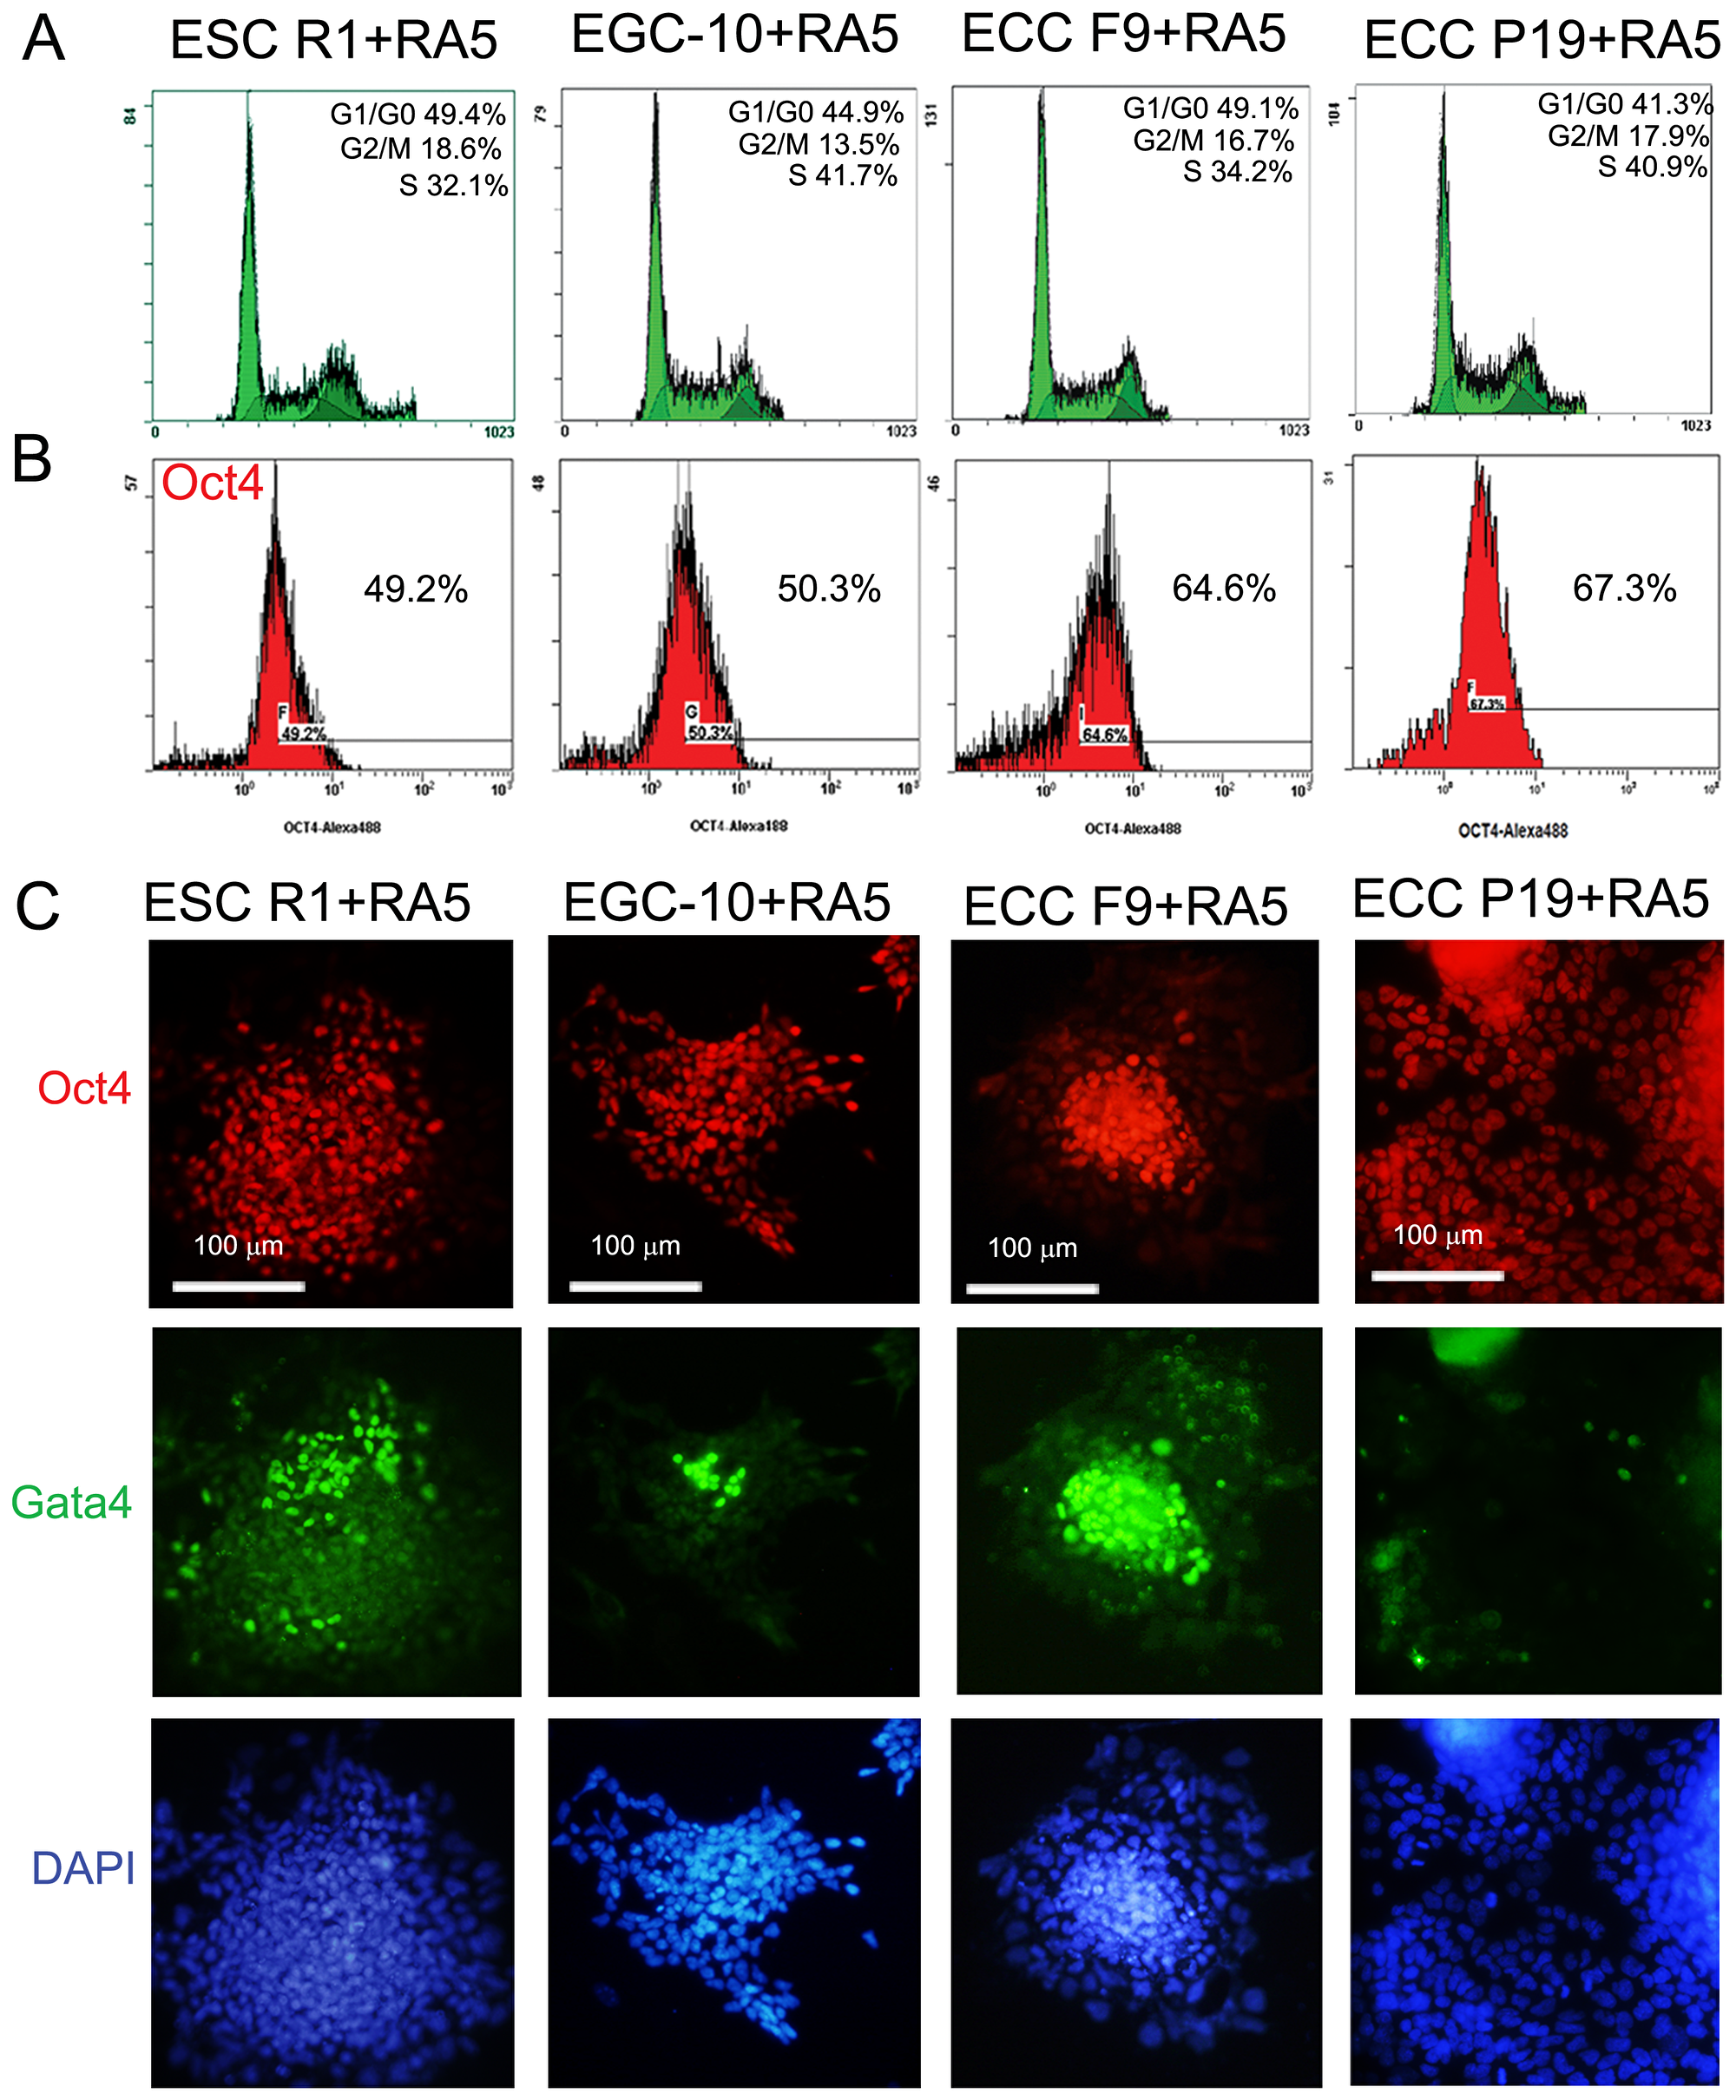
Figure 2: ESC, EGC and ECC population characteristics during RA-induced differentiation. (A) Flow cytometric analysis of the cell cycle distributions of differentiating ESCs, EGCs and ECCs after 5-day RA exposure. (B) Flow cytometric analysis of number of Oct4-expressing cells in the populations of differentiating ESCs, EGCs and ECCs after 5-day RA exposure. (C) Triple staining of differentiating ESCs, EGCs and ECCs with antibodies against Oct4 and Gata4. Nuclei were counterstained by DAPI. Scale bar = 100 μm.
The dynamics of Mage gene expression patterns during the RA-induced differentiation of ESCs, EGCs, and ECCs have similar trends for all cell lines. The expression of 4 of 6 ubiquitously expressed genes, Mage-d1, Mage-d2, Mage-e1 and Mage-l2, increases dramatically in all cell lines, Mage-e2 and Mage-h1 expression increases in ECCs P19 and F9, respectively, while the expression of only 6 of 11 genes of the Mage-a and Mage-b subfamilies (Mage-a4, Mage-a8, Mageb-1, Mage-b4, Mage-b16, and Mage-b18) changes significantly in differentiating cells (Figure 3A–3D, Supplementary Tables 1 and 2). Moreover, significant differences in the expression of Mage-a2, Mage-a6 (ECCs F9) and Mage-b18 (ECCs P19) were found between cell lines during RA-induced differentiation (Figure 3).
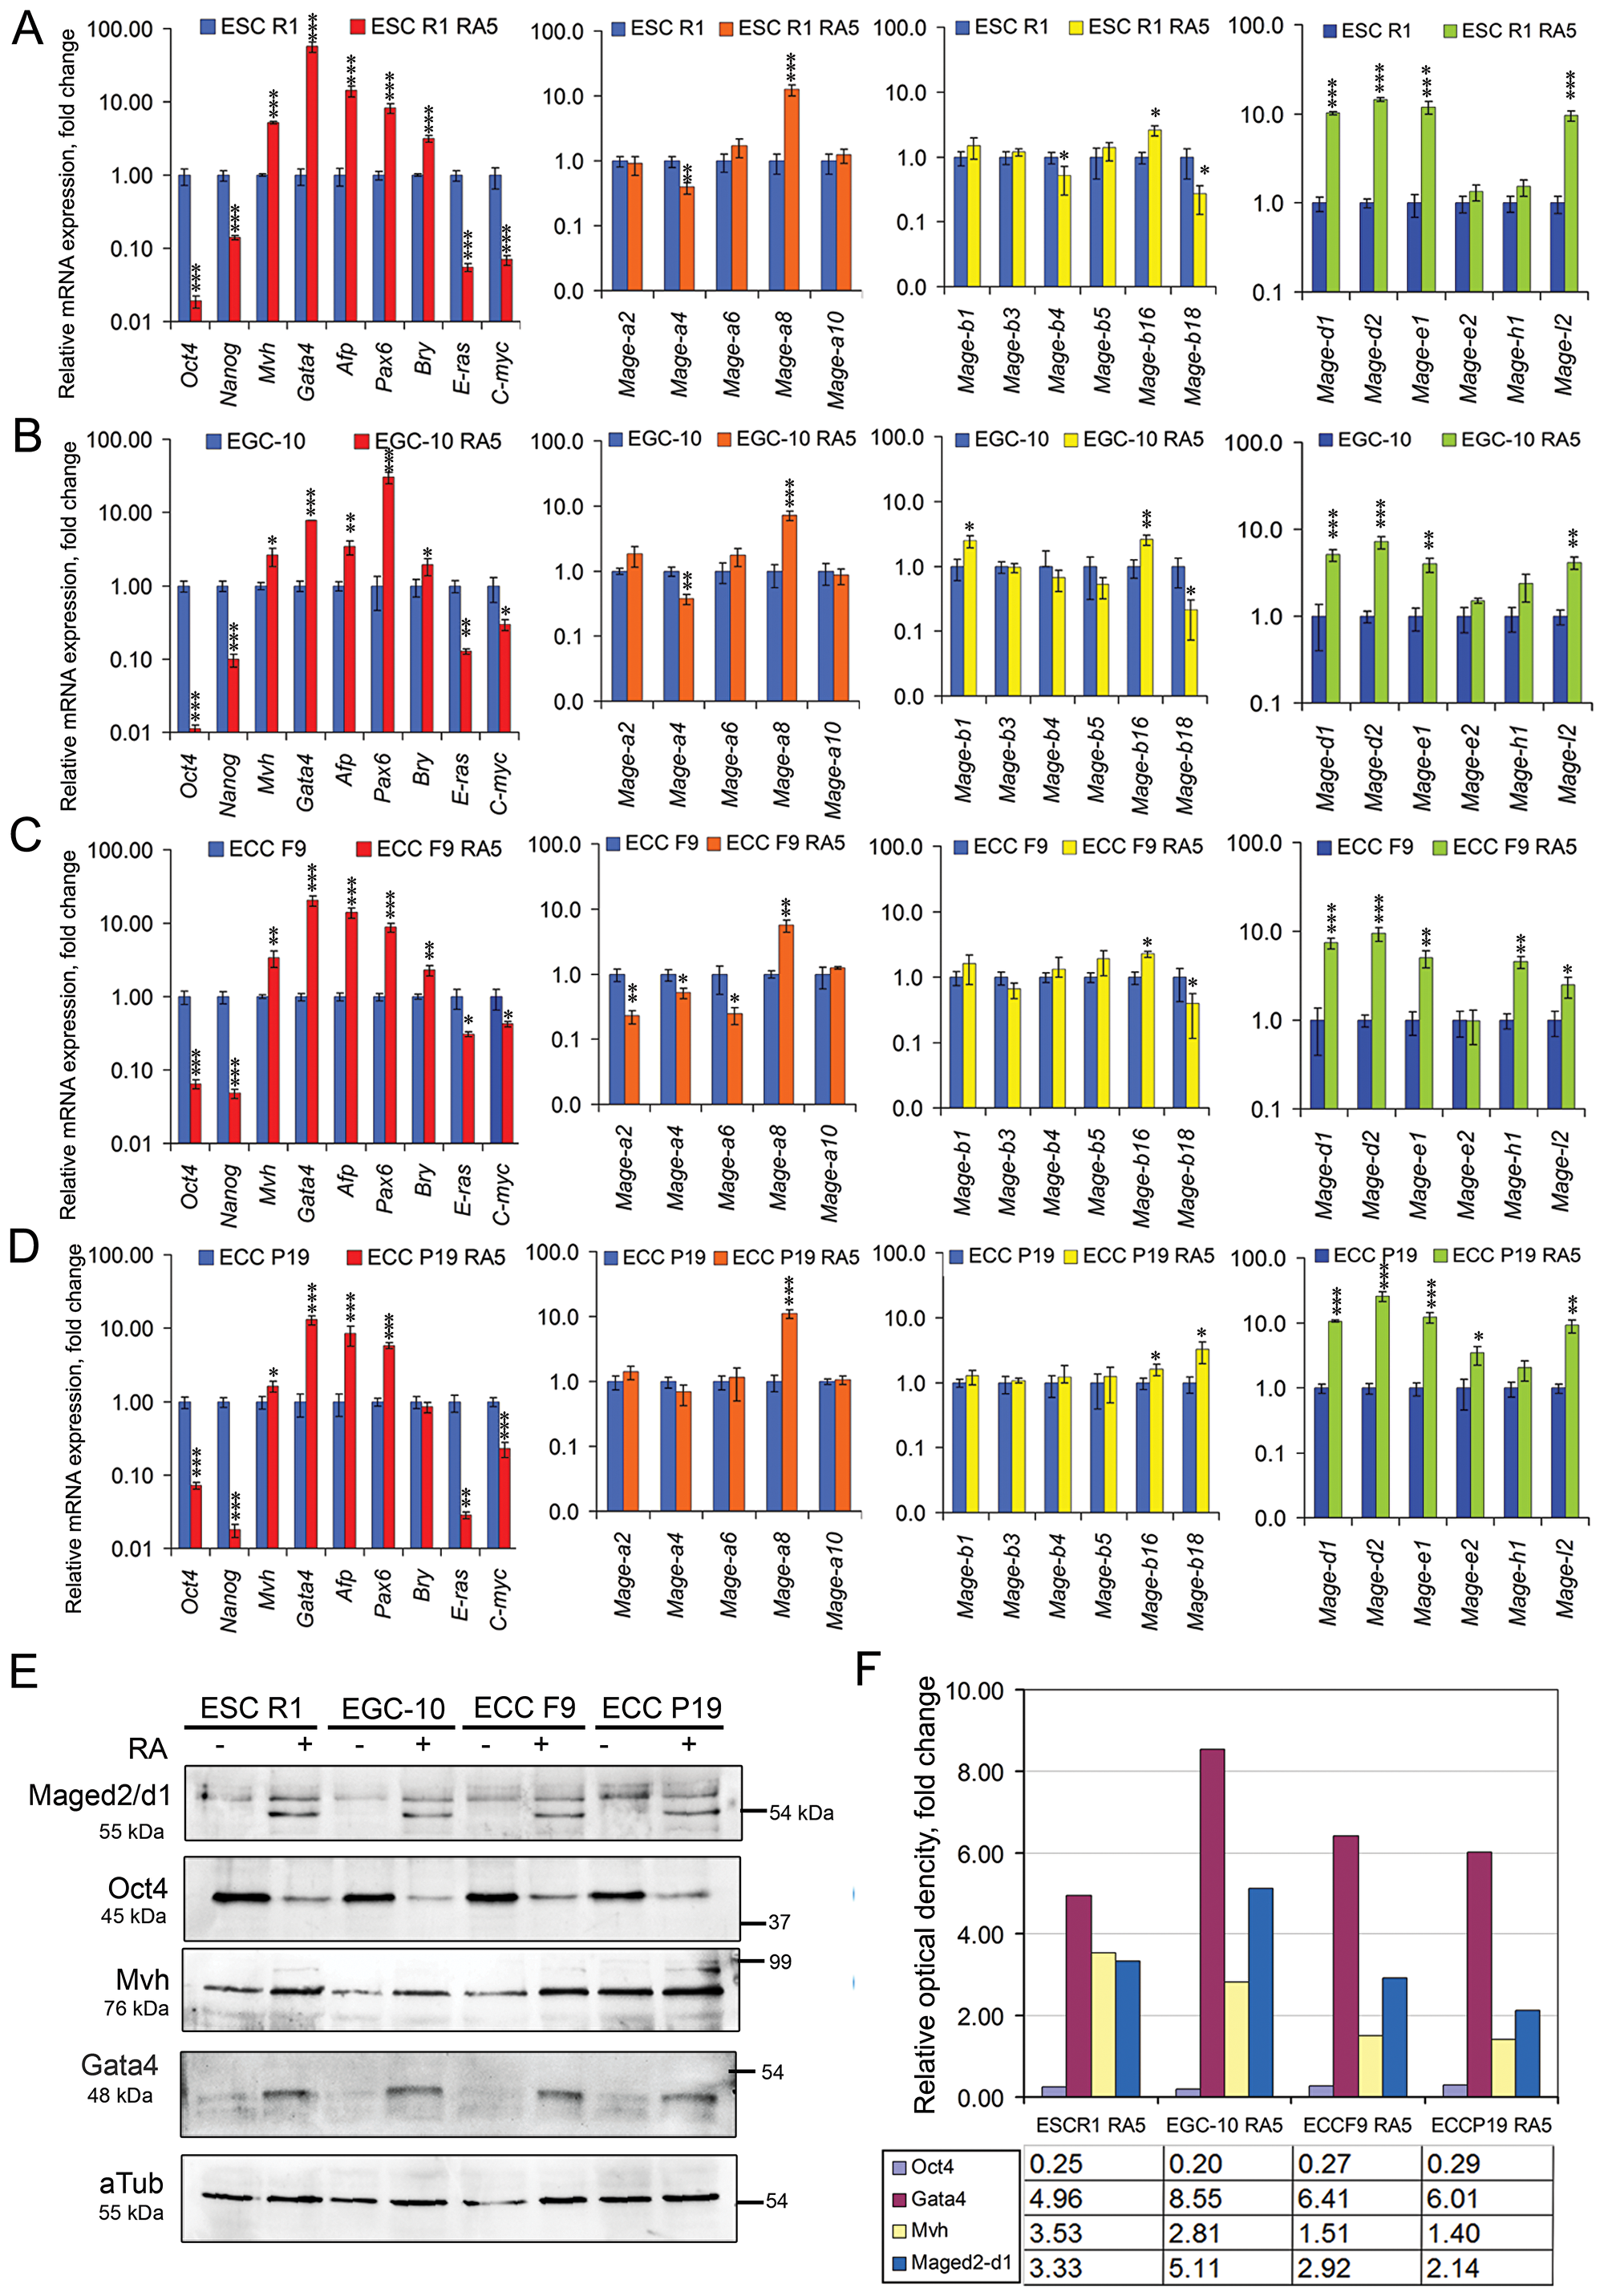
Figure 3: Dynamics of Mage and marker gene expressions during RA-induced differentiation of ESCs, EGCs and ECCs. The gene expression levels of each gene in differentiating cells were evaluated relatively to the gene expression levels in undifferentiated ESCs R1 (A), EGCs EGC-10 (B), ECCs F9 (C) and ECCs P19 (D), respectively. The data are represented as the means ± s.d. *p < 0.05, **p < 0.01, ***p < 0.01, ANOVA. (E) Expression of the Mage-d1/d2 proteins, Oct4, Gata4 and Mvh in undifferentiated and RA-stimulated ESCs R1, EGCs-10, ECCs F9 and ECCs P19 as determined by western blotting; a-tubulin (aTub) was used as the loading control (uncropped blots are represented in Supplementary Figure 3). The representative of experiments repeated at least three times is shown. (F) Densitometric evaluation of bands intensity from (D). Figure 6F shows relative expression of Mage-d1-d2, Oct4, Gata4 and Mvh in RA-stimulated ESCs R1, EGCs-10, ECCs F9 and ECCs P19 calculated in comparison to respective undifferentiated cells. The relative protein expression levels were normalized to a-tubulin (aTub) of corresponding samples. Summary relative intensity of both bands for Mage-d1-d2 proteins were evaluated for RA-stimulated cells.
The expression of Mage proteins was detected in undifferentiated and differentiating cells using the polyclonal rabbit anti-Mage antibodies obtained to an epitope from the C-terminal region of human MAGE-A1 antigen (sc-10749), which can cross-react with a wide range of mouse Mage family antigens due to their high homology (Supplementary Figure 1). However, these antibodies were not suitable for a quantitative evaluation of the dynamics of Mage protein expression during RA-induced differentiation. Therefore, antibodies against Mage-d1/d2 antigens (NBP2-24694), which mRNA has changed most significantly during differentiation, were used for semi-quantitative western blot analysis. A western blot detected bands with molecular weights in the predicted area (55 kDa), which correspond to the Mage-d2 isoforms X1 and X2 (XP_006529062.1, 616 aa and XP_011246184.1, 594 aa, respectively) and the Mage-d1 isoform CRA_a (EDL29758.1; 592 aa) (Figure 3E). Moreover, two bands with molecular weights between 85–100 kDa, which may correspond to the Mage-d1 isoform CRA_b (EDL29757.1, NP_062765.1; 775aa, 85 kDa predicted) as well as Mage-e1 (918aa, 102 kDa predicted) were detected in all cells (Supplementary Figures 2 and 3). Semi-quantitative densitometry evaluation of two bands in the predicted 55 kDa area showed 2–5 fold increase of Mage-d1/-d2 protein expression in differentiating cells of all cell lines (Figure 3E, 3F). Similarly, the relative optical density of bands in area of 85–100 kDa was 2–3 fold higher for all differentiating cells (Supplementary Figure 2). In addition, up-regulation of Gata4 and Mvh protein expression and down-regulation of Oct4 expression were found in differentiating cells (Figure 3E, 3F). Thus, the Mage-d1/d2 protein expression patterns are consistent with the mRNA expression pattern data and correlate with the expression patterns of Oct4, Gata4 and Mvh.
Mage family gene expression patterns in E7.5 mouse embryos and differentiating ESCs show significant similarities
The consistency between the Mage expression patterns in vivo and in vitro was studied in mouse embryos at the E7.5 mid-gastrula stage and in undifferentiated and differentiating ESCs. The E7.5 embryos as well as various differentiating ESC populations contained undifferentiated cells and the early precursors of embryonic and extraembryonic cells (Figure 4A–4D). The heterogeneity of differentiating ESC populations was substantially different during spontaneous and RA-induced differentiation (Figure 4B, 4D). Among differentiating ESC populations, the largest number of Oct4- and ALP-positive cells was detected in spontaneously differentiating ESC R1 - RA5 (77%) cells and the lowest number (10.1%) was detected after RA exposure for 10 days in ESC R1+RA10 (Figure 4D). Quantitative analysis of the gene expression patterns and hierarchical clustering of the gene expression data sets revealed the greatest similarity gene expression patterns of E7.5 embryos with ESCs R1+RA10 for the markers (Figure 4E–4H; Supplementary Table 3) and with ESCs R1+RA10 and ESCs R1+RA5 for the Mage gene expression patterns (Figure 4E, 4G, 4H; Supplementary Table 3). The data on the expression patterns of 17 Mage genes in the E7.5 mouse embryos were annotated to the Gene Expression Database of Mouse Genome Informatics (http://www.informatics.jax.org/reference/J:230330).
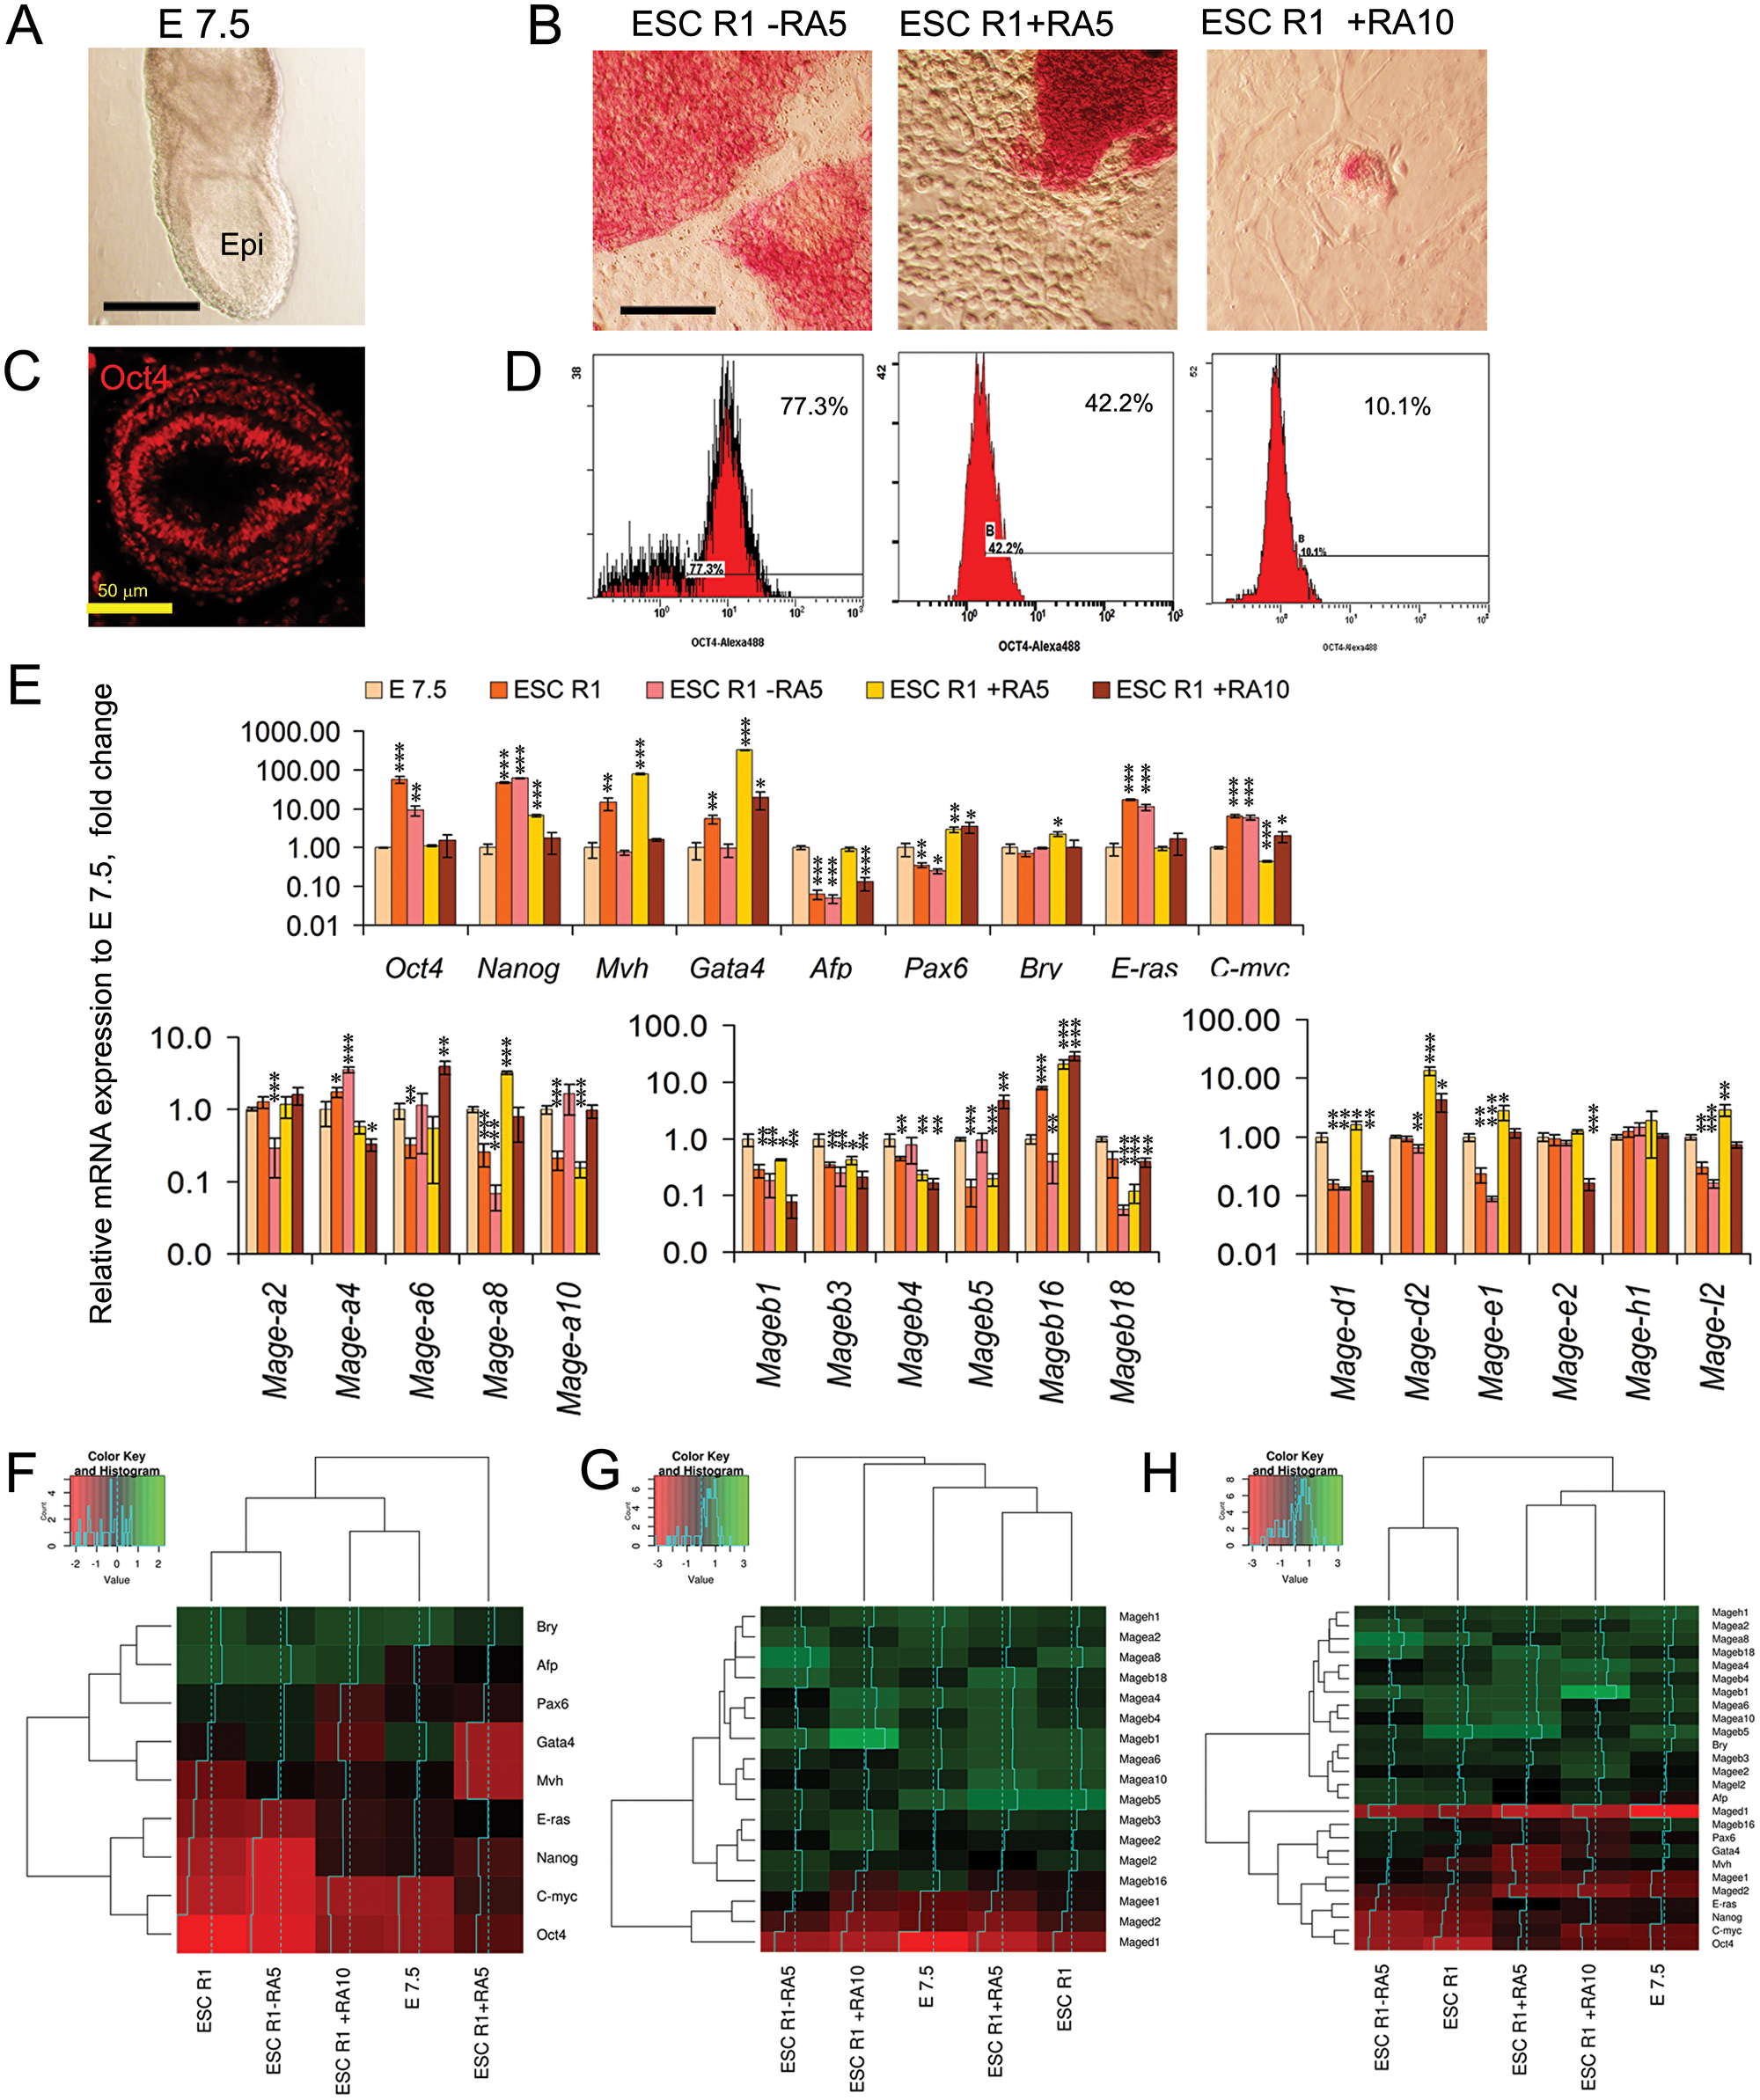
Figure 4: Comparative analysis of Mage family expression patterns in E7.5 mouse embryos and differentiating ESCs. (A) The epiblast of mouse embryos at the E7.5 stage. Scale bar = 100 μm. (B) ALP activity in the spontaneously and RA-induced (for 5 and 10 days) differentiating ESCs. Scale bar = 100 μm. (C) Immunofluorescent analysis of Oct4-expressing cells in the epiblast of E7.5 mouse embryos (cross-section). Scale bar = 50 μm. (D) Flow cytometric analysis of Oct4-expressing cells in the spontaneously and RA-induced (for 5 and 10 days) differentiating ESCs. (E) The expression patterns of regulators of proliferation, pluripotency and embryonic lineages and Mage genes in E7.5 embryos and spontaneously and RA-induced (for 5 and 10 days) differentiating ESCs. The gene expression levels in differentiating ESCs R1 were evaluated relative to the gene expression levels in embryos at the E7.5 stage. The data are represented as the means ± s.d., *p < 0.05, **p < 0.01, ***p < 0.01, ANOVA. (F–G). Heatmaps and hierarchical clustering dendrograms based on the data (the averaged ΔCt values) on mutual gene expression profiles (H), gene-markers (F) and Mage family gene expression profiles (G) demonstrate the similarity/dissimilarity between the gene expression patterns of the E7.5 embryos and differentiating ESC populations.
Mage gene expression patterns of ESCs, EGCs and ECCs and E7.5 mouse embryos correlate with differentiation and malignant states
Gene expression analysis has demonstrated significant changes in Mage family expression patterns during differentiation and early development. To test the possibility of classifying cell populations based on their Mage gene expression patterns, the hierarchical clustering based on ΔCt values was applied for three gene expression data sets: marker genes, Mage genes, and markers + Mage genes. Hierarchical clustering of the gene expression profiles of undifferentiated pluripotent stem and teratocarcinoma cells revealed a similarity of the profiles of normal ESCs R1 and EGCs-10, whereas ECCs F9 and ECCs P19 were less similar to pluripotent cells as well as to each other. The cluster dendrograms were similar for both the expression profiles of markers and Mage family genes (Figure 5A–5C). Thus, the Mage expression profile, to the same extent as the marker expression profile, reflects aberrant gene expression in teratocarcinoma cells compared to normal stem cells. Moreover, hierarchical clustering of the gene expression profiles of undifferentiated and differentiating ESCs, EGCs, and ECCs, as well as the E7.5 embryos, revealed a clear segregation of the studied cellular populations into two groups according to their differentiation states (Figure 5D–5I).
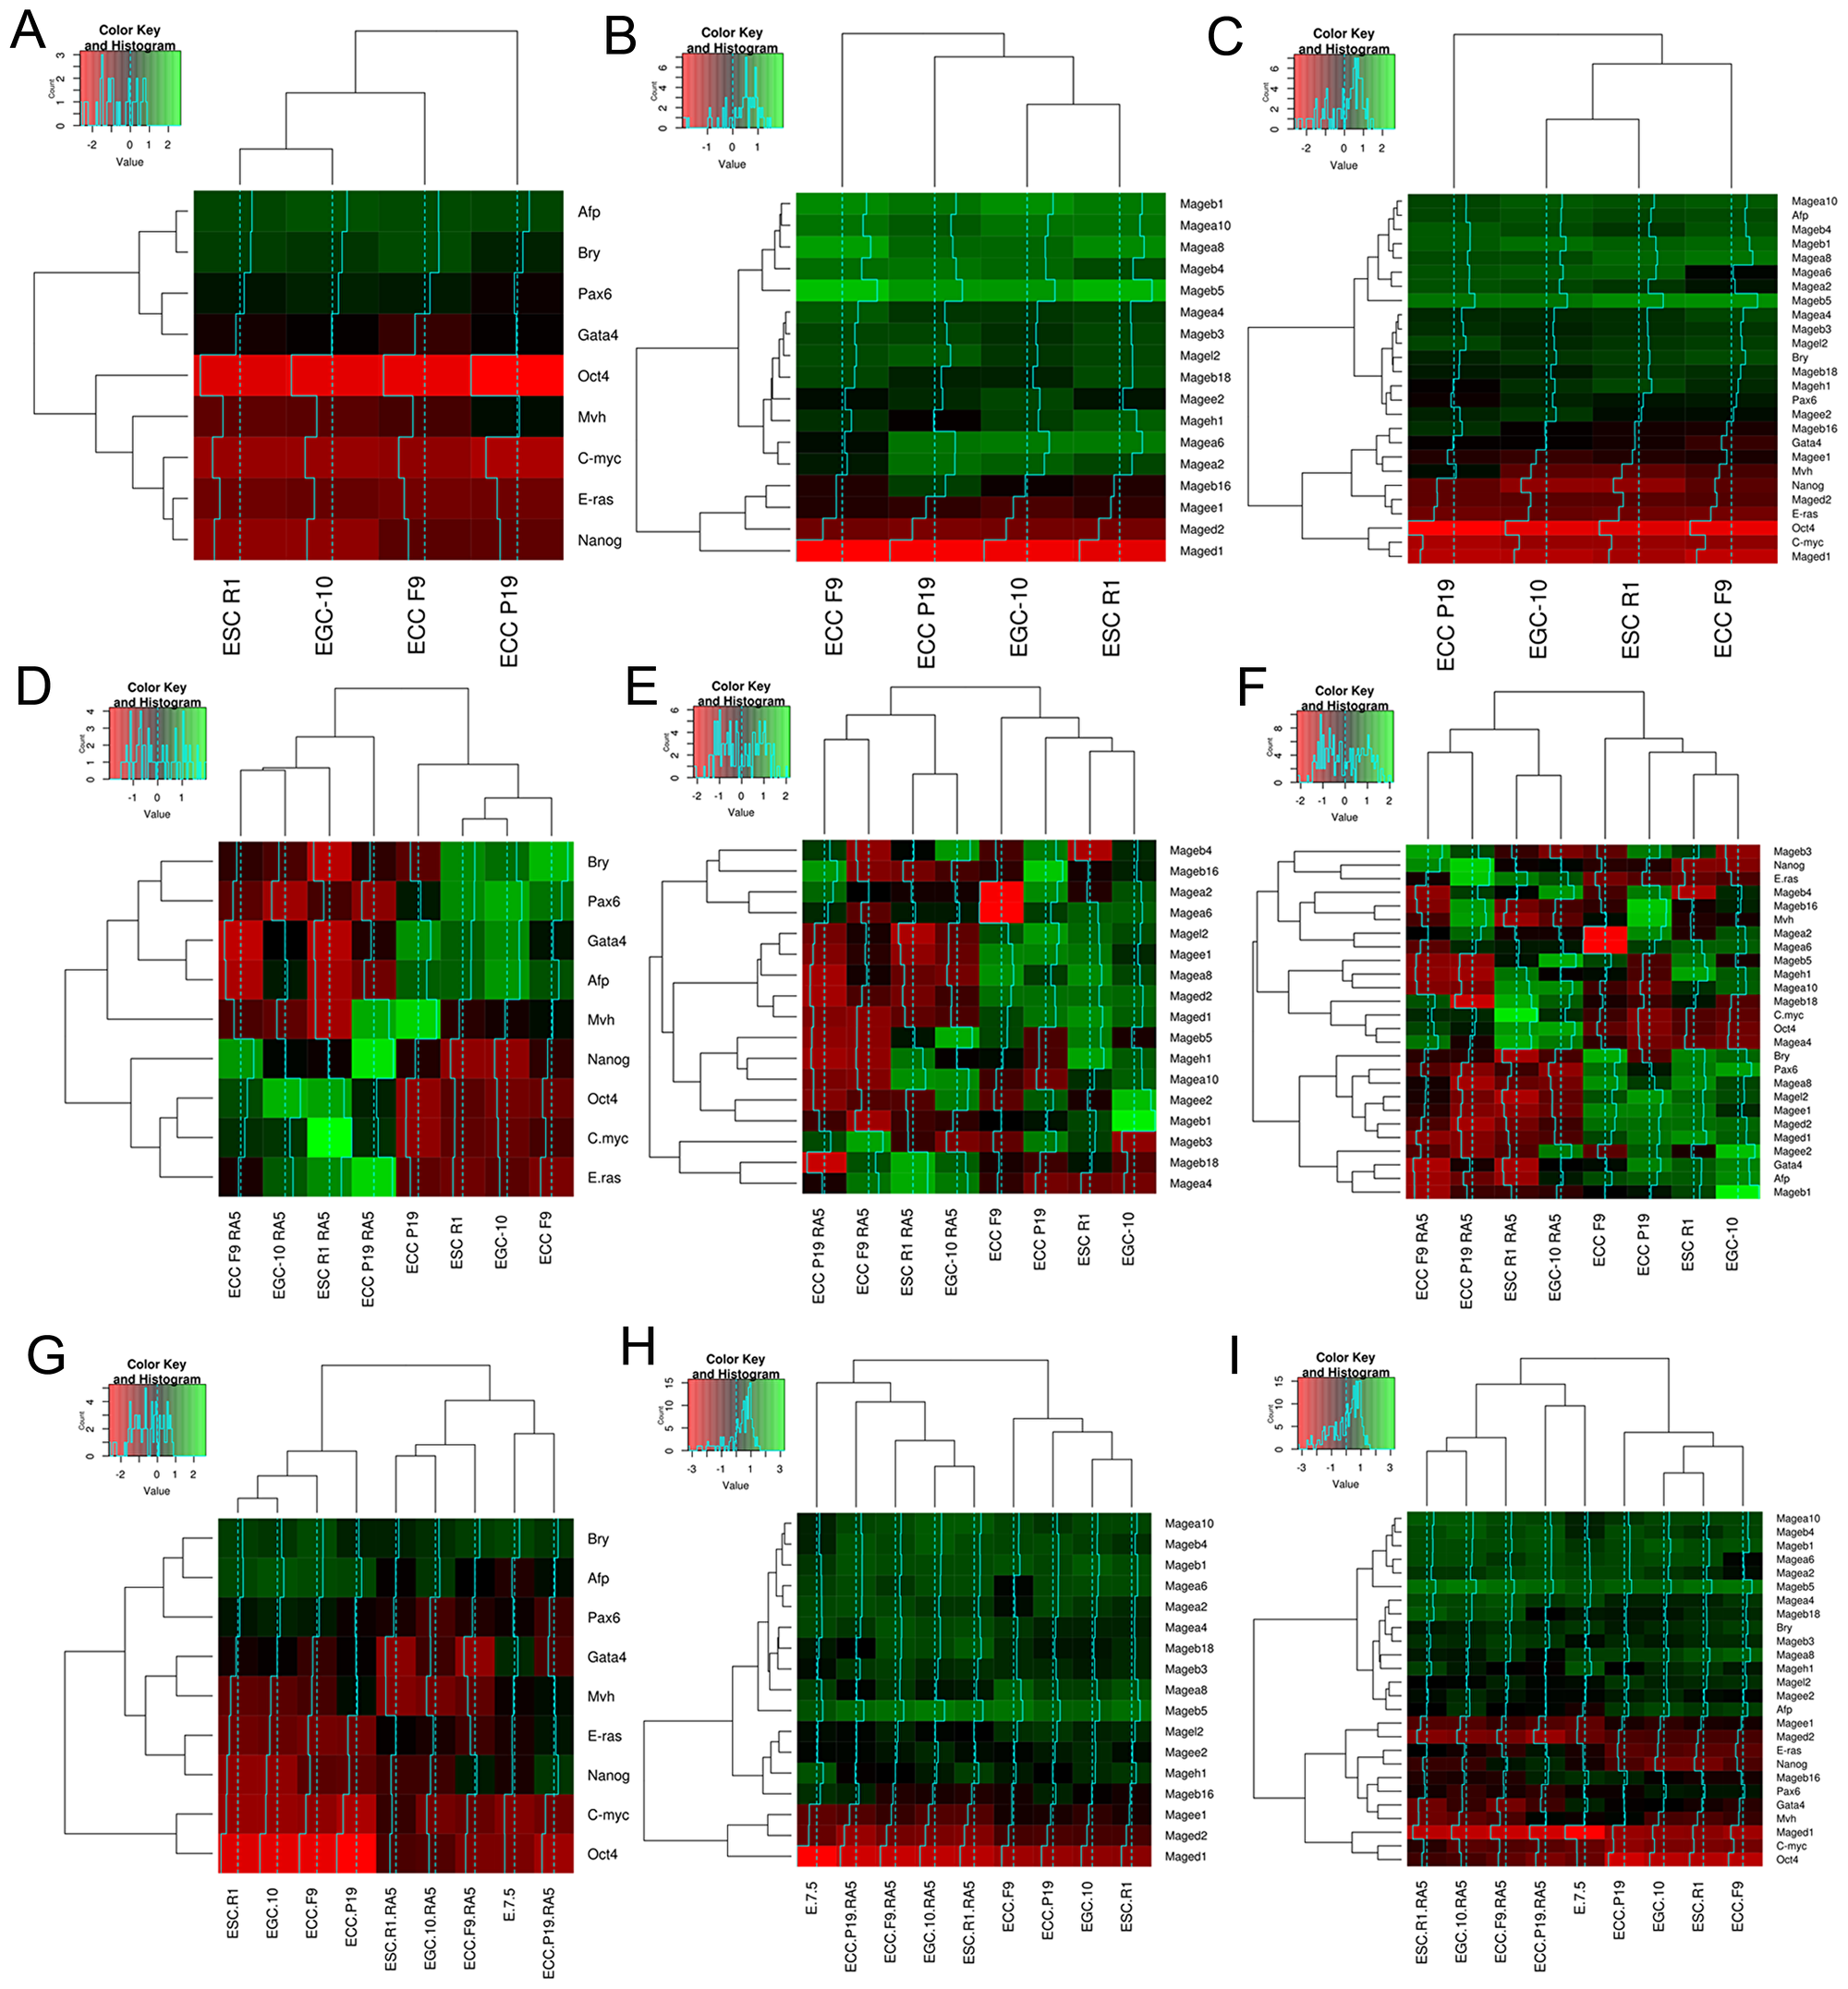
Figure 5: Heatmaps and hierarchical clustering dendrograms for gene expression patterns of ESC, EGC, ECC and E7.5 embryo. The results of expression pattern analyses for gene-markers (A, D, G), Mage family genes (B, E, H) and mutual gene expression patterns (C, F, I) in undifferentiated and differentiating ESCs, EGCs and ECCs and E7.5 embryos. (A–C) Dendrograms show dissimilarities of the Mage family profiles in normal pluripotent stem (ESCs R1 and EGCs-10) and teratocarcinoma cells (ECCs F9 and P19). (D–F) Dendrograms show strong consistency of the Mage expression patterns and differentiation states of ESCs, EGCs and ECCs. (G–I) The similarity of the Mage family and marker expression profiles of differentiating ESCs and E 7.5 embryos displays the consistency of the gene expression patterns during in vitro and in vivo differentiation of normal and malignant pluripotent stem cells.
The involvement of Mage family members in the self-renewal and differentiation of pluripotent stem and teratocarcinoma cells
To clarify whether the expression of individual Mage genes can be associated with the self-renewal or differentiation of pluripotent and teratocarcinoma cells, the Spearman’s rank correlation coefficients (rho) were estimated to evaluate the dependence between the expression of individual Mage genes and marker genes in undifferentiated and differentiating ESCs, EGCs, ECCs and E7.5 embryos (Supplementary Tables 4 and 5). To evaluate the correlation significance, false discovery rate (FDR) correction was applied using the Benjamini–Hochberg procedure (Q = 0.25). On average, 41% of Mage family genes had moderate and strong correlations (negative and positive) with the expression of 6–9 marker genes, 18% of them had only 1–5 such correlations and 41% had no significant correlations with marker genes. The significant moderate and strong correlations (rho ≥0.5 and rho≤-0.5) and possible relationships between the studied genes were summarized and visualized using the Graphviz software (Figure 6A).
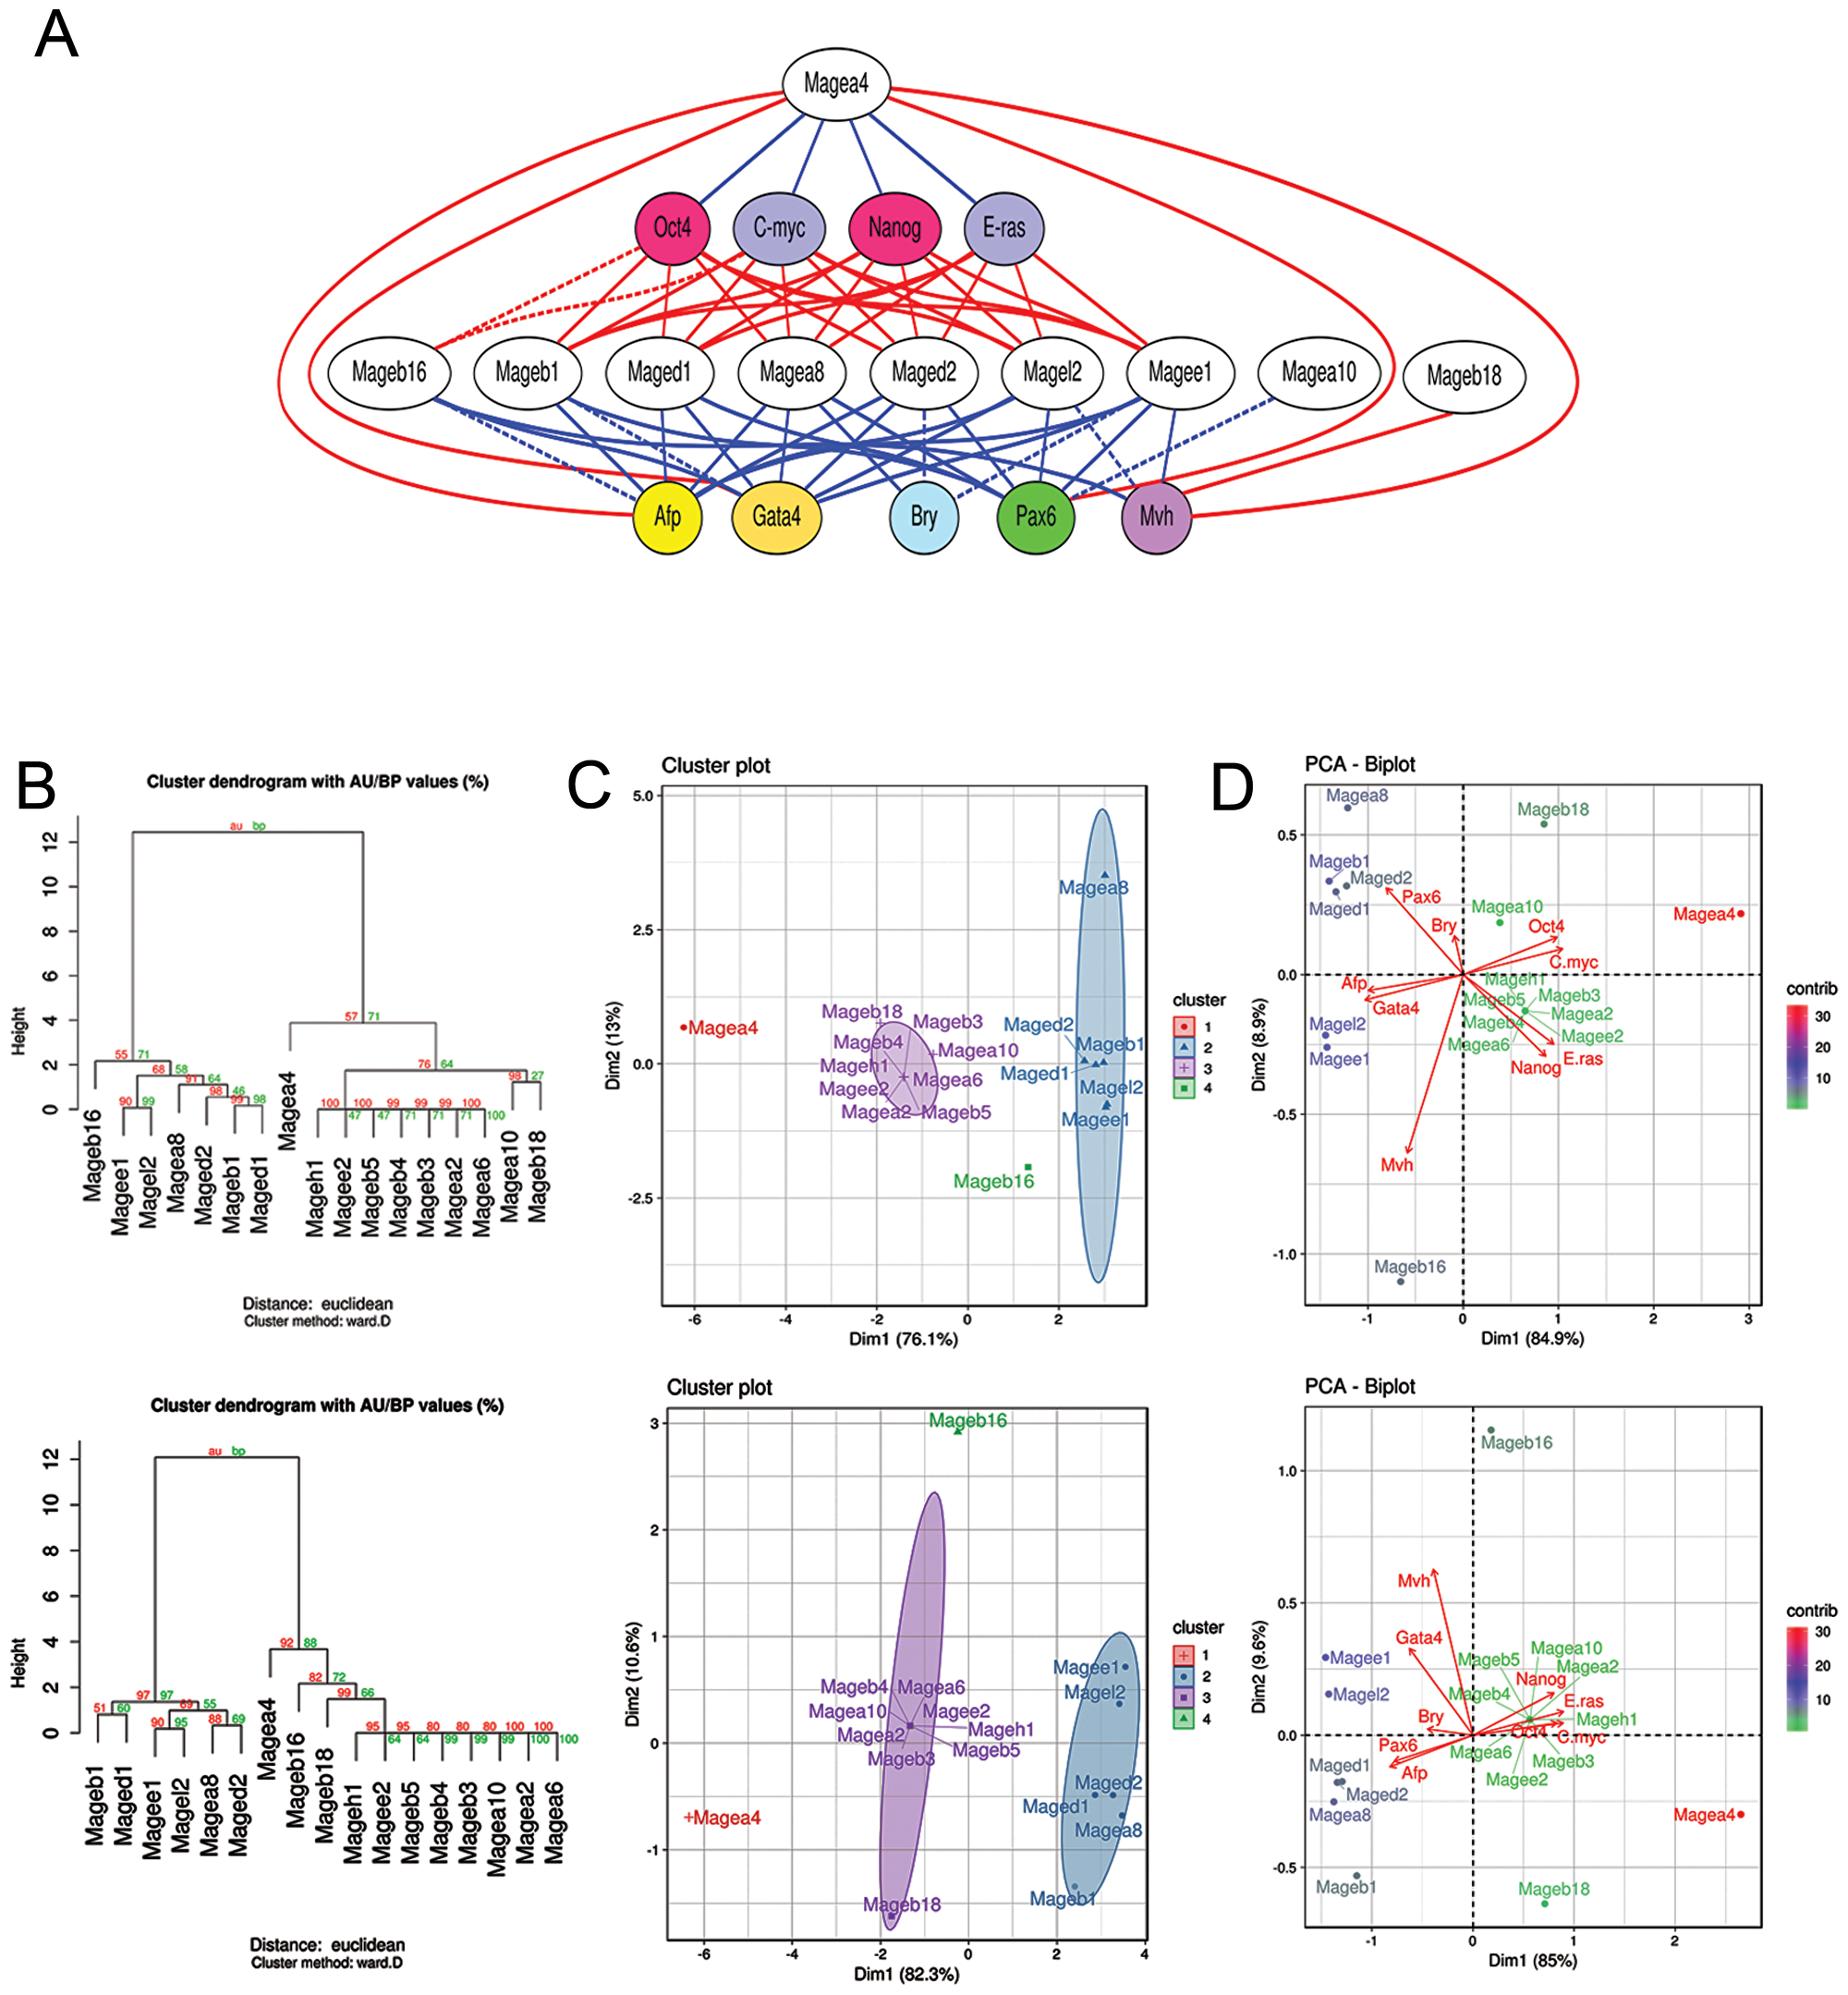
Figure 6: Mage family contributions in the self-renewal and differentiation of ESCs, EGCs, ECCs and E7.5 embryos. (A) Visualization of gene co-expression analysis based on significant strong and moderate correlations between the expression patterns of Mage family genes and pluripotency, proliferation and lineage markers using the Graphviz software. Blue and red lines indicate positive and negative correlations, relatively. Solid lines indicate moderate and strong correlations identified for both sets of cell populations analyzed; dashed lines indicate correlations identified for at least one set of cell populations (see Supplementary Tables 4 and 5). (B–D) Dendrograms for hierarchical clustering with Euclidean distances (B); the plots for k-means clustering, (k = 4) (C), and principal component analysis (PCA) (D), based on significant Spearman’s correlation coefficients (after FDR control using the Benjamini–Hochberg procedure) demonstrate similar cluster composition for both sets of cell populations analyzed: (top row) undifferentiated and differentiating ESCs, EGCs and ECCs and (low row) undifferentiated and differentiating ESCs, EGCs and ECCs and E 7.5 embryos. (D) PCA biplots of Spearman’s correlation coefficient datasets for Mage family and marker gene expression patterns. A PC1 and PC2 variances of 85% and 8.4–9.6%, respectively, indicate a clear separation of individual Mage expression patterns in the studied cell populations according to the involvement in self-renewal and differentiation (in correlations with respective gene markers). PCA outcomes are consistent with the results of cluster analyses (B–D). Colors indicate relative contributions of certain Mage genes in PC1 and PC2.
In the next step, to discover potential functionally related sets of Mage genes, the hierarchical and k-means clustering as well as principal component analysis (PCA) based on the Spearman’s correlation coefficient data for the Mages and marker genes with FDR control were performed. The clustering analysis identified two Mage gene clusters, which can be regarded as functional gene groups because their expression strongly correlated with the expression of proliferation and differentiation gene markers (Figure 6B, 6C). These two clusters were identified regardless of the clustering algorithm used for both cell population sets (Figure 6B, 6C). The first common cluster includes Mage-a4, whose expression positively correlates with pluripotency and self-renewal marker gene expression and negatively correlates with the expression of differentiation markers. The second cluster includes six genes, Mage-a8, Mage-b1, Mage-d1, Mage-d2, Mage-e1 and Mage-l2, whose expression strongly positively correlates with differentiation markers and negatively correlates with the expression of pluripotency and self-renewal markers (Figure 6B, 6C). Among the second cluster genes, the greatest expression dynamics are observed for ubiquitously expressed Mages. According to the estimated distances (Euclidian distance, Ward’s method) between the identified clusters and the opposite correlations with the expression of marker genes, the first and second clusters may be considered as functional antagonists. PCA also indicates a clear separation between the Mage gene groups, which belong to clusters 1 and 2 as identified by k-means clustering (Figure 6D). Moreover, Mage-b16 was defined as an individual group (cluster 4) during k-means clustering (k = 4) and PCA and its expression was correlated with the expression of lineage markers, Oct4 and C-myc but not with Nanog and E-ras.
Clustering and PCA outcomes for the other 9 Mage genes (Mage-a2,Mage-a6, Mage-a10, Mage-b3-b5, Mage-b18, Mage-h1 and Mage-e2) were similar for two sets of cell populations (Figure 6; Supplementary Tables 4 and 5). No significant correlations after applying the Benjamini–Hochberg procedure were revealed for the 7 Mage genes of cluster 3; however, Mage-a10 and Pax6 expressions were correlated with expression of somatic lineages and Mage-b18 expression was correlated negatively with the expression of the germ cell marker Mvh.
DISCUSSION
To improve our understanding of the biological roles of CTAs in carcinogenesis, development, and differentiation, the dynamics of the expression patterns of Mage family members during the early differentiation of normal pluripotent stem cells and their malignant counterparts, teratocarcinoma cells, were verified using gene co-expression analysis. The clustering of gene expression patterns and analysis of correlations between the expression of Mage family members and proliferation and lineage differentiation markers revealed three main findings: (i) the similarity of the Mage gene expression patterns in differentiating ESCs and E 7.5 embryos; (ii) dissimilarities of the Mage family profiles in normal pluripotent stem (ESCs R1 and EGCs-10) and teratocarcinoma cells (ECCs F9 and P19); and (iii) strong correlations between the Mage expression patterns and differentiation states. These findings indicate that Mage expression in ESCs is not a phenomenon of rearranged gene expression in cultured pluripotent cells, but is involved in the regulation of lineage differentiation during the early development. However, aberrant Mage family expression patterns, like the patterns of marker genes, is probably the result of a general rearrangement of the regulatory network in teratocarcinoma cells with impaired differentiation potential (Figures 1D, 3 and 5). Therefore, the Mage family expression pattern can be considered as a biomarker panel for the validation of normal and abnormal stem cell differentiation. Thus, difference in the expression levels of Mage-a2 detected in this work between mouse pluripotent and teratocarcinoma cells, likewise in MAGE-A2 expression between human ESCs and ECCs [34], may be characteristic for teratocarcinoma cells and contribute to their malignant phenotype with imbalance of proliferation and differentiation potentials. Additionally, the over-expression of MAGEA2 was found to intensify the self-renewal and to repress differentiation efficiency of human induced pluripotent stem cells while depletion of Mageb16 in mouse ESCs induced more effective differentiation [49, 50]. In cancer cells, MAGEA2 and MAGEA6 promote cell growth and survival by targeting tumor suppressor protein AMP-activated protein kinase and preventing of ubiquitination and proteasome-dependent degradation, and acetylating p53 through histone deacetylase recruitment [6, 51–54]. Similarly, MAGE-H1 can trigger apoptosis in melanoma cells through involvement of JNK/p38 pathway [55].
In our study, presumably functionally related gene modules were identified using the approaches of co-expression analyses (Spearman’s correlation analysis and clustering) for the expression patterns of Mage family genes and regulators of pluripotency, self-renewal and lineage differentiation in pluripotent stem and teratocarcinoma cells. We showed that the expression of Mage-a4 (the first gene cluster) is strongly positively correlated with the expression of C-myc and E-ras and negatively correlated with lineage marker expression. Accordingly, Mage-a4 expression appeared to be associated with the up-regulation of self-renewal and the down-regulation of differentiation of ESCs, EGCs and ECCs (Figure 6). This putative role of Mage-a4 in pluripotent stem cells is supported by the findings of previous studies, which reported the influence of MAGE-A4 on cell cycle progression, proliferation and apoptosis in human cancer cells. MAGE-A4 can bind to Miz-1 and indirectly affect C-myc through regulation of the transcription of p21CIP1 and thereby influence the growth rate and p53-dependent and p-53-independent apoptosis in various cancer cells [2, 5, 7, 56, 57]. The overexpression of MAGE-A4 promoted the growth of spontaneously transformed normal oral keratinocytes by inhibiting apoptosis and growth arrest in the G1-phase of the cell cycle [56]. Moreover, MAGE-A4 may be a direct target of TWIST1 [58], which also up-regulates cell cycle progression, proliferation and migration and inhibits cell death in cancer and embryonic cells [59].
Conversely, the expression of Mage-a8, Mage-b1, Mage-d1, Mage-d2, Mage-e1 and Mage-l2 (the second gene cluster) correlated negatively with the expression of self-renewal and pluripotency markers and positively with the expression of lineage differentiation markers (Figure 6). Consequently, the Mage genes in these two clusters may be considered as functional antagonists with opposing roles in the regulation of self-renewal and differentiation in mouse pluripotent stem and teratocarcinoma cells. Although all Mage family proteins of both classes contain the conserved Mage family domain (MHD), their N- and C-terminal regions differ significantly (Homologene, https://www.ncbi.nlm.nih.gov/homologene) [21, 41, 60]. Structural identity between the proteins of the first and second clusters was found in the range of 10–40%, except for Mage-a4 and Mage-a8 proteins (69%). In addition, Mage-d1, Mage-d2, Mage-e1 and Mage-l2 display 15–30% similarity of protein sequences. Such significant structural differences between members of the first and second clusters allow potential interactions with diverse domains in protein complexes activated during self-renewal and early differentiation. Our data are consistent with previous findings showing the involvement of the second cluster genes in the regulation of proliferation, apoptosis, migration and differentiation of cancer and embryonic cells. Thus, the expression of MAGE-D1 proteins was significantly reduced in human breast carcinoma cells compared to untransformed immortal mammary epithelial cell lines, while the overexpression of MAGE-D1 in hepatocarcinoma, osteosarcoma, breast carcinoma and kidney epithelial cell lines led to the suppression of cell migration, invasion, adhesion and to the arrest of cell proliferation at the G1/S and G2/M stages through a p53-dependent pathway [61–63]. Reportedly, both classes of MAGE family proteins can bind and activate RING E3 ubiquitin ligases and regulate p53 protein stability in cancer cells [64].
During development and differentiation, the expression of Mage-d1/NRAGE exhibited specific spatio-temporal patterns in the neural structures and differentiating osteogenic cells [65–67], and Mage-d1 and Mage-d2 exhibited distinct expression patterns in mouse embryonic tissues of neuroectodermal and mesodermal origin [20]. Predominant MAGE-A8 expression was also detected in the early differentiating mesenchymal, neuroectodermal and extraendodermal cells derived from human ESCs [34], indicating a possible common mechanism with MAGE-A8/Mage-a8 regulating the early differentiation stages of mouse and human pluripotent stem cells. Mage-l2 has been shown to involve in neural development and the regulation of male and female reproductive functions [21, 68–70], while Mage-b16 (cluster 4) expression was associated with the expression of genes regulating pluripotency, spermatogenesis and somatic lineage differentiation [50]. Noteworthy, the differential expression of both classes of Mage family genes was detected during development of reproductive and somatic derivatives in mice (Mouse Genome Informatics: references: J:262143; J:255000; J:257298; J:257299).
Obviously, the regulation of Mage family gene expression during the early development and carcinogenesis is associated with epigenetic mechanisms via DNA methylation and histone modification, as well as non-coding RNAs, miRNAs and ceRNA [71, 72]. During RA-induced differentiation of pluripotent and teratocarcinoma cells, all these epigenetic mechanisms can be recruited for initiation/repression of expression of regulatory and Mage family genes, like the miR-152-mediated effects on the genome-wide methylation state during RA-induced neuroblastoma cell differentiation [73]. MiR-874, miR-143-3p, miR-876-5 and miR-6775-3p have also been shown to contribute to the down-regulation of MAGE gene expression in cancer cells [74–77] and vice versa, MAGEH1 can suppress breast cancer metastases through upregulating mir-200a/b expression [78].
To summarize the obtained data of gene co-expression analysis, a model of Mage family involvement in the regulation of different steps of self-renewal and differentiation of pluripotent stem and teratocarcinoma cells is presented in the scheme (Figure 7). Thus, several Mage gene modules were identified during normal and cancerous differentiation of pluripotent stem cells. The first predicted module includes Mage-a4, which contributes during the self-renewal stage. The gene module with variable expression of Mage-a2, Mage-a6, Mage-b4, Mage-h1 and Mage-b16 represents an additional teratocarcinoma-specific module activated during the self-renewal. The second module with Mage-e1 and Mage-l2 is involved in the regulation of the onset of differentiation of both somatic and germ cell precursors because the expression of these genes correlated positively with the expression of most lineage differentiation markers. The third module, which includes Mage-d1, Mage-d2, Mage-a8 and Mage-b1 is associated with the early differentiation of somatic lineages. In addition, the expression of Mage-b16, Mage-b18 and Mage-a10 correlates with a commitment to the certain germ and somatic lineages. In accordance to the present model, the Mage family proteins, involved in the regulation of proliferation and differentiation of embryonic and cancer cells, can play a role of protein hubs in the regulatory network and be important for carcinogenesis. Mage proteins, as potential intrinsically disordered proteins with a high binding plasticity, can interact with many partners and change their activity. In addition, Mage family proteins involved in preventing of protein degradation can affect the stability, time and level of expression of key regulators of cellular processes.
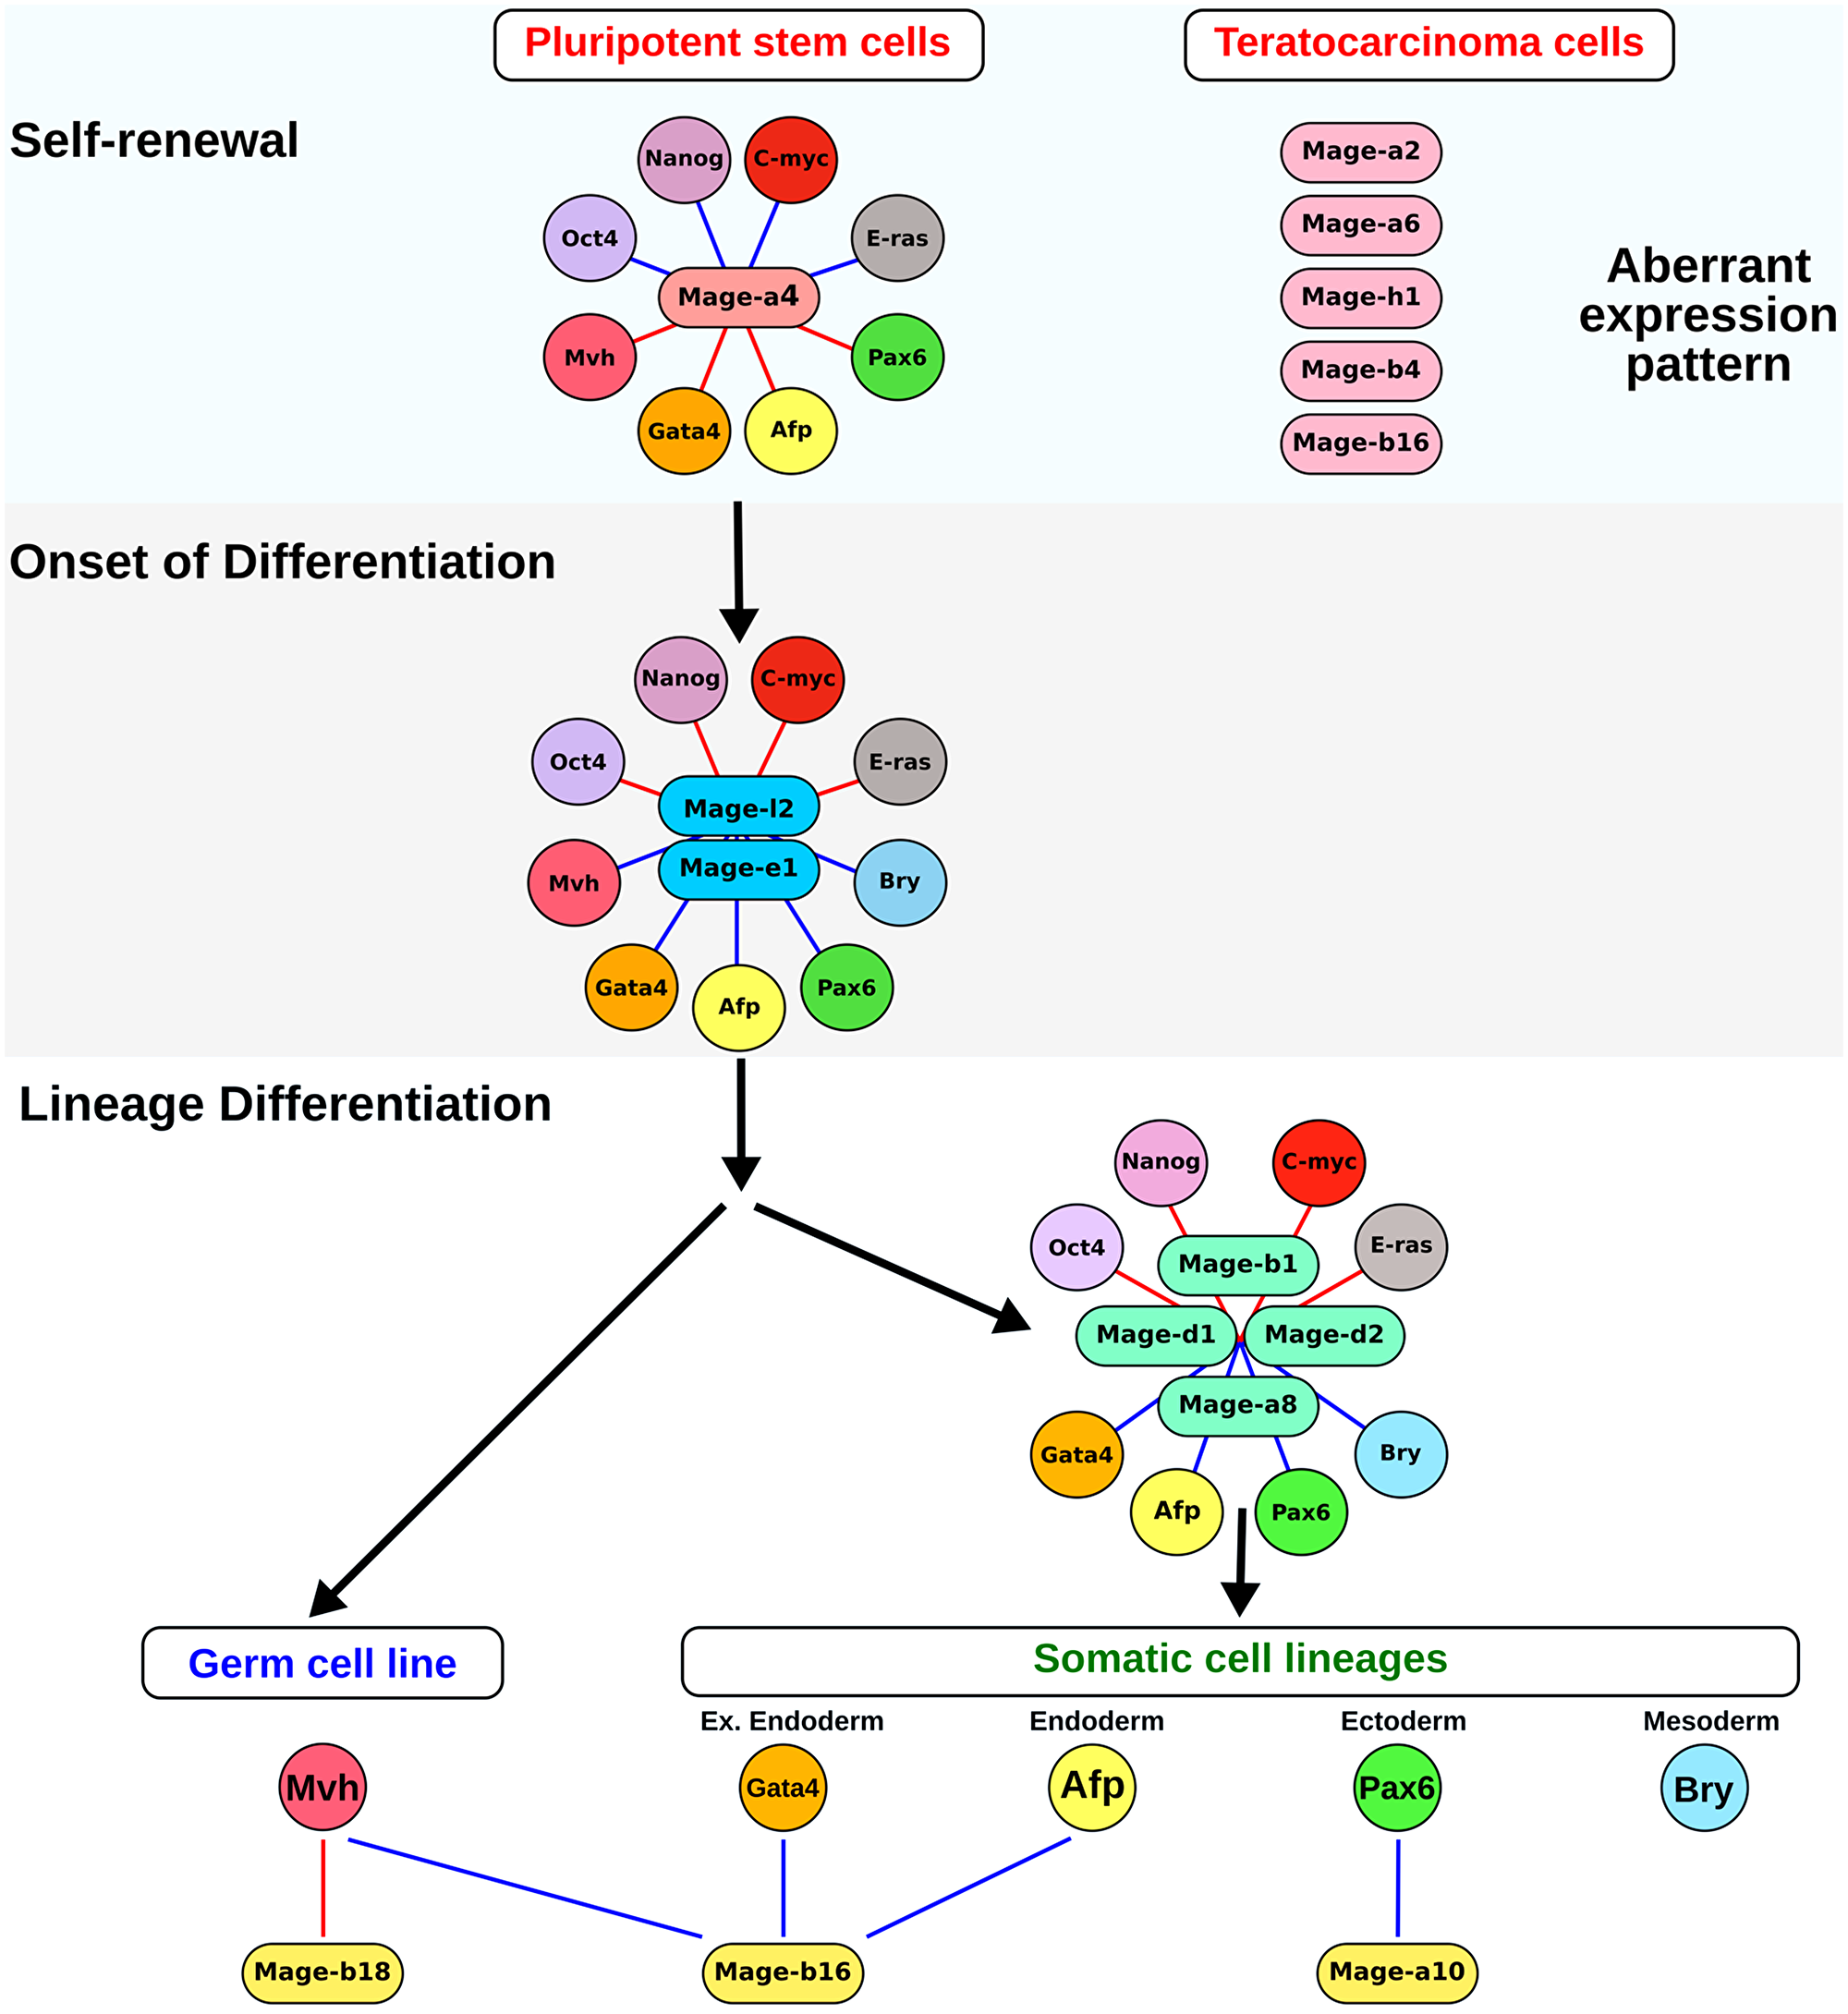
Figure 7: A model for Mage family involvement in the self-renewal and differentiation of pluripotent stem and teratocarcinoma cells. The first module with Mage-a4 is involved in the positive regulation of self-renewal of pluripotent stem and teratocatcinoma cells. Additional module with variable expression of Mage-a2, Mage-a6, Mage-h1, Mage-b4 and Mage-b16 is associated with teratocarcinogenesis. The second module with Mage-e1 and Mage-l2 is activated after the initiation of differentiation. The early somatic lineage differentiation is associated with the expression of Mage-a8, Mage-b1, Mage-d1 and Mage-d2, which belong to the third gene module. Additionally, the germ and somatic lineage differentiation correlates with changes in the expression of Mage-b16,Mage-b18 and Mage-a10. Blue and red lines indicate positive and negative correlations, relatively.
To conclude, the present study identified aberrant expression patterns for 5 of 17 (29%) Mage family genes along with 6 of 9 (67%) marker genes when comparing pluripotent stem and teratocarcinoma cells. The clustering analysis revealed strong correlations between Mage expression patterns and malignant and differentiation states. Clustering analysis identified two Mage clusters/modules as functional antagonists with opposing roles in the regulation of proliferation and differentiation of pluripotent stem and teratocarcinoma cells, and further investigations of predicted functional modules with the identified Mage gene clusters are needed to evaluate their contributions in the regulatory protein networks of normal and cancer stem cells.
Materials and Methods
Cell culture
Mouse ESCs of the R1 line were kindly provided by Dr. A. Nagy (Mount Sinai Hospital, Toronto, Canada). Mouse EGC-10 cell line were kindly provided by Dr. A. McLaren (WTCR Institute of Cancer and Developmental Biology, Cambridge, UK). Mouse ECCs of the F9 and P19 lines were obtained from the Russian Cell Culture Collection (http://www.rccc.cytspb.rssi.ru/). The ESCs, EGCs and ECCs were cultivated in DMEM supplemented with 2 mM L-glutamine, 1% non-essential amino acids (all HyClone, GE Healthcare Life Sciences, USA), 0.1 mM β-mercaptoethanol (Sigma-Aldrich, USA) and 15% Characterized Fetal Bovine Serum (HyClone, USA). Undifferentiated mouse ESCs and EGCs were grown in gelatin-coated tissue culture plates in medium containing 10 ng/ml leukemia inhibitory factor (LIF, L-5158, Sigma-Aldrich).
To induce differentiation, the ESCs, EGCs and ECCs were seeded at a density of 5000 cells/cm2 and treated with 10–6 M all-trans-retinoic acid (RA, Sigma-Aldrich) for 5 or 10 days. The medium without LIF and supplemented with RA was changed daily. For microscopy analyses (fluorescent immunocytochemistry, alkaline phosphatase activity detection and cell labeling in the S-phase of the cell cycle), the undifferentiated cells (5000/cm2) were seeded in an 8-well Lab-Tek II chamber slide system plates and induced to differentiation with RA using the same schedule (Nalge Nunc International, USA). All experimental series were performed in triplicate. All cell lines were routinely tested using MycoFluor™ Mycoplasma Detection Kit (Invitrogen, USA).
Mouse embryos sampling and ethics approval statement
Animal maintenance and experiments were approved by the Ethics Committee of Koltsov Institute of Developmental Biology of Russian Academy of Sciences and performed in accordance with the Russian Federation legislation (Order of the Ministry of Health and Social Development of the Russian Federation No 708n, August 28, 2010) based on the Directive 2010/63/EU of the European Parlament and of the Council on the protection of animals used for scientific purposes.
C57Bl/6 mice at the age of 2–3 months were obtained from the Animal Breeding Facility-Branch “Pushchino” (Institute of Bioorganic Chemistry, Russian Academy of Sciences). To obtain embryos, females were mated with males overnight, and vaginal plugs were tested following morning (embryonic stage E0.5). Fertilized females were sacrificed by cervical dislocation, and embryos at the E7.5 stage were recovered from the uterus. After the dissection of the embryos from the extraembryonic tissues the total RNAs were extracted from the isolated epiblasts and the adjacent extraembryonic endoderm.
Alkaline phosphatase (ALP) activity detection
The cells were fixed with 2% paraformaldehyde in PBS, pH 7.0, for 15 min and incubated in a solution containing 10 ml 0.02 M Tris-HCl buffer pH 8.7, 1 mg Naphtol-AS-B1-phospate and 5 mg Fast Red dye (all from Sigma-Aldrich) at 37°C for 1 h.
EdU-labeling of cells in the S-phase of the cell cycle
The labeling and detection of cells in the S-phase of the cell cycle were performed by incubating the cells with 10 μM 5-ethynyl-2-deoxyuridine (EdU) for 1 h and then with a reaction solution from the Click-iT® EdU Imaging Kit with Azide-Alexa488 (C10083, Molecular Probes, USA) according to the protocol recommended by the manufacturer. After the completion of the Click-iT® EdU reaction, the cells were fixed with 3% paraformaldehyde in PBS for further immunofluorescence staining.
Immunofluorescent analysis
After treatment with 3% paraformaldehyde in PBS for 1 h, cells were washed with PBS, permeabilized with 0.5% Triton X-100 (Sigma-Aldrich) in PBS for 30 min and incubated in 3% Bovine Serum Albumin, Fraction V (BSA, Sigma-Aldrich) in PBS for 1h for nonspecific reaction blocking. The cells were incubated in a solution of primary antibodies in PBS with 0.25% Tween 20 (Sigma-Aldrich) at 4°C overnight. Primary rabbit anti-Mage (sc-10749), rabbit anti-Oct4 (sc-9081) and goat anti-Gata4 (sc-1237) antibodies (Santa Cruz Biotechnology, USA) were used at a dilution of 1:100. Secondary chicken anti-rabbit antibody conjugated with Alexa Fluor 594 (A-21442, Molecular Probes), and donkey anti-goat with Alexa Fluor 488 (A-11055, Molecular Probes) were diluted to 1:900 in PBS-Tween solution and applied to the cells for 3 h at room temperature. DAPI (Sigma-Aldrich) was applied for 20 min for nuclear staining. The preparations were mounted in a glycerol-based mounting medium (Ibidi, Germany) and examined under a Leica DMRXA2 fluorescent microscope. For negative controls, the primary antibodies were omitted, and the same staining procedure was used. For positive control, immunostaining of cryosections of the mouse testis was performed, as described previously [46]. Transverse cryosections were prepared from E7.5 mouse embryos fixed with 3% paraformaldehyde using the same immunostaining protocols.
Flow cytometry
To analyze the cell cycle distributions, the cells were suspended in 0.05% Trypsin-EDTA (HyClone) and fixed with cold 70% ethanol. After triple washing with PBS the cells (106/ml) were incubated in PBS containing 20 μg/mL of propidium iodide (Molecular Probes) and 200 μg/mL of RNAse A (EN0531, Fermentas, Lithuania) for 30 min. The probes were analyzed immediately after staining using a Cytomics FC500 flow cytometer (Beckman Coulter, USA) and MultiCycle AV Software (Phoenix Flow Systems, San Diego, CA, USA).
For the flow cytometry analysis of Oct4-expressing cells, the cells (106/ml) were fixed with 3% paraformaldehyde in PBS for 15 min, washed with PBS and treated with 0.5% Triton X-100, 3% BSA and rabbit anti-Oct4 antibodies (1:200, sc-9081, Santa Cruz Biotechnology) in PBS for 40 min. After washing, the cells were incubated in PBS solution with 0.5% Triton X-100, 3% BSA and secondary chicken anti-rabbit antibodies conjugated with Alexa-488 (1:1000, A-21441, Molecular Probes) for 30 min. For the negative control, the cells were treated with normal rabbit IgG (sc-3888, Santa Cruz Biotechnology) and then with the same secondary antibody solution.
Protein extractions and western blots
The cells were washed with ice cold PBS, and then lysed in 300 μl of NP-40 solution (0.5% Nonidet P-40, 50 mM Tris pH 8.1, 50 mM NaCl solution; all reagents from Sigma-Aldrich) with cOmplete™ ULTRA Protease Inhibitor Cocktail (05892970001; Roche-Sigma-Aldrich). Cell lysates were clarified by centrifugation at 14000 × g for 20 min at 4°C. Protein concentrations were determined using NanoDrop 2000 (Thermo Scientific, USA) and the BCA Protein Assay Kit (23227; Pierce-Thermo Scientific, USA) according to the manufacturer’s instructions. The samples were diluted in 2× Laemmli buffer (Sigma-Aldrich) and denatured by boiling followed by chilling on ice.
Probes containing 7 μg of proteins were separated by SDS-PAGE in 10% gels (A2792; Sigma-Aldrich) at 150 V for 1.5 h and then transferred to nitrocellulose membrane (RPN303D; Amersham/GE Healthcare Life Sciences, USA) at 120 mA for 2 h using the Mini Trans-Blot cell (Bio-Rad Laboratories, USA). Membranes were blocked in TBST (1×Tris-buffered saline, pH 7.5, 0.1% (vol/vol) Tween-20 (Sigma-Aldrich)) with 5% (wt/vol) nonfat dry milk (170-6404; Bio-Rad Laboratories) and immunoblotted with the following antibodies and dilutions overnight at 4°C: rabbit anti–MAGED2/D1 polyclonal antibody (NBP2-24694, lot AB 041309A-01; Novus Biologicals, USA; at 5 μg/ml), rabbit anti-Oct4 polyclonal antibody (sc-9081, Santa Cruz Biotechnology; at 5 μg/ml), goat anti-Gata4 polyclonal antibody (sc-1237; Santa Cruz Biotechnology; at 5 μg/ml), rabbit anti-Ddx4/Mvh polyclonal antibody (ab13840; lot 773844; Abcam, UK; at 2 μg/ml), mouse anti-α-tubulin monoclonal antibody (T-6793, Sigma-Aldrich; 1:2000). Membranes were washed 3 times for 20 minutes in TBST and incubated with the appropriate horseradish peroxidase-conjugated secondary antibodies: goat anti-rabbit and anti-mouse IgG (170-5046 and170-5047, respectively; Bio-Rad) and bovine anti-goat IgG (805-035-180; Jackson ImmunoResearch Laboratories, West Grove, PA, USA) at 1:5000 dilutions for 1 h at room temperature. After washing (3 times for 20 min), the chemiluminescent signals on the membranes were detected using the ECL Plus Western Blotting Detection Reagents (RPN 2132; Amersham/GE Healthcare Life Sciences) and captured using Fusion Solo S chemiluminescence imaging system (Vilber Lourmat, France). The relative band intensity was quantified using the Gel Analysis method outlined in the ImageJ documentation (http://rsb.info.nih.gov/ij/docs/menus/analyze.html#gels). Pre-stained molecular weight protein standard SDS-PAGE Broad Range Standard (161-0318, Bio-Rad) was used.
RNA extraction and cDNA synthesis
Total RNAs were extracted from the undifferentiated and differentiated ESCs, EGCs, ECCs (0.5 × 10⁶ cells per sample) and E7.5 mouse embryos (n = 3 per samples) using the TRIzol® Reagent (15596-018, Invitrogen). Each sample was treated with TURBO DNase (AM1907, Ambion/Invitrogen, USA) according to the manufacturer’s recommendations. The RNA yield and quality were analyzed using NanoDrop 2000 (Thermo Scientific, USA). cDNAs were synthesized using oligo-dT18 primer (Fermentas) and SuperScript III reverse transcriptase (Invitrogen) according to the manufacturer’s protocols. Two micrograms of total RNA were used for cDNA synthesis. Total RNAs extracted from adult mouse testes were used as a positive control.
Quantitative real-time polymerase chain reaction (qRT-PCR)
A quantitative analysis of gene expression was carried out using the Applied Biosystems 7500 Real-Time PCR System (Life Technologies, USA) with the qRT-PCR master mix with EVA Green stain and ROX passive reference dye (Sintol, Russia). The following protocol was used: denaturation at 95°C for 5 min, followed by 40 cycles at 95°C for 15 sec and at 60°C for 1 min. All experiments were run in triplicate. The expression levels of target mRNAs were normalized to the expression of the reference gene hypoxanthine-guanine phosphoribosyltransferase (Hprt). The relative levels of target gene expression were calculated using the comparative 2-ΔΔCt method (ABI Relative Quantification Study software, Applied Biosystems, USA). Specific primers were designed based on GenBank and Ensemble data concerning the annotated sequences of the target genes using the Beacon Designer 8.0 software (Premier Biosoft, Palo Alto, CA, USA) (Supplementary Table 6). Due to high homology of mouse Mage genes, the primers were designed to detect the expression of five of eight genes the Mage-a subfamily and all genes of the Mage-b,Mage-d, Mage-e, Mage-l and Mage-h subfamilies The designed Mage primers were pre-screened using cDNAs synthesized from total RNAs from adult mouse testes (Supplementary Figure 4 and Supplementary Table 7).
Statistical and bioinformatics analyses of gene expression
The gene expression data were subjected to statistical analysis using the R v.3.2.3 software (http://www.r-project.org). The averaged ΔCt values (Supplementary Tables 1–3) for target genes obtained from three independent experiments (n = 3) were used for statistical analysis using one-way ANOVA followed by a Tukey post-hoc test.
To determine the similarity/dissimilarity of the gene expression patterns of the studied cells and embryos, the heatmaps with the hierarchical dendrograms were constructed using hierarchical clustering algorithm with Euclidean distances measurement based on the averaged ΔCt values of studied genes after data scaling using the R v.3.2.3 software.
The averaged ΔCt values for Mage and marker genes were used in the linear regression analysis based on Spearman’s correlation method (Supplementary Tables 4 and 5). The normality of the ΔCt values for each gene pair was evaluated using the Shapiro-Wilkoxon normality test. Correlations were considered as strong at 0.7
To discover Mage gene modules involved in the regulation of proliferation and differentiation, the hierarchical and k-means clustering, as well as principal component analysis (PCA) based on Spearman’s correlation coefficient data were performed after the Benjamini–Hochberg procedure (Q = 0.25) using the R v.3.2.3 software. The insignificant Spearman’s correlation coefficients (after Benjamini–Hochberg procedure) were taken as 0 in the data matrices. In hierarchical clustering, the measurement of the Euclidean distances was carried out by the Ward method. For the k-means clustering, the cluster composition was analyzed for k = 4.
CONFLICTS OF INTEREST
The authors declare that they have no competing interests.
FUNDING
This work was supported by the Russian Foundation for Basic Research (grant number 14-04-00419).
References
1. Jungbluth AA, Ely S, DiLiberto M, Niesvizky R, Williamson B, Frosina D, Chen Y, Bhardwaj N, Chen-Kiang S, Old LJ, Cho HJ. The cancer-testis antigens CT7 (MAGE-C1) and MAGE-A3/6 are commonly expressed in multiple myeloma and correlate with plasma-cell proliferation. Blood. 2005; 106:167–174. https://doi.org/10.1182/blood-2004-12-4931. [PubMed].
2. Nagao T, Higashitsuji H, Nonoguchi K, Sakurai T, Dawson S, Mayer RJ, Itoh K, Fujita J. MAGE-A4 interacts with the liver oncoprotein gankyrin and suppresses its tumorigenic activity. J Biol Chem. 2003; 278:10668–10674. https://doi.org/10.1074/jbc.M206104200. [PubMed].
3. Ohman Forslund K, Nordqvist K. The melanoma antigen genes--any clues to their functions in normal tissues?. Exp Cell Res. 2001; 265:185–194. https://doi.org/10.1006/excr.2001.5173. [PubMed].
4. Por E, Byun H, Lee E, Lim J, Jung S, Park I, Kim Y, Jeoung D, Lee H. The cancer/testis antigen CAGE with oncogenic potential stimulates cell proliferation by up-regulating cyclins D1 and E in an AP-1- and E2F-dependent manner. J Biol Chem. 2010; 285:14475–14485. https://doi.org/10.1074/jbc.M109.084400. [PubMed].
5. Sakurai T, Itoh K, Higashitsuji H, Nagao T, Nonoguchi K, Chiba T, Fujita J. A cleaved form of MAGE-A4 binds to Miz-1 and induces apoptosis in human cells. J Biol Chem. 2004; 279:15505–15514. https://doi.org/10.1074/jbc.M310437200. [PubMed].
6. Yang B, O’Herrin S, Wu J, Reagan-Shaw S, Ma Y, Nihal M, Longley BJ. Select cancer testes antigens of the MAGE-A, -B, and -C families are expressed in mast cell lines and promote cell viability in vitro and in vivo. J Invest Dermatol. 2007; 127:267–275. https://doi.org/10.1038/sj.jid.5700548. [PubMed].
7. Marcar L, Maclaine NJ, Hupp TR, Meek DW. Mage-A cancer/testis antigens inhibit p53 function by blocking its interaction with chromatin. Cancer Res. 2010; 70:10362–10370. https://doi.org/10.1158/0008-5472.CAN-10-1341. [PubMed].
8. Rochira JA, Cowling RA, Himmelfarb JS, Adams TL, Verdi JM. Mapping of NRAGE domains reveals clues to cell viability in BMP signaling. Apoptosis. 2010; 15:63–70. https://doi.org/10.1007/s10495-009-0427-6. [PubMed].
9. Yang B, O’Herrin SM, Wu J, Reagan-Shaw S, Ma Y, Bhat KM, Gravekamp C, Setaluri V, Peters N, Hoffmann FM, Peng H, Ivanov AV, Simpson AJ, Longley BJ. MAGE-A, mMage-b, and MAGE-C proteins form complexes with KAP1 and suppress p53-dependent apoptosis in MAGE-positive cell lines. Cancer Res. 2007; 67:9954–9962. https://doi.org/10.1158/0008-5472.CAN-07-1478. [PubMed].
10. Yang F, Zhou X, Miao X, Zhang T, Hang X, Tie R, Liu N, Tian F, Wang F, Yuan J. MAGEC2, an epithelial-mesenchymal transition inducer, is associated with breast cancer metastasis. Breast Cancer Res Treat. 2014; 145:23–32. https://doi.org/10.1007/s10549-014-2915-9. [PubMed].
11. Caballero OL, Cohen T, Gurung S, Chua R, Lee P, Chen Y, Jat P, Simpson AJG. Effects of CT-Xp gene knock down in melanoma cell lines. Oncotarget. 2013; 4:531–541. https://doi.org/10.18632/oncotarget.921. [PubMed].
12. Gaskell TL, Esnal A, Robinson LLL, Anderson RA, Saunders PTK. Immunohistochemical profiling of germ cells within the human fetal testis: identification of three subpopulations. Biol Reprod. 2004; 71:2012–2021. https://doi.org/10.1095/biolreprod.104.028381. [PubMed].
13. Gjerstorff MF, Kock K, Nielsen O, Ditzel HJ. MAGE-A1, GAGE and NY-ESO-1 cancer/testis antigen expression during human gonadal development. Hum Reprod. 2007; 22:953–960. https://doi.org/10.1093/humrep/del494. [PubMed].
14. Gjerstorff MF, Harkness L, Kassem M, Frandsen U, Nielsen O, Lutterodt M, Møllgård K, Ditzel HJ. Distinct GAGE and MAGE-A expression during early human development indicate specific roles in lineage differentiation. Hum Reprod. 2008; 23:2194–2201. https://doi.org/10.1093/humrep/den262. [PubMed].
15. Nelson PT, Zhang PJ, Spagnoli GC, Tomaszewski JE, Pasha TL, Frosina D, Caballero OL, Simpson AJG, Old LJ, Jungbluth AA. Cancer/testis (CT) antigens are expressed in fetal ovary. Cancer Immun. 2007; 7:1. [PubMed].
16. Osterlund C, Töhönen V, Forslund KO, Nordqvist K. Mage-b4, a novel melanoma antigen (MAGE) gene specifically expressed during germ cell differentiation. Cancer Res. 2000; 60:1054–1061. [PubMed].
17. Aizawa T, Maruyama K, Kondo H, Yoshikawa K. Expression of necdin, an embryonal carcinoma-derived nuclear protein, in developing mouse brain. Brain Res Dev Brain Res. 1992; 68:265–274. https://doi.org/10.1016/0165-3806(92)90069-9. [PubMed].
18. Aizawa T, Hasegawa K, Ohkumo T, Haga S, Ikeda K, Yoshikawa K. Neural stem cell-like gene expression in a mouse ependymoma cell line transformed by human BK polyomavirus. Cancer Sci. 2011; 102:122–129. https://doi.org/10.1111/j.1349-7006.2010.01775.x. [PubMed].
19. Andrieu D, Watrin F, Niinobe M, Yoshikawa K, Muscatelli F, Fernandez PA. Expression of the Prader-Willi gene Necdin during mouse nervous system development correlates with neuronal differentiation and p75NTR expression. Gene Expr Patterns. 2003; 3:761–765. https://doi.org/10.1016/s1567-133x(03)00138-8. [PubMed].
20. Bertrand M, Huijbers I, Chomez P, De Backer O. Comparative expression analysis of the MAGED genes during embryogenesis and brain development. Dev Dyn. 2004; 230:325–334. https://doi.org/10.1002/dvdy.20026. [PubMed].
21. Boccaccio I, Glatt-Deeley H, Watrin F, Roëckel N, Lalande M, Muscatelli F. The human MAGEL2 gene and its mouse homologue are paternally expressed and mapped to the Prader-Willi region. Hum Mol Genet. 1999; 8:2497–2505. https://doi.org/10.1093/hmg/8.13.2497. [PubMed].
22. Deponti D, François S, Baesso S, Sciorati C, Innocenzi A, Broccoli V, Muscatelli F, Meneveri R, Clementi E, Cossu G, Brunelli S. Necdin mediates skeletal muscle regeneration by promoting myoblast survival and differentiation. J Cell Biol. 2007; 179:305–319. https://doi.org/10.1083/jcb.200701027. [PubMed].
23. Kuwajima T, Nishimura I, Yoshikawa K. Necdin promotes GABAergic neuron differentiation in cooperation with Dlx homeodomain proteins. J Neurosci. 2006; 26:5383–5392. https://doi.org/10.1523/JNEUROSCI.1262-06.2006. [PubMed].
24. Caballero OL, Chen Y. Cancer/testis (CT) antigens: potential targets for immunotherapy. Cancer Sci. 2009; 100:2014–2021. https://doi.org/10.1111/j.1349-7006.2009.01303.x. [PubMed].
25. Scanlan MJ, Gure AO, Jungbluth AA, Old LJ, Chen Y. Cancer/testis antigens: an expanding family of targets for cancer immunotherapy. Immunol Rev. 2002; 188:22–32. https://doi.org/10.1034/j.1600-065x.2002.18803.x. [PubMed].
26. Smith HA, McNeel DG. The SSX family of cancer-testis antigens as target proteins for tumor therapy. Clin Dev Immunol. 2010; 2010:150591. https://doi.org/10.1155/2010/150591. [PubMed].
27. Coulie P, Weynants P, Muller C, Lehmann F, Herman J, Baurain JF, Boon T. Genes coding for antigens recognized on human tumors by autologous cytolytic T lymphocytes. Ann N Y Acad Sci. 1993; 690:113–119. https://doi.org/10.1111/j.1749-6632.1993.tb44001.x. [PubMed].
28. De Backer O, Verheyden AM, Martin B, Godelaine D, De Plaen E, Brasseur R, Avner P, Boon T. Structure, chromosomal location, and expression pattern of three mouse genes homologous to the human MAGE genes. Genomics. 1995; 28:74–83. https://doi.org/10.1006/geno.1995.1108. [PubMed].
29. Sang M, Wang L, Ding C, Zhou X, Wang B, Wang L, Lian Y, Shan B. Melanoma-associated antigen genes - an update. Cancer Lett. 2011; 302:85–90. https://doi.org/10.1016/j.canlet.2010.10.021. [PubMed].
30. Simpson AJG, Caballero OL, Jungbluth A, Chen Y, Old LJ. Cancer/testis antigens, gametogenesis and cancer. Nat Rev Cancer. 2005; 5:615–625. https://doi.org/10.1038/nrc1669. [PubMed].
31. van der Bruggen P, Traversari C, Chomez P, Lurquin C, De Plaen E, Van den Eynde B, Knuth A, Boon T. A gene encoding an antigen recognized by cytolytic T lymphocytes on a human melanoma. Science. 1991; 254:1643–7. https://doi.org/10.1126/science.1840703. [PubMed].
32. Matluk N, Rochira JA, Karaczyn A, Adams T, Verdi JM. A role for NRAGE in NF-kappaB activation through the non-canonical BMP pathway. BMC Biol. 2010; 8:7. https://doi.org/10.1186/1741-7007-8-7. [PubMed].
33. Bai Q, Assou S, Haouzi D, Ramirez J, Monzo C, Becker F, Gerbal-Chaloin S, Hamamah S, De Vos J. Dissecting the first transcriptional divergence during human embryonic development. Stem Cell Rev. 2012; 8:150–162. https://doi.org/10.1007/s12015-011-9301-3. [PubMed].
34. Lifantseva N, Koltsova A, Krylova T, Yakovleva T, Poljanskaya G, Gordeeva O. Expression patterns of cancer-testis antigens in human embryonic stem cells and their cell derivatives indicate lineage tracks. Stem Cells Int. 2011; 2011:795239. https://doi.org/10.4061/2011/795239. [PubMed].
35. Loriot A, Sterpin C, De Backer O, De Smet C. Mouse embryonic stem cells induce targeted DNA demethylation within human MAGE-A1 transgenes. Epigenetics. 2008; 3:38–42. https://doi.org/10.4161/epi.3.1.5411. [PubMed].
36. Cronwright G, Le Blanc K, Götherström C, Darcy P, Ehnman M, Brodin B. Cancer/testis antigen expression in human mesenchymal stem cells: down-regulation of SSX impairs cell migration and matrix metalloproteinase 2 expression. Cancer Res. 2005; 65:2207–2215. https://doi.org/10.1158/0008-5472.CAN-04-1882. [PubMed].
37. Yawata T, Nakai E, Park KC, Chihara T, Kumazawa A, Toyonaga S, Masahira T, Nakabayashi H, Kaji T, Shimizu K. Enhanced expression of cancer testis antigen genes in glioma stem cells. Mol Carcinog. 2010; 49:532–544. https://doi.org/10.1002/mc.20614. [PubMed].
38. Yin B, Zeng Y, Liu G, Wang X, Wang P, Song Y. MAGE-A3 is highly expressed in a cancer stem cell-like side population of bladder cancer cells. Int J Clin Exp Pathol. 2014; 7:2934–2941. [PubMed].
39. Kim Y, Yeon M, Jeoung D. DDX53 Regulates Cancer Stem Cell-Like Properties by Binding to SOX-2. Mol Cells. 2017; 40:322–330. https://doi.org/10.14348/molcells.2017.0001. [PubMed].
40. Wei Y, Wang Y, Gong J, Rao L, Wu Z, Nie T, Shi D, Zhang L. High expression of MAGE-A9 contributes to stemness and malignancy of human hepatocellular carcinoma. Int J Oncol. 2018; 52:219–230. https://doi.org/10.3892/ijo.2017.4198. [PubMed].
41. Chomez P, De Backer O, Bertrand M, De Plaen E, Boon T, Lucas S. An overview of the MAGE gene family with the identification of all human members of the family. Cancer Res. 2001; 61:5544–5551. [PubMed].
42. Hennuy B, Reiter E, Cornet A, Bruyninx M, Daukandt M, Houssa P, N’Guyen VH, Closset J, Hennen G. A novel messenger ribonucleic acid homologous to human MAGE-D is strongly expressed in rat Sertoli cells and weakly in Leydig cells and is regulated by follitropin, lutropin, and prolactin. Endocrinology. 2000; 141:3821–3831. https://doi.org/10.1210/endo.141.10.7705. [PubMed].
43. Barker PA, Salehi A. The MAGE proteins: emerging roles in cell cycle progression, apoptosis, and neurogenetic disease. J Neurosci Res. 2002; 67:705–712. https://doi.org/10.1002/jnr.10160. [PubMed].
44. Rajagopalan K, Mooney SM, Parekh N, Getzenberg RH, Kulkarni P. A majority of the cancer/testis antigens are intrinsically disordered proteins. J Cell Biochem. 2011; 112:3256–3267. https://doi.org/10.1002/jcb.23252. [PubMed].
45. Weon JL, Potts PR. The MAGE protein family and cancer. Curr Opin Cell Biol. 2015; 37:1–8. https://doi.org/10.1016/j.ceb.2015.08.002. [PubMed].
46. Gordeev OF, Lifantseva NV, Khaĭdukov SV. Expression patterns of germ line specific genes in mouse and human pluripotent stem cells are associated with regulation of ground and primed state of pluripotency. [Article in Russian] Ontogenez. 2011; 42:403–24. https://doi.org/10.1134/s1062360411060038. [PubMed].
47. Gordeeva OF, Nikonova TM. Development of experimental tumors formed by mouse and human embryonic stem and teratocarcinoma cells after subcutaneous and intraperitoneal transplantations into immunodeficient and immunocompetent mice. Cell Transplant. 2013; 22:1901–1914. https://doi.org/10.3727/096368912X657837. [PubMed].
48. Gordeeva O, Khaydukov S. Tumorigenic and Differentiation Potentials of Embryonic Stem Cells Depend on TGFβ Family Signaling: Lessons from Teratocarcinoma Cells Stimulated to Differentiate with Retinoic Acid. Stem Cells Int. 2017; 2017:7284872. https://doi.org/10.1155/2017/7284872. [PubMed].
49. Park S, Sung Y, Jeong J, Choi M, Lee J, Kwon W, Jang S, Park SJ, Kim JY, Kim SH, Yoon D, Ryoo ZY, Kim MO. Critical roles of hMAGEA2 in induced pluripotent stem cell pluripotency, proliferation, and differentiation. Cell Biochem Funct. 2017; 35:392–400. https://doi.org/10.1002/cbf.3286. [PubMed].
50. Gaspar JA, Srinivasan SP, Sureshkumar P, Doss MX, Hescheler J, Papadopoulos S, Sachinidis A. Depletion of Mageb16 induces differentiation of pluripotent stem cells predominantly into mesodermal derivatives. Sci Rep. 2017; 7:14285. https://doi.org/10.1038/s41598-017-14561-z. [PubMed].
51. Glazer CA, Smith IM, Bhan S, Sun W, Chang SS, Pattani KM, Westra W, Khan Z, Califano JA. The role of MAGEA2 in head and neck cancer. Arch Otolaryngol Head Neck Surg. 2011; 137:286–293. https://doi.org/10.1001/archoto.2011.2. [PubMed].
52. Pan S, Ren J, Jiang H, Liu W, Hu L, Pan Y, Sun B, Sun Q, Bian L. MAGEA6 promotes human glioma cell survival via targeting AMPKα1. Cancer Lett. 2018; 412:21–29. https://doi.org/10.1016/j.canlet.2017.09.051. [PubMed].
53. Laiseca JE, Ladelfa MF, Cotignola J, Peche LY, Pascucci FA, Castaño BA, Galigniana MD, Schneider C, Monte M. Functional interaction between co-expressed MAGE-A proteins. PLoS One. 2017; 12:e0178370. https://doi.org/10.1371/journal.pone.0178370. [PubMed].
54. Monte M, Simonatto M, Peche LY, Bublik DR, Gobessi S, Pierotti MA, Rodolfo M, Schneider C. MAGE-A tumor antigens target p53 transactivation function through histone deacetylase recruitment and confer resistance to chemotherapeutic agents. Proc Natl Acad Sci U S A. 2006; 103:11160–11165. https://doi.org/10.1073/pnas.0510834103. [PubMed].
55. Selimovic D, Sprenger A, Hannig M, Haïkel Y, Hassan M. Apoptosis related protein-1 triggers melanoma cell death via interaction with the juxtamembrane region of p75 neurotrophin receptor. J Cell Mol Med. 2012; 16:349–361. https://doi.org/10.1111/j.1582-4934.2011.01304.x. [PubMed].
56. Bhan S, Chuang A, Negi SS, Glazer CA, Califano JA. MAGEA4 induces growth in normal oral keratinocytes by inhibiting growth arrest and apoptosis. Oncol Rep. 2012; 28:1498–1502. https://doi.org/10.3892/or.2012.1934. [PubMed].
57. Peikert T, Specks U, Farver C, Erzurum SC, Comhair SAA. Melanoma antigen A4 is expressed in non-small cell lung cancers and promotes apoptosis. Cancer Res. 2006; 66:4693–4700. https://doi.org/10.1158/0008-5472.CAN-05-3327. [PubMed].
58. Forghanifard MM, Rad A, Farshchian M, Khaleghizadeh M, Gholamin M, Moghbeli M, Abbaszadegan MR. TWIST1 upregulates the MAGEA4 oncogene. Mol Carcinog. 2017; 56:877–885. https://doi.org/10.1002/mc.22541. [PubMed].
59. Cakouros D, Raices RM, Gronthos S, Glackin CA. Twist-ing cell fate: mechanistic insights into the role of twist in lineage specification/differentiation and tumorigenesis. J Cell Biochem. 2010; 110:1288–1298. https://doi.org/10.1002/jcb.22651. [PubMed].
60. De Plaen E, De Backer O, Arnaud D, Bonjean B, Chomez P, Martelange V, Avner P, Baldacci P, Babinet C, Hwang SY, Knowles B, Boon T. A new family of mouse genes homologous to the human MAGE genes. Genomics. 1999; 55:176–184. https://doi.org/10.1006/geno.1998.5638. [PubMed].
61. Wen C, Xue B, Qin W, Yu M, Zhang M, Zhao D, Gao X, Gu J, Li C. hNRAGE, a human neurotrophin receptor interacting MAGE homologue, regulates p53 transcriptional activity and inhibits cell proliferation. FEBS Lett. 2004; 564:171–176. https://doi.org/10.1016/S0014-5793(04)00353-9. [PubMed].
62. Tian X, Rai D, Li J, Zou C, Bai Y, Wazer D, Band V, Gao Q. BRCA2 suppresses cell proliferation via stabilizing MAGE-D1. Cancer Res. 2005; 65:4747–4753. https://doi.org/10.1158/0008-5472.CAN-05-0018. [PubMed].
63. Shen W, Xue Q, Wu Y, Hu B, Zhu J, Zhang Y, Su Q. Melanoma-associated antigen family protein-D1 regulation of tumor cell migration, adhesion to endothelium, and actin structures reorganization in response to hypoxic stress. Cell Commun Adhes. 2007; 14:21–31. https://doi.org/10.1080/15419060701224948. [PubMed].
64. Doyle JM, Gao J, Wang J, Yang M, Potts PR. MAGE-RING protein complexes comprise a family of E3 ubiquitin ligases. Mol Cell. 2010; 39:963–974. https://doi.org/10.1016/j.molcel.2010.08.029. [PubMed].
65. Kendall SE, Goldhawk DE, Kubu C, Barker PA, Verdi JM. Expression analysis of a novel p75(NTR) signaling protein, which regulates cell cycle progression and apoptosis. Mech Dev. 2002; 117:187–200. https://doi.org/10.1016/s0925-4773(02)00204-6. [PubMed].
66. Mouri A, Noda Y, Watanabe K, Nabeshima T. The roles of MAGE-D1 in the neuronal functions and pathology of the central nervous system. Rev Neurosci. 2013; 24:61–70. https://doi.org/10.1515/revneuro-2012-0069. [PubMed].
67. Ju H, Lee S, Lee J, Ghil S. Necdin modulates osteogenic cell differentiation by regulating Dlx5 and MAGE-D1. Biochem Biophys Res Commun. 2017; 489:109–115. https://doi.org/10.1016/j.bbrc.2017.05.101. [PubMed].
68. Mercer RE, Wevrick R. Loss of magel2, a candidate gene for features of Prader-Willi syndrome, impairs reproductive function in mice. PLoS One. 2009; 4:e4291. https://doi.org/10.1371/journal.pone.0004291. [PubMed].
69. Bischof JM, Stewart CL, Wevrick R. Inactivation of the mouse Magel2 gene results in growth abnormalities similar to Prader-Willi syndrome. Hum Mol Genet. 2007; 16:2713–2719. https://doi.org/10.1093/hmg/ddm225. [PubMed].
70. Kozlov SV, Bogenpohl JW, Howell MP, Wevrick R, Panda S, Hogenesch JB, Muglia LJ, Van Gelder RN, Herzog ED, Stewart CL. The imprinted gene Magel2 regulates normal circadian output. Nat Genet. 2007; 39:1266–1272. https://doi.org/10.1038/ng2114. [PubMed].
71. De Smet C, Loriot A. DNA hypomethylation in cancer: epigenetic scars of a neoplastic journey. Epigenetics. 2010; 5:206–213. https://doi.org/10.4161/epi.5.3.11447. [PubMed].
72. Lian Y, Meng L, Ding P, Sang M. Epigenetic regulation of MAGE family in human cancer progression-DNA methylation, histone modification, and non-coding RNAs. Clin Epigenetics. 2018; 10:115. https://doi.org/10.1186/s13148-018-0550-8. [PubMed].
73. Das S, Foley N, Bryan K, Watters KM, Bray I, Murphy DM, Buckley PG, Stallings RL. MicroRNA mediates DNA demethylation events triggered by retinoic acid during neuroblastoma cell differentiation. Cancer Res. 2010; 70:7874–7881. https://doi.org/10.1158/0008-5472.CAN-10-1534. [PubMed].
74. Song X, Song W, Wang Y, Wang J, Li Y, Qian X, Pang X, Zhang Y, Yin Y. MicroRNA-874 Functions as a Tumor Suppressor by Targeting Cancer/Testis Antigen HCA587/MAGE-C2. J Cancer. 2016; 7:656–663. https://doi.org/10.7150/jca.13674. [PubMed].
75. Han L, Tang M, Xu X, Jiang B, Wei Y, Qian H, Lu X. MiR-143-3p suppresses cell proliferation, migration, and invasion by targeting Melanoma-Associated Antigen A9 in laryngeal squamous cell carcinoma. J Cell Biochem. 2018. [Epub ahead of print]. https://doi.org/10.1002/jcb.27084. [PubMed].
76. Sang M, Meng L, Sang Y, Liu S, Ding P, Ju Y, Liu F, Gu L, Lian Y, Li J, Wu Y, Zhang X, Shan B. Circular RNA ciRS-7 accelerates ESCC progression through acting as a miR-876-5p sponge to enhance MAGE-A family expression. Cancer Lett. 2018; 426:37–46. https://doi.org/10.1016/j.canlet.2018.03.049. [PubMed].
77. Meng L, Liu F, Ju Y, Ding P, Liu S, Chang S, Liu S, Zhang Y, Lian Y, Gu L, Zhang X, Sang M. Tumor suppressive miR-6775-3p inhibits ESCC progression through forming a positive feedback loop with p53 via MAGE-A family proteins. Cell Death Dis. 2018; 9:1057. https://doi.org/10.1038/s41419-018-1119-3. [PubMed].
78. Lu Z, Jiao D, Qiao J, Yang S, Yan M, Cui S, Liu Z. Restin suppressed epithelial-mesenchymal transition and tumor metastasis in breast cancer cells through upregulating mir-200a/b expression via association with p73. Mol Cancer. 2015; 14:102. https://doi.org/10.1186/s12943-015-0370-9. [PubMed].