
Introduction
Globally, colorectal cancer (CRC) is the second most common cancer in women (~746,000 new cases annually), and third most common in men (~614,000 new cases annually); and the annual number of deaths approaches 700,000 [1]. CONCORD-3 [2] identified >5.9M CRC patients in 2014. In Europe, 447,000 new cases and 215,000 deaths are reported each year [3]. The economic cost of CRC in the Europe (EU) alone is over €22 billion per year in healthcare costs [Henderson et al, manuscript in preparation]. Within the UK, in 2015, almost 42,000 new cases of CRC were documented [4], with over 16,000 CRC deaths [5] and a cost of €2.3 billion (Henderson et al Manuscript in Preparation).
An increased understanding of the biology underpinning malignancy has indicated that many cancers, including CRC, are composed of a number of different molecular disease subtypes, which may show differing responses to therapeutic intervention. Identification of appropriate prognostic and predictive molecular biomarkers (MBMs), which can distinguish between these different subtypes, can assist clinical decision-making, such that patients receive the most appropriate treatment based on their molecular profile. This stratified or precision medicine approach has the potential to contribute to enhanced therapeutic efficacy, while minimising treatment-related toxicity.
To identify MBMs of the required clinical utility, e.g. diagnostic (identifying cancer subtype), predictive (determining likelihood of response to therapy), or prognostic (indicating course of disease), analytical platforms are becoming more sophisticated, incorporating technologies such as gene expression profiling and next-generation sequencing. Interpretation of data generated from these platforms is performed using different bioinformatics approaches, adding to overall complexity [6]. The National Institute of Health (NIH) Genetic Testing Registry currently lists 30 MBM tests for CRC [7]. These are employed for a variety of purposes, including: diagnosis, mutation detection/confirmation, pre-symptomatic indications, predictive testing, prognostic determination, drug response evaluation, and treatment management.
For researchers and clinicians to embrace a MBM test, it must demonstrate analytical validity, clinical validity, and, most importantly, clinical utility [8]. These parameters should be established before a cost-effectiveness analysis (CEA) is attempted. Phillips et al. [9] examined economic utility analyses of MBM tests in personalised/precision medicine and found that while nearly three quarters of the tests (72%) were associated with better outcomes, these outcomes were in many cases associated with higher costs. However, almost half of the MBM tests fell below a threshold of £35,000 (€40,000 or US$50,000) per quality-adjusted-life-year (QALY), and 20% of the tests showed evidence of cost-savings. A recent paper has identified several MBMs for CRC with prognostic (BRAF and DNA mismatch repair status) and predictive (KRAS and NRAS) utility [10]. Sepulveda et al. [10] also note that mismatch repair status indicates a predictive benefit in patients assessed for immunotherapeutic intervention.
Decision makers such as healthcare payers need to know both the financial and the health-related implications of introducing MBM testing. Limited information on the contribution to patient outcomes and societal benefit is often cited as the basis for lack of reimbursement for a particular MBM test [11]. Therefore, the rationale for the systematic review reported here was to compile the body of cost effectiveness evidence generated for MBM testing for CRC in high income health systems, to determine if certain MBM tests can help deliver value-based care.
Materials and Methods
Following Preferred Reporting Items for Systematic Reviews and Meta-analyses (PRISMA) guidelines, this review is registered with PROSPERO (registration number: CRD42016038046) and the findings conform to that registration [12].
Scoping search
5-Fluorouracil (5-FU) has been the backbone of chemotherapeutic regimens for CRC since the late 1950s. As part of our initial scoping search, we identified thirteen other drugs that have been approved by the Food and Drug Administration (FDA) for treatment of CRC since 1996 (see Supplementary Table 1).
Table 1: Screening criteria and study design for systematic review
| 1 | Patients: | Diagnosed with CRC, not limited by age, gender, staging, or type of treatment intervention. |
| 2 | Intervention | MBMs including: Single or multi-gene tests (Cobas, Snapshot, Therascreen, High Resolution Melting Assay (HRMA), Sanger sequencing, pyrosequencing, next-generation sequencing, multigene assays, mutational analysis); gene expression profiling (Oncotype DX, Coloprint); protein based tests [immunohistochemistry (IHC)]. All other tests were excluded. |
| 3 | Comparator | No MBM test. |
| 4 | Outcomes: | The health economic indicator incremental cost-effectiveness ratio (ICER) was investigated, as it relates to cost per QALY and cost per life year gained (LYG). |
| 5 | Study design: | Screening for economic analyses based on models (which draw data from trials, resource use and health utility in a disaggregated form) or trials (which prospectively include all the required data). These included CEA, cost-benefit analysis (CBA), cost-minimization analysis (CMA) and cost-utility analysis (CUA). Budget-impact, reviews, letters and editorials were excluded from the systematic review, but were retained for reference. |
Search strategy
Our research question, formulated using the PICOS framework (population, intervention, comparator, outcome, study design) was “What is the cost-effectiveness of using a MBM test for predicting response to therapy in CRC?”. PICOS was employed to develop a search limited to studies that performed economic evaluation of patients diagnosed with CRC, who were subsequently stratified for treatment selection by the result of a MBM test. Initially, a scoping search was performed to identify keywords and MeSH headings. Articles were identified by systematic literature search if they were published between 1 January 2006 and 31 December 2016. We searched MEDLINE, EMBASE, Cochrane Library, SCOPUS, Web of Science, Econlit and SCHARR. Meeting presentations were also searched for the same time period in the American Society of Clinical Oncology (ASCO) and International Society for Pharmacoeconomics and Outcomes Research (ISPOR) websites. Boolean operators were used to set up weekly searches of the above databases throughout the preparation of the review to keep it current, with the addition of Google Scholar alert searches at least 3 times per week until the end of 2018. All bibliographic references retrieved via the searches were exported to reference management software, and duplicates were removed before the study selection step.
Study selection
Articles were screened for eligibility based on the following criteria (Table 1):
Titles and abstracts of all articles were reviewed for eligibility and only accepted if the above criteria were met. Four reviewers (RH, DF, MC and ML) independently evaluated the full text of potentially eligible articles to determine whether to include these articles in this review. A lack of consensus over eligibility was resolved between the four reviewers. If doubts remained about the suitability of the study (such as academic posters which lack full peer review), we took the conservative approach of including these studies, so as to avoid missing potentially informative studies, while noting that they had not undergone full peer review.
The integrity of each study was assessed according to a checklist developed by the ISPOR Consolidated Health Economic Evaluations Reporting Standards (CHEERS) Task Force Report [13]. This underpinned the development of a quality rating for each study, thus allowing rigorous evaluation of the strength of the data provided. Quality ratings were assigned in five categories: Excellent (✔✔✔✔✔) if a study met 23-out-of 24 CHEERS criteria; good (✔✔✔✔) if 21-22 criteria were met; studies meeting 19–20 criteria were graded as medium (✔✔✔). If only 17–18 criteria were met, the study was graded as low (✔✔), while studies with 16 criteria or less being met were graded as poor (✔).
Mathematical formulae employed
In cases where more than one therapy were modelled, the reported ICER might not be compared to the base case, e.g. best supportive care (BSC). In these instances, we calculated the ICER based on reported costings and QALYs for the MBM test using the following formula:
Where LYGs were reported, but not QALYs, and no health utility was reported then:
The baseline health utility score of 0.8 was calculated from studies identified in our systematic review, which ranged from 0.71 to 0.87 for progression-free survival in CRC patients, which conforms with a published systematic review of health utility values for CRC [14]. Conversely, where QALYs were reported but not LYGs, and no health utility was reported then:
Results
Scoping results
For each therapeutic intervention indicated, we listed the dates of FDA, European Medicines Agency, and National Institute for Health and Care Excellence (NICE) approval. We have identified the annual costs for each of these therapies, adjusted to 2016 £GBP and Euros using the CCEMG (Campbell and Cochrane Economics Methods Group) - EPPI (Evidence for Policy and Practice Information) - Centre Cost Converter [15]. We have also listed putative MBMs for each therapeutic intervention, where applicable, and noted whether each MBM was predictive of therapy, or prognostic of risk (see Supplementary Table 1).
Costs listed in Supplementary Table 1 are drug acquisition costs and do not include costs of outpatient visits, hospitalisation, treatment of side effects, etc. A potential benefit of targeted approaches using biological-based therapy is the avoidance or lessening of adverse effects; e.g. adverse effects resulting from EGFR-targeted therapy are relatively mild (e.g. skin rash) [16] in comparison to those observed with 5-FU (myelosuppression and gastrointestinal toxicity) [17]. It can be difficult to compare targeted therapy directly to chemotherapy as in many instances both are administered in combination, but where targeted therapy is employed, there is potential for a consequential therapeutic benefit in advanced CRC [18]. The MBMs listed in Supplementary Table 1 represent the biomarkers most frequently employed for the indicated therapy.
Study selection
The Study Selection Workflow is outlined in Figure 1. Our initial database search and other electronic searches (ASCO, ISPOR) followed the search strategy set out in the Methods section and identified 6,706 records. We developed a text-mining algorithm based on health economic filters, as there was a paucity of these represented in the identified records. Consequently, 6,560 records were excluded, and the remaining 146 records were imported into reference management software, where duplicate records (n = 25) were removed. A total of 121 articles were then screened for eligibility. After full text examination, 25 articles were excluded as these reported CEAs that related to screening of families for hereditary CRC, which is not relevant to the research question being posed in this systematic review. A further 16 articles were either reviews or systematic reviews which were retained for reference, and 5 articles did not mention the terms LYG, QALY, or ICER. A total of 12 other articles did not include CBAs, CEAs, CMAs, or CUAs and 12 articles focused on CRC therapy alone, not taking into account the use of MBM tests to help guide therapy. On further examination, 7 articles were identified as duplicate studies (earlier abstract reports of the same study or versions of the same study published in other languages), a further 7 were abstracts without sufficient information, 3 articles involved a mixed population of cancer types which either included data already captured or aggregated data from which CRC-specific data could not be extracted, 1 study was an incomplete trial with insufficient data, and 5 were letters with insufficient detail for inclusion. In total, 14 eligible studies remained which involved economic evaluation of a MBM test for guiding therapeutic intervention in CRC.
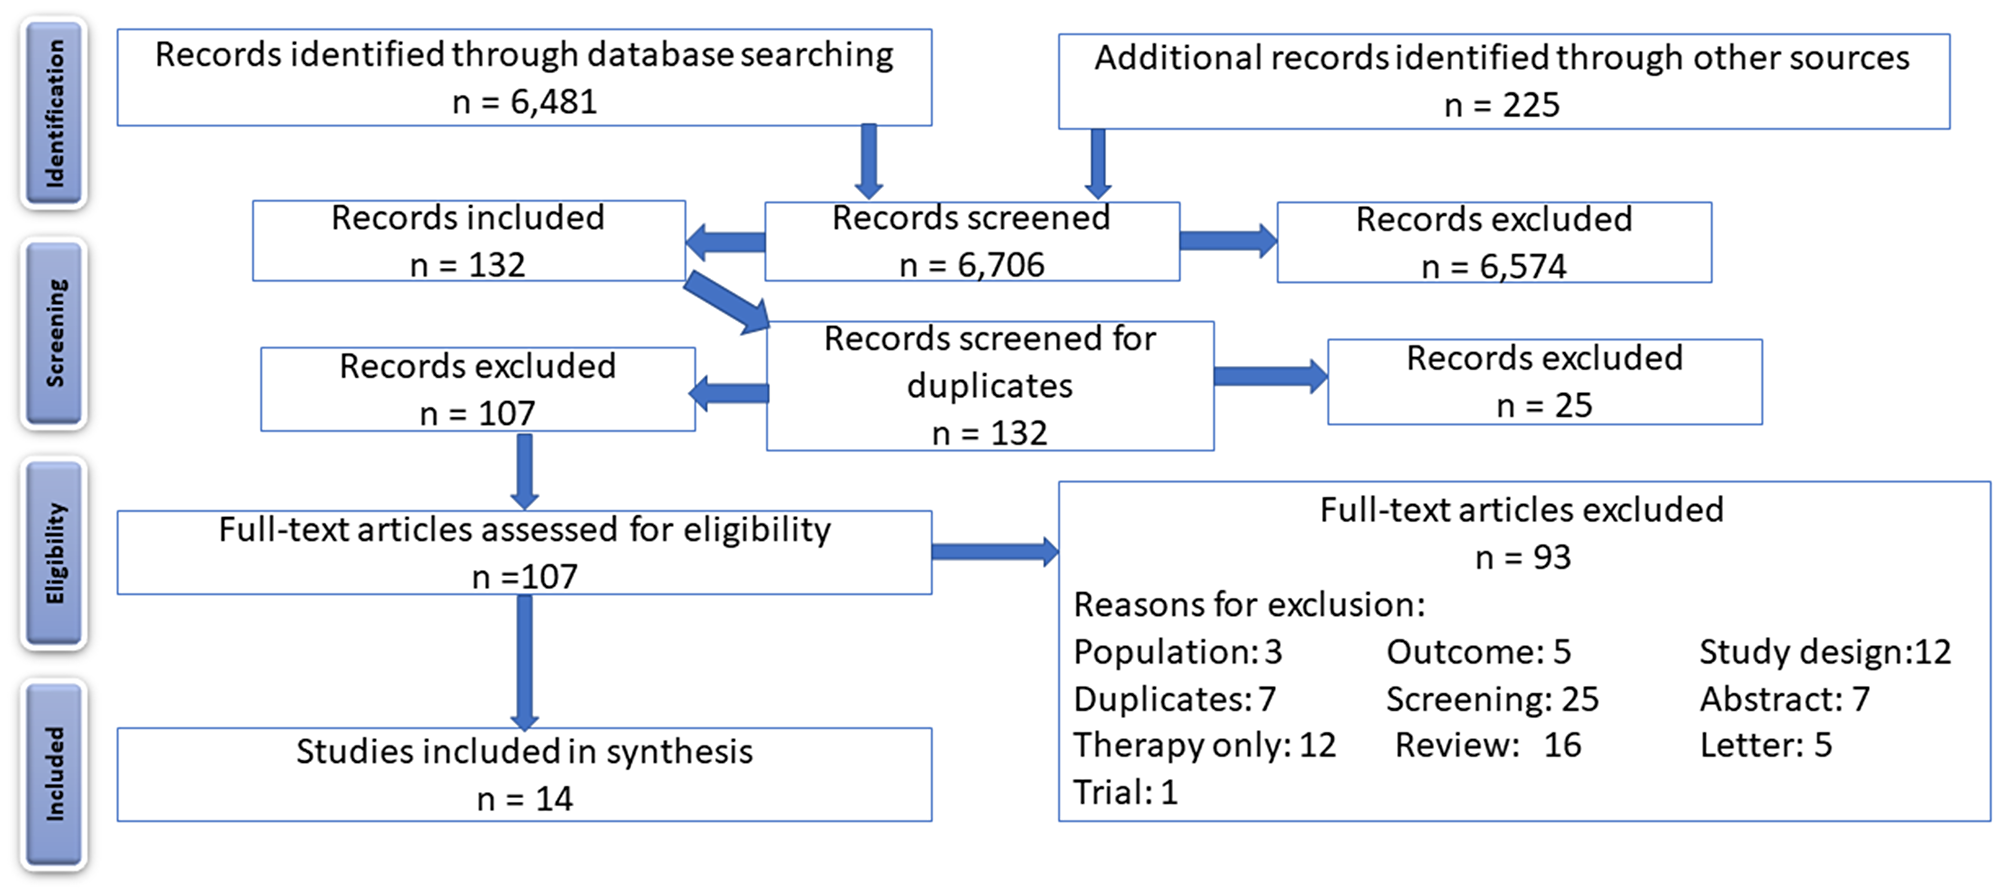
Figure 1: PRISMA flow diagram, showing the flow of identified records through screening, assessment for eligibility, and inclusion.
Data extraction
We extracted empirical and methodological data and imported the data into Microsoft Excel. Extracted features included: author, year, country of study, CRC stage/metastases/not described, therapy, biomarker utilised, LYG, QALY, and ICER employed (Table 2A–2C). We also extracted Author, perspective (healthcare payer, health insurance or hospital), modelling approach, time horizon (duration of therapy), discounting applied, health utility questionnaire, setting and location, comparisons, scenario analysis, deterministic sensitivity analysis (DSA), and probabilistic sensitivity analysis (PSA) to prepare Table 3A–3C. If there was insufficient data (e.g. abstract reports from conferences), we emailed the original authors for further details.
Table 2A: Study characteristics, outcomes, and quality assessment of DPYD and UGT1A1 studies
| Author | Year | Countrya | CRC type | Therapy | Biomarker(Methodology) | LYG | QALY | ICER (£€/QALY) | Quality rating |
|---|---|---|---|---|---|---|---|---|---|
| Traoré et al. [21] | 2012 | France | ND | 5-FU | DPYD (genotyping/ phenotyping) | No | No | £2,795b (€3,175) | ✔ |
| Butzke et al. [23] | 2015 | Germany | Metastatic | FOLFIRI | UGT1A1 (PCR) | < 1 day | <1 day | £60,566,870 (€68,810,212) | ✔✔✔✔ |
| Gold et al. [24] | 2009 | USA | Metastatic | FOLFIRI | UGT1A1 (PCR) | < 1 day | <1 day | Dominatedd | ✔✔✔ |
| Obradovic et al. [25] | 2008 | USA | Metastatic | Irinotecan | UGT1A1 (PCR) | 0.02233 | 0.01786c | £1,318,354 (€1,497,786) | ✔✔ |
| Pichereau et al. [26] | 2010 | France | Metastatic | FOLFIRI | UGT1A1 (PCR) | No | No | £966e (€1,097) | ✔✔✔ |
A quality rating for each study was determined (see Methods) which allowed us to assign a level of confidence in the strength of evidence for each study. The quality assessment was performed by one reviewer, checked by a second reviewer and any disagreement was resolved by the third and fourth reviewers.
Data synthesis
Data capture and quality analysis for each study of cost-effectiveness were represented in Tables 2 and 3 and as a narrative summary. Where appropriate, costs were adjusted for year, inflation, and local currency using the CCEMG - EPPI - Centre Cost Converter [15]. The modelling techniques used in the different studies were compared, and their robustness analysed. Finally, the quality of our systematic review itself was checked using two instruments, AMSTAR (Assessing the Methodological Quality of Systematic Reviews) [19] and MECIR (Methodological Expectations of Cochrane Intervention Reviews) [20].
Study characteristics
Tables 2A–2C outline the characteristics, resulting outcomes, and quality assessment of each study.
DPYD
Table 2A lists one study that evaluated DPYD gene status in relation to 5-FU toxicity [21]. 5-FU is converted to dihydrofluorouracil by the enzyme dihydropyrimidine dehydrogenase (DPD), expressed by the DPYD gene. More than 80% of administered 5-FU is detoxified in the liver by DPD metabolism [22].
UGT1A1
Table 2A lists four economic evaluations involving UGT1A1 testing to guide irinotecan dosing [23–26]. The chemotherapy drug irinotecan is converted principally in the liver by carboxylesterase to SN-38, the active anticancer agent which inhibits topoisomerase I [27].
KRAS/BRAF
Table 2B groups the genes RAS (KRAS and NRAS) and BRAF, (which are expressed as signalling molecules in the mitogen-activated protein kinase pathway (MAPK)) in relation to their use as prognostic/predictive MBMs in CRC. Tumours harbouring mutated forms of these genes are resistant to anti-epidermal growth factor receptor (EGFR) therapy [28]. RAS (KRAS and NRAS) mutations occur in 53% of CRC patients [29] and BRAF mutations in approximately 10% [30]. Most of the economic analyses are performed in the context of genotyping the patient for RAS mutational status (KRAS and NRAS) before either treatment with an EGFR monoclonal antibody or chemotherapy treatment.
Table 2B: Study characteristics, outcomes, and quality assessment of BRAF and RAS (KRAS and NRAS) studies
| Author | Year | Countrya | CRC Type | Therapy | Biomarker (Methodology) | LYG | QALY | ICER (£€/QALY) | Quality rating |
|---|---|---|---|---|---|---|---|---|---|
| Behl et al. [31] | 2012 | USA | Metastatic | Cmab Cmab | KRAS KRAS & BRAF (PCR clamping and melting curve method) | 0.0344 0.0340 | 0.0275 0.0272 | £409,877 (€465,633) £396,507(€450,473) | ✔✔✔ |
| Blank et al. [32] | 2011 | Switzerland | Metastatic | Cmab Cmab | KRAS KRAS & BRAF (PCR, then sequencing) | 0.6163 0.6138 | 0.4930 0.4910 | £49,735 (€56,505) £48,999 (€55,688) | ✔✔✔✔ |
| Carlson JJ [33] | 2010 | USA | Metastatic | Cmab | KRAS (PCR, then sequencing) | 0.1500 | 0.1100 | £204,766 (€232.635) | ✔ |
| Harty, Jarret, and Jofre-Bonet [34] | 2015 | UK | Metastatic | Cmab Cmab | KRAS RAS (PCR clamping and melting curve method) | 0.2900 0.4500 | 0.2200 0.2400 | £73,003 (€82,939) £44,767 (€50.860) | ✔ |
| Health Quality Ontario. [35] | 2010 | Canada | Metastatic | Cmab Pmab Cmab + Irinotecan | KRAS (Therascreen) | 0.3951 0.2903 0.6591 | 0.3082 0.2264 0.5141 | £35,095 (€40,440) £30,607 (€34,773) £27,351 (€31,074) | ✔✔✔ |
| Shiroiwa et al. [36] | 2010 | Japan | Metastatic | Cmab | KRAS (PCR, then sequencing) | 0.1800 | 0.1300 | £109,452 (€124,349) | ✔✔✔✔ |
| Vijayaraghavan et al. [37] | 2011 | USA & Germany | Metastatic | Cmab Pmab Cmab + Irinotecan | KRAS (PCR, then sequencing) | 0.3804 0.3511 0.4665 | 0.3043 0.2809 0.3732 | £58,210 (€66,133) £54,138 (€61,506) £72,714 (€82,611) | ✔✔ |
| Westwood et al. [38] | 2014 | UK | Metastatic | Cmab | KRAS (Therascreen) | 0.2250 | 0.1800 | £17,616 (€20,013) | ✔✔✔✔ |
The majority of health economic evaluations (N = 8) involved RAS and BRAF testing prior to CRC treatment with cetuximab and panitumumab [31–38].
Oncotype DX
Table 2C records data associated with the use of a 12-gene assay (Oncotype DX colon cancer) as a predictor of the risk of CRC recurrence [39], thus informing the choice of fluoropyrimidine and FOLFOX (FOL - Folinic acid (leucovorin); F - Fluorouracil (5-FU); OX - Oxaliplatin (Eloxatin)) treatment options.
Table 2C: Study characteristics, outcomes, and quality assessment of oncotype DX studies
| Author | Year | Countrya | CRC type | Therapy | Biomarker (methodology) | LYG | QALY | ICER (£/QALY) | Quality rating |
|---|---|---|---|---|---|---|---|---|---|
| Alberts et al. [39] | 2014 | USA | Stage II, T3, MMR-P | Fluoro-pyrimidine and FOLFOX | Oncotype DX (12-gene assay RT-PCR) | 0.1425b | 0.114 | £21,052c(€23,917) | ✔✔✔✔✔ |
Health outcomes for each MBM
DPYD
The ICER generated for DPYD in Table 2A was £2,795 (€3,175) based on neither LYG nor QALY metrics, but on the prevalence of toxicity episodes from 5-FU, that is, cost per toxicity [21].
UGT1A1
The CEAs for UGT1A1 testing were used to guide irinotecan dosing (Table 2A). The ICERs generated here were all above the NICE threshold of £30,000 (€34,083), with the exception of one study [26], but in this case the ICER was based on numbers of febrile neutropenic events avoided, and not on LYGs or QALYs. Table 2A lists the most significant QALYs generated by these CEAs as being only 6.5 quality-adjusted life days (QALDs) [25]. The two medium and good quality UGT1A1/irinotecan CEA studies generated even smaller QALYs, at an average increment that is calculated as less than 2 hours [23] and a decrement of less than two hours [24], which in turn led to the generation of very high ICERs. Additionally, although the Obradovic et al. [25] study indicates 6.5 QALDs, we agree with the report from the Centre for Reviews and Dissemination at the University of York [40], that these results should be treated with caution as the protocol was insufficient in detail to allow a quality assessment to be performed
KRAS/BRAF
The results in Table 2B indicated that the Health Quality Ontario (HQO) study [35] and the Westwood et al. study [38] both yielded ICER values that fell below the NICE threshold. HQO performed three studies, one of which produced an ICER of £27,351 (€31,074), and 187 QALDs using KRAS testing prior to cetuximab plus irinotecan treatment, compared to best supportive care (BSC – palliative care). The second HQO CEA for KRAS screening prior to panitumumab treatment (compared to BSC) came very close to the NICE threshold with an ICER of £30,607 (€34,773) and over 82 QALDs. The third HQA CEA for KRAS screening before cetuximab monotherapy (compared to BSC) generated an ICER above NICE’s threshold at £35,095 (€40,440) with 112 QALDs; however, these 3 studies were rated as medium-quality studies, as the report did not outline a structured summary, describe its analytical methods, or mention funding sources and conflicts of interest. The CEA from the Westwood et al. [38] study resulted in an ICER of £17,616 (€20,013) and 66 QALDs and was rated a good quality study in respect to the CHEERS criteria. The other two good quality studies, by Shiroiwa et al. [36] and Blank et al. [32], produced ICERs of £109,452 (€124,349) (over 45 QALDs for KRAS testing prior to cetuximab treatment) and £48,999 (€55,668) (over 179 QALDs for combined KRAS and BRAF screening prior to cetuximab treatment), respectively. These ICERS were above the NICE threshold of £30,000 (€34,083). The remaining studies were of medium to poor quality, missing important details when applying the CHEERS checklist.
Type of economic evaluation undertaken for each MBM
All studies undertaken were CEAs.
DPYD
Incremental costs relating to toxicities following 5-FU administration are indicated in Table 2A [21].
UGT1A1
In the CEAs detailing UGT1A1 genotyping to guide irinotecan dosing, one study [25] reported ICER per LYG, two studies [23, 24] reported ICERs per QALY, while Pichereau et al. [26] based their ICER on cost to avoid 1 case of febrile neutropenia per 1000 patients.
Healthcare perspective, decision model, and time horizon for each MBM evaluated
Tables 3A–3C outline the methods and models used in the included studies.
DPYD
Traoré et al. [21] did not describe the healthcare perspective for their DPYD testing CEA. A decision analytic approach in combination with a Markov model was employed to assess resource use and health outcomes. The time horizon was 2 cycles of chemotherapy.
UGT1A1
The healthcare perspective for CEAs for UGT1A1 genotyping to guide irinotecan dosing was described from the perspective of the healthcare payer in 3 studies [23–25], whereas Pichereau et al. [26] focussed on the perspective of the hospital (Table 3A). While Butzke et al. [23] employed a decision analytic approach in combination with a Markov model and a lifetime time horizon, the remaining 3 studies solely employed a decision tree to model treatment strategies [24–26], with no specified time horizon (Table 3A).
Table 3A: Methodological characteristics of DPYD and UGT1A1 studies
| Author | Perspective | Modelling approach | Time horizon | Discount | Health utility | Setting | WTP threshold | Scenario analysis | DSA | PSA |
|---|---|---|---|---|---|---|---|---|---|---|
| Traoré et al. [21] | ND | Decision analytic -Markov | 2 cycles of chemo-therapy | No | No | ND | ND | No | No | Yes |
| Butzke et al. [23] | German statutory insurance | Decision analytic -Markov | Lifetime | 3% | EQ-5D | German population | €50,000 | No | Yes | Yes |
| Gold et al. [24] | Medicare payer | Decision analytic | No | 3% | Yes | ND | US$100,000 | No | Yes | Yes |
| Obradovic et al. [25] | US health-care payer | Decision analytic | No | No | No | ND | US$100,000 | No | No | Yes |
| Pichereau et al. [26] | French hospital | Decision analytic | No | No | No | Medical care practice in France | ND | No | No | Yes |
RAS/BRAF
CEA analysis for RAS (KRAS and NRAS) and BRAF BM testing to inform anti-EGFR therapy was modelled in 6 of 8 studies from the healthcare payer perspective (Table 2B). All employed a decision analytic approach in combination with a Markov model. Seven (7) of 8 employed a time horizon which varied from 2.5 years to a lifetime horizon (Table 3B), the sole exception being Carlson et al. [33], which we ranked as a poor-quality study (missing information included; a structured summary, setting and location, study perspective, time horizon, assumptions made, funding, and conflicts of interest).
Table 3B: Methodological characteristics of BRAF and RAS (KRAS and NRAS) studies
| Author | Perspective | Modelling approach | Time horizon | Discount | Health utility | Setting | WTP threshold in LCU | Scenario analysis | DSA | PSA |
|---|---|---|---|---|---|---|---|---|---|---|
| Behl et al. [31] | ND | Decision analytic -Markov | 2½ years | 3% | No | ND | US$100,000 | No | No | Yes |
| Blank et al. [32] | Swiss health system | Decision analytic -Markov | Lifetime | 3% | HUI3 | ND | €40,000 | Yes | Yes | Yes |
| Carlson JJ. [33] | ND | Decision analytic -Markov | No | 3% | Yes | ND | US$0 to $300,000 CEAC | No | Yes | No |
| Harty, Jarret, and Jofre-Bonet [34] | NHS | Decision analytic -Markov | 10 years | No | No | ND | £50,000 | No | Yes | No |
| Health Quality Ontario. [35] | Ontario Ministry of Health and Long-Term Care | Decision analytic -Markov | Lifetime | 5% | QLQ-C30 | Ontario | CAD$50,000 | No | No | Yes |
| Shiroiwa et al. [36] | Japanese healthcare payer | Decision analytic -Markov | 2½ years | 3% | HUI3 | ND | ¥5 to 6 million | Yes | Yes | Yes |
| Vijayaraghavan et al. [37] | US & German healthcare payer | Decision analytic -Markov | Lifetime | No | No | ND | ND | No | Yes | No |
| Westwood et al. [38] | NHS | Decision analytic -Markov | 23 years | 3.5% | EQ-5D | England and Wales | ND | No | Yes | No |
Oncotype DX
The perspective of the healthcare payer was employed for the Oncotype DX study (Table 3C). A decision analytic approach in combination with a Markov model was employed with a 5-year time horizon (Table 3C).
Table 3C: Methodological characteristics of oncotype DX study
| Author | Perspective | Modelling approach | Time horizon | Discount | Health utility | Setting | WTP threshold in LCU | Scenario analysis | DSA | PSA |
|---|---|---|---|---|---|---|---|---|---|---|
| Alberts et al. [39] | US third party payer | Decision analytic-Markov | 5 years | 3% | Yes | Physicians in the MCCRC | US$50,000 | Yes | Yes | yes |
Discounting and health utility for each MBM evaluated
Discounting should reflect each country’s borrowing rate, but in health economic analysis the discount rate is usually set by the modellers at between 0% and 7%, with 3% and 5% being the most frequently quoted figures. However, it has previously been reported that almost a third of economic evaluations in healthcare do not use a discount rate [41]. Our findings were similar, with 5 of 14 (36%) studies not using a discount rate.
DPYD
A discount rate was not used. No health utility questionnaire was employed.
UGT1A1
Two (2) of 4 UGT1A1 studies [23, 24] employed a discount rate of 3%. These studies also employed a health utility questionnaire; EQ-5D was used by Butzke et al. [23] while Gold et al. [24] did not specify which health utility questionnaires they employed.
RAS/BRAF
Six (6) of 8 RAS/BRAF studies employed a discount rate, which ranged from 3-5%. Five (5) of 8 studies employed a health utility questionnaire; in 4 cases [32, 35, 36, 38] the type of health utility questionnaire was indicated (Table 3B)
Oncotype DX
The Oncotype DX study employed a discount rate of 3% and used a health utility questionnaire, but the type of questionnaire was not specified (Table 3C).
In summary, only CEAs with a good or excellent rating [23, 32, 35, 36, 38] captured the healthcare perspective, decision model, time horizon, discounting, and health utility, the remaining studies were inconsistent, only capturing a number of these parameters. Only 4 studies described a setting and/or location; Pichereau et al. [26] and Butzke et al. [23] for UGT1A1 testing, HQO [35] for KRAS testing and Alberts et al. [39] for Oncotype DX testing. Only Traoré et al’s DPYD study [21] used a single study; the remainder were synthesis based. None of the studies covered a reduction in productivity due to adverse effects, illness, or death.
Willingness to pay thresholds for each MBM evaluated
DPYD
A willingness to pay (WTP) threshold was not employed.
UGT1A1
Three (3) out of 4 studies reported WTP thresholds, which range from €50,000 in 2013 (£46,950 or €53,340 in 2016) [23] to US$100,000 in 2006 (£81,606 or €92,713 in 2016) [25, 26].
RAS/BRAF
Six (6) of 8 studies used a WTP threshold which ranged from a Canadian study [35] which set the threshold at CAD$50,000 (£32,019 or €36,377) to a US study [31] which set the threshold at US$100,000 (£76,440 or €86,844). Carlson [33] constructed a cost-effective acceptability curve (CEAC) with a WTP threshold between US$0 and US$300,000 (£0 or €0 and £232,122 or €263,715) while Westwood et al. [38] utilised a CEAC with a WTP threshold up to £100,000 (€111,159). Vijayaraghavan et al. [37] did not use a WTP threshold.
Sensitivity analyses for each MBM evaluated
Sensitivity analyses were performed to test the degree of uncertainty in health benefits and costs. DSA tested parameters such as clinical effects, disease progression, QALYs and costs one at a time, while the superior PSA tested these parameters in combination.
DPYD
Traoré et al. [21] conducted a PSA, but did not detail the findings in their report.
UGT1A1
Gold et al. [24] and Butzke et al. [23] performed both DSA and PSA, whereas Obradovic et al. [25] and Pichereau et al. [26] only performed PSA. These analyses were employed to address the uncertainty surrounding the cost-effectiveness of irinotecan dosing based on the application of the UGT1A1 BM test.
RAS/BRAF
The PSA in the HQO paper [35] showed that for KRAS testing, cetuximab plus irinotecan was the most cost-effective therapy when compared to BSC. The DSA from Vijayaragharan et al. [37] indicated that the most sensitive parameter in the model was the percentage of KRAS WT patients in the population. The DSA used by Shiroiwa et al. [36] did not find parameter changes to have an effect on the results, whilst their PSA found KRAS testing to be 62% cost-effective at a WTP threshold of ¥20 million (£196,010 or €222,688). The PSA from Westwood et al. [38] did not vary much from the base case, that is, all KRAS testing strategies were almost equal.
The scenario analysis performed by Blank et al. [31] described a minor impact on the ICER. Blank et al. [32] also noted KRAS and BRAF testing to be the dominant strategy at a WTP threshold of €10,000 to €40,000 (£13,930 to £38,892), whilst at a WTP threshold greater than €40,000 (£38,892), KRAS testing was dominant. The tornado plot by Harty et al. [34] indicated that the duration in first line progression was most sensitive in the DSA. The DSA performed by Behl et al. [31] revealed the model to be sensitive to conversion of chemotherapy costs, cetuximab therapy, and the cost of surgery. Carlson’s [33] DSA detailed via a tornado plot how BSC was most sensitive to difference in QALYs.
Most studies which used a PSA approach [32, 35, 36, 38] came to the same conclusion, namely that it is most cost-effective to use a MBM to test for treatment selection before therapy.
Oncotype Dx
The DSA and PSA indicated that QALYs were sensitive to: (1) benefit of fluoropyrimidine monotherapy over surgery alone, (2) benefit of FOLFOX over fluoropyrimidine monotherapy, and (3) time preference discount rate.
Cost comparison of anti-EGFR therapy versus chemotherapy or BSC
Supplementary Table 2 lists the four studies which included costs of treatment with anti-EGFR therapy compared to chemotherapy (or BSC). For patients with a mutation, health economic analysis indicates that an average of £88,147 (€100,144) per year is saved per patient, due to avoidance of cetuximab therapy based on the KRAS/BRAF test result. For panitumumab therapy, the average cost saving is £41,159 (€46,761) per patient per year.
Comparison of ICERs, No MBM versus MBM
Supplementary Table 3A illustrates how the use of MBMs can help increase the cost-effectiveness of treatment, with the exception of UGT1A1, which is used to guide the reduction of irinotecan dosing.
As shown in Supplementary Table 3B, the use of the KRAS MBM reduced the ICER for cetuximab from £142,515 (€161,912) to £109,452 (€124,349) in the Shiroiwa et al. study [36] and for panitumumab from £48,118 (€54,667) to £30,607 (€34,773) in the HQO study [35]. However, although these MBMs improved the cost-effectiveness of these therapies, this did not lead to the intervention achieving an ICER below the NICE threshold in either case, although the HQO study was within the margin of error
KRAS and BRAF guided chemotherapy costs with corresponding QALYs and ICERs
From reported costs and positive effects (e.g. changes in progression-free survival) in three studies (32, 33, 35), we were able to generate ICERs (Supplementary Table 4) for chemotherapy if the patient population had KRAS (or BRAF) mutations. Two studies [32, 34] resulted in ICERs below the NICE threshold, at £8,742 (€9,932) and £23,072 (€26,212) respectively. However, the third study by Behl et al. [31] while breaching the NICE threshold with an ICER of £49,005 (€55,675), was still under the WTP threshold of US$100,000 (£76,440 or €86,844).
Genetic heterogeneity within populations and its effect on CEA
It is important to note that the ICERs for the MBMs evaluated in this systematic review are susceptible to the frequency of mutations in the general population. The UGT1A1*28 polymorphism occurs with higher prevalence in the African (42–56%) and Caucasian (26–31%) populations, than in Asian populations (9–16%). Consequently, the use of this biomarker leads to a ten-fold increase in Africans LYGs compared to Asian LYGs, when used to guide irinotecan treatment. However, even with this increase in LYG, this MBM is still not cost-effective [25].
DISCUSSION
The economic impact of MBM testing to guide therapy in CRC depends upon the cost of the therapeutic intervention and the price of the test, balanced against the clinical impact of the intervention and the degree of toxicity to the patient. So, if the net savings and QALYs are within a specific country’s WTP threshold, the value-based reimbursement of the MBM may help justify a stratified/precision medicine approach to cancer treatment [42].
DPYD genotyping to guide 5-FU and capecitabine treatment
Deenen et al. [43], in a safety and cost analysis of DPYD*2A screening prior to treatment, showed that genotyping marginally improves patient outcomes, and is also cost saving (€2,772 screening versus €2,817 non-screening). The CEA by Traoré et al. [21] and Deenan et al.’s study demonstrates that establishing DPYD screening in clinical practice in advance of 5-FU or capecitabine treatment may be cost-effective. On the evidence that we have presented and evaluated in this systematic review, DPYD screening is not only cost saving, but also spares patients the associated toxicities, although the overall net monetary benefit may be minimal.
UGT1A1 genotyping to guide irinotecan treatment
Three of the irinotecan studies [23–25] identified in our analysis suggest that prior testing for UGT1A1 may be cost saving, but our systematic review is inconclusive as to whether testing improves patient outcomes, with both positive [23] and negative [24] QALYs being reported. Goldstein et al. [44] stated that they cannot recommend UGT1A1 genotyping to guide irinotecan dosing, and that any dose reduction should be based on clinical parameters, rather than UGT1A1 status.
Lu et al. [45] attempted a different approach by escalating the dose in UGT1A1*1 homozygotes and UGT1A1*28 heterozygotes, with positive therapeutic results without the development of adverse effects; a RCT of this approach is ongoing [46]. As the optimum dosing of irinotecan based on UGT1A1 status has yet to be defined [47], UGT1A1 genotyping to guide irinotecan dosing will most likely need to be revisited following the availability of results from RCTs such as the one highlighted above in order to determine its efficacy and cost-effectiveness.
RAS (KRAS and NRAS) and BRAF genotyping to guide treatment
Testing of patients with RAS (KRAS and NRAS) and BRAF mutations before anti-EGFR or chemotherapy administration has informed clinical decision making in CRC. Of the articles we identified, both the Canadian study by the HQO [35] and the UK study by Westwood et al. [38] generate ICERs below the NICE threshold for KRAS WT guided therapy compared to BSC and chemotherapy respectively. However, where RAS (and BRAF) testing were used to select chemotherapy for patients with the mutated form of these genes [32, 34], ICERs were generated below NICE’s WTP threshold, while the study by Behl et al. [31] resulted in an ICER below the WTP threshold for the USA. The remaining studies did not report enough information to calculate an ICER for MBM-guided chemotherapy. At present, NICE does not recommend cetuximab as a monotherapy [48] but recommends cetuximab if used in combination with either FOLFOX or FOLFIRI (FOL - Folinic acid (leucovorin); F - Fluorouracil (5-FU); IRI - Irinotecan (Camptosar)) [49]. From the eight studies identified for RAS family and BRAF mutation testing, the results overall were inconclusive as to whether precision medicine strategies are cost-effective when selecting CRC patients for anti-EGFR therapy. Although NICE’s WTP is set at £30,000, technology appraisals performed for end-of-life treatment guidance, have permitted costs to breach this threshold at an average of £49,000, implicitly suggesting a £50,000 WTP when end-of-life criteria are met. If this figure had been used as our benchmark in this metastatic CRC setting, then half of the studies would be classed as cost-effective [50]. Moreover, when costing and QALY data were reported for selection for chemotherapy treatment, RAS/BRAF testing did prove to be cost-effective. The cost savings can be significant. For example, given that more than one million CRC patients in Europe are expected to develop metastatic CRC [2, 51], with 53% harbouring RAS mutations, there is the potential to save £3 billion (€3.5 billion) over the lifetime of this patient cohort.
When MBM guided anti-EGFR therapy is compared to anti-EGFR therapy alone, there is a pronounced increase in the ICER values, but the QALYs produced are only marginally different. Thus, RAS (and BRAF) testing can only be cost-effective when selecting patients who should receive chemotherapy, but not those who receive EGFR therapy, based on the result of their molecular assay.
Oncotype DX gene assay to guide 5-FU and FOLFOX treatment
The initial economic analysis of the Oncotype DX assay was generated by data from the National Comprehensive Cancer Network and concluded that the assay would improve patient outcomes (QALY = 0.035), and decrease costs by $3,000 for stage II, T3, proficient DNA mismatch repair CRC patients [52]. In the routine practice study by Alberts et al. [39], a larger QALY was generated because of the reduction in quality of life associated with adjuvant chemotherapy, and the lower cost savings ($991) due to oxaliplatin coming off patent. The ICER we calculated for the Oncotype DX assay was based on a $3,200 list price [53] and a QALY of 0.114. The applicability of the Oncotype DX Recurrence Score to other populations has been verified in African Americans [54], and although initially inconclusive in the Korean population [55], the larger SUNRISE study has established clinical validity in Asian populations [56]. An economic analysis of the Oncotype DX assay was deemed justifiable and is currently in progress in Israel [57]. Although the Alberts et al. CEA [39] was based on only 141 patients, the evidence, in combination with the prior CEA in another study [52], and favourable results from clinical trials [54–56] indicate that the Oncotype DX can spare patients unnecessary chemotherapy, is cost saving and falls below the NICE threshold.
Previous cost effectiveness analysis of precision medicine approaches in CRC
There have been four previous systematic reviews on the economic analysis of MBM approaches in CRC in the personalised/precision medicine setting. The first was performed by Frank and Mittendorf in 2013 [58]. They identified 7 articles, 3 of referred to the use of the UGT1A1 MBM, while the remaining 4 investigated the KRAS MBM. We captured all 7 of these articles but excluded the study by Mittman et al. [59] because it did not utilise a MBM-based approach. Frank and Mittendorf concluded that the cost-effectiveness of UGT1A1 testing prior to irinotecan administration remains unresolved, whilst using KRAS genotyping to stratify patients before anti-EGFR treatment was cost-effective. The second systematic review, by Westwood et al. in 2014 [38], was a health technology assessment focusing on the cost-effectiveness of KRAS testing of CRC tumours. Its literature search found 5 articles, which we also identified, and the authors concluded that the ICER for KRAS mutation testing to guide anti-EGFR therapy was large. However, although they performed a CEA and found KRAS testing to be cost-effective, their results should be interpreted with caution as a number of assumptions were made in relation to resection rates, MBM test use, etc. The third paper by Guglielmo et al. [60] identified 5 KRAS studies, which we also uncovered in our literature search, but the study by Barone et al. [61] which they included did not meet our PICOS criteria as a CEA. Additionally, their review did not include the Canadian [35] or Japanese [36] studies we identified, because their search was limited to 2011 to 2016. Their findings for KRAS testing to guide anti-EGFR therapy were inconclusive. The fourth review by Seo and Cairns [62] identified 46 studies but only 12 were relevant to our research question. We captured 11 of these studies, missing a poster by Niedersuess-Beke D. et al. [63]. Our findings correspond with Seo and Cairns, in that KRAS testing is always more cost-effective, even if this is not always the case for anti-EGFR therapies. However, we draw different conclusions from the data for the irinotecan studies, finding UGT1A1 testing not to be cost-effective.
We disagree with the Frank and Mittendorf systematic review on the lack of evidence to make a decision on the cost-effectiveness of UGT1A1, because our analysis indicates that there is enough evidence to support the assertion that the use of UGT1A1 genotyping to reduce irinotecan dosing is not cost-effective. Despite being able to select patients to receive chemotherapy, our findings suggest that there is insufficient evidence to indicate KRAS (and BRAF) testing is cost-effective, in the context of EGFR therapy.
It is evident that not all CRC patients currently benefit from precision medicine MBM-informed therapy, as is the case for the 53% of RAS mutant mCRC patients not eligible for anti-EGFR treatment [29]. The emerging field of molecular pathological epidemiology permits associations to be made between particular exposures (e.g. microorganisms, diet, lifestyle) and molecular pathological responses, identified through research on, for example, the interplay between the microbiome, tumour cells, and the immune system [64]. Patients harbouring PIK3CA mutated tumours benefit from exposure to aspirin, whereas PIK3CA wild-type patients do not [64]. Microsatellite instability high (MSI-H) tumours provoke a vigorous immunotherapeutic response; however, the presence of Fusobacterium nucleatum may counteract MSI-H positivity with associated immunosuppressive effects [64, 65]. The challenge in CEA is how to leverage multiple biomarkers such as RAS, BRAF, PIK3CA, MSI-H, and F.nucleatum positivity in a cost effective manner to precisely guide anti-EGFR therapy, aspirin therapy, and immunotherapy in mCRC. This challenge is becoming increasingly relevant as treatment algorithms incorporating multiple biomarkers become more common place and techniques such as whole genome sequencing enters clinical practice.
Conclusions
There is a paucity of high-quality CEAs that evaluate MBM in CRC. Unless CEA is incorporated prospectively into clinical trial design, economically unsubstantiated results can obscure the best available evidence, undermining both methodological approaches and resources. In summary, we found that the cost-effectiveness of MBM approaches to guide CRC therapy is highly variable. The evidence from our review suggests that DPYD screening could be cost-effective in high-income settings, if it is implemented before 5-FU therapy. Likewise, Oncotype DX assay is likely to be cost-effective in identifying patients who will not benefit from chemotherapy. We were unable to find evidence to support UGT1A1 testing to guide irinotecan dosing. Perhaps more controversially, despite its adoption in many countries globally, we found that the cost-effectiveness data currently available to support anti-EGFR treatment based on RAS/BRAF mutational status is inconclusive.
The evidence presented here reflects a need for a more rigorous methodological CEA-driven approach to be prospectively employed. There also needs to be greater transparency on prices used in CEA, so as to ensure the delivery of value-based care in a disease that kills nearly 170,000 Europeans every year.
Abbreviations
CRC: colorectal cancer; MBM: molecular biomarker; DPYD: Dihydropyrimidine dehydrogenase; UGT1A1: Uridine 5′-diphospho- glucuronosyltransferase family 1 member A1; EGFR: epidermal growth factor receptor; 5-FU: Fluorouracil; QALY: quality-adjusted lifer year; QALD: quality-adjusted life day; PICOS: population intervention comparator outcome study design; ISPOR: International Society for Pharmacoeconomics and Outcomes Research; CHEERS: consolidated health economic evaluations reporting standards; ICER: incremental cost-effectiveness ratio; BSC: best supportive care; LYG: life year gained; NICE: National Institute for Health and Care Excellence; CEA: cost-effectiveness analysis; DSA: deterministic sensitivity analysis; PSA: probabilistic sensitivity analysis; FOLFOX: FOL-Folinic acid (leucovorin): F-Fluorouracil (5-FU): OX-Oxaliplatin (Eloxatin); HQO: Health Quality Ontario; WTP: willingness-to-pay; CEAC: cost-effective acceptability curve; MSI-H: microsatellite instability-high.
CONFLICTS OF INTEREST
M.L has received honoraria from Pfizer for research unrelated to this work. M.L. has received an unrestricted educational grant from Pfizer for research unrelated to this work
FUNDING
M.L. was supported by the Medical Research Council; Cancer Research UK funded Stratification in Colorectal Cancer grant and from a grant from Cancer Focus, Northern Ireland. R.H. was funded by the Department for the Economy, Northern Ireland.
References
1. Ferlay J, Soerjomataram I, Dikshit R, Eser S, Mathers C, Rebelo M, Parkin DM, Forman D, Bray F. Cancer incidence and mortality worldwide: Sources, methods and major patterns in GLOBOCAN 2012. Int J Cancer. 2014; 136:E359–86. https://doi.org/10.1002/ijc.29210. [PubMed].
2. Allemani C, Matsuda T, Di Carlo V, Harewood R, Matz M, Nikšić M, Bonaventure A, Valkov M, Johnson CJ, Estève J, Ogunbiyi OJ, Azevedo E Silva G, Chen WQ, et al, and CONCORD Working Group. Global surveillance of trends in cancer survival 2000-14 (CONCORD-3): analysis of individual records for 37 513 025 patients diagnosed with one of 18 cancers from 322 population-based registries in 71 countries. Lancet. 2018; 391:1023–75. https://doi.org/10.1016/S0140-6736(17)33326-3. [PubMed].
3. Ferlay J, Steliarova-Foucher E, Lortet-Tieulent J, Rosso S, Coebergh JW, Comber H, Forman D, Bray F. Cancer incidence and mortality patterns in Europe: estimates for 40 countries in 2012. Eur J Cancer. 2013; 49:1374–403. https://doi.org/10.1016/j.ejca.2012.12.027. [PubMed].
4. Cancer Research UK. Bowel cancer statistics 2015. Available from: https://www.cancerresearchuk.org/health-professional/cancer-statistics/statistics-by-cancer-type/bowel-cancer.
5. Eurostat. Causes of death - deaths by country of residence and occurrence 2015. Available from: http://appsso.eurostat.ec.europa.eu/nui/show.do?dataset=hlth_cd_aro&lang=en.
6. Dunne PD, McArt DG, Bradley CA, O’Reilly PG, Barrett HL, Cummins R, O’Grady T, Arthur K, Loughrey MB, Allen WL, McDade SS, Waugh DJ, Hamilton PW, et al. Challenging the Cancer Molecular Stratification Dogma: Intratumoral Heterogeneity Undermines Consensus Molecular Subtypes and Potential Diagnostic Value in Colorectal Cancer. Clin Cancer Res. 2016; 22:4095–104. https://doi.org/10.1158/1078-0432.ccr-16-0032. [PubMed].
7. NCBI. Genetic Testing Registry. National Institute for Health. 2019. Available from: https://www.ncbi.nlm.nih.gov/gtr/.
8. Holtzman NA. Promoting safe and effective genetic tests in the United States: work of the task force on genetic testing. Clin Chem. 1999; 45:732–38. [PubMed].
9. Phillips KA, Ann Sakowski J, Trosman J, Douglas MP, Liang SY, Neumann P. The economic value of personalized medicine tests: what we know and what we need to know. Genet Med. 2014; 16:251–57. https://doi.org/10.1038/gim.2013.122. [PubMed].
10. Sepulveda AR, Hamilton SR, Allegra CJ, Grody W, Cushman-Vokoun AM, Funkhouser WK, Kopetz SE, Lieu C, Lindor NM, Minsky BD, Monzon FA, Sargent DJ, Singh VM, et al. Molecular Biomarkers for the Evaluation of Colorectal Cancer: Guideline From the American Society for Clinical Pathology, College of American Pathologists, Association for Molecular Pathology, and the American Society of Clinical Oncology. J Clin Oncol. 2017; 35:1453–86. https://doi.org/10.1200/jco.2016.71.9807. [PubMed].
11. Oosterhoff M, van der Maas ME, Steuten LM. A Systematic Review of Health Economic Evaluations of Diagnostic Biomarkers. Appl Health Econ Health Policy. 2016; 14:51–65. https://doi.org/10.1007/s40258-015-0198-x. [PubMed].
12. Prospero. Genetic biomarkers in metastatic colorectal cancer: a systematic review of health economic analyses. National Institute for Health Research. 2016. Available from: https://www.crd.york.ac.uk/prospero/display_record.php?RecordID=38046.
13. Husereau D, Drummond M, Petrou S, Carswell C, Moher D, Greenberg D, Augustovski F, Briggs AH, Mauskopf J, Loder E, and CHEERS Task Force. Consolidated Health Economic Evaluation Reporting Standards (CHEERS) statement. BMC Med. 2013; 11:80. https://doi.org/10.1186/1741-7015-11-80. [PubMed].
14. Jeong K, Cairns J. Systematic review of health state utility values for economic evaluation of colorectal cancer. Health Econ Rev. 2016; 6:36. https://doi.org/10.1186/s13561-016-0115-5. [PubMed].
15. EPPI. CCEMG - EPPI-Centre Cost Converter. EPPI. 2019. Available from: http://eppi.ioe.ac.uk/costconversion/default.aspx/.
16. Soda H, Maeda H, Hasegawa J, Takahashi T, Hazama S, Fukunaga M, Kono E, Kotaka M, Sakamoto J, Nagata N, Oba K, Mishima H. Multicenter Phase II study of FOLFOX or biweekly XELOX and Erbitux (cetuximab) as first-line therapy in patients with wild-type KRAS/BRAF metastatic colorectal cancer: the FLEET study. BMC Cancer. 2015; 15:695. https://doi.org/10.1186/s12885-015-1685-z. [PubMed].
17. Saif MW, Choma A, Salamone SJ, Chu E. Pharmacokinetically guided dose adjustment of 5-fluorouracil: a rational approach to improving therapeutic outcomes. J Natl Cancer Inst. 2009; 101:1543–52. https://doi.org/10.1093/jnci/djp328. [PubMed].
18. Qi WX, Shen Z, Tang LN, Yao Y. Does the addition of targeted biological agents to first-line chemotherapy for advanced colorectal cancer increase complete response? A systematic review and meta-analysis. Colorectal Dis. 2014; 16:O300–07. https://doi.org/10.1111/codi.12647. [PubMed].
19. Shea BJ, Grimshaw JM, Wells GA, Boers M, Andersson N, Hamel C, Porter AC, Tugwell P, Moher D, Bouter LM. Development of AMSTAR: a measurement tool to assess the methodological quality of systematic reviews. BMC Med Res Methodol. 2007; 7:10. https://doi.org/10.1186/1471-2288-7-10. [PubMed].
20. Chandler J, Churchill R, Higgins J, Lasserson T, Tovey D. Methodological standards for the conduct of Cochrane Intervention Reviews. The Cochrane Library. 2013. Available from: https://sti.cochrane.org/sites/sti.cochrane.org/files/public/uploads/Methodological%20standards%20for%20the%20conduct%20of%20Cochrane%20Intervention%20Reviews.PDF.
21. Traoré S, Boisdron-Celle M, Hunault G, Andre T, Morel A, Guerin-Meyer V, Capitain O, Gamelin E. DPD deficiency: medicoeconomic evaluation of pretreatment screening of 5-FU toxicity. J Clin Oncol. 2012; 30:410. https://doi.org/10.1200/jco.2012.30.4_suppl.410.
22. Longley DB, Harkin DP, Johnston PG. 5-fluorouracil: mechanisms of action and clinical strategies. Nat Rev Cancer. 2003; 3:330–38. https://doi.org/10.1038/nrc1074. [PubMed].
23. Butzke B, Oduncu FS, Severin F, Pfeufer A, Heinemann V, Giessen-Jung C, Stollenwerk B, Rogowski WH. The cost-effectiveness of UGT1A1 genotyping before colorectal cancer treatment with irinotecan from the perspective of the German statutory health insurance. Acta Oncol (Madr). 2015. Available from: https://doi.org/10.3109/0284186X.2015.1053983. [PubMed].
24. Gold HT, Hall MJ, Blinder V, Schackman BR. Cost effectiveness of pharmacogenetic testing for uridine diphosphate glucuronosyltransferase 1A1 before irinotecan administration for metastatic colorectal cancer. Cancer. 2009; 115:3858–67. https://doi.org/10.1002/cncr.24428. [PubMed].
25. Obradovic M, Mrhar A, Kos M. Cost-effectiveness of UGT1A1 genotyping in second-line, high-dose, once every 3 weeks irinotecan monotherapy treatment of colorectal cancer. Pharmacogenomics. 2008; 9:539–49. https://doi.org/10.2217/14622416.9.5.539. [PubMed].
26. Pichereau S, Le Louarn A, Lecomte T, Blasco H, Le Guellec C, Bourgoin H. Cost-effectiveness of UGT1A1*28 genotyping in preventing severe neutropenia following FOLFIRI therapy in colorectal cancer. J Pharm Pharm Sci. 2010; 13:615–25. https://doi.org/10.18433/j3wk5s. [PubMed].
27. Fukuda M, Suetsugu T, Shimada M, Kitazaki T, Hashiguchi K, Kishimoto J, Harada T, Seto T, Ebi N, Takayama K, Sugio K, Semba H, Nakanishi Y, Ichinose Y. Prospective study of the UGT1A1*27 gene polymorphism during irinotecan therapy in patients with lung cancer: Results of Lung Oncology Group in Kyusyu (LOGIK1004B). Thorac Cancer. 2016; 7:467–72. https://doi.org/10.1111/1759-7714.12360. [PubMed].
28. Temraz S, Mukherji D, Shamseddine A. Dual Inhibition of MEK and PI3K Pathway in KRAS and BRAF Mutated Colorectal Cancers. Int J Mol Sci. 2015; 16:22976–88. https://doi.org/10.3390/ijms160922976. [PubMed].
29. Sorich MJ, Wiese MD, Rowland A, Kichenadasse G, McKinnon RA, Karapetis CS. Extended RAS mutations and anti-EGFR monoclonal antibody survival benefit in metastatic colorectal cancer: a meta-analysis of randomized, controlled trials. Ann Oncol. 2015; 26:13–21. https://doi.org/10.1093/annonc/mdu378. [PubMed].
30. Hall RD, Kudchadkar RR. BRAF mutations: signaling, epidemiology, and clinical experience in multiple malignancies. Cancer Control. 2014; 21:221–30. https://doi.org/10.1177/107327481402100307. [PubMed].
31. Behl AS, Goddard KA, Flottemesch TJ, Veenstra D, Meenan RT, Lin JS, Maciosek MV. Cost-effectiveness analysis of screening for KRAS and BRAF mutations in metastatic colorectal cancer. J Natl Cancer Inst. 2012; 104:1785–95. https://doi.org/10.1093/jnci/djs433. [PubMed].
32. Blank PR, Moch H, Szucs TD, Schwenkglenks M. KRAS and BRAF mutation analysis in metastatic colorectal cancer: a cost-effectiveness analysis from a Swiss perspective. Clin Cancer Res. 2011; 17:6338–46. https://doi.org/10.1158/1078-0432.CCR-10-2267. [PubMed].
33. Carlson J. Pcn67 Cost-Utility of Kras Mutation Testing Prior To Treatment of Metastatic Colorectal Cancer With Cetuximab Monotherapy. Value Heal. International Society for Pharmacoeconomics and Outcomes Research. 2010; 13:A36. https://doi.org/10.1016/S1098-3015(10)72156-2.
34. Harty GT, Jarrett J, Jofre-Bonet M. Consequences Of Biomarker Analysis On The Cost-Effectiveness Of Cetuximab In Combination With Irinotecan Based Chemotherapy For First-Line Treatment Of Metastatic Colorectal Cancer. Stratified Medicine At Work? Value Health. 2015; 18:A456. https://doi.org/10.1016/j.jval.2015.09.1165. [PubMed].
35. Medical Advisory Secretariat. KRAS Testing for Anti-EGFR Therapy in Advanced Colorectal Cancer: An Evidence-Based and Economic Analysis. Ont Health Technol Assess Ser. 2010; 10:1–49. [PubMed].
36. Shiroiwa T, Motoo Y, Tsutani K. Cost-effectiveness analysis of KRAS testing and cetuximab as last-line therapy for colorectal cancer. Mol Diagn Ther. 2010; 14:375–84. https://doi.org/10.1007/bf03256395. [PubMed].
37. Vijayaraghavan A, Efrusy MB, Göke B, Kirchner T, Santas CC, Goldberg RM. Cost-effectiveness of KRAS testing in metastatic colorectal cancer patients in the United States and Germany. Int J Cancer. 2012; 131:438–45. https://doi.org/10.1002/ijc.26400. [PubMed].
38. Westwood M, van Asselt T, Ramaekers B, Whiting P, Joore M, Armstrong N, Noake C, Ross J, Severens J, Kleijnen J. KRAS mutation testing of tumours in adults with metastatic colorectal cancer: a systematic review and cost-effectiveness analysis. Health Technol Assess. 2014; 18:1–132. https://doi.org/10.3310/hta18620. [PubMed].
39. Alberts SR, Yu TM, Behrens RJ, Renfro LA, Srivastava G, Soori GS, Dakhil SR, Mowat RB, Kuebler JP, Kim GP, Mazurczak MA, Hornberger J. Comparative economics of a 12-gene assay for predicting risk of recurrence in stage II colon cancer. Pharmacoeconomics. 2014; 32:1231–43. https://doi.org/10.1007/s40273-014-0207-1. [PubMed].
40. Obradovic M, Mrhar A, Kos M. Cost-effectiveness of UGT1A1 genotyping in second-line, high-dose, once every 3 weeks irinotecan monotherapy treatment of colorectal cancer. Pharmacogenomics. 2008; 9:539–49. https://doi.org/10.2217/14622416.9.5.539. [PubMed].
41. Smith DH, Gravelle H. The practice of discounting in economic evaluations of healthcare interventions. Int J Technol Assess Health Care. 2001; 17:236–43. https://doi.org/10.1097/00005650-199305000-00003. [PubMed].
42. Thariani R, Veenstra DL, Carlson JJ, Garrison LP, Ramsey S. Paying for personalized care: cancer biomarkers and comparative effectiveness. Mol Oncol. 2012; 6:260–66. https://doi.org/10.1016/j.molonc.2012.02.006. [PubMed].
43. Deenen MJ, Meulendijks D, Cats A, Sechterberger MK, Severens JL, Boot H, Smits PH, Rosing H, Mandigers CM, Soesan M, Beijnen JH, Schellens JH. Upfront Genotyping of DPYD*2A to Individualize Fluoropyrimidine Therapy: A Safety and Cost Analysis. J Clin Oncol. 2016; 34:227–34. https://doi.org/10.1200/jco.2015.63.1325. [PubMed].
44. Goldstein DA, Shaib WL, Flowers CR. Costs and effectiveness of genomic testing in the management of colorectal cancer. Oncology (Williston Park). 2015; 29:175–83. http://www.cancernetwork.com/oncology-journal/costsand-effectiveness-genomic-testing-management-colorectalcancer. [PubMed].
45. Lu CY, Huang CW, Wu IC, Tsai HL, Ma CJ, Yeh YS, Chang SF, Huang ML, Wang JY. Clinical Implication of UGT1A1 Promoter Polymorphism for Irinotecan Dose Escalation in Metastatic Colorectal Cancer Patients Treated with Bevacizumab Combined with FOLFIRI in the First-line Setting. Transl Oncol. 2015; 8:474–79. https://doi.org/10.1016/j.tranon.2015.11.002. [PubMed].
46. Yeh YS, Tsai HL, Huang CW, Wang JH, Lin YW, Tang HC, Sung YC, Wu CC, Lu CY, Wang JY. Prospective analysis of UGT1A1 promoter polymorphism for irinotecan dose escalation in metastatic colorectal cancer patients treated with bevacizumab plus FOLFIRI as the first-line setting: study protocol for a randomized controlled trial. Trials. 2016; 17:46. https://doi.org/10.1186/s13063-016-1153-3. [PubMed].
47. Semrad TJ, Kim EJ. Molecular testing to optimize therapeutic decision making in advanced colorectal cancer. J Gastrointest Oncol. 2016; 7:S11–20. https://doi.org/10.3978/j.issn.2078-6891.2015.094. [PubMed].
48. National Institute for Health and Clinical Excellence (NICE). Cetuximab, bevacizumab and panitumumab for the treatment of metastatic colorectal cancer after first-line chemotherapy: Cetuximab (monotherapy or combination chemotherapy), bevacizumab (in combination with non-oxaliplatin chemotherapy) and panitumumab (mo. Technology appraisal guidance [TA242] 2012. Available from: https://www.nice.org.uk/guidance/TA242/.
49. National Institute for Health and Clinical Excellence (NICE). Cetuximab for the first-line treatment of metastatic colorectal cancer. Technology appraisal guidance [TA176] 2009. Available from: https://www.nice.org.uk/guidance/TA176/.
50. Carlson B. Putting a lid on chemotherapy costs. Biotechnol Healthc. 2011; 8:15–8. [PubMed].
51. Riihimäki M, Thomsen H, Sundquist K, Hemminki K. Colorectal cancer patients: what do they die of? Frontline Gastroenterol. 2012; 3:143–49. https://doi.org/10.1136/flgastro-2012-100141. [PubMed].
52. Hornberger J, Lyman GH, Chien R, Meropol NJ. A multigene prognostic assay for selection of adjuvant chemotherapy in patients with T3, stage II colon cancer: impact on quality-adjusted life expectancy and costs. Value Health. 2012; 15:1014–21. https://doi.org/10.1016/j.jval.2012.07.012. [PubMed].
53. Carlson B. Putting the Lid on Chemotherapy Costs. Biotechnol Healthc. 2011; 8:15–8. Available from: https://www.ncbi.nlm.nih.gov/pmc/articles/PMC3138387/pdf/bth08_2p015.pdf. [PubMed].
54. Govindarajan R, Posey J, Chao CY, Lu R, Jadhav T, Javed AY, Javed A, Mahmoud FA, Osarogiagbon RU, Manne U. A comparison of 12-gene colon cancer assay gene expression in African American and Caucasian patients with stage II colon cancer. BMC Cancer. 2016; 16:368. https://doi.org/10.1186/s12885-016-2365-3. [PubMed].
55. Kim Y, Jeong DH, Min BS, Song MK, Kim NK, Kim WR. Validation of a quantitative 12-multigene expression assay (Oncotype DX® colon cancer assay) in Korean patients with stage II colon cancer: implication of ethnic differences contributing to differences in gene expression. Onco Targets Ther. 2015; 3817:3817. https://doi.org/10.2147/ott.s95543. [PubMed].
56. Yamanaka T, Oki E, Yamazaki K, Yamaguchi K, Muro K, Uetake H, Sato T, Nishina T, Ikeda M, Kato T, Kanazawa A, Kusumoto T, Chao C, et al. 12-Gene Recurrence Score Assay Stratifies the Recurrence Risk in Stage II/III Colon Cancer With Surgery Alone: the SUNRISE Study. J Clin Oncol. 2016; 34:2906–13. https://doi.org/10.1200/jco.2016.67.0414. [PubMed].
57. Brenner B, Geva R, Rothney M, Beny A, Dror Y, Steiner M, Hubert A, Idelevich E, Gluzman A, Purim O, Shacham-Shmueli E, Shulman K, Mishaeli M, et al. Impact of the 12-Gene Colon Cancer Assay on Clinical Decision Making for Adjuvant Therapy in Stage II Colon Cancer Patients. Value Health. 2016; 19:82–87. https://doi.org/10.1016/j.jval.2015.08.013. [PubMed].
58. Frank M, Mittendorf T. Influence of pharmacogenomic profiling prior to pharmaceutical treatment in metastatic colorectal cancer on cost effectiveness : a systematic review. Pharmacoeconomics. 2013; 31:215–28. https://doi.org/10.1007/s40273-012-0017-2. [PubMed].
59. Mittmann N, Au HJ, Tu D, O’Callaghan CJ, Isogai PK, Karapetis CS, Zalcberg JR, Evans WK, Moore MJ, Siddiqui J, Findlay B, Colwell B, Simes J, et al, and Working Group on Economic Analysis of National Cancer Institute of Canada Clinical Trials Group, and Australasian Gastrointestinal Interest Group. Prospective cost-effectiveness analysis of cetuximab in metastatic colorectal cancer: evaluation of National Cancer Institute of Canada Clinical Trials Group CO.17 trial. J Natl Cancer Inst. 2009; 101:1182–92. https://doi.org/10.1093/jnci/djp232. [PubMed].
60. Guglielmo A, Staropoli N, Giancotti M, Mauro M. Personalized medicine in colorectal cancer diagnosis and treatment: a systematic review of health economic evaluations. Cost Eff Resour Alloc. 2018; 16:2. https://doi.org/10.1186/s12962-018-0085-z. [PubMed].
61. Barone C, Pinto C, Normanno N, Capussotti L, Cognetti F, Falcone A, Mantovani L. KRAS early testing: consensus initiative and cost-effectiveness evaluation for metastatic colorectal patients in an Italian setting. PLoS One. 2014; 9:e85897. https://doi.org/10.1371/journal.pone.0085897. [PubMed].
62. Seo MK, Cairns J. Do cancer biomarkers make targeted therapies cost-effective? A systematic review in metastatic colorectal cancer. PLoS One. 2018; 13:e0204496. https://doi.org/10.1371/journal.pone.0204496. [PubMed].
63. Niedersuess-Beke D, Schiffinger M, Mader R. P-233 * Economic impact of biomarker-based anti EGFR therapies in metastatic colorectal cancer in Austria. Ann Oncol. 2015; 26:iv68–68. https://doi.org/10.1093/annonc/mdv233.230.
64. Nishi A, Milner DA
65. Hamada T, Nowak JA, Milner DA