
INTRODUCTION
Metastatic non-small cell lung cancer (NSCLC) cannot be cured with systemic chemotherapy and only 4% have a 5 year survival rate after postoperative (adjuvant Cisplatin-based) chemotherapy [1]. It has long been postulated that intratumoral heterogeneity contributes to disease progression, impacts therapeutic efficacy and therefore affects patient survival. The tumor hierarchical model suggests that cancer stem cells (CSCs), which represent a biologically distinct subset within the total cancer cell population, have the principal properties of self-renewal, clonal tumor initiation capacity and clonal long-term repopulation potential [2]. Analysis of dermal stem cells suggested that the tissue stem cell and the niche-forming cell are a single entity [3]. The rimmed clone formation was also recognized as a cell-intrinsic property [4]. However, distinct origins of the niche and stem cell have been suggested as well [5]. Up to now, the role of the niche in the regulation of lung CSCs (LuCSCs), adenocarcinoma development and metastatic progression is still a matter of debate and speculation.
A long-standing hypothesis proposes that abnormal EGFR signaling could abrogate harmonically regulated normal alveoli formation, leading to putative lung stem cell transformation into LuCSC traits. The deregulations involve hijacking stem cell self-renewal and its multi-lineage differentiation ability. Subsequently, activation of oncogenes leads to adenocarcinoma development [6–9]. Patients whose tumors are driven by EGFR classical mutations have been shown to respond well to EGFR tyrosine kinase inhibitors (EGFR-TKIs), including Gefitinib, Erlotinib, Afatinib and Osimertinib [10–13]. Nevertheless, targeting these mutations with kinase inhibitors is not curative in advanced disease. Several mechanisms have been proposed for patients` acquired drug resistance, but many mechanisms still remain, as well as the role of LuCSCs.
Genomic studies demonstrate that tumor suppressors were frequently mutated in NSCLCs. One of them is MIG6 (the product of mitogen-inducible gene 6, also known as ERRFI1), whose inactivation contributes to hyper-activation of the EGFR-module and MET signaling pathway [14, 15]. We and others have shown that genomic disruption of the MIG6 gene orchestrates constitutive EGFR signaling resulting in degenerative joint diseases, skin hyperplasia, melanomas, and lung cancer in mice [16, 17]. In human lung adenocarcinomas, MIG6 was associated with EGFR-TKI resistance of putative dormant cancer cells and epithelial mesenchymal transition (EMT) induced refractoriness [18].
To address some issues mentioned above, we isolated LuCSC-holoclones and their progeny from NSCLC cell lines to gain insight into the transcriptional machinery and signaling pathway controlling LuCSC self-renewal, niche formation and differentiation. We demonstrated the importance of the MIG6/EGFR modules in regulating cross-talk between diverse cell populations and also screened for potential drugs that are able to eradicate LuCSCs and their progeny.
RESULTS
Lung cancer cell lines exhibit cellular heterogeneity with distinct clonal morphologies and unique characteristics
Phenotypic heterogeneity is a common feature of NSCLC cell lines and attributes to genetic instability and clonal evolution of tumors. Cellular polymorphism is remarkable in EGFR wild type NCI-H1568 cells, which is a cell line derived from lymph node metastasis of lung adenocarcinoma. For cells after Erlotinib treatment, real-time PCR demonstrated the elevated expression of stem cell markers-Nanog, Sox2, BMI1, Oct4, CD133, Periostin, ABCG2 and ABCC1 (Figure 1A), suggesting that a cell population with low- or no expression of EGFR is resistant to Erlotinib, and their survival displays a high degree of mRNA-transcripts associated with stem cell and iPSC phenotypes [19]. To better characterize the cellular heterogeneity of NCI-H1568 cells (Figure 1B), cell sorting and monoclonal cultivation was carried out to determine the diversity of clonal morphologies. Three-major hierarchical organized cell populations are schematically shown in Figure 1C. Holoclones were homogeneous, tightly packed epithelial cobblestone-like cells with near circular borderlines. Since holoclones correspond closely to stem cells [20], we could conclude that they are in fact LuCSCs [21]. 1st differentiated (DF) cells, an intermediate stage of differentiation, were considered as temporarily amplified mesenchymal cells. 2nd DF cells are classified as the poorly differentiated epithelial AT1- and cuboidal AT2- malignant pneumocytes in terms of lineage specific marker expressions (Figure 1H). Similar experiments were carried out on cells derived from another six human NSCLC cell lines (NCI-H1975, NCI-H1650, NCI-H3122, HCC95, HCC827 and A549), one immortalized human small airway epithelial cell line (SALE) and one SALER cell line (SALE transformed by KRASG12V mutant form). All cell lines developed a range of colony morphologies resembling LuCSCs, 1st DF cells and 2nd DF cells of NCI-H1568 (Supplementary Figure 1A). All these clones from NCI-H1568 cells have the ability to form spheres (Figure 1C). LuCSC-holoclones spontaneously generated acini-like structures. These type of spheres could be produced by epithelial normal and cancer cell lines [22, 23]. 1st DF cells were loosely connected initially but gradually formed compact alveospheres, partially resembling acini-like structures. In contrast, 2nd DF cells formed tightly packed spheroids with an initial cell number of ~50, and quickly gathered more cells layer by layer, making the spheres denser without apoptotic cells inside.
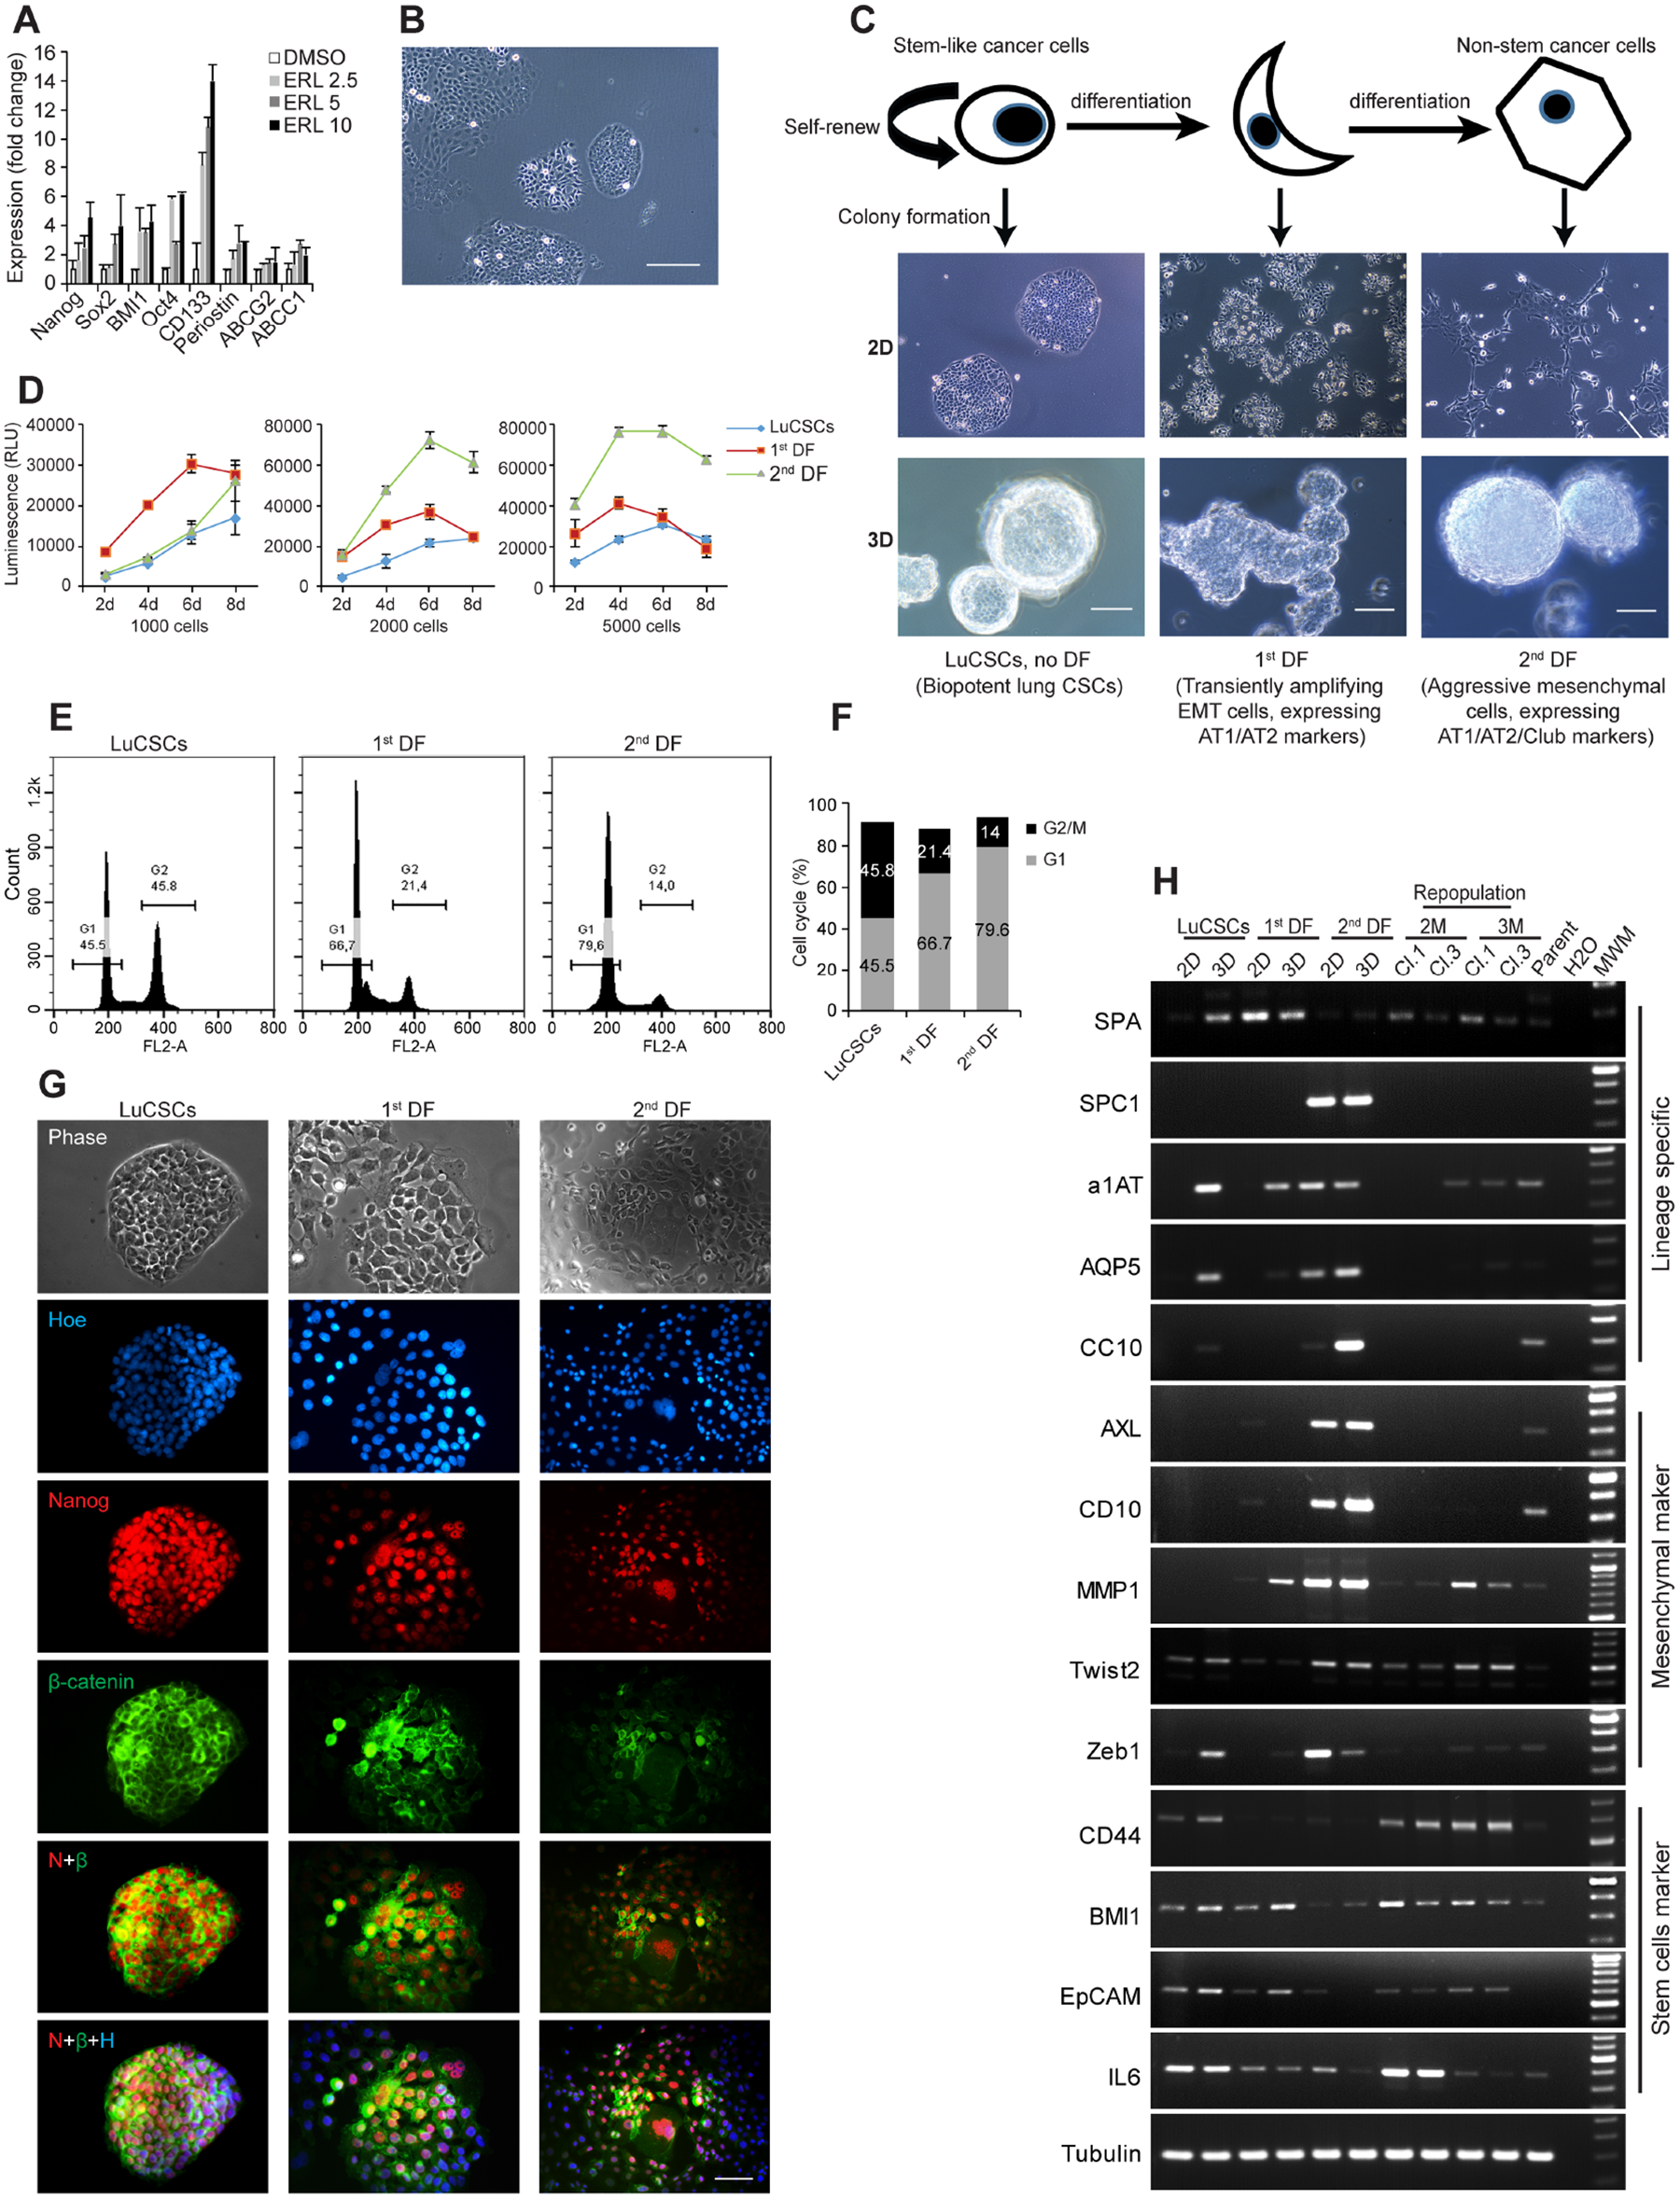
Figure 1: NSCLC cell line model (NCI-H1568) exhibits unique cellular heterogeneity and functional characteristic. (A) Real-time PCR evaluation of stem cell markers on NCI-H1568 parent cells treated with various concentrations of Erlotinib as indicated. (B) Representative image of NCI-H1568 parent cells. Scale bar: 10 μm. (C) Schematic representation of hierarchical organization in NSCLC cell lines. Three major cell populations and their functional definition are indicated. Bright field of monolayer cells (2D) and alveospheres (3D) generated from distinct subclones from NCI-H1568 cell line. Scale bar: 10 μm for 2D, 20 μm for 3D. (D) Long-term (up to 8 days) proliferation status of distinct types of cell clones. 1000, 2000 and 5000 cells of each clone were seeded in 96-well plates, every other day the number of viable cells was evaluated using CellTiter-Glo cell viability assay. (E) Cell cycle analysis was performed after propidium iodide DNA labeling and subsequent flow cytometry. (F) Percentage of LuCSCs, 1st DF and 2nd DF cells in G1, S and G2-M phases of the cell cycle. (G) Immunofluorescence analysis of LuCSCs, 1st DF and 2nd DF cells with primary antibodies against Nanog (red) and ß-catenin (green) and the nuclear stain Hoechst 33342 (blue). Scale bar: 20 μm. (H) Gene expression profiles of 2D and 3D cells from NCI-H1568 distinct subclones, as well as LuCSC derived alveospheres after spontaneous long-term differentiation program. Conventional PCR was used for evaluation. M: months. Cl: clone.
Proliferation capability assay indicated that the stem-like cells are in a more quiescent state, which makes them theoretically less sensitive to chemotherapeutics that target rapidly dividing cells (Figure 1D). Further evaluation was performed by using the Ki67 index (Supplementary Figure 1B). In conjunction with the proliferation assay, FACS analysis revealed significant cell cycle replication state differences between LuCSCs, 1st and 2nd DF cells (Figure 1E). The proportion of cells in the G2-M phase of the cell cycle was approximately 2 and 3 folds higher in LuCSCs than in the 1st and 2nd DF cells, with sequential percentages around 46%, 21%, and 14% (Figure 1F). Apoptotic cells were virtually undetectable in all cases. Stem-like cells were considered to have a resting or a slow mitotic index, while they continued to replicate through extending G2 phase and repairing DNA damage caused by the exogenous stimuli. Immunofluorescent staining further demonstrated that LuCSC colonies were close to 100% positive for Nanog nuclear and ß-catenin cell periphery staining. The majority of 2nd DF cells had low expression of Nanog, and only a few distinct ß-catenin positive cells were detected in this population. Both antibodies displayed moderate staining in 1st DF cells (Figure 1G and Supplementary Figure 1C).
To seek for the expression of lineage-specific and other critical genes, we established three monoclonal cell lines and their alveospheres as well as two LuCSC monolayer clones for repopulation program (Figure 1H). 2D LuCSCs do not express either lineage-specific mRNAs, including the AT1 cell marker aquaporin 5 (AQP5), AT2 marker surfactant protein A, C (SPA, SPC1), alpha 1 antitrypsin (α1AT), and club cell secretory protein (CC10). However, all these transcripts except SPC1 and CC10 were pronounced in LuCSC alveospheres. In addition, 2D holoclones expressed CD44, BMI1, EpCAM and IL6 which were frequently reported to function as stem cell markers, but not the mesenchymal markers AXL, CD10, MMP1, and Zeb1. Although Twist2 was detectable in LuCSCs, the expression was strongly increased upon differentiation in the alveospheres. However, transcription factor-Zeb1, a real player of EMT, is still silent. Among 2D cell comparisons, the lineage-specific and mesenchymal markers were all highly expressed in 2nd DF cells and consistently expressed under 3D culture conditions. Overall, 1st DF cells, as a transiently amplifying population, expressed some stem cell markers and exhibited AT2 transition into AT1 phenotype. Single LuCSC spheres, after a 2- and 3-month differentiation, continuously expressed the main lineage and stem cell markers; however, SPC1, AXL and CD10 were hardly detectable in the repopulated cells at this early time point. All analyzed molecules, except EpCAM, were expressed in the parent cells. Value changes have been analyzed and quantified in histograms (Supplementary Figure 1D).
LuCSCs in the rimmed-like niche formed pseudo-alveoli, which orchestrates differentiation into AT2/AT1 cell lineages
Niche structure formation has been first observed in holoclones derived from cell lines of normal tissues and resembles “rim-like niche” [3, 4]. In our study, we would like to stress that all tested NSCLC cell lines contained holoclone cells, some of which were able to form niche structures (data not shown). Single LuCSC-holoclones, after 96 hrs cultivation, displayed homogeneous cell morphology. However, in the epithelial cobblestone cells, towards the center of the colony, approximately 50 cells displayed well-defined spindle-like morphology, suggesting the putative initiation of niche formation (Figure 2A). Within 3 months of growth and differentiation, multiple niches gradually formed and spread throughout the colony from the middle towards the edge (Figure 2B).
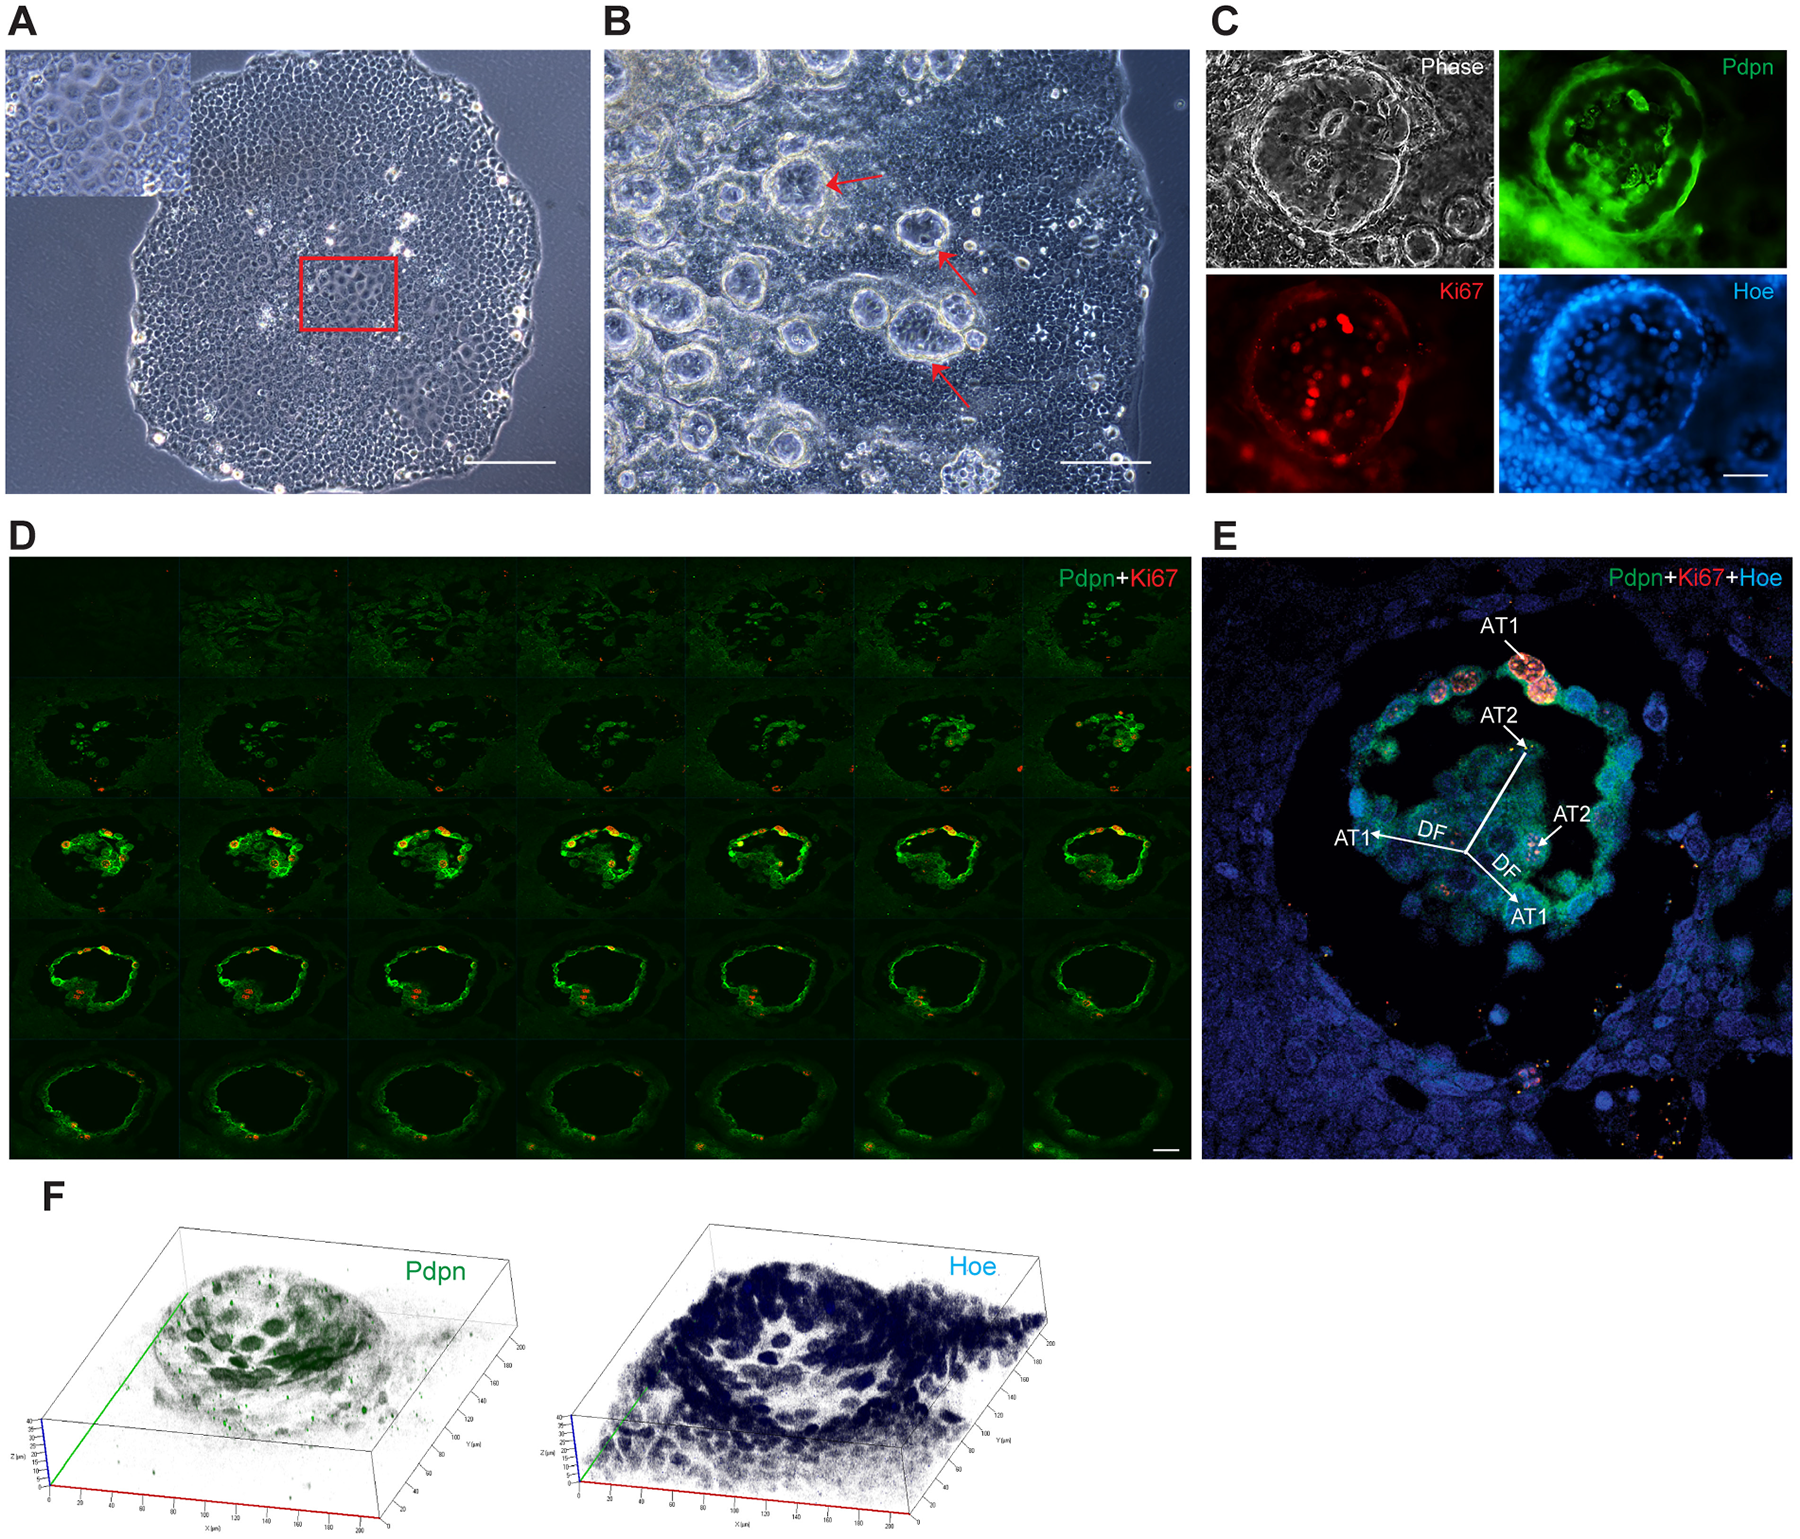
Figure 2: LuCSC-holoclones initiate rim-like niches and their differntiation creates pseudo-alveoli structures. (A) Representative image of a LuCSC holoclone after 96 hrs of growth. Framed area indicates the putative initiation of niche formation where locally spindle-like cells appear. (B) Multiple rimmed-niche formation (red arrow) in a LuCSC holoclone after 84 days of growth and differentiation. (C) Immunofluorescence analysis of single niche with AT1 cell marker Pdpn (green), proliferation marker Ki67 (red) and the nuclear stain Hoechst 33342 (blue). (D) Confocal two-dimentional gallery of single niche stained for Pdpn (green) and Ki67 (red). 40 series stacks were collected from the bottom to the top with an optical slice thickness of 1 μm. The last 5 layers of images have been removed to conserve space. (E) Representative image of the niche acquired from Z stack. DF: differentiation. (F) Confocal three-dimentional semispherical niche structure (stack of 40 optical sections) stained for Pdpn (green) and Hoechst 33342 (blue). Confocal microscope images were obtained with voxel size of 210(x)-210(y)-40(z) μm. Scale bar: 10 μm (A, B), 20 μm (C, D).
In single niches the AT1 marker Podoplanin (Pdpn), a transmembrane mucin-like glycoprotein, was highly expressed in two different cell populations: niche border cells and a chain of cells inside the niche. Pdpn+ cells frequently overlapped with the cells expressing Ki67, a marker of mitotic cells; however, cells with cuboidal morphology had weak Pdpn expression, and were often Ki67 negative or quiescent (Figure 2C). Confocal analysis was further applied to gain insight of LuCSC niche architecture. The spatial organization of the LuCSC niche resembled a cylinder with similar sizes on the basal and apical surface layers. For the first time we observed that LuCSC-holoclones initiated the formation of rim-niches from a basal lamina cell population (Figure 2D, top panel). Inside of the niche LuCSCs created pseudo-alveoli structures, which comprised AT1 spindle (Pdpnhigh) and AT2 cuboidal (Pdpnlow) with lipid droplets cells (Figure 2D, middle panel and 2E). We analyzed other niches under the same circumstances which demonstrated similar architecture, with variations of pseudo-alveoli structure form and depth (data not shown). Three-dimensional reconstruction of single niche demonstrates that hemi-spherically organized cells are directed down the middle (Figure 2F).
At low cell density, consistent with mRNA expression, immunofluorescence staining indicated double lineage marker expressions in 2nd DF cells (Supplementary Figure 2A). Pdpn was strongly expressed in arch-like cells, while cuboidal cells demonstrated AT2-specific SPC1 droplet staining. Surprisingly, progeny cells, at high cell density, lost Pdpn expression and all were converted to AT2-like cuboidal pneumocytes (Supplementary Figure 2B). AT2/AT1 double positive cells have been recently observed in vivo, where this phenotype was suggested to be associated with the ‘priming’ or increased plasticity of AT2 progenitor cells [24].
LuCSCs and progeny cells in monolayer and alveospheres inversely express EGFR/MIG6 genes
To determine the receptors involved in self-renewal and differentiation potential of colony forming cells, we used phospho-receptor tyrosine kinase array and identified the upregulation of EGFR, HER2, HER3 and IGF-R1 in 2nd DF cells relative to LuCSCs (Figure 3A). Later we analyzed EGFR-module signaling in parent cells and individual cell clones under 2D, 3D and differentiation conditions (Figure 3B). The phosphorylated proteins of the EGFR signaling pathway, including EGFR, dimerization partner HER2, as well as downstream signaling molecules AKT and ERK1/2, were barely detected in LuCSCs, but gradually increased and displayed their highest expression in 2nd DF cells. All these signaling proteins showed moderate expression in heterogeneous parent cells. 2nd DF cells demonstrated unique apoptosis resistance in cell culture, due to EGFR overactivation and strongest expression of AKT, even under serum-depleted conditions (data not shown). However, 3D-alveosphere conditions facilitated PARP cleavage among all cell lines, suggesting the induction of apoptosis upon overgrowth.
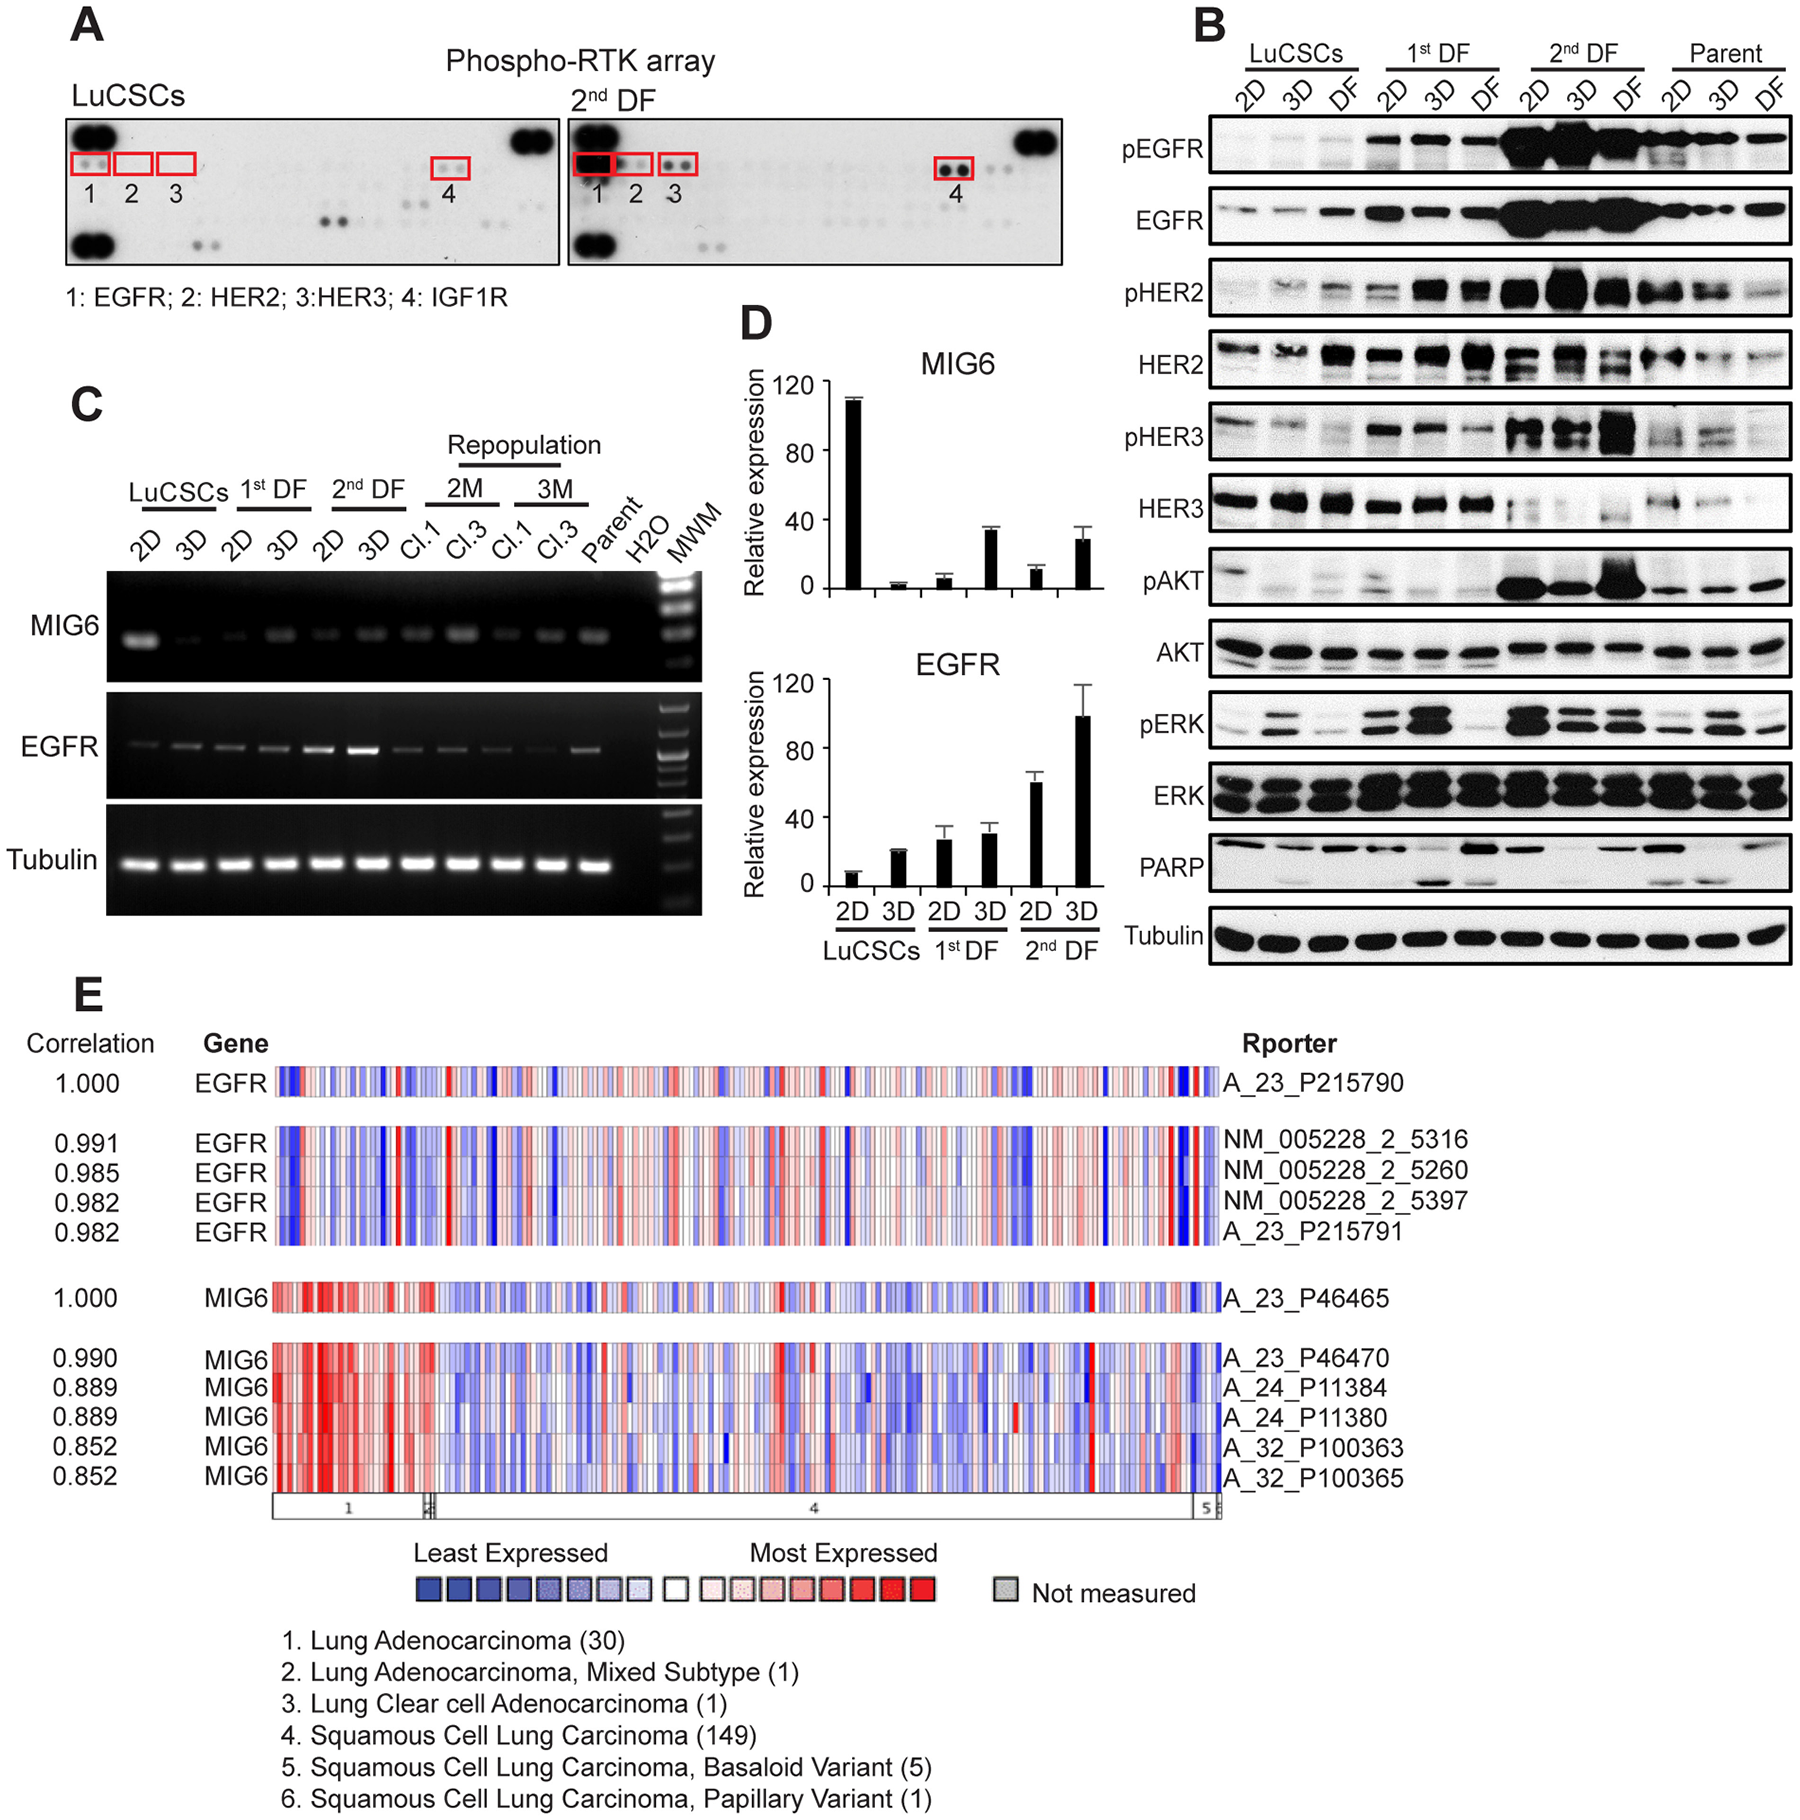
Figure 3: EGFR and MIG6 are inversely expressed in LuCSCs and their progeny. (A) Phospho-receptor tyrosine kinase array was used to simultaneously detect the relative phosphorylation of 49 different RTKs on LuCSCs and 2nd DF cells. (B) Monolayer cells (2D), alveospheres (3D) and cells after alveosphere differentiation (DF) from three distinct subclones as well as parent cells were lysed and prepared for western blot analysis of EGFR and downstream signaling proteins involved in proliferation and apoptosis. Tubulin served as a loading control. (C) Gene expression of EGFR and MIG6 in 2D and 3D LuCSCs, 1st DF and 2nd DF cells as well as the reprogrammed clones. Conventional PCR was used for evaluation. (D) Histogram quantification dialog of EGFR and MIG6 mRNA expression values. (E) Heatmap of inverse expression profiling of EGFR and MIG6, observed in 30 samples of the lung adenocarcinomas in comparison with 149 squamous cell lung carcinomas (https://www.oncomine.org TCGA lung).
Our previous publications indicated that MIG6 can negatively modulate EGFR signaling [14, 16]. Apparently, MIG6 gene expression was high in LuCSCs, but barely detectable in cell clones with high EGFR status (Figure 3C and 3D). The inverse expression of MIG6 and EGFR in LuCSCs and the progeny revealed a new mechanism controlling self-renewal program and differentiation. We have conducted a study where ONCOMINE microarray data was analyzed to evaluate EGFR gene expression in NSCLC tumors [25]. Low EGFR expression was observed in lung adenocarcinomas compared to squamous cell lung carcinoma, especially if simultaneously MIG6 expression was high (Figure 3E).
EGFR controls invasive behavior of the poorly differentiated progeny derived from LuCSCs
Invasion and metastasis are the most insidious and life-threatening aspects of cancer [26]. NCI-H1568 parent cells were initially checked to possess high capability of invasion (Figure 4A, top left). After sub cloning we wondered how invasiveness was associated with defined clones. Strikingly, we found that epithelial LuCSCs had no invasion capacity, whereas 2nd DF cells exhibited a greater than 2 and 4 fold increase in invasion compared to parent cells and 1st DF cells, respectively (Figure 4A, middle panel and Figure 4B). Our data argues against the EMT nature and aggressive behavior of CSCs [27, 28]. To address the potential influence of LuCSCs on their progeny invasiveness, we co-cultured LuCSCs with 1st and 2nd DF cells at equal proportions for 36 hrs. Surprisingly, the invasion was increased approximately 2 fold because of co-culture of either 1st or 2nd DF cells with LuCSCs (Figure 4A, two right panels).
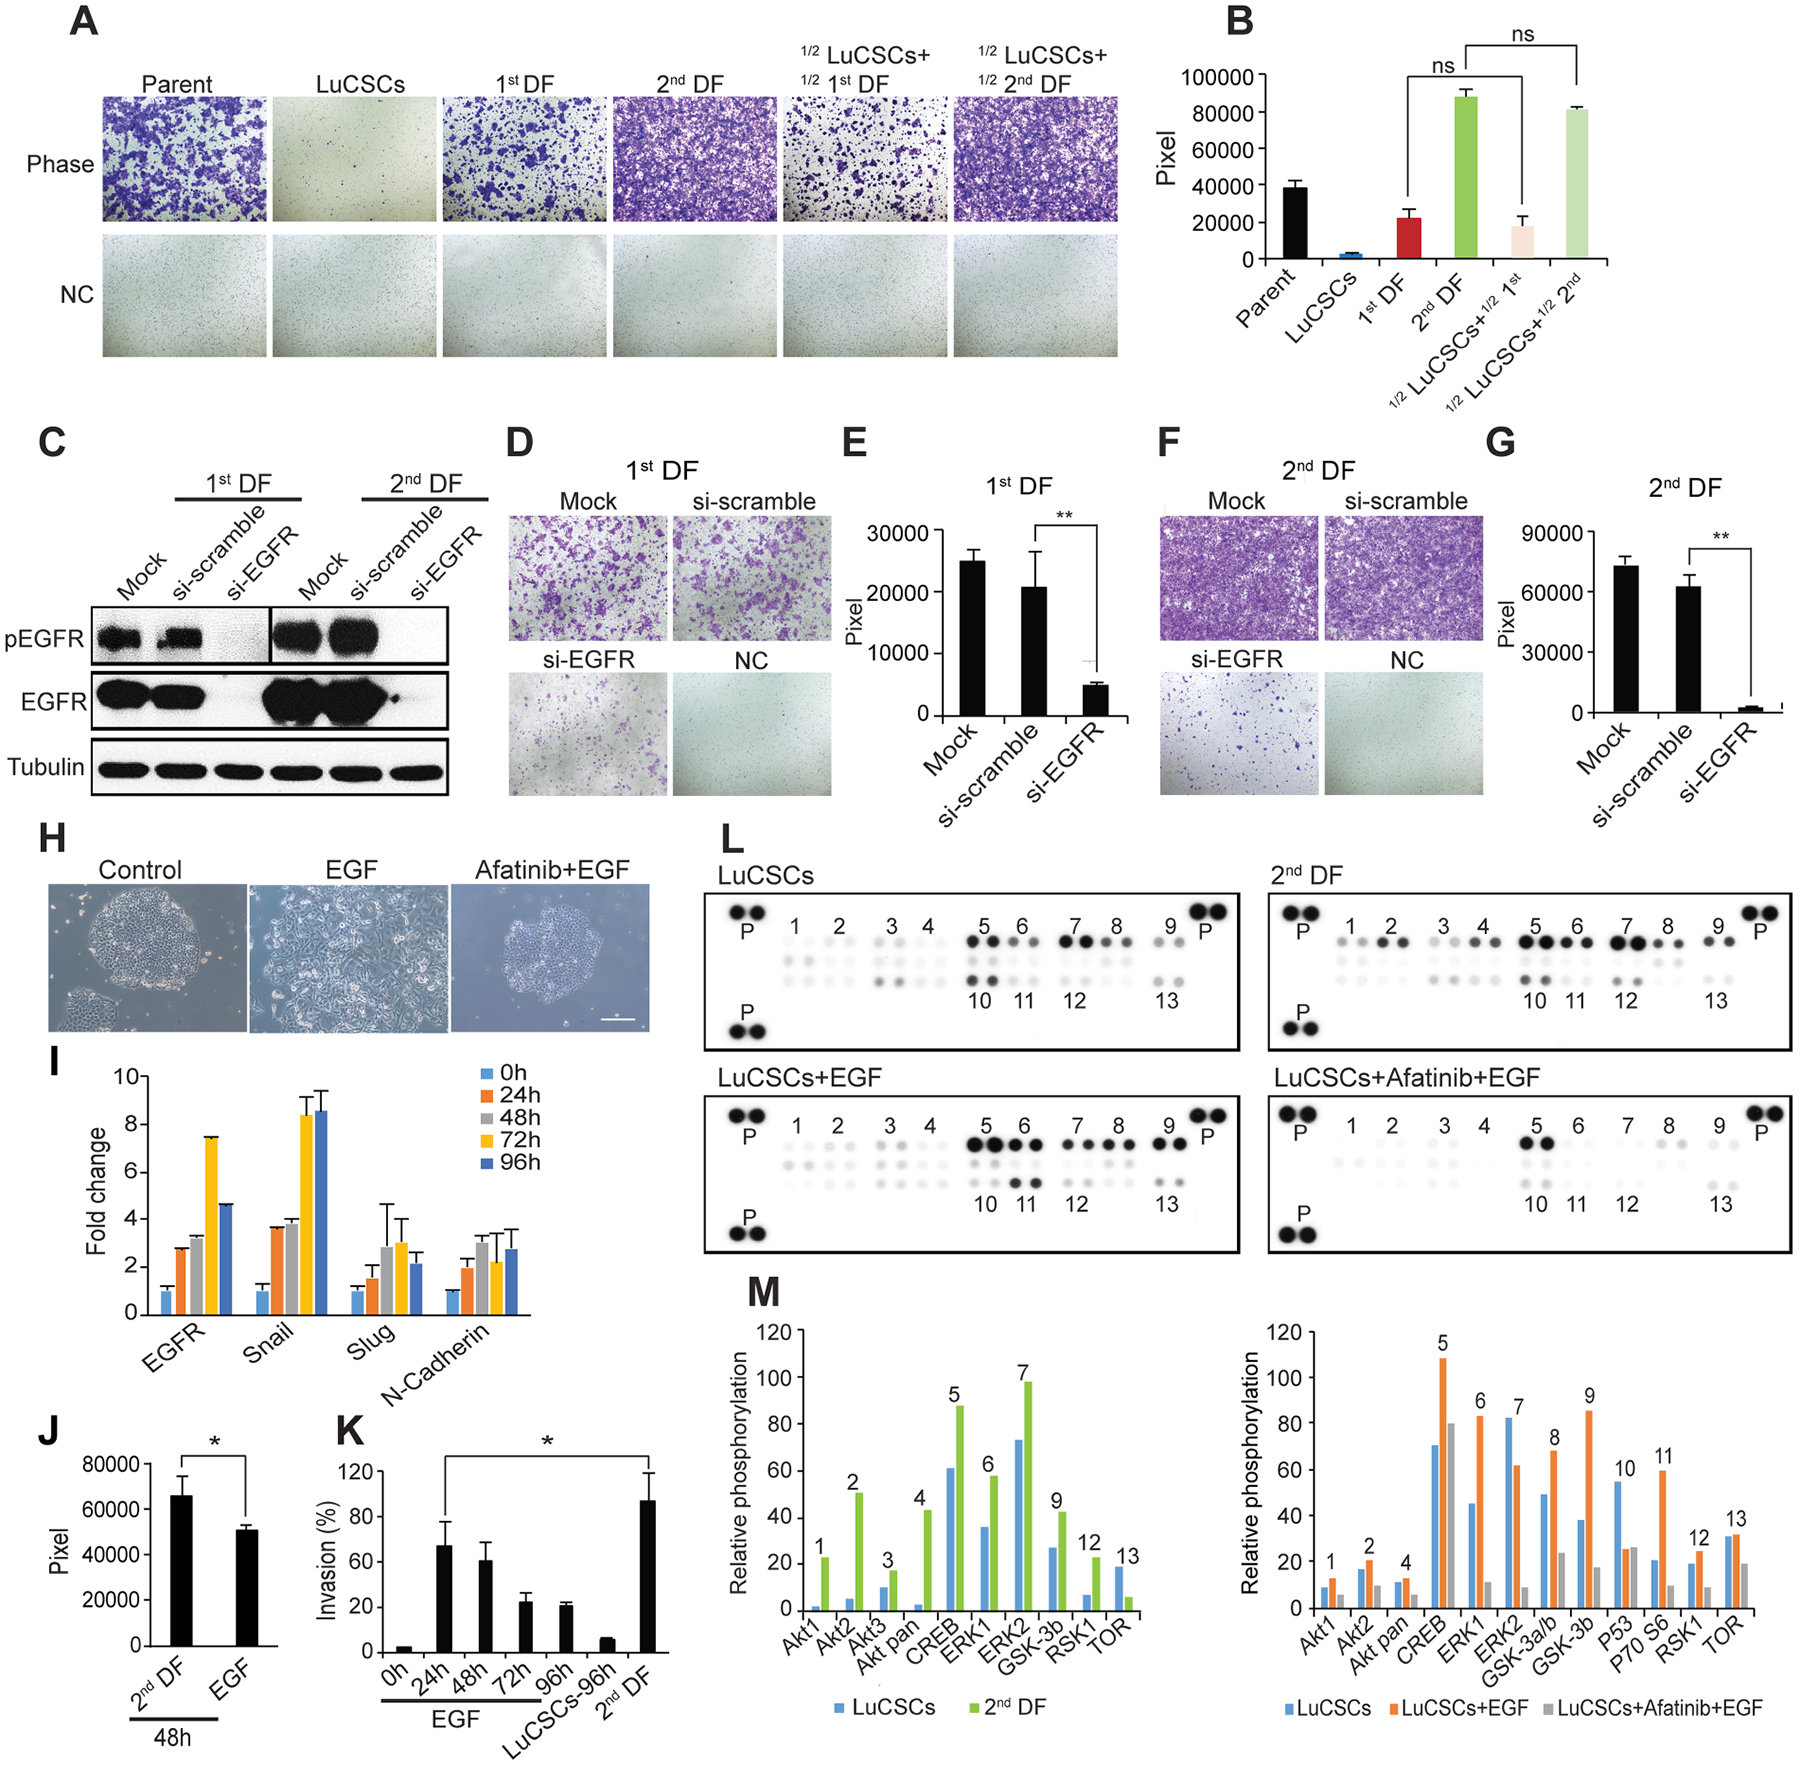
Figure 4: EGFR ligands induce LuCSC EMT-like differentiation. (A) Boyden chamber evaluation of NCI-H1568 parent cells and subclones, as well as mixed populations of LuCSCs with progeny cells. ½ LuCSCs + ½ 1st DF: LuCSCs and 1st DF cells were mixed at equal proportions and then added into the Boyden chamber inserts. ½ LuCSCs + ½ 2nd DF: LuCSCs and 2nd DF cells were mixed at equal proportions and then added into the Boyden chamber inserts. NC, negative control. (B) Quantification of cell invasiveness shown in (A). ns, not significant. (C) 1st and 2nd DF progeny cells 72 hrs after transfection with siRNA-EGFR and siRNA-scramble were lysed and protein was prepared for western blot analysis of pEGFR and EGFR. Tubulin served as a loading control. Representative images show reduced cell invasiveness of 1st DF (D) and 2nd DF (F) cells due to EGFR knockdown compared to control cells. NC, negative control. (E and G) Quantification of cell invasiveness shown in (E) and (G). **P < 0.01. (H) Representative images of LuCSCs stimulated with EGF (5 ng/ml) with/without 3.3 μM Afatinib pretreatment. Scale bar: 20 μm. (I) Real-time PCR analysis of EGFR and mesenchymal markers. Gene expression levels of LuCSCs were measured upon EGF stimulation at different time points as indicated. (J) Comparison of invasive activity of LuCSCs after stimulation with EGF and conditioned medium derived from 2nd DF cells (20% as chemoattractant) for 48 hrs. *P < 0.05.(K) Quantification of invasive activity of LuCSCs upon EGF stimulation at different time points as indicated. The values were indicated in % of control 2nd DF cells. *P < 0.05. (L) Whole-cell lysates from LuCSCs, 2nd DF cells, EGF stimulated LuCSCs with/without Afatinib (3.3 μM) pretreatment were collected for human phospho-kinase antibody array analysis. Each membrane contains kinase specific (number indicated) and positive control (P). (M) Relative phosphorylation of spots was quantified by normalizing pixel density of the positive control to 100. Each bar is represented as mean of duplicate spots.
Next, we examined whether endogenous EGFR signaling plays a role in mediating the invasive behavior of poorly differentiated adenocarcinoma progeny. To this end we utilized EGFR-siRNA and observed effective EGFR knockdown in the highly invasive 1st and 2nd DF cells (Figure 4C). Notably an equal inhibition of pEGFR was seen in both cell lines (Figure 4C). As expected, the invasiveness of both cell lines was almost abrogated by EGFR-siRNA specific inhibition (Figure 4D-4G). Taken together, our data demonstrated EGFR signaling is critical for the invasiveness of 1st and 2nd DF cells and possibly for the initiation of paracrine mediated LuCSC differentiation into aggressive mesenchymal cells.
We further identified EGFR ligands in the role of stimulating LuCSC differentiation. As expected, EGF overnight application induced profound LuCSC differentiation (Figure 4H, middle); however, pretreatment of LuCSCs with the EGFR inhibitor Afatinib abrogated this stimulatory effect (Figure 4H, right). The blocking effect by Afatinib confirmed that EGFR activation is critical for the initiation of LuCSC differentiation. Real-time PCR was employed simultaneously to examine the expression of a selection of genes, with potential relation to mesenchymal cells. The upregulation of EGFR, snail, and slug, together with N-cadherin, went along with the stimulation time (Figure 4I). We also observed that other EGF family ligands (Amphiregulin, TGFα, HB-EGF and Heregulin-β1) and cytokines (IL6 and Oncostatin M), as well as the serum free medium optimized for the culture of mammospheres, all triggered LuCSC differentiation towards a mesenchymal phenotype (Supplementary Figure 3A). Moreover, short time incubation of the ligands EGF, TGFα and HB-EGF with their specific antibodies completely abrogates the stimulatory effect (data not shown). EGF which induced phenotypical changes did also enhance LuCSC invasiveness, but to a significantly lesser extent than conditioned medium derived from 2nd DF cells (Figure 4J). Additionally, the invasive ability of LuCSCs after EGF stimulation was inversely correlated to the cultivation time (Figure 4K).
Later we used human phospho-kinase arrays to analyze and understand how cells recognize and respond to changes in their environment. The data revealed a range of signaling molecules that were phosphorylated in response to EGF treatment in comparison with Afatinib blockade, and significant ones were highlighted by numbers (Figure 4L). In LuCSC-holoclones, AKT1/2/3 was weakly expressed and no activation (AKT pS473) was observed after EGF stimuli, indicating at EGFR silent and stemness states EGFR-PI3K-AKT pathway does not play a significant role for survival and metabolic homeostasis. However, the AKT pathway was strongly activated in progeny 2nd DF cells (Figure 4M). Upon EGF stimulation, pCREB is increased in the LuCSCs in conjunction with β-catenin, Stat3 (Supplementary Figure 3B-3D), GSK3 (a/b) and p70S6 activations. However, pretreatment with Afatinib dramatically inhibited these protein activities, except CREB which was partially inhibited to basal level. Conversely, P53 was downregulated after EGF stimulation (Figure 4M). Overall, data indicates that growth response of LuCSCs mediated by EGF stimulation partially mimics early stage of differentiation.
Sensitivity of LuCSCs and their aggressive progeny towards chemo drugs and EGFR-TKIs
Putative CSCs have been shown to be associated with refractoriness to chemotherapy, to some extent explaining why tumors initially shrink after conventional treatment, then later reoccur [29]. Hence, drug sensitivity of cells isolated from these three types of colonies was evaluated by the application of chemotherapeutic drugs (Paclitaxel and Carboplatin), TKIs (Afatinib, Lapatinib, Erlotinib and Gefitinib) and putative CSC killers (Salinomycin and Metformin). Among the entire concentration range tested, the survival rates of LuCSCs were significantly higher than those of 1st and 2nd DF cells when treated with Paclitaxel and TKIs (Figure 5B top and 5C). However, LuCSCs were highly sensitive to Salinomycin and Metformin, as indicated by the low concentrations of 100 nM and 1 mM, causing 50% cell growth inhibition, respectively (Figure 5A). Single agent treatment with TKIs induced a substantial cell growth inhibition on 2nd DF cells (Figure 5C). Among all the tested drugs, 1st DF cells showed their highest sensitivity to Paclitaxel, with IC50 at 50 nM. 2nd DF cells highly express EGFR to constitutively activate signaling via autocrine stimuli, contributing to the drug sensitivity of aggressive progeny cells to EGFR-TKIs.
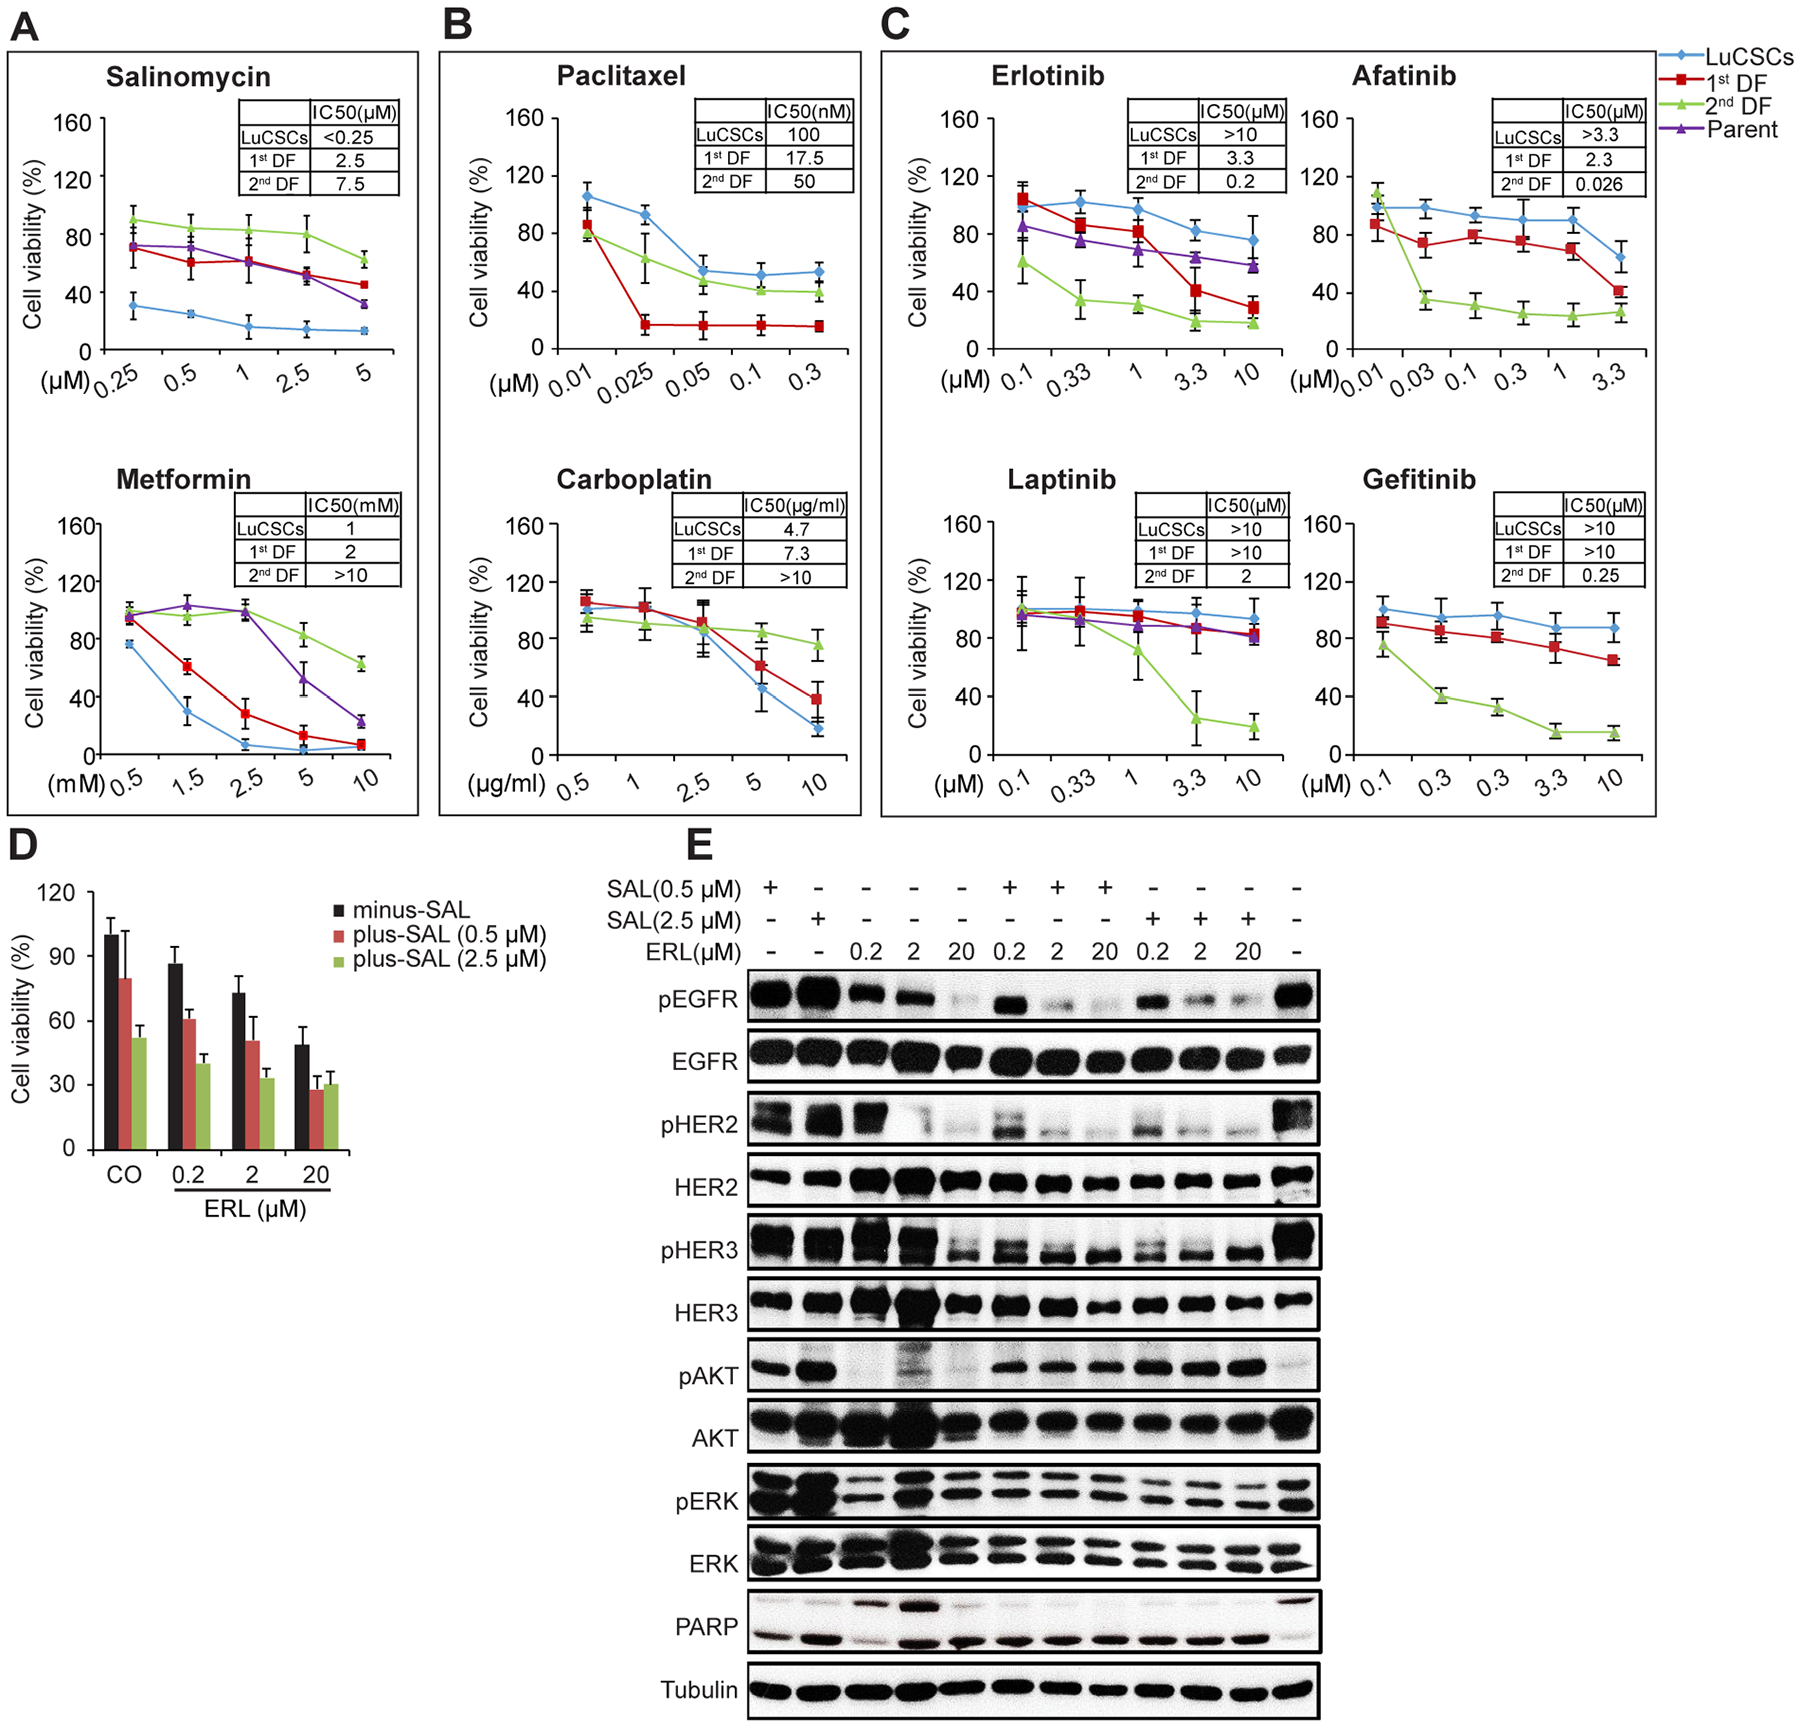
Figure 5: Sensitivity of LuCSCs and their progeny cells to cytotoxic drugs, EGFR-TKIs, Metformin and Salinomycin. (A-C) Response of NCI-H1568 parent cells (purple), LuCSCs (blue), 1st DF cells (red) and 2nd DF cells (green) to different drug treatment as indicated. The viable cells were assessed by CellTiter-Glo cell viability assay. The data of the survival curves were plotted as percentages of DMSO controls. Each experiment consists of 4 replicates for each point and the plotted data represent the average mean ±SD of three independent experiments. (D) Cell viability of NCI-H1568 parent cells after combined treatment with various concentrations of Salinomycin and Erlotinib as indicated. The viable cells were assessed by CellTiter-Glo cell viability assay. The data of the survival curves were plotted as percentages of DMSO controls.(E) EGFR signaling evaluation of NCI-H1568 parent cells after combined treatment with various concentrations of Salinomycin and Erlotinib as indicated.
We hypothesized that, in parent cells, TKIs target rapidly proliferating cells (e.g. 1st and 2nd DF cells) but spares slow-dividing LuCSCs which represent the chemo- and TKI resistance. Cell viability assay indicated that parent cells were very resistant to Erlotinib and Lapatinib (IC50 > 20 μM), and resistant to Salinomycin and Metformin (Figure 5A and 5C). Combinatorial treatment of parent cells with various concentrations of Salinomycin and Erlotinib enhanced growth inhibition over that observed with either single agent (Figure 5D). The beneficial effect of combined treatment is evident for all combinations with a more significant effect observed when a higher dose (2.5 μM) of Salinomycin was used.
To further estimate EGFR signaling which might correlate with the observed growth inhibition, we examined the effect of Erlotinib and Salinomycin alone or in combination on the activation state of several key regulators involved in the EGFR signaling pathway (Figure 5E). 48 hrs treatment with increasing concentrations of Erlotinib resulted in a gradual reduction in the activated forms of EGFR, HER2 and HER3, which were further reduced in the face of co-treatment with Salinomycin. Suppression of pERK1/2 was only observed with dual treatment, and with weak inhibitory effect. At this check point AKT, an anti-apoptotic protein, was strongly activated in a dose dependent manner upon Salinomycin monotreatment. Co-exposure to Erlotinib, which alone didn't induce AKT activation, decreased Salinomycin-triggered AKT phosphorylation. Additionally, single-agent Salinomycin or Erlotinib both elicited a dose-dependent activation of PARP, whereas the pronounced apoptosis activation evident under combinatorial treatment was no longer affected by dose.
DISCUSSION
Highly tumorigenic and self-renewing cells, with properties like CSCs, have been reported in both SCLC and NSCLC using CD133+, CD44+, CD24+, and CD133+ cell surface markers or high ALDHA1 activity [21, 30–33]. However, neither the characteristics of CSC morphology or lineage-specific differentiation nor their interactions with the niche are known. In our study, we used NSCLC cell lines as the in vitro tumor models to translate cellular heterogeneity into tractable populations to understand the cellular origins of lung cancers and drug resistance.
Three-major hierarchical organized cell populations, named as LuCSCs, 1st and 2nd DF cells, were isolated in relation to stem and lineage-specific marker expressions. We identified that LuCSC-holoclones were lineage-naïve and with the ability to grow indefinitely in culture. They could undergo spontaneous and inducible differentiation in 2D-monolayer to create aggressive progeny expressing AT2/AT1/Club markers, suggesting their origination from putative bronchioalveolar bipotent stem/progenitor cells. Gene expression profiling demonstrated that LuCSCs were EpCAM+/CD44+/BIMI1+/Nanog+/β-catenin+/IL6+, while these genes are specificaly transcribed in stem cells and iPSCs as shown in many publications. We extrapolate that transformation turned stem cells into LuCSCs. The bipotent LuCSCs hijack stemness, sustain malignancy and preserve the capability to be differentiated into aggressive descendants. Alveosphere culture also revealed to be a good approach to initiate LuCSC differentiation into lineage specific progeny. Under this condition, AT2 cells were able to trans-differentiate into Club cells with CC10 expression.
Although the existence of the CSC niche is accepted, precise knowledge of its 3D architecture remains unknown. These rim-cell niches identified in our lung cancer cell model highly resemble the niches observed in normal tracheal epithelial basal cells and in holoclones of the hair follicles [4, 5]. In human lungs, fibroblasts were shown to maintain AT2 stem cell property by providing single cell fibroblast niches [34]. Further evidence also suggests that in vivo there are at least two populations of stromal cells in the alveolar niche, and only one of which, mesenchymal, promotes alveolar organoid growth [35, 36]. One new observation reported here is that LuCSC-holoclones initiate the formation of rim-niches from a basal lamina cell population, which potentially functions as feeder cells. These mesenchymal cells could further produce paracrine signals to transiently expand the progenitor pool where LuCSCs were indefinitely preserved, or in other words, protected from differentiation in cell culture condition. Inside of the niches pseudo-alveoli structures were generated, where presumably mesenchymal cells and extracellular matrix orchestrated malignant AT2/AT1 lineage formation. Future studies will need to test the functional significance of the association between LuCSCs and mesenchymal cells in holoclone niches.
Numerous publications indicate that EMT is a key program to generate CSCs. Our data sheds light on a new understanding of LuCSCs. The LuCSC-holoclones were EpCAM+ (morphologically epithelial), and negative for classical EMT genes AXL, CD10, Zeb1 and MMP1 that are involved in motility and invasive behavior of mesenchymal cancer cells [37, 38]. LuCSC-holoclones weakly expressed Twist2, however, the RNA-transcription was dramatically activated in their alveospheres. We extrapolate that Twist2 expressing LuCSCs were cells committed for EMT at the edge of colonies that accompany morphology changes. Nevertheless, they do not demonstrate any invasive activity. It is challenging to preserve LuCSCs from epithelial transition in culture or cell sorting. In this respect, we speculate that the sorted tumor initiating cells used in many publications have already been differentiated into aggressive descendants, most likely 1st DF cells, to be tumorigenic or invasive. Mechanistically, the regulation of LuCSC transition from self-renewal to differentiation could be highly connected to the activation of EGFR signaling and the inhibition of MIG6. These inverse regulations are well demonstrated in clinical lung cancer samples [39]. For the first time we observed that tumor suppressor MIG6 is highly expressed in LuCSCs and downregulated in the aggressive progeny. There has been some data indicating that MIG6 expression is regulated epigenetically through promoter methylation or histone deacetylation inhibition [40, 41]. Additionally, we cannot exclude the possibility that promoter hypermethylation of EGFR silences its expression in LuCSCs, and demethylation in progeny cells drives its expression [42].
The EMT has been implicated in resistance development, which is not the case in our cell line model. 1st DF and 2nd DF cells displayed typical EMT traits, however, 2nd DF cells were extremely sensitive to EGFR-TKIs and 1st DF cells to Paclitaxel as well. Both act as inhibitors of highly proliferative cell populations. Aggressive 2nd DF cells (almost no stemness) possess exclusive growth efficiency in serum-depleted culture condition due to high expressions of EGFR and its ligands as well as AXL/GAS6, providing them autologous signal for proliferation and survival. Surprisingly, IC50s of LuCSCs to Erlotinib and Afatinib were more than 20 μM, which exceeded their solubility in culture medium. We speculate that EGFR silence in LuCSCs contributes to the failure of NSCLC mono-therapy, even though adenocarcinomas are driven by overexpressed, mutant or wild type EGFR. Additionally, LuCSCs and 1st DF cells (retaining stemness partially) were exclusively sensitive to antibiotic Salinomycin and AMPK agonist Metformin. Indeed, several approved antibiotics have already shown effects on putative CSC survival in preclinical models and clinical studies via reduction of stemness properties [43]. Mitochondrial health is fundamental for the maintenance of CSCs and can be targeted for cancer therapy. The ability of Metformin to induce autophagy, AMPK activation, and cell death can be attributed to decreased energy production, due to a partial, but coordinated compromise of glycolysis and mitochondrial function of the respiratory chain [44–47]. To expose the clinical relevance of our study, we further compared the IC50s of our tested drugs and their maximum plasma concentrations (Cmax) in patients [48]. Salinomycin is currently an experimental medication, but has not gone to clinical trials. Overall, (1) IC50s of 1st DF and LuCSCs to TKIs are higher than Cmax, which perfectly explains why TKIs can only cause tumor shrinkage, but not elimination. (2) Although we didn’t evaluate such a high dose of Carboplatin (Cmax=50 μg/ml), 2nd DF cells are clearly not responsive to all the tested concentrations (high as 10 μg/ml). (3) The plasma Cmax of Paclitaxel appears to be much higher than IC50s of all clones. Our previous work demonstrated that other NSCLC cell lines (e.g. NCI-H1975 and HCC95) were less responsive to Paclitaxel [45], so establishing a link between the molecular subtype and drug response will enable better stratification of patients for improved therapeutic strategies. (4) Due to the short-term exposure and supraphysiologic glucose in cell culture, mM concentrations of Metformin are often required to induce anti-cancer affects in in vitro studies, whereas in humans the therapeutic dose is μM. Wahdan-Alaswad et al. have shown that Metformin treatment of cells for weeks or months, as is required for clonogenicity assays, anti-cancer activity can be detected using doses in the μM range [49].
Thus, successful lung cancer treatment requires combinatorial application or a novel approach to target both LuCSCs and differentiated tumor cells. We have previously shown that combination of Salinomycin and Metformin was best for treatment of alveospheres consisting of LuCSCs and other differentiated cell populations [45]. In the current study we tested our hypothesis by treating the parental heterogeneous NCI-H1568 cells with Salinomycin and Erlotinib alone or in combination. The results clearly demonstrated that either Salinomycin or Erlotinib eliminates different cell populations, via alternative pathway of inhibitions. Salinomycin led to cell death without inhibiting EGFR signaling and surprisingly, pAKT and pERK1/2 were increased. However, Erlotinib treatment lead to classical programmed cell death via EGFR/ERK1/2 signaling axis inhibition and Caspase3-PARP activation in progeny cells [44]. Consistent with the elevated stem cell marker expression upon Erlotinib treatment, combinatorial treatment eradicated the parental cell population at much lower concentrations of both drugs. As suggested, this combinatorial setting has already been conducted in NSCLC patients in several clinical trials. For example, the phase 3 FASTACT-2 applied Erlotinib intercalated with chemotherapy (Gemcitabine plus Carboplatin/Cisplatin) into patients with advanced NSCLCs. Data had shown that the intercalation regimen improved progression free survival in Asian patients bearing the EGFR mutated form, but these results were not yet translated into clinical practice [50]. We would like to stress that EGFR naivety in LuCSCs is important for understanding their resistance to TKIs. Targeting CSCs with mitochondrial respiratory chain modulators/inhibitors, AMPK agonist (Metformin/Phenformin) or antibiotics (Erythromycin or Salinomycin) would be an option to overcome treatment resistance associated with EGFR naïve LuCSC; however, it still presents a big challenge due to lack of knowledge about mechanisms of their actions. Establishing LuCSC-holoclone cell lines, from fresh biopsies of pre/after EGFR-TKI treated NSCLC patients, will allow better understanding of the cellular origin of lung tumor heterogeneity, and all these will lead to improved therapeutic strategies. Our results open a new chapter in the development of novel approaches to overcome TKI resistance phenomena in lung adenocarcinoma treatment.
MATERIALS AND METHODS
Cell lines and chemicals
The human NSCLC cell lines, NCI-H1568 and A549 were obtained from the American Type Culture Collection. HCC95, NCI-H3122, NCI-H1650, HCC827, NCI-H1975, normal airway epithelial cell line (SALE) and KRASG12D transformed SALE cells (SALER) were kindly provided by Dr. Thomas Roman. Cancer cells were cultured in RPMI-1640 medium supplemented with 10% FBS, L-glutamine, 100 U/ml penicillin and 50 μg/ml streptomycin. Cell lines were identity-verified by STR analysis and certified as mycoplasma-free within 6 months of the experiments reported. All cell lines were authenticated using the Stem-Elite ID System (Promega, Madison, WI, USA).
Tyrosine kinase inhibitors Gefitinib, Lapatinib, and Erlotinib were purchased from Vichem Chemie. Chemotherapeutic agents Paclitaxel, and putative stem cell killers Metformin and Salinomycin were purchased from Sigma. Afatinib was purchased from SelleckChem, Carboplatin was purchased from Santa Cruz.
siRNA-cell line transfections
Cells were plated at 60% to 80% confluence in 6-well plate with antibiotic-free culture medium. Transfection of 21-nucleotide siRNA specific for EGFR (Thermo Fisher, #1299001) as well as a corresponding scrambled siRNA (Thermo Fisher, #12935-200) was carried out using LipofectamineTM RNAiMAX (Invitrogen) according to the manufacturer’s protocol.
Proliferation assays
LuCSCs, 1st DF and 2nd DF cells were seeded at 1000, 2000 and 5000 cells/well. Proliferation was measured 2, 4, 6, and 8 days after cell seeding using CellTiter-Glo luminescent cell viability assay (Promega), following manufacturer’s instructions. Experiments were set up in four replicate wells and repeated thrice. Opaque-walled 96-well plates with clear bottoms were used for cells culture.
Western blot
Protein samples were electrophoresed using 7.5 or 10% SDS–PAGE and performed as previously described [45]. Membranes were incubated with the primary antibodies against pEGFR Y1173 (Cell Signaling, #4407), EGFR (Transduction Laboratories, E12020), pHER2 Y1248 (Cell signaling, #2247), HER2 (Millipore, #06-562), pHER3 Y1289 (Cell signaling, #4791), HER3 (Millipore, #05-390), pERK1/2 (Cell Signaling, #9101), ERK1 K23 (Santa Cruz, sc-94), pAKT (Cell Signaling, #9271), AKT1/2/3 H-136 (Santa Cruz, sc-8312), PARP (Cell Signaling, #9542), Tubulin (Sigma, T9026), Secondary HRP-conjugated anti-rabbit (Bio-Rad) and anti-mouse (Sigma) antibodies were used and detection was done using an ECL reagent.
Alveospheres formation assay
Monolayer cells from individual clones were seeded in ultra-low adherent 6-well plate and grown in serum-free MammoCult™ Medium: DMEM/F12 (1:1, Gibco) supplemented with 30% Glucose (Sigma, G8270), Hepes (Serva, 25245), Progesterone (Sigma, P8783), Putrescine (Sigma, P5780), B27 (Gibco, 17504), EGF (Peprotech, AF-100-15), FGF2 (Sigma, F0291), ITSS (Roche, 110745470), Heparin (Sigma, H3149) and NaHCO3 (Invitrogen, 25080-060).
Boyden chamber invasion assay
50,000 cells resuspended in 350 μl of serum-free medium were seeded into the Matrigel-coated Boyden chamber inserts (BD Biosciences). In the bottom chamber 750 μl medium with or without 10% FCS served as chemoattractant or negative control, respectively. Cells were permitted to migrate for 36 hrs, then fixed and stained with crystal violet. Pictures were taken on a Zeiss Observer. A1 microscope. The value of the migrated cells was calculated from at least three wells for each experiment group and analyzed with the Photoshop CS3 extended measurement feature.
Immunofluorescence assay
Cells were seeded onto 12 mm coverslips in 24-well dishes and allowed for attachment. Cells were fixed in methanol, blocked in 3% BSA, and incubated with the following primary antibodies: Podoplanin (Santa Cruz, sc-376695), SPC1 (Santa Cruz, sc-13979), Ki67 (Abcam, ab15580), Nanog (Abcam, ab21624), β-catenin (Transduction Laboratories, #610154). After incubation with secondary antibody Alexa Fluor 488-conjugated goat anti-mouse (Jackson Immunoresearch, #115-545-003) or Alexa Fluor 594-conjugated goat anti-rabbit (Jackson Immunoresearch, #111-585-144), nuclei were stained with Hoechst 33342. Coverslips were mounted in Prolong Gold Antifade Reagent (Cell Signaling, #9071). Image acquisition was carried out using a Zeiss Axioplan2 microscope and the MediaView software.
Flow cytometry
1-2 × 10⁶ cells grown in 6-well plates were trpsinized and fixed with 70% ice cold ethanol followed by 30 minutes incubation at 4 °C. Cells were stained with 0.1% Triton X-100, 10 g/mL PI (Molecular Probes), and 100 μg/mL DNase-free RNase A in PBS at room temperature in the dark for 30 minutes. Cell cycle distribution was determined by FACScan flow cytometer (BD Biosciences) and analyzed by Cell Quest software (BD Biosciences).
Phospho-kinase array
The human Phospho-receptor tyrosine kinases array (R&D Systems, ARY001B), Proteome Profiler Human Phospho-Kinase Array Kit (R&D Systems, ARY003B) and Proteome Profiler Human Phospho-MAPK Array Kit (R&D Systems, ARY002B) were used following manufacturer's instructions. Spot densities were analyzed using the AIDA software. The average density of duplicated spots was determined and normalized to the controls.
Confocal microscopy
Slides were viewed using Zeiss LSM 780 confocal microscope equipped with 405-, 488-, and 543-nm laser lines and a GaAsp detector. Images were collected using 40× objectives acquired through Z-stack acquisition, with an increasement of 1 μm between image frames and processed using the Zeiss software. The AxioCamMRm camera was utilized to capture images. Cells expressing both Ki67-Red and Podoplanin-Green were selected, and Z-stack acquisition was performed. The LuCSC niche whole mounts were scanned from the basal layer 0 to apical surface layer 40. The 3D organization and size of the rimmed-niche were displayed in X-210 x Y-210 x Z-40 μm. Images were displayed as maximum intensity projections and subsequently analyzed for co-localization using 2D/3D cyto-fluorograms and fluorescence intensity line profiles obtained with the use of the Zen 2016 imaging software.
Gene expression analysis
RNA was extracted using the RNAeasy kit (QIAGEN) and 5 μg isolated total RNA was reverse-transcribed into cDNA as template for PCR amplifications. Semi-quantitative PCR was performed using the ReadyMixTMredtaqTM PCR reaction mix (Sigma), and PCR products were subjected to electrophoresis in 2% agarose gels. Detailed primer sequences are in Supplementary Table 1.
Real-time PCR
All quantitative PCR reactions (20 μl) were carried out in the StepOneTM plus Real-Time PCR system (Applied Biosystems) using Fast SYBR Green Master Mix (AB Applied Biosystems, Darmstadt, Germany). The 2 ˉΔΔCT method was used to analyze the relative fold change in gene expression with hypoxanthine phosphoribosyl-transferase (HPRT) (Applied Biosystems) as an endogenous control. Data analysis and calculation of 95% confidence intervals was performed using the StepOneTM Software version 2.0. All specimens were evaluated in triplicates. Detailed primer sequences are in Supplementary Table 2.
Statistical analysis
Data are represented as mean ±SD from three independent experiments unless stated otherwise. Statistical analysis was performed by one-way analysis of variance (ANOVA), and statistical significance was evaluated with the unpaired 2-tailed Student t test to assess difference between treated and control samples.
Abbreviations
NSCLC: non-small cell lung cancer; CSCs: cancer stem cells; LuCSCs: lung cancer stem cells; EGFR-TKIs: EGFR tyrosine kinase inhibitors; EMT: epithelial mesenchymal transition; DF: differentiated; AQP5: aquaporin 5; SPA, SPC1: surfactant protein A, C; α1AT: alpha 1 antitrypsin; CC10: club cell secretory protein; Pdpn: Podoplanin.
Author contributions
Conceptualization, P.K. and ZG.X.; Methodology, ZG.X., P.K., B.S., and T.N; Investigation, ZG.X., P.K., B.S., E. S-P, S.G. and T.N; Writing – Original Draft, ZG.X., P.K.; Writing – Review & Editing, ZG.X., P.K., S.G. and A.U.; Supervision, P.K.
ACKNOWLEDGMENTS
We thank Dr. Thomas Duell and Dr. Franz Kerek for critically reviewing the manuscript and important suggestions; Tatyana Knyazev for RNA/cDNA preparation and PCR analysis; Renate Gautch for cell cultivation; Dr. Roman Thomas for providing the NSCLC cell lines.
CONFLICTS OF INTEREST
The authors declare no potential conflicts of interest.
GRANT SUPPORT
This work was supported by the Max Planck Institute.
REFERENCES
1. Arriagada R, Dunant A, Pignon JP, Bergman B, Chabowski M, Grunenwald D, Kozlowski M, Le Péchoux C, Pirker R, Pinel MI, Tarayre M, Le Chevalier T. Long-term results of the international adjuvant lung cancer trial evaluating adjuvant Cisplatin-based chemotherapy in resected lung cancer. J Clin Oncol. 2010; 28:35–42. https://doi.org/10.1200/JCO.2009.23.2272.
2. Welte Y, Adjaye J, Lehrach HR, Regenbrecht CR. Cancer stem cells in solid tumors: elusive or illusive? Cell Commun Signal. 2010; 8:6. https://doi.org/10.1186/1478-811X-8-6.
3. Blanpain C, Lowry WE, Geoghegan A, Polak L, Fuchs E. Self-renewal, multipotency, and the existence of two cell populations within an epithelial stem cell niche. Cell. 2004; 118:635–48. https://doi.org/10.1016/j.cell.2004.08.012.
4. Ghosh M, Helm KM, Smith RW, Giordanengo MS, Li B, Shen H, Reynolds SD. A single cell functions as a tissue-specific stem cell and the in vitro niche-forming cell. Am J Respir Cell Mol Biol. 2011; 45:459–69. https://doi.org/10.1165/rcmb.2010-0314OC.
5. Plaks V, Kong N, Werb Z. The cancer stem cell niche: how essential is the niche in regulating stemness of tumor cells? Cell Stem Cell. 2015; 16:225–38. https://doi.org/10.1016/j.stem.2015.02.015.
6. Jiang J, Protopopov A, Sun R, Lyle S, Russell M. Genomic Profiling on an Unselected Solid Tumor Population Reveals a Highly Mutated Wnt/β-Catenin Pathway Associated with Oncogenic EGFR Mutations. J Pers Med. 2018; 8:13. https://doi.org/10.3390/jpm8020013.
7. Paez JG, Jänne PA, Lee JC, Tracy S, Greulich H, Gabriel S, Herman P, Kaye FJ, Lindeman N, Boggon TJ, Naoki K, Sasaki H, Fujii Y, et al. EGFR mutations in lung cancer: correlation with clinical response to gefitinib therapy. Science. 2004; 304:1497–500. https://doi.org/10.1126/science.1099314.
8. Lin C, Song H, Huang C, Yao E, Gacayan R, Xu SM, Chuang PT. Alveolar type II cells possess the capability of initiating lung tumor development. PLoS One. 2012; 7:e53817. https://doi.org/10.1371/journal.pone.0053817.
9. Cancer Genome Atlas Research Network. Comprehensive molecular profiling of lung adenocarcinoma. Nature. 2014; 511:543–50. https://doi.org/10.1038/nature13385.
10. Sordella R, Bell DW, Haber DA, Settleman J. Gefitinib-sensitizing EGFR mutations in lung cancer activate anti-apoptotic pathways. Science. 2004; 305:1163–67. https://doi.org/10.1126/science.1101637.
11. Soria JC, Ohe Y, Vansteenkiste J, Reungwetwattana T, Chewaskulyong B, Lee KH, Dechaphunkul A, Imamura F, Nogami N, Kurata T, Okamoto I, Zhou C, Cho BC, et al; FLAURA Investigators. Osimertinib in untreated EGFR-mutated advanced non–small-cell lung cancer. N Engl J Med. 2018; 378:113–25. https://doi.org/10.1056/NEJMoa1713137.
12. Shien K, Toyooka S, Yamamoto H, Soh J, Jida M, Thu KL, Hashida S, Maki Y, Ichihara E, Asano H, Tsukuda K, Takigawa N, Kiura K, et al. Acquired resistance to EGFR inhibitors is associated with a manifestation of stem cell-like properties in cancer cells. Cancer Res. 2013; 73:3051–61. https://doi.org/10.1158/0008-5472.CAN-12-4136.
13. Ahluwalia MS, Becker K, Levy BP. Epidermal Growth Factor Receptor Tyrosine Kinase Inhibitors for Central Nervous System Metastases from Non-Small Cell Lung Cancer. Oncologist. 2018; 23:1199–209. https://doi.org/10.1634/theoncologist.2017-0572.
14. Hackel PO, Gishizky M, Ullrich A. Mig-6 is a negative regulator of the epidermal growth factor receptor signal. Biol Chem. 2001; 382:1649–62. https://doi.org/10.1515/BC.2001.200.
15. Jin N, Cho SN, Raso MG, Wistuba I, Smith Y, Yang Y, Kurie JM, Yen R, Evans CM, Ludwig T, Jeong JW, DeMayo FJ. Mig-6 is required for appropriate lung development and to ensure normal adult lung homeostasis. Development. 2009; 136:3347–56. https://doi.org/10.1242/dev.032979.
16. Ferby I, Reschke M, Kudlacek O, Knyazev P, Pantè G, Amann K, Sommergruber W, Kraut N, Ullrich A, Fässler R, Klein R. Mig6 is a negative regulator of EGF receptor-mediated skin morphogenesis and tumor formation. Nat Med. 2006; 12:568–73. https://doi.org/10.1038/nm1401.
17. Zhang X, Pickin KA, Bose R, Jura N, Cole PA, Kuriyan J. Inhibition of the EGF receptor by binding of MIG6 to an activating kinase domain interface. Nature. 2007; 450:741–44. https://doi.org/10.1038/nature05998.
18. Endo H, Okami J, Okuyama H, Nishizawa Y, Imamura F, Inoue M. The induction of MIG6 under hypoxic conditions is critical for dormancy in primary cultured lung cancer cells with activating EGFR mutations. Oncogene. 2017; 36:2824–34. https://doi.org/10.1038/onc.2016.431.
19. Takahashi K, Yamanaka S. Induction of pluripotent stem cells from mouse embryonic and adult fibroblast cultures by defined factors. Cell. 2006; 126:663-76. https://doi.org/10.1016/j.cell.2006.07.024.
20. Barrandon Y, Green H. Three clonal types of keratinocyte with different capacities for multiplication. Proc Natl Acad Sci U S A. 1987; 84:2302–06. https://doi.org/10.1073/pnas.84.8.2302.
21. Satar NA, Fakiruddin KS, Lim MN, Mok PL, Zakaria N, Fakharuzi NA, Abd Rahman AZ, Zakaria Z, Yahaya BH, Baharuddin P. Novel triple-positive markers identified in human non-small cell lung cancer cell line with chemotherapy-resistant and putative cancer stem cell characteristics. Oncol Rep. 2018; 40:669–81. https://doi.org/10.3892/or.2018.6461.
22. Visvader JE, Lindeman GJ. Cancer stem cells in solid tumours: accumulating evidence and unresolved questions. Nat Rev Cancer. 2008; 8:755–68. https://doi.org/10.1038/nrc2499.
23. Shaheen S, Ahmed M, Lorenzi F, Nateri AS. Spheroid-formation (Colonosphere) assay for in vitro assessment and expansion of stem cells in colon cancer. Stem Cell Rev. 2016; 12:492–99. https://doi.org/10.1007/s12015-016-9664-6.
24. Chung MI, Bujnis M, Barkauskas CE, Kobayashi Y, Hogan BL. Niche-mediated BMP/SMAD signaling regulates lung alveolar stem cell proliferation and differentiation. Development. 2018; 145. https://doi.org/10.1242/dev.163014.
25. Rhodes DR, Yu J, Shanker K, Deshpande N, Varambally R, Ghosh D, Barrette T, Pandey A, Chinnaiyan AM. ONCOMINE: a cancer microarray database and integrated data-mining platform. Neoplasia. 2004; 6:1–6. https://doi.org/10.1016/S1476-5586(04)80047-2.
26. Robinson DR, Wu YM, Lonigro RJ, Vats P, Cobain E, Everett J, Cao X, Rabban E, Kumar-Sinha C, Raymond V, Schuetze S, Alva A, Siddiqui J, et al. Integrative clinical genomics of metastatic cancer. Nature. 2017; 548:297–303. https://doi.org/10.1038/nature23306.
27. Brabletz T, Kalluri R, Nieto MA, Weinberg RA. EMT in cancer. Nat Rev Cancer. 2018; 18:128–34. https://doi.org/10.1038/nrc.2017.118.
28. Sato R, Semba T, Saya H, Arima Y. Concise Review: Stem Cells and Epithelial-Mesenchymal Transition in Cancer: Biological Implications and Therapeutic Targets. Stem Cells. 2016; 34:1997–2007. https://doi.org/10.1002/stem.2406.
29. Reya T, Morrison SJ, Clarke MF, Weissman IL. Stem cells, cancer, and cancer stem cells. Nature. 2001; 414:105–11. https://doi.org/10.1038/35102167.
30. Eramo A, Lotti F, Sette G, Pilozzi E, Biffoni M, Di Virgilio A, Conticello C, Ruco L, Peschle C, De Maria R. Identification and expansion of the tumorigenic lung cancer stem cell population. Cell Death Differ. 2008; 15:504–14. https://doi.org/10.1038/sj.cdd.4402283.
31. Leung EL, Fiscus RR, Tung JW, Tin VP, Cheng LC, Sihoe AD, Fink LM, Ma Y, Wong MP. Non-small cell lung cancer cells expressing CD44 are enriched for stem cell-like properties. PLoS One. 2010; 5:e14062. https://doi.org/10.1371/journal.pone.0014062.
32. Roudi R, Madjd Z, Ebrahimi M, Samani FS, Samadikuchaksaraei A. CD44 and CD24 cannot act as cancer stem cell markers in human lung adenocarcinoma cell line A549. Cell Mol Biol Lett. 2014; 19:23–36. https://doi.org/10.2478/s11658-013-0112-1.
33. Ho MM, Ng AV, Lam S, Hung JY. Side population in human lung cancer cell lines and tumors is enriched with stem-like cancer cells. Cancer Res. 2007; 67:4827–33. https://doi.org/10.1158/0008-5472.CAN-06-3557.
34. Sirianni FE, Chu FS, Walker DC. Human alveolar wall fibroblasts directly link epithelial type 2 cells to capillary endothelium. Am J Respir Crit Care Med. 2003; 168:1532–37. https://doi.org/10.1164/rccm.200303-371OC.
35. Zepp JA, Zacharias WJ, Frank DB, Cavanaugh CA, Zhou S, Morley MP, Morrisey EE. Distinct mesenchymal lineages and niches promote epithelial self-renewal and myofibrogenesis in the lung. Cell. 2017; 170:1134-48.e10. https://doi.org/10.1016/j.cell.2017.07.034.
36. Zacharias WJ, Frank DB, Zepp JA, Morley MP, Alkhaleel FA, Kong J, Zhou S, Cantu E, Morrisey EE. Regeneration of the lung alveolus by an evolutionarily conserved epithelial progenitor. Nature. 2018; 555:251–55. https://doi.org/10.1038/nature25786.
37. Zeisberg M, Neilson EG. Biomarkers for epithelial-mesenchymal transitions. J Clin Invest. 2009; 119:1429–37. https://doi.org/10.1172/JCI36183.
38. Vajkoczy P, Knyazev P, Kunkel A, Capelle HH, Behrndt S, von Tengg-Kobligk H, Kiessling F, Eichelsbacher U, Essig M, Read TA, Erber R, Ullrich A. Dominant-negative inhibition of the Axl receptor tyrosine kinase suppresses brain tumor cell growth and invasion and prolongs survival. Proc Natl Acad Sci U S A. 2006; 103:5799–804. https://doi.org/10.1073/pnas.0510923103.
39. Izumchenko E, Sidransky D. Understanding the MIG6-EGFR Signaling Axis in Lung Tumorigenesis. Cancer Discov. 2015; 5:472–74. https://doi.org/10.1158/2159-8290.CD-15-0336.
40. Maity TK, Venugopalan A, Linnoila I, Cultraro CM, Giannakou A, Nemati R, Zhang X, Webster JD, Ritt D, Ghosal S, Hoschuetzky H, Simpson RM, Biswas R, et al. Loss of MIG6 Accelerates Initiation and Progression of Mutant Epidermal Growth Factor Receptor-Driven Lung Adenocarcinoma. Cancer Discov. 2015; 5:534–49. https://doi.org/10.1158/2159-8290.CD-14-0750.
41. Nakayama S, Sng N, Carretero J, Welner R, Hayashi Y, Yamamoto M, Tan AJ, Yamaguchi N, Yasuda H, Li D, Soejima K, Soo RA, Costa DB, et al. β-catenin contributes to lung tumor development induced by EGFR mutations. Cancer Res. 2014; 74:5891–902. https://doi.org/10.1158/0008-5472.CAN-14-0184.
42. Montero AJ, Díaz-Montero CM, Mao L, Youssef EM, Estecio M, Shen L, Issa JP. Epigenetic inactivation of EGFR by CpG island hypermethylation in cancer. Cancer Biol Ther. 2006; 5:1494–501. https://doi.org/10.4161/cbt.5.11.3299.
43. Snyder V, Reed-Newman TC, Arnold L, Thomas SM, Anant S. Cancer Stem Cell Metabolism and Potential Therapeutic Targets. Front Oncol. 2018; 8:203. https://doi.org/10.3389/fonc.2018.00203.
44. Xiao Z, Gaertner S, Morresi-Hauf A, Genzel R, Duell T, Ullrich A, Knyazev PG. Metformin Triggers Autophagy to Attenuate Drug-Induced Apoptosis in NSCLC Cells, with Minor Effects on Tumors of Diabetic Patients. Neoplasia. 2017; 19:385–95. https://doi.org/10.1016/j.neo.2017.02.011.
45. Xiao Z, Sperl B, Ullrich A, Knyazev P. Metformin and salinomycin as the best combination for the eradication of NSCLC monolayer cells and their alveospheres (cancer stem cells) irrespective of EGFR, KRAS, EML4/ALK and LKB1 status. Oncotarget. 2014; 5:12877–90. https://doi.org/10.18632/oncotarget.2657.
46. Jiang J, Li H, Qaed E, Zhang J, Song Y, Wu R, Bu X, Wang Q, Tang Z. Salinomycin, as an autophagy modulator— a new avenue to anticancer: a review. J Exp Clin Cancer Res. 2018; 37:26. https://doi.org/10.1186/s13046-018-0680-z.
47. Levy A, Doyen J. Metformin for non-small cell lung cancer patients: opportunities and pitfalls. Crit Rev Oncol Hematol. 2018; 125:41–47. https://doi.org/10.1016/j.critrevonc.2018.03.001.
48. Liston DR, Davis M. Clinically Relevant Concentrations of Anticancer Drugs: A Guide for Nonclinical Studies. Clin Cancer Res. 2017; 23:3489–98. https://doi.org/10.1158/1078-0432.CCR-16-3083.
49. Wahdan-Alaswad R, Fan Z, Edgerton SM, Liu B, Deng XS, Arnadottir SS, Richer JK, Anderson SM, Thor AD. Glucose promotes breast cancer aggression and reduces metformin efficacy. Cell Cycle. 2013; 12:3759–69. https://doi.org/10.4161/cc.26641.
50. Wu YL, Lee JS, Thongprasert S, Yu CJ, Zhang L, Ladrera G, Srimuninnimit V, Sriuranpong V, Sandoval-Tan J, Zhu Y, Liao M, Zhou C, Pan H, et al. Intercalated combination of chemotherapy and erlotinib for patients with advanced stage non-small-cell lung cancer (FASTACT-2): a randomised, double-blind trial. Lancet Oncol. 2013; 14:777–86. https://doi.org/10.1016/S1470-2045(13)70254-7.