
INTRODUCTION
Continuous and rapid advances in tumor biology, drug discovery and immunotherapy are accelerating the adoption of precision oncology. There is a growing arsenal of targeted therapeutics that disrupt oncogenes and modulate dysregulated molecular pathways [1]. Additionally, a growing subclass of molecularly targeted immunotherapeutics has developed to either stimulate or reduce the inhibition of cytotoxic T-cells [2–4]. Adoptive T-cell engineering, including chimeric antigen receptor T-cells (CAR-T), is being used to precisely target cancer cells that express specific antigens [5, 6]. Oncolytic viruses are also being engineered to target molecular states of tumor cells [7]. This rapid pace of development has led to a large menu of genomic and transcriptomic alterations that are potentially clinically-relevant for each individual patient. Therefore, well-designed genomic and transcriptomic sequencing panels are necessary for clinical testing [1].
We previously presented the Tempus xO assay, a next generation sequencing (NGS)-based oncology assay that interrogates 1,711 cancer-related genes in matched tumor and normal tissue with whole transcriptome RNA sequencing (RNA-seq) for gene rearrangement detection [8]. We now present the Tempus xT assay, a more focused targeted oncology panel using hybrid capture NGS to interrogate a refined list of 595 genes (Table 1), including solid tumor and hematologic malignancy targets selected through extensive review of recent literature and oncogenic pathway analysis (see Methods). The assay also includes a combination of whole transcriptome RNA-Seq and targeted DNA tiling probes (Table 2) for comprehensive gene rearrangement detection, as well as microsatellite instability (MSI) testing. In addition to the clinical testing function of the assay, the DNA- and RNA-seq assay components support a combination of research and clinical tools for the evaluation of tumor immunity status, including HLA typing, neoantigen prediction, DNA repair gene analysis, MSI status, tumor mutational burden, and immune cell typing and expression.
Table 1: xT gene list
Table 2: DNA gene rearrangement regions
Gene |
xT DNA-seq detected regions |
|---|---|
ABL1 |
5′UTR, introns 1, 2 |
ALK |
introns 18, 19, 20 |
BCR |
promoter, UTR, introns 1 through 22 |
BRAF |
introns 8, 9, 10 |
EGFR |
introns 23, 24, 25, 26, 27 |
ETV6 |
introns 4, 5 |
EWSRl |
promoter, UTR, introns 1 through 16 |
FGFR2 |
5′UTR, introns 1 through 17 |
FGFR3 |
Full gene |
MYB |
Full gene |
MYC |
Full gene |
NRGl |
introns 3, 5 |
NTRKl |
introns 9, 10, 11, 12, 13, 14, 15, 16 |
NTRK3 |
introns 13, 14 |
PAX8 |
Full gene |
PDGFRA |
intron 11 |
PML |
introns 3, 4, 5, 6, 7, 8 |
RARA |
intron 2 |
RET |
introns 6, 7, 8, 9, 10, 11, 12 |
ROSI |
introns 31, 32, 33, 34, 35, 36, 37, 38, 39 |
TMPRSS2 |
UTR, introns 2, 3, 4, 5 |
RESULTS
We have instituted performance benchmarks to support the clinical use of the xT assay and have assessed analytical sensitivity, specificity, accuracy and precision across the test’s reportable range.
Single nucleotide variant and indel sensitivity, specificity, and limit of detection
In order to determine assay sensitivity for single nucleotide variants (SNVs) in solid tumors, a panel of formalin-fixed, paraffin-embedded (FFPE) clinical tumor samples were sequenced and compared against previously reported results from the Tempus xO assay [8]. There were 487 unique SNVs previously detected in the tumor samples, with variant allele fractions (VAFs) from 5% to 100% (median 25.9%). All but four variants were detected in both assays, resulting in a SNV sensitivity of 99.1% (354/357). To categorize sensitivity at low VAFs, reference standards containing variants between 1-30% VAF were used (Horizon Diagnostics, Columbus, GA). This comparison showed a sensitivity of 96.9% (126/130).
Specificity was calculated as the number of bases identified as negative for variation by both the xT assay and orthogonal methodology, divided by the total number of bases called negative by the assay. A total of two false positives were observed resulting in a specificity of >99.9%, with a positive predictive value (PPV) of 99.5% (347/349). The overall precision of the assay was calculated as 97.2%, with a slight dependency on base fraction at the lower limit of detection (LOD) (Figure 1A, 1B). Additionally, the correlation of VAF measurements between the xT and xO assays was determined by measuring the correlation coefficient (Figure 1C, 1D). The xT assay shows high concordance in base fractions (r2 = 0.971 for indels, r2 = 0.921 for SNVs) with the xO assay at all ranges of performance.
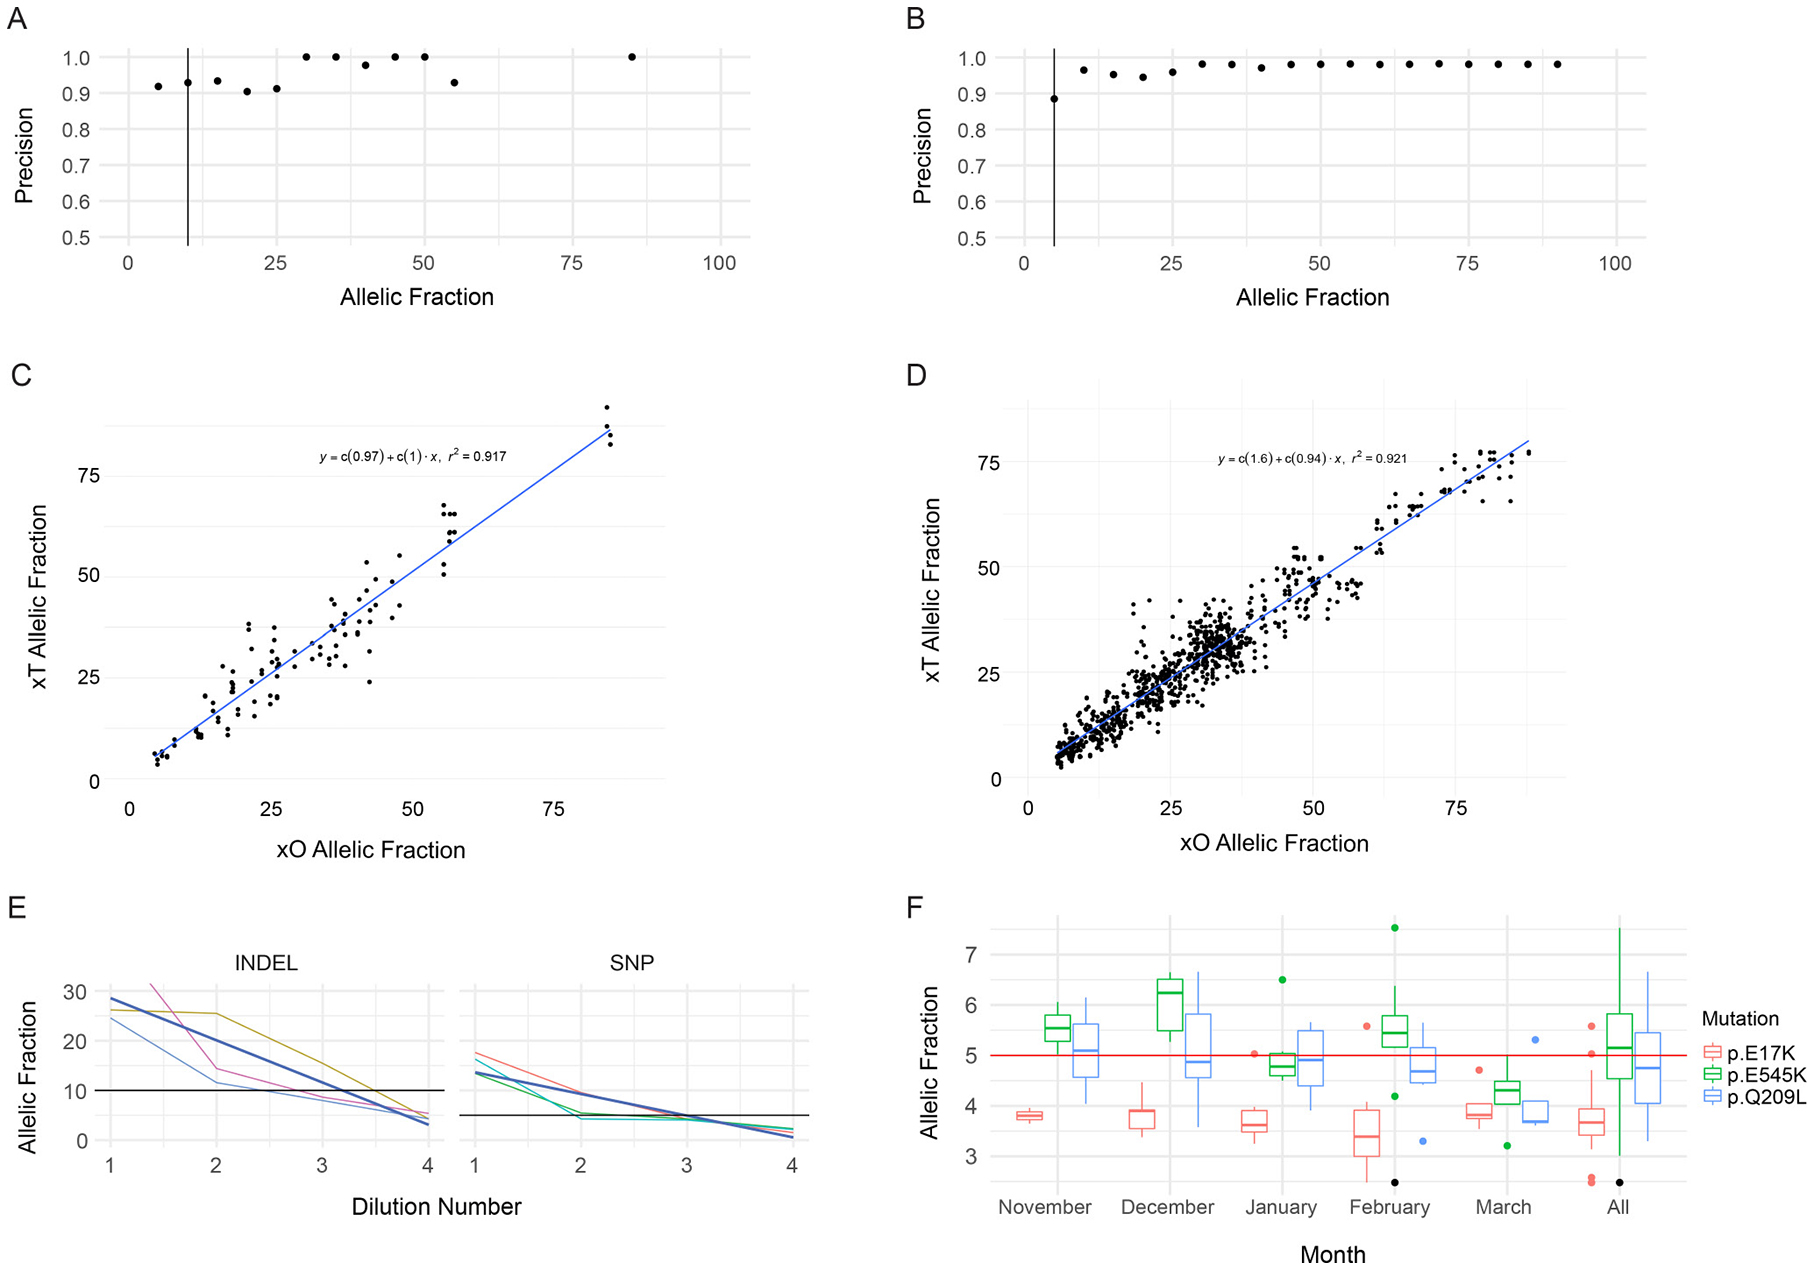
Figure 1: Performance of SNV and Indel Detection by the Tempus xT assay. (A) Precision of indel detection by VAF. Precision was calculated for each bin of variants with allele fractions rounded to the nearest 5 percent. The vertical black line corresponds to the LOD. (B) Precision of SNV detection by VAF, as in A. (C) Correlation of xT assay indel VAFs to xO assay indel VAFs. (D) Correlation of xT assay SNV VAFs to xO assay SNV VAFs. (E) VAFs of indels and SNVs detected on chromosome 17 in four samples with serial 1:1 dilutions of the xT assay. Dark blue lines indicate best fit of a linear model. (F) Positive control detection. Boxplots of the VAF of three SNVs in a positive control sample run on every xT assay over a period of 5 months. The single point marked in black is an AKT1 p.E17K variant which failed filtering criteria.
Serial dilution of tumor samples with matched normal samples was performed to generate variants with base fractions between 25% and 1% VAF. Three variants were detected using dilutions down to 1.4% VAF (1:16 dilution of a 20% variant in the tumor). One mutation was detected down to an allele fraction of 2.1% (1:8 dilution) but not at the 1:16 dilution (Figure 1E). A conservative LOD of 5% was therefore set for SNVs, although we observed consistent detection below that threshold (Figure 1F).
Indels were consistently detected down to 4% VAF (Figure 1E). A conservative LOD of 10% was therefore set for the indels. Fifty indels were called within the xT LOD for 48 samples in the set. Of these 50 indels, 48 were called by xT, and one variant (NOTCH3 p.1317fs) was excluded from analysis due to insufficient coverage on the xT panel. Thus, the final sensitivity calculation was 98.0% (48/49). PPV was calculated using the 49 indels called by the xT assay and their comparison against all xO data. All 49 indels called were concordant with the xO assay. We, therefore, observed a >99.9% PPV for indel detection.
Gene rearrangement and fusion validation
The assay is designed to assess 21 gene rearrangement targets by DNA-seq (Table 2), in addition to comprehensive fusion detection by RNA-seq as previously reported [8]. The reportable range for gene rearrangements by DNA-seq is limited to fusions occurring in the specific regions listed in Table 2. Twenty-seven validation samples (including 23 patient samples and 4 reference standards) with known gene rearrangements were sequenced. Results were compared with the previously validated RNA-seq fusion detection assay [8], and the reference standard results were compared with the manufacturer-provided data sheets. The assay successfully detected 28 of the 29 gene rearrangements within the 27 samples. The DNA-seq translocation detection sensitivity was 96.5% (28/29), with an overall sensitivity of translocation detection, including RNA-seq, of 99.9% (29/29). The overall distribution of reported gene rearrangements by cancer type for the patient cohort sequenced at Tempus Labs is shown in Figure 2A.
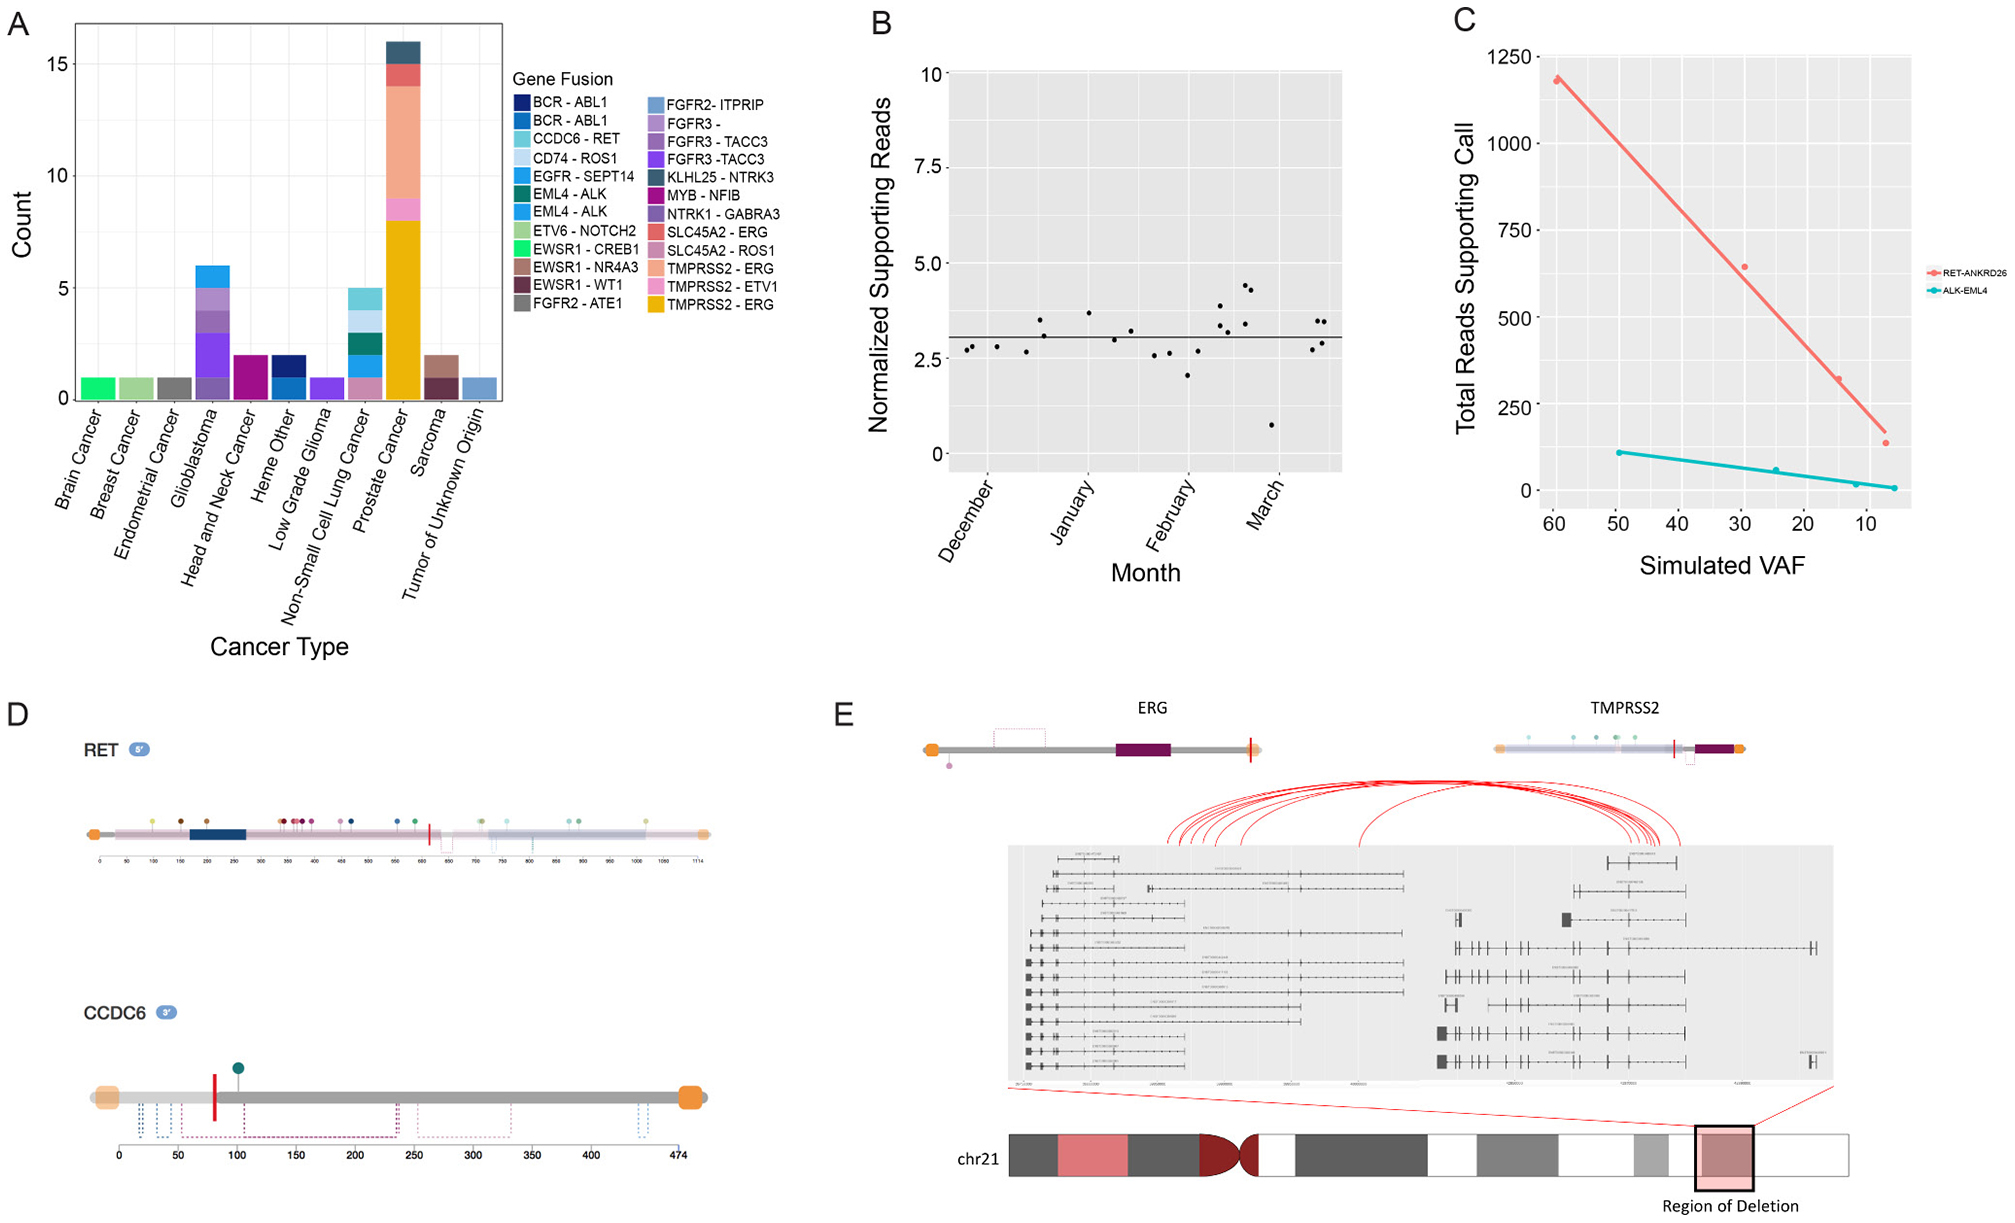
Figure 2: Analysis of rearrangement detection performance by the Tempus pipeline and retrospective analysis of recurrent fusions. (A) Fusions detected by cancer type. (B) Positive control fusion samples (ROS1-SLC34A2) processed by the xT assay over the course of 4 months. The fusion was expected at 5% VAF in the control and was consistently detected across flow cells and instruments. (C) Limit of detection analysis for two serially diluted fusions (ALK-EML4 and RET-ANKRD26). Both fusions were detected down to 3–5% simulated VAF by the Tempus xT Assay. (D) Functional characterization of fusions detected by the xT assay. Domains, regions, and sites are highlighted for orientation along the amino acid sequence for each protein involved in the rearrangement event. (E) Analysis of the recurrent TMPRSS2-ERG fusion found in 13 prostate cancers detected by the xT assay. The xT assay consistently localized breakpoints to the expected functional domains resulting in the TMPRSS2 promoter and replacing the first several exons of ERG by a chromosomal deletion. This results in the functional domains of ERG being largely intact, but under the control of the TMPRSS2 promoter.
Specificity was analyzed with a subset of 13 samples that were assessed for the absence of additional xT reportable fusions. This was calculated as the number of samples (n = 13) multiplied by the number of assayed genomic sites (n = 21) for 273 positions. The xT assay called zero false positive translocations, resulting in a >99.9% specificity. Furthermore, a positive control fusion monitored by Tempus (ROS1-SLC34A2) in the reference standard (HD753, Horizon Diagnostics) was detected 20 out of 20 times (Figure 2B).
To assess the LOD, we used a serial dilution of two known positive control samples (containing ALK-EML4 and ANKRD26-RET, respectively). Samples were diluted from 50-60% VAF in the primary sample to 3-4% VAF (Figure 2C). The gene rearrangements were detected in all experiments, but in the case of the two lowest titrations for ALK-EML4, the number of supporting reads fell below the normal reporting threshold for the assay. A conservative LOD was set at 10% based on the ALK-EML4 detection data. Additionally, we functionally characterized clinically relevant fusions detected via the xT assay, such as RET-CCDC6 and TMPRSS2-ERG fusions (Figure 2D, 2E).
Copy number alterations
Copy number variation (CNV) is particularly difficult to detect in targeted panels. Paired-end mapping strategies typically fail because the majority of CNV breakpoints occur in non-targeted regions [20]. The depth of coverage is the primary metric used to determine copy number, but variable probe affinities, probe balance, and hybridization produce significant coverage variability [21]. This can be corrected by comparing the tumor sample with its matched normal sample and/or a pool of unrelated normal samples. The xT panel design significantly reduces the number of heterozygous SNVs required to make an integrated segmentation call. Accordingly, models used for fitting corrected coverage ratios to potential ploidy and corresponding copy number are selected based not only on goodness-of-fit but also on the resulting genome-wide ploidy state [22]. CNV specificity was assessed as the total number of genes assayed (n = 67 patients, 39 genes each) and the number of false positive detections (n = 3). Specificity was calculated as called negatives/true negatives, resulting in a final specificity of 99.8%. PPV was calculated as the total number of amplification calls made by the xT copy number analysis pipeline (n = 70) versus the number of copy number calls that were correctly identified as amplified (n = 67). This latter analysis was performed using CNVs that were clearly amplified in xO (>9 copies), or those identified as amplified in xT, but moderately amplified (>5 copies) in xO. This resulted in a final PPV of 95.7%. To assess LOD, three samples with CNVs in ERBB2, CDK12, or EGFR were diluted between 50% and 5% tumor purity. In all cases, amplified regions were detected and identified as amplified down to at least 12.5% tumor purity. To allow for the detection of less-heavily amplified genetic regions, a lower LOD was set at 30% tumor purity.
Additionally, the National Institutes of Standards and Technology’s (NIST) RM 2373 (Genomic DNA Standards for HER2 Measurements) was evaluated for CNVs in ERBB2 (HER2). The copy number results for ERBB2 generated by the xT assay were linear (r2=0.97) with respect to the validated copy ratios across the five reference samples (Figure 3A). Furthermore, the amplification call crosses the regression line at an ERBB2 ratio of 2.5. In calling ERBB2 positivity in breast cancers using FISH, an ERBB2 ratio of 2.2 was used to call positivity, closely correlating with the assay threshold for amplification calling. The distribution of CNVs by cancer type for the patient cohort sequenced at Tempus Labs is shown in Figure 3B.
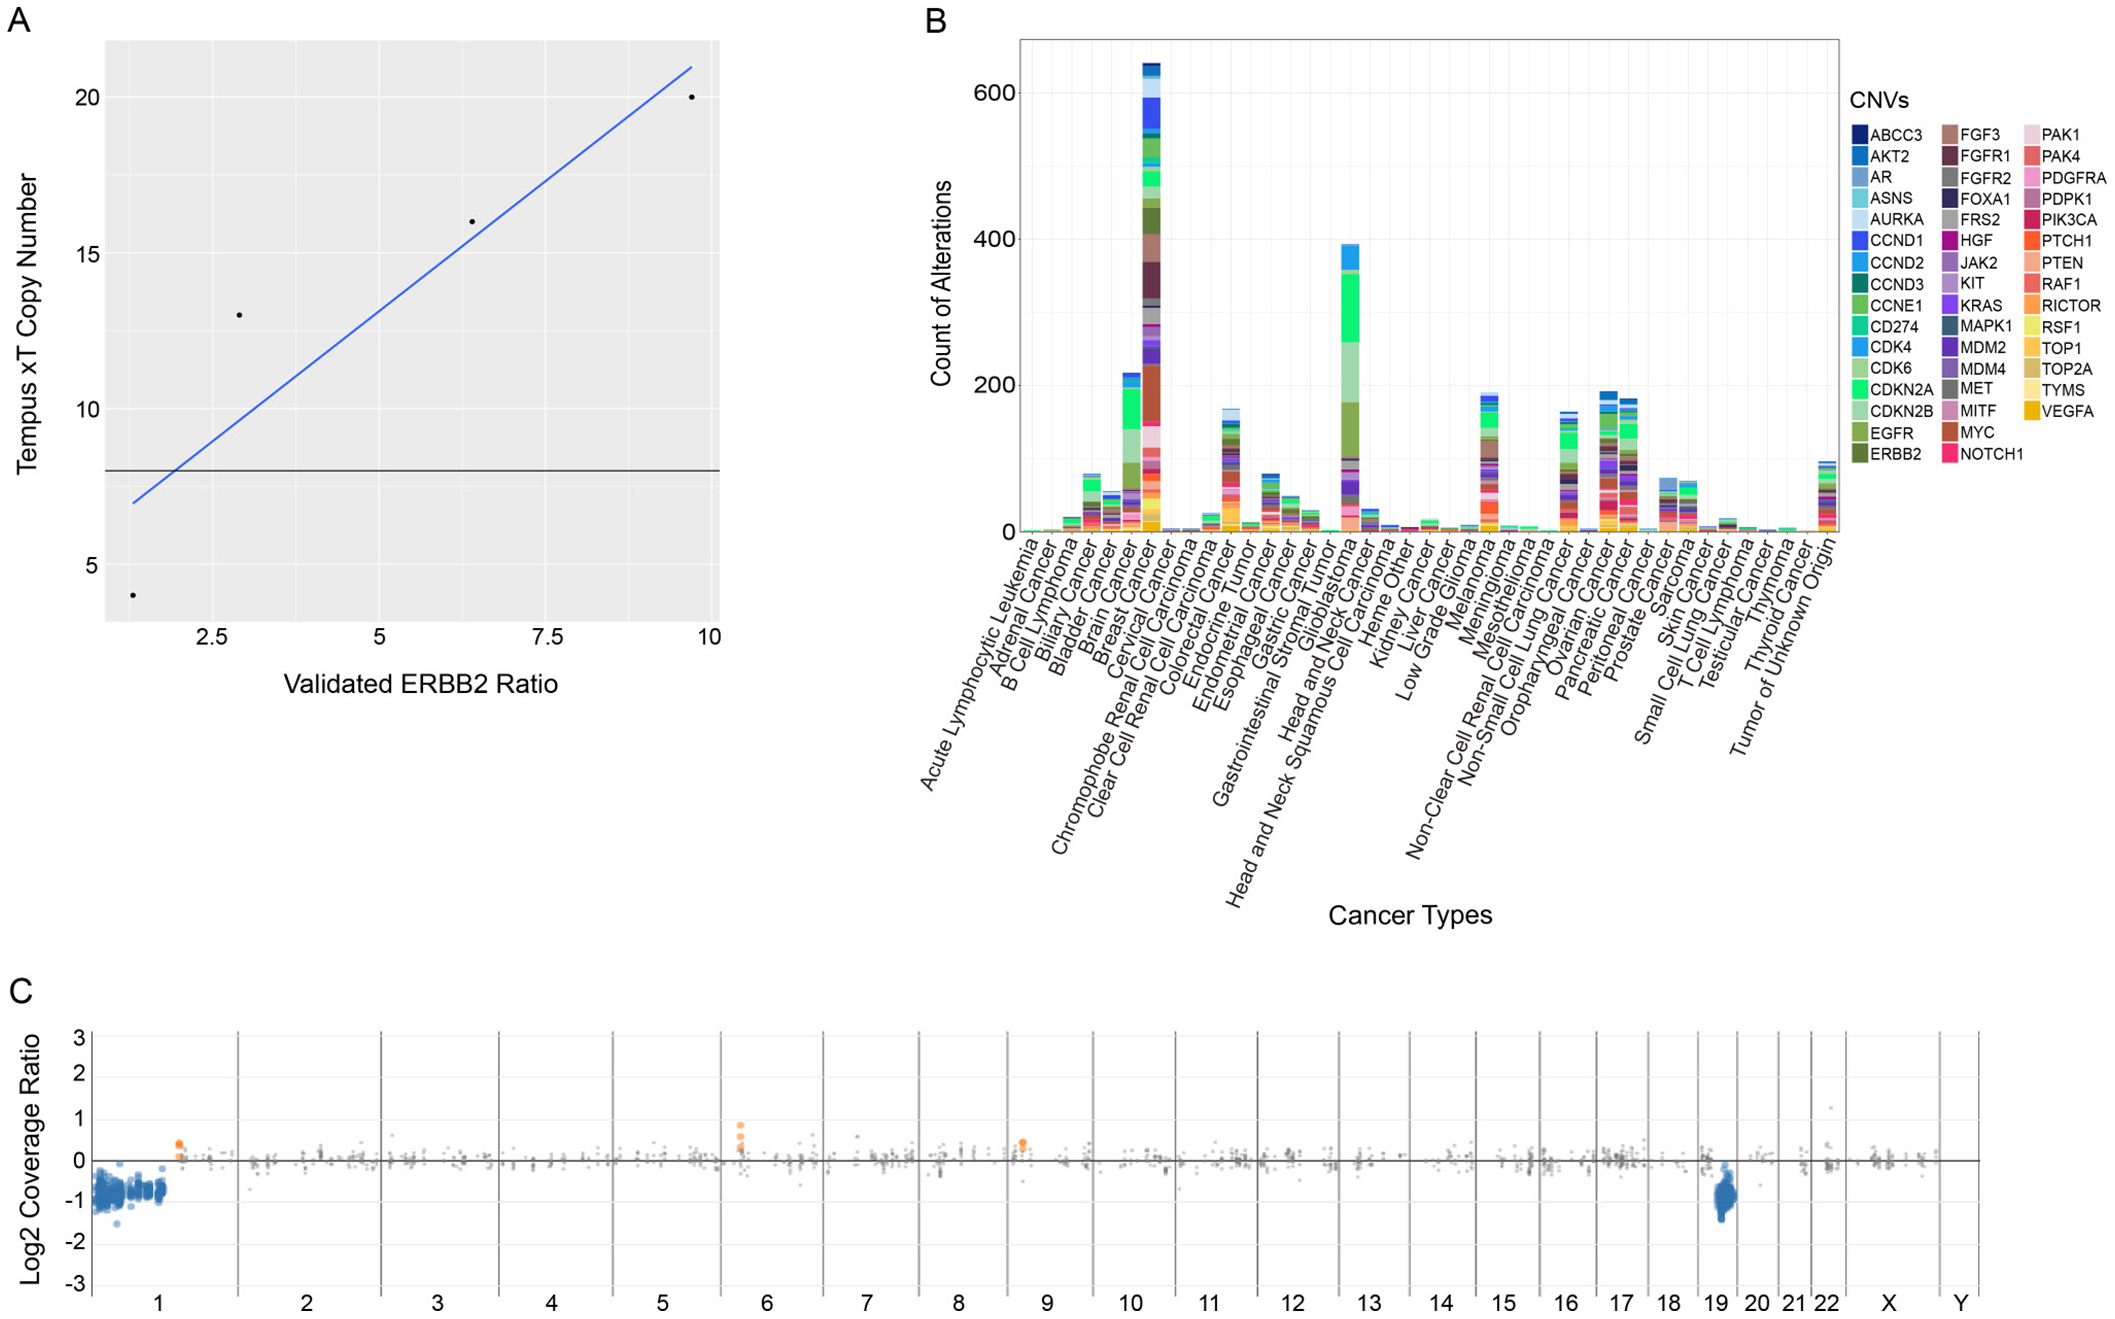
Figure 3: Analysis of performance of the xT assay in the detection of copy number variations. (A) Detection comparison of Tempus copy number calls against validated ERBB2 control ratios. (B) Plot of reported CNVs by cancer type for the xT patient cohort sequenced at Tempus. (C) A representative 1p-19q co-deletion detected commonly in oligodendrogliomas. The blue dots represent genomic regions showing one copy loss while the grey points represent neutral segments.
Finally, large scale genomic alterations were assessed using the xT assay (Figure 3C). Due to the long-range genomic tiling of the xT assay, it was hypothesized that large scale genomic instability might be detectable via chromosome level copy number visualization. For example, in oligodendrogliomas, the xT assay consistently detected the 1p-19q co-deletion, an important diagnostic and prognostic marker. These complex structural alterations were successfully detected with the xT assay although they are not part of the common class of focal alterations reported in the literature from NGS-based tumor profiling methodologies.
Microsatellite instability detection
MSI results from defects in DNA mismatch repair. To validate MSI status determination and evaluate the accuracy of the test, we analyzed samples from 34 patients (14 microsatellite instability-high [MSI-H], 20 microsatellite stable [MSS]). For three MSI-H patients, an additional four samples were generated for LOD testing with a two-fold serial dilution. For two additional MSI-H patients, three replicates were sequenced on the same plate for intra-assay precision and three replicates were sequenced on separate plates for inter-assay precision. The accuracy, precision, and LOD were assayed for tumor-normal paired and tumor-only samples.
The xT MSI assay was validated against an MSI PCR assay using the five marker Bethesda panel (Arup Laboratories, Salt Lake City, UT), a four-protein MMR immunohistochemistry (IHC) panel (Tempus Labs, Chicago, IL), or both. Samples found to be MSI-H by the MSI PCR, or missing expression in at least one protein by the MMR IHC were collectively considered MSI-H. Similarly, samples found to be MSS by the MSI PCR, or with normal MMR protein expression by the MMR IHC were considered MSS. One sample had contradictory MSI PCR and MMR IHC results and was removed from the study. In both paired and unpaired modes, the 14 MSI-H samples were correctly classified as MSI-H and the 20 MSS samples were correctly classified as MSS, thus, the sensitivity of MSI status determination was >99%, the specificity was >99%, and the PPV was >99%.
To establish the LOD, three MSI-H patient DNA samples were serially diluted to determine the minimum tumor fraction necessary to reliably detect MSI-H status. MSI-H status was consistently detected down to approximately 20% tumor in both the paired and unpaired modes. The LOD was conservatively set at 30% tumor.
Immuno-oncology profiling
Immunotherapy has become a key tool for treating a wide range of cancers. A current challenge in the field is the proper identification of patients most likely to benefit from this powerful but expensive therapy that can also have severe side effects [25–28]. In the course of clinical care, TMB, Human Leukocyte Antigen (HLA) type, neoantigen load, and MSI status were calculated in order to evaluate the benefits of immunotherapy. HLA genes are involved in the presentation of self- and foreign peptides to T cells. Specific HLA alleles are associated with serious pharmacological counter-indications, eligibility for clinical trials, and increased probability of response or non-response to checkpoint therapy. HLA typing is also a prerequisite for neoantigen prediction. We assessed the accuracy and sensitivity of in silico HLA typing on a set of 72 known reference samples obtained directly from the International Histocompatibility Working Group in Seattle, WA (www.ihwg.org). For reference samples sequenced on the xT panel, class I HLA typing was 99.8% accurate at the two-digit resolution and 96.6% accurate at the four-digit resolution (Supplementary Table 1). Sequencing was also sensitive for alleles associated with pharmacological counter-indications and alleles used for inclusion and exclusion criteria in immunotherapy clinical trials (Supplementary Tables 2–3).
TMB and MSI status was assessed in 806 clinical samples spanning more than 28 different cancer types (Figure 4). While predictive power varied with cancer type, the xT assay TMB scoring recapitulated disease-specific TMB estimates previously reported in the literature [29] (Figure 4A). One of the most well characterized mechanistic drivers of high TMB is MSI-H status. The xT MSI assay showed that MSI-H tumors accounted for 26.6% of tumors in the top decile of TMB, with MSI-H status significantly associated with high TMB (p = 8.72e–26, hypergeometric test). In MSI-H cases, alterations were frequently found in genes encoding DNA mismatch repair (MMR) proteins (MLH1, PMS2, MSH2, and MSH6). In a number of cases where no genetic alterations were found, we were able to detect MLH1 silencing based on reduced RNA expression. The assay also detected an enrichment of alterations in known DNA repair genes, including WRN, RAD50, PMS1, MUTYH, BRCA1, BRCA2, BLM, and ATM (Figure 4B).
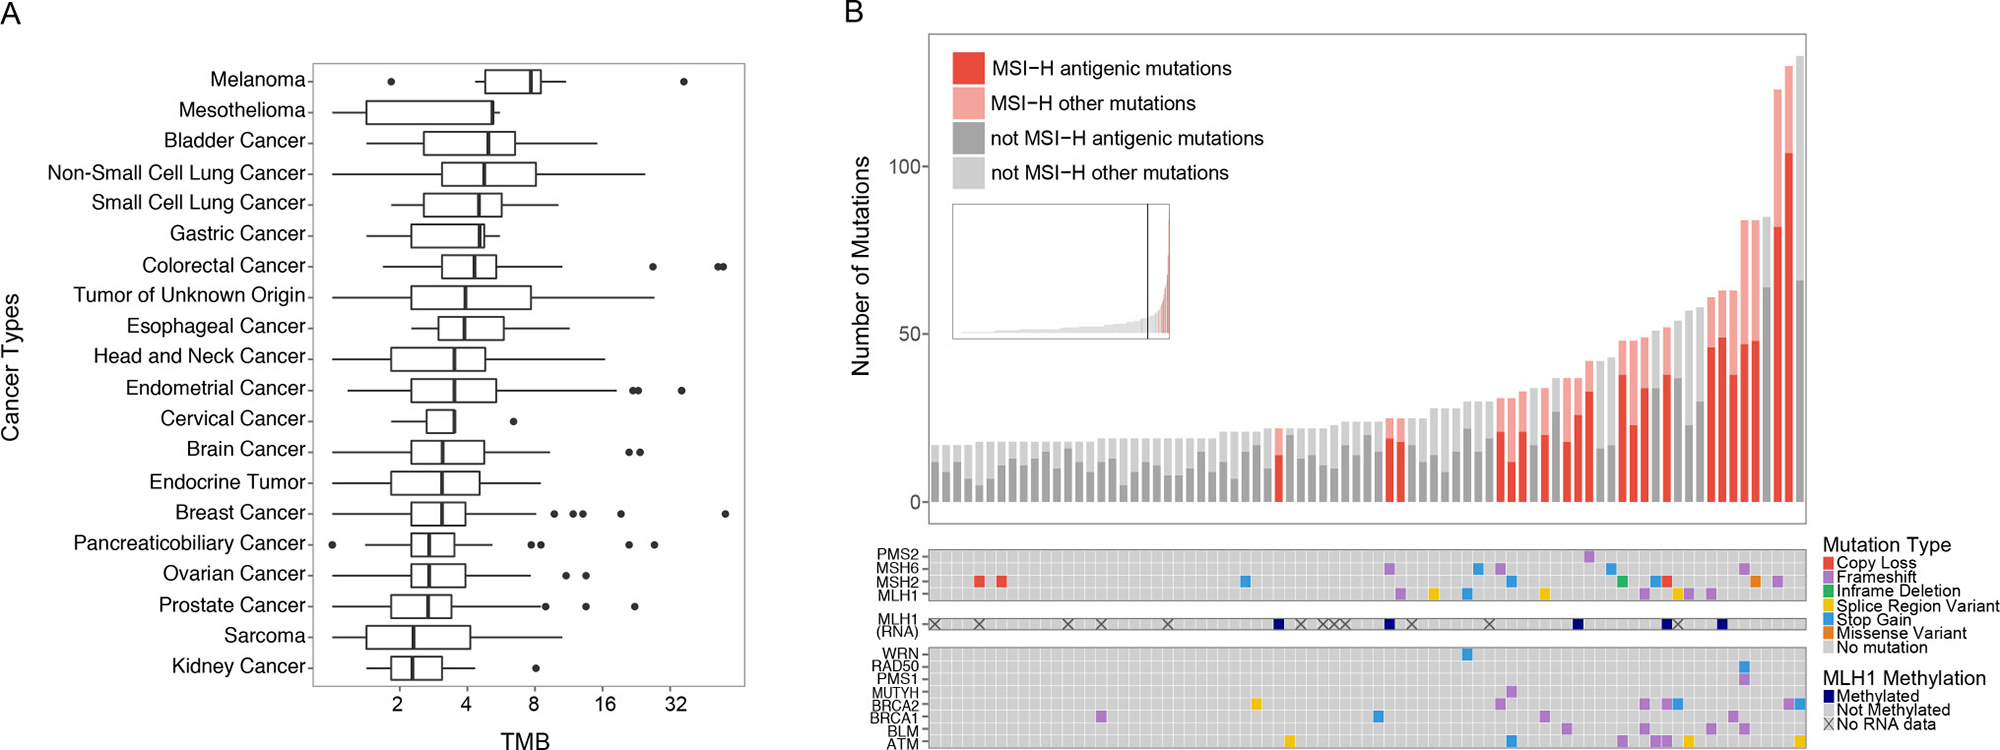
Figure 4: Survey of immunotherapy markers across diverse cancer types. (A) The distribution of TMB for each cancer type plotted on a log2 scale and ordered by the median TMB. Outliers (data points beyond 1.5x interquartile range) are shown as individual points. (B) Analysis of samples in the top 10th percentile of TMB. The inset shows the distribution of TMB across all samples included in the study, with the vertical bar marking the 90th percentile of TMB. The bar chart shows the proportion of predicted antigenic mutations of the non-synonymous mutations detected. MSI-H samples are highlighted in red. The color-coded matrices show the MMR gene mutations detected by mutation type (top), predicted MLH1 methylation status (middle), and DNA repair gene mutations detected (bottom).
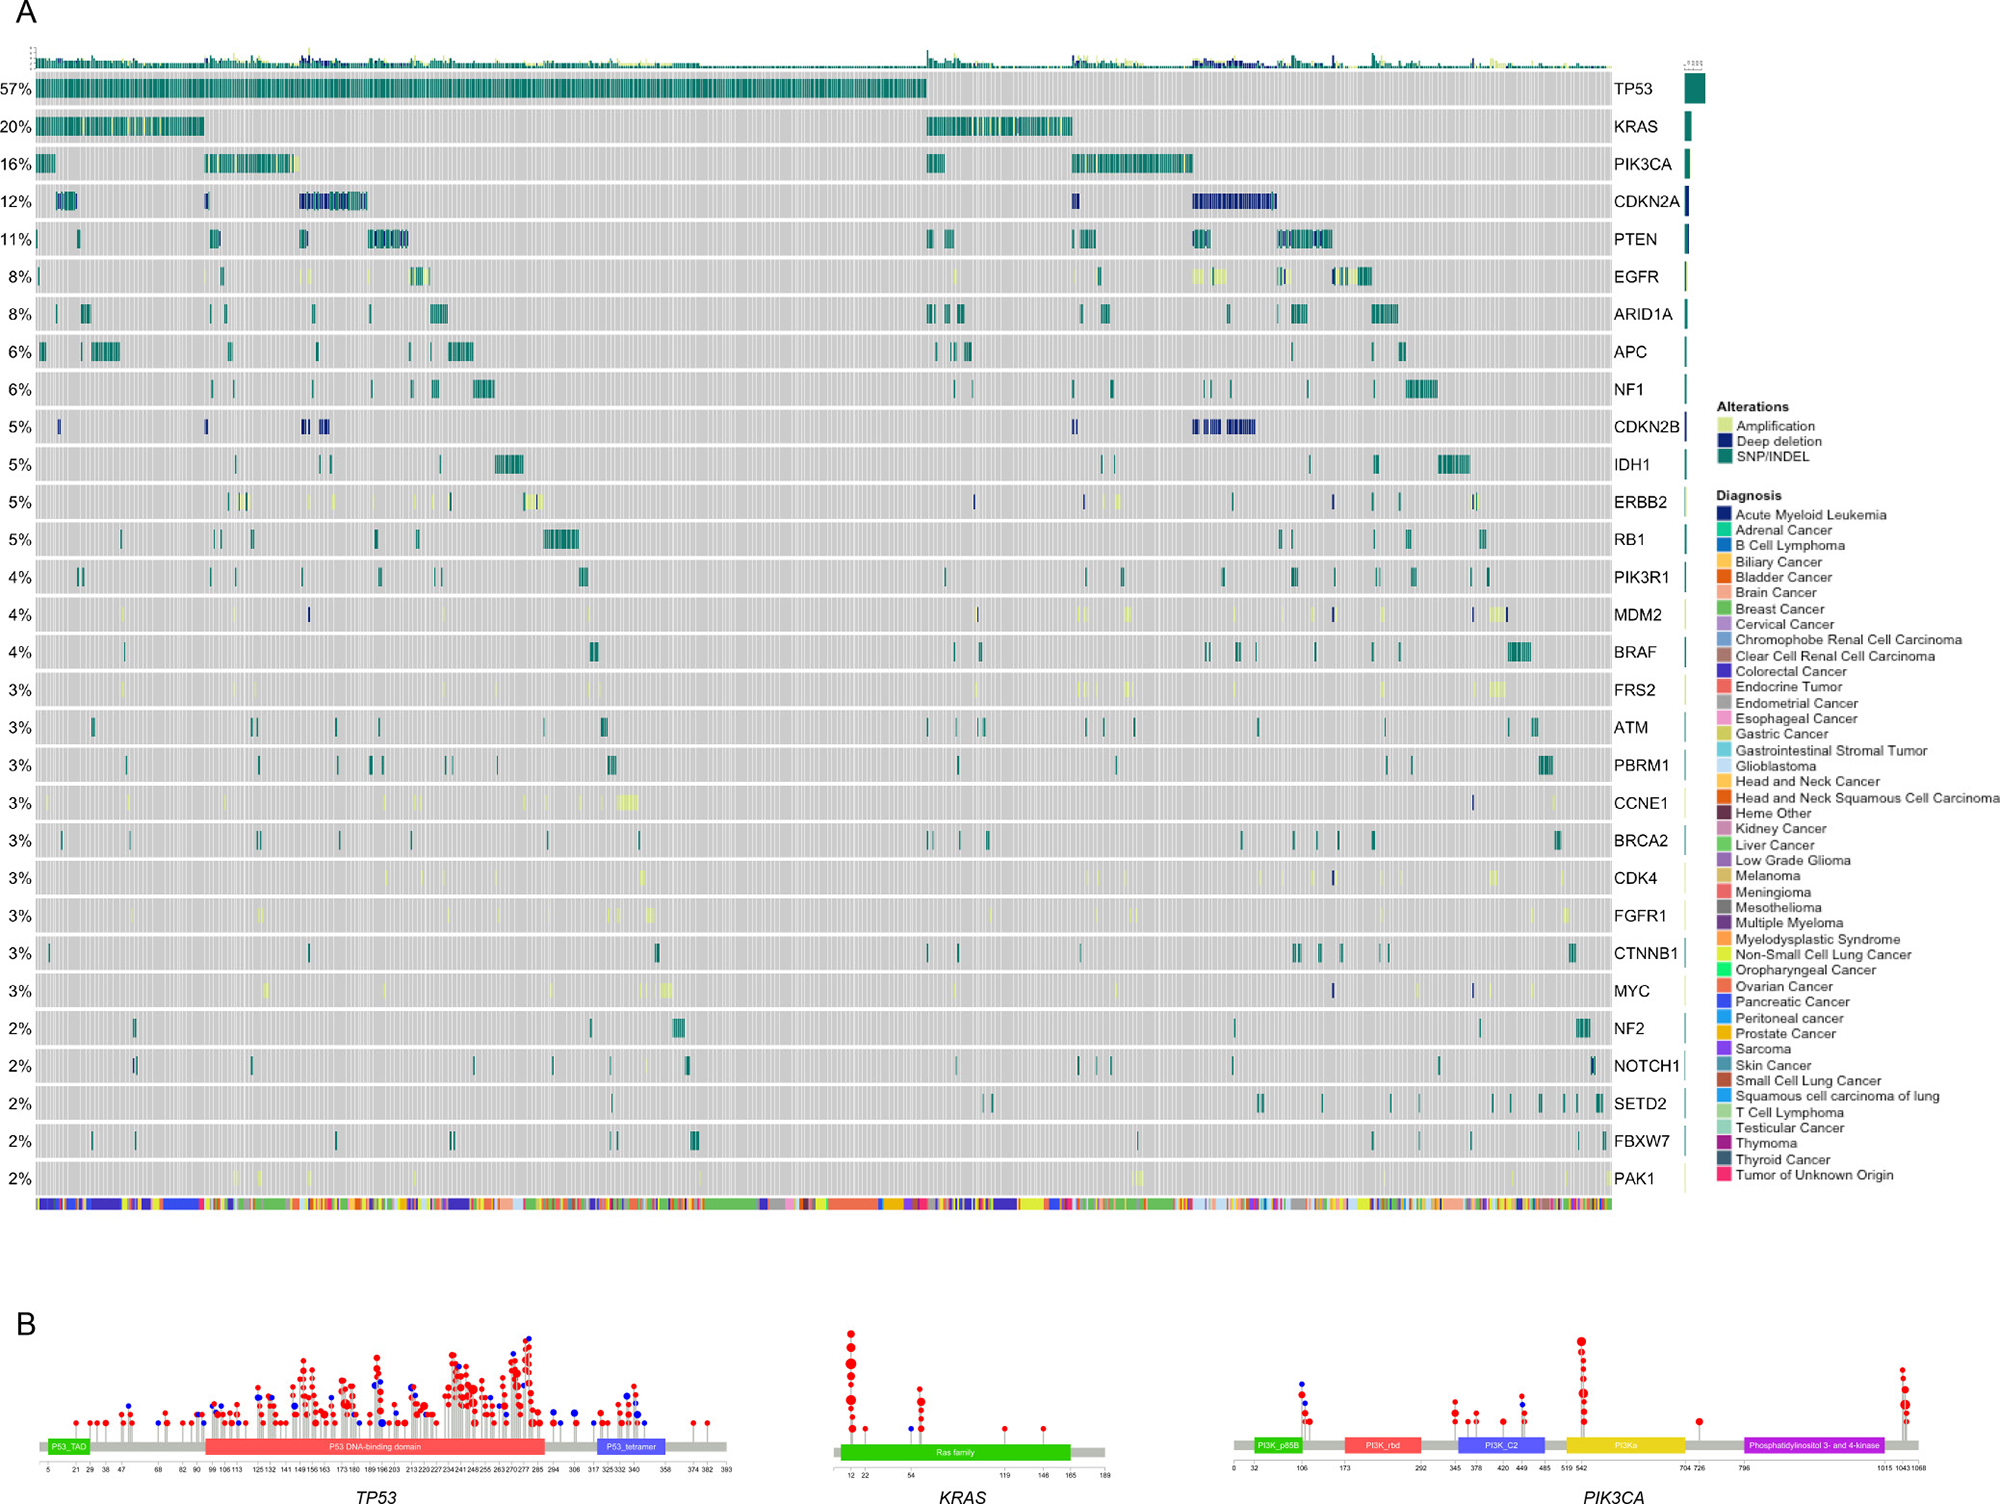
Figure 5: Mutational landscape across all cancer types. (A) Plot of a subset of patients within the Tempus xT cohort containing at least one biologically relevant alteration, stratified by alteration prevalence. Patients were clustered by the mutational profile similarity of genes (y-axis) with at least 5 actionable alterations detected within the cohort. Patient cancer type is displayed by the colored bar below the matrix. (B) Lollipop plot of TP53, KRAS, and PIK3CA alterations detected by the xT assay across all cancer types.
Pan-cancer molecular profiling
We next analyzed the landscape of genomic alterations in 1074 clinical samples assayed with the xT panel. A subset of samples was optimized to appropriately represent the percentages of cancer types seen in clinical care sites serviced by Tempus Labs. These data were then compared against large-scale genomic profiling efforts [23, 24] to assess the clinical validity of the assay. Within the Tempus cohort, 952 samples contained at least one biologically relevant alteration (88.6%), which was defined as an alteration associated with pathogenicity based on literature, databases, or in silico reviews. The evidence for biological relevance ranges from alterations addressed by the National Comprehensive Cancer Network (NCCN) guidelines with FDA-approved therapeutic interventions, through on and off tissue clinical research, down to preclinical evidence with or without clinical trial eligibility. Within the 952 patients, the most prevalent alterations across cancer types were the tumor suppressor TP53 (57%) and the oncogene KRAS (20%) (Figure 5A). Along with these highly prevalent alterations known to be present in an array of cancer types, there were many canonical oncogenic pathway mutations detected, including gain of function mutations in oncogenes (EGFR 11%, PIK3CA 16%) and loss of function mutations in tumor suppressor genes (PTEN 11%, ARID1A 8%, APC 6%) [37, 38, 41]. Furthermore, the localization of variants in recurrently mutated genes showed a strong correlation across cancer types (Figure 5B), indicating consistent functional mechanisms for oncogenicity as expected from previous pan-cancer studies [24].
DISCUSSION
Molecularly targeted therapies, including immunotherapy, are providing better treatment options for cancer patients. To fully utilize these advances, patients must undergo broad molecular tumor profiling for optimal, personalized treatment selection [1]. According to NCCN guidelines, therapy targeted towards specific molecular alterations is already a standard of care in several tumor types, including melanoma, colorectal cancer, and non-small cell lung cancer. These few, well-known mutations could be detected with individual assays or small NGS panels. However, for the largest number of patients to benefit from personalized oncology, molecular alterations that can be targeted with off-label drug indications, combination therapy, or tissue agnostic immunotherapy should be assessed [30–32]. Large-panel NGS assays also cast a wider net for clinical trial enrollment [33, 34]. Recent studies indicate that clinical care is guided by NGS assay results for 30-40% of patients who receive such testing [35–38].
We have developed a hybrid capture NGS-based assay to accurately detect clinically relevant alterations across 595 genes that are carefully curated to address solid tumors and hematologic malignancies, plus perform genome-wide unbiased fusion detection. The assay inputs include FFPE tissue, blood or bone marrow tumor specimens, and blood or saliva for germline testing. This assay is unique in its use of matched tumor and normal DNA plus whole transcriptome RNA-seq to provide a comprehensive overview of somatic genomic alterations, including MSI status for targeted cancer therapy, immuno-oncology, and clinical trial enrollment. The test was validated by multiple testing modalities, including a comparison of patient samples to reference assays and pooled cell-line models spanning key determinants of detection accuracy for somatic alterations such as VAF, indel length, the degree of stromal admixture, and amplitude of CNV.
Large NGS panels optimize targeted therapy options because they reveal a wide range of genomic alterations and can be used when working with small FFPE tissue samples. Additionally, broad-based NGS genomic profiling enables patients with rare genomic alterations to be identified for clinical trials. The Tempus xT assay provides the opportunity to deep screen known actionable gene variants and a broad set of biologically relevant cancer-related genes on a clinically validated platform with a relatively rapid turnaround time.
MATERIALS AND METHODS
xT assay gene selection
Genes were selected for the xT assay based on recommendations from major professional oncology-related societies, including the National Comprehensive Cancer Network (NCCN), the Association for Molecular Pathology (AMP), the College of American Pathologists (CAP), and the American College of Medical Genetics and Genomics (ACMG). An extensive literature review was conducted to include the addition of genes from known oncogenic pathways, particularly those covered in The Cancer Genome Atlas (TCGA) analysis of oncogenic signaling pathways [41]. In this publication, 89% of the 9,125 tumors analyzed contained at least one driver alteration in one of the 10 canonical pathways. Thus, these genes alone account for a substantial number of driver mutations across cancer types. Next, genes from DNA repair, chromatin remodeling, splicing, ubiquitination, and metabolic pathways were included in the assay. Genes associated with treatment resistance and cancer predisposition, including all cancer-associated genes listed as incidental findings by the ACMG, were also included. Additionally, the intronic regions of 21 key genes that undergo clinically relevant gene rearrangements were included for robust fusion detection. Finally, the gene list was reviewed for completeness by experts familiar with the literature and current medical practices for all major tumor types.
Sample processing and nucleic acid extraction
A total of 265 patient samples were processed and used in the validation of this study. Normal blood samples were collected in PAXgene Blood DNA Tubes (Catalog #761115) and saliva samples were collected in Oragene DNA Saliva Kits (Catalog #OG-510). Germline (“normal”) DNA was extracted from either 650μl of saliva or 200 μl of blood. After expert pathologist assessment of overall tumor amount and percent tumor cellularity as a ratio of tumor to normal nuclei met a 20% threshold, solid tumor total nucleic acid was extracted from macrodissected FFPE tissue sections and digested by proteinase K. RNA was purified from the total nucleic acid by DNase-I digestion.
Hematologic malignancy samples were collected in EDTA collection tubes. We examined a set of samples collected at Rush University Medical Center (RUMC) that were also analyzed with a Genoptix Myeloid Molecular Panel (Carlsbad, CA) at RUMC. A subset of samples was also sent to Mayo Medical Laboratories (Rochester, MN) for additional testing with a 33 gene hematologic profiling panel.
DNA and RNA library construction and sequencing
DNA and RNA sequencing was performed as previously described [8]. Briefly, 100 nanograms (ng) of DNA for each tumor and normal sample was mechanically sheared to an average size of 200 base pairs (bp) using a Covaris ultrasonicator. DNA libraries were prepared using the KAPA Hyper Prep Kit, hybridized to the xT probe set, and amplified with the KAPA HiFi HotStart ReadyMix. One hundred ng of RNA for each tumor sample was heat fragmented in the presence of magnesium to an average size of 200 bp. Library preps were hybridized with the IDT xGEN Exome Research Panel and target recovery was performed using Streptavidin-coated beads, followed by amplification with the KAPA HiFi Library Amplification Kit. The amplified target-captured DNA tumor libraries were sequenced to an average unique on target depth of 500x on an Illumina HiSeq 4000. Samples were further assessed for uniformity with each sample required to have 95% of all targeted bp sequenced to a minimum depth of 300x.
Detection of somatic variants by the xT assay
Tumor and normal FASTQ files were matched to their appropriate pair. FASTQ files were analyzed using FASTQC for rapid assessment of quality control and aligned with Novoalign (Novocraft, Inc.). The SAM files were converted to BAM, BAM files were sorted, and duplicates were marked. Following alignment and sorting, SNVs were called. To assess copy number, de-duplicated BAM files and a VCF generated from the variant calling pipeline were processed for computation of read depth and variation in heterozygous germline SNVs between the tumor and normal samples (or between the tumor sample and a pool of process matched normal controls for tumor-only cases). Circular binary segmentation [9] was applied and segments were selected with highly differential log2 ratios between the tumor and its comparator. Approximate integer copy number was then assessed from a combination of differential coverage in segmented regions and an estimate of stromal admixture generated by analysis of heterozygous germline SNVs.
Detection and visualization of gene rearrangements by the xT assay
Following de-multiplexing, tumor FASTQ files were aligned against the human reference genome using BWA for DNA files, or aligned to GRCh38 using STAR for RNA files [10, 39]. Raw RNA read counts were then normalized to correct for GC content and gene length using full quantile normalization and adjusted for sequencing depth via the size factor method. DNA reads were sorted and duplicates were marked with SAMBlaster [40]. Discordant and split reads were further identified and separated. These data were then read into LUMPY [11] for structural variant detection. Structural alterations were grouped by type, recurrence, and presence within the Tempus database and displayed through the Tempus quality control application (TSQC) fusion tool. The TSQC fusion viewer referenced Ensembl to determine the gene and proximal exons surrounding the breakpoint for any possible transcript generated across the breakpoint. It then placed the breakpoint 5’ or 3’ to the subsequent exon in the direction of transcription. For inversions, this orientation was reversed for the inverted gene. After positioning of the breakpoint, the translated amino acid sequences were generated for both genes in the chimeric protein, and a plot was generated containing the remaining functional domains for each as returned from Uniprot [12] (Figure 2D, 2E).
Variant classification and reporting
Variants were investigated following criteria from known evolutionary models, functional data, clinical data, and literature. Variants were then prioritized and classified based on known gene-disease relationships, hotspot regions within genes, internal and external somatic databases, primary literature, and other features of somatic drivers [13, 14, 15]. Variants were reported based on recommendations from the AMP/ASCO/CAP guidelines [16]. Briefly, pathogenic variants with therapeutic, diagnostic, or prognostic significance were prioritized in the report. Non-actionable pathogenic variants were included as biologically relevant, followed by variants of uncertain significance. Translocations were reported based on features of known gene fusions, relevant breakpoints, and biological relevance. Evidence was curated from outside sources and presented as 1) consensus guidelines 2) clinical research, or 3) case studies, with a link to the supporting literature. Germline alterations were reported as secondary findings in a subset of genes for consenting patients. These include genes recommended by the ACMG [17] and additional genes associated with cancer predisposition or drug resistance.
Microsatellite instability status
We developed probes for 43 microsatellite regions for the xT assay. The MSI classification algorithm classifies tumors into three categories: microsatellite instability-high (MSI-H), microsatellite stable (MSS), or microsatellite equivocal (MSE). MSI testing for paired tumor-normal patients used reads mapped to the microsatellite loci with at least five bp flanking the microsatellite. The identification of at least 30 mapping reads in both tumor and normal samples were required for the locus to be included in the analysis. At least 20 of the 43 microsatellites on the panel were required to reach the minimum coverage. Each locus was individually tested for instability, as measured by changes in the number of repeats in tumor data compared to normal data, using the Kolmogorov-Smirnov test. If p ≤ 0.05, the locus was considered unstable. The proportion of unstable microsatellite loci was fed into a logistic regression classifier trained on samples from the TCGA colorectal and endometrial cohorts, which have clinically determined MSI statuses. For MSI testing in tumor-only mode, the mean and variance for the number of repeats were calculated for each microsatellite locus. A vector containing the mean and variance data was put into a support vector machine classification algorithm. Both algorithms returned the probability of the patient being MSI-H. If there was a >70% probability of MSI-H status, the sample was classified as MSI-H. If there was between a 30-70% probability of MSI-H status, the test results were too ambiguous to interpret and those samples were classified as MSE. If there was a <30% probability of MSI-H status, the sample was considered MSS.
Tumor mutational burden
TMB was calculated by dividing the number of non-synonymous mutations by the megabase size of the panel (2.4 MB). All non-silent somatic coding mutations, including missense, indel, and stop-loss variants, with coverage >100x and an allelic fraction >5% were counted as non-synonymous mutations. A TMB >9 mutations per million bp of DNA was considered “high”. This threshold was established by hypergeometric testing for the enrichment of tumors with orthogonally defined hypermutation (MSI-H) in the larger Tempus clinical database.
HLA typing
HLA class I typing was performed using Optitype on DNA sequencing including class I HLA-mapped reads and unmapped reads [18]. Normal samples were used as the default reference for matched tumor-normal samples. Tumor sample-determined HLA type was used when the normal sample did not meet internal HLA coverage thresholds, or there was no matched normal sample.
Neoantigen prediction
Neoantigen prediction was performed on all non-silent mutations. The binding affinities for all possible 8-11 amino acid (aa) peptides containing the mutation were predicted using MHCflurry [19]. For alleles with insufficient training data to generate an allele-specific MHCflurry model, binding affinities were predicted from the nearest HLA allele as assessed by aa homology. A mutation was determined to be antigenic if any resulting peptide was predicted to bind to any of the patient’s HLA alleles with <500 nM affinity.
ACKNOWLEDGMENTS
We thank the clinical lab personnel for sample collection and processing, as well as the operations, product, engineering, and clinical data teams. We thank Dr. Alexandria Bobe for critical review of the entire manuscript and Matthew Kase for proofreading the manuscript. We also thank Bri Santacaterina and Anna Sheals for help with assembly of the figures.
CONFLICTS OF INTEREST
All authors have a financial relationship as employees of Tempus Labs, Inc.
REFERENCES
1. Kumar-Sinha C, Chinnaiyan AM. Precision oncology in the age of integrative genomics. Nat Biotechnol. 2018; 36:46–60.
2. Brahmer JR, Tykodi SS, Chow LQ, Hwu WJ, Topalian SL, Hwu P, Drake CG, Camacho LH, Kauh J, Odunsi K, Pitot HC, Hamid O, Bhatia S, et al. Safety and activity of anti-PD-L1 antibody in patients with advanced cancer. N Engl J Med. 2012; 366:2455–2465.
3. Hodi FS, O’Day SJ, McDermott DF, Weber RW, Sosman JA, Haanen JB, Gonzalez R, Robert C, Schadendorf D, Hassel JC, Akerley W, van den Eertwegh AJ, Lutzky J, et al. Improved survival with ipilimumab in patients with metastatic melanoma. N Engl J Med. 2010; 363:711–723.
4. Motzer RJ, Tannir NM, McDermott DF, Arén Frontera O, Melichar B, Choueiri TK, Plimack ER, Barthélémy P, Porta C, George S, Powles T, Donskov F, Neiman V, et al, and CheckMate 214 Investigators. Nivolumab plus Ipilimumab versus Sunitinib in Advanced Renal-Cell Carcinoma. N Engl J Med. 2018; 378:1277–1290.
5. Tran E, Robbins PF, Lu YC, Prickett TD, Gartner JJ, Jia L, Pasetto A, Zheng Z, Ray S, Groh EM, Kriley IR, Rosenberg SA. T-Cell Transfer Therapy Targeting Mutant KRAS in Cancer. N Engl J Med. 2016; 375:2255–2262.
6. Maude SL, Laetsch TW, Buechner J, Rives S, Boyer M, Bittencourt H, Bader P, Verneris MR, Stefanski HE, Myers GD, Qayed M, De Moerloose B, Hiramatsu H, et al. Tisagenlecleucel in Children and Young Adults with B-Cell Lymphoblastic Leukemia. N Engl J Med. 2018; 378:439–448.
7. Bommareddy PK, Patel A, Hossain S, Kaufman HL. Talimogene Laherparepvec (T-VEC) and Other Oncolytic Viruses for the Treatment of Melanoma. AM J Clin Dermatol. 2017; 18:1–15.
8. Beaubier N, Tell R, Huether R, Bontrager M, Bush S, Parsons J, Shah K, Baker T, Selkov G, Taxter T, Thomas A, Bettis S, Khan A, et al. Clinical validation of the Tempus xO assay. Oncotarget. 2018; 9:25826–32. https://doi.org/10.18632/oncotarget.25381.
9. Olshen A, Venkatraman ES, Lucito R, Wigler M. Circular binary segmentation for the analysis of array-based DNA copy number data. Biostatistics. 2004; 5:557–572.
10. Li H, Durbin R. Fast and accurate short read alignment with Burrows-Wheeler transform. Bioinformatics. 2009; 25:1754–60.
11. Layer RM, Chiang C, Quinlan AR, Hall IM. LUMPY: a probabilistic framework for structural variant discovery. Genome Biol. 2014; 15:R84.
12. Chiang C, Layer RM, Faust GG, Lindberg MR, Rose DB, Garrison EP, Marth GT, Quinlan AR, Hall IM. SpeedSeq: ultra-fast personal genome analysis and interpretation. Nat Methods. 2015; 12:966–968.
13. Buell CR, Yuan Q, Ouyang S, Liu J, Zhu W, Wang A, Maiti R, Haas B, Wortman J, Pertea M, Jones KM, Kim M, Overton L, et al. Sequence, annotation, and analysis of synteny between rice chromosome 3 and diverged grass species. Genome Res. 2005; 15:1284–1291.
14. Dienstmann R, Dong F, Borger D, Dias-Santagata D, Ellisen LW, Le LP, Iafrate AJ. Standardized decision support in next generation sequencing reports of somatic cancer variants. Mol Oncol. 2014; 8:859–873.
15. Ritter DI, Roychowdhury S, Roy A, Rao S, Landrum MJ, Sonin D, Shekar M, Davis CF, Hart RK, Micheel C, Weaver M, Van Allen EM, Parsons DW, et al. Somatic cancer variant curation and harmonization through consensus minimum variant level data. Genome Med. 2016; 8:117.
16. Li MM, Datto M, Duncavage EJ, Kulkkarni S, Lindeman NI, Roy S, Tsimberidou AM, Vnecak-Jones CL, Wolff DJ, Younes A, Nikiforova MN. Standards and guidelines for the interpretation and reporting of sequence variants in cancer: a joint consensus recommendation of the Association for Molecular Pathology, American Society of Clinical Oncology, and College of American Pathologists. J Mol Diagn. 2017; 19:4–23.
17. Kalia SS, Adelman K, Bale SJ, Chung WK, Eng C, Evans JP, Herman GE, Hufnagel SB, Klein TE, Korf BR, McKevley KD, Ormond KE, Richards CS, et al. Recommendations for reporting of secondary findings in clinical exome and genome sequencing, 2016 update (ACMG SF v2.0): a policy statement of the American College of Medical Genetics and Genomics. Genet Med. 2017; 19:249–255.
18. Szolek A, Schubert B, Mohr C, Sturm M, Feldhahn M, Kohlbacher O. OptiType: precision HLA typing from next-generation sequencing data. Bioinformatics. 2014; 30:3310–3316.
19. Rubinsteyn A, O’Donnell T, Damaraju N Hammerbacher J. Predicting peptide-MHC binding affinities with imputed training data. bioRxiv. 2016.
20. Chiang DY, Getz G, Jaffe DB, O’Kelly MJ, Zhao X, Carter SL, Russ C, Nusbaum C, Meyerson M, Lander ES. High-resolution mapping of copy-number alterations with massively parallel sequencing. Nat Methods. 2009; 6:99–103.
21. Zhao M, Wang Q, Wang Q, Jia P, Zhao Z. Computational tools for copy number variation (CNV) detection using next-generation sequencing data: features and perspectives. BMC Bioinformatics. 2013; 14:S1.
22. Wang K, Li M, Hadley D, Liu R, Glessner J, Grant SF, Hakonarson H, Bucan M. PennCNV: An integrated hidden Markov model designed for high-resolution copy number variation detection in whole genome SNP genotyping data. Genome Res. 2007; 17:1665–1674.
23. Weinstein JN, Collisson EA, Mills GB, Shaw KR, Ozenberger BA, Ellrott K, Shmulevich I, Sander C, Stuart JM, and Cancer Genome Atlas Research Network. The Cancer Genome Atlas Pan-Cancer analysis project. Nat Genet. 2013; 45:1113–1120.
24. Zehir A, Benayed R, Shah RH, Syed A, Middha S, Kim HR, Srinivasan P, Gao J, Chakravarty D, Devlin SM, Hellmann MD, Barron DA, Schram AM, et al. Mutational landscape of metastatic cancer revealed from prospective clinical sequencing of 10,000 patients. Nat Med. 2017; 23:703–713.
25. Assarzadegan N, Montgomery E, Anders RA. Immune checkpoint inhibitor colitis: the flip side of the wonder drugs. Virchows Arch. 2018; 472:125–133.
26. Scott ES, Long GV, Guminski A, Clifton-Bligh RJ, Menzies AM, Tsang VH. The spectrum, incidence, kinetics and management of endocrinopathies with immune checkpoint inhibitors for metastatic melanoma. Eur J Endocrinol. 2018; 178:173–80.
27. Wei W, Luo Z. Risk of gastrointestinal toxicities with PD-1 inhibitors in cancer patients: A meta-analysis of randomized clinical trials. Medicine. 2017; 96:e8931.
28. Makarious D, Horwood K, Coward JIG. Myasthenia gravis: An emerging toxicity of immune checkpoint inhibitors. Eur J Cancer. 2017; 82:128–136.
29. Goodman A, Kato S, Bazhenova L, Patel SP, Frampton GM, Miller V, Stephens PJ, Daniels GA, Kurzrock R. Tumor Mutational Burden as an independent predictor of response to immunotherapy in diverse cancers. Mol Cancer Ther. 2017; 16:2598–2608.
30. Schwaederle M, Zhao M, Lee JJ, Lazar V, Leyland-Jones B, Schilsky RL, Mendelsohn J, Kurzrock R. Association of Biomarker-Based Treatment Strategies with Response Rates and Progression-Free Survival in Refractory Malignant Neoplasms: A Meta-analysis. JAMA Oncol. 2016; 2:1452–1459.
31. Schwaederle M, Zhao M, Lee JJ, Eggermont AM, Schilsky RL, Mendelsohn J, Lazar V, Kurzrock R. Impact of Precision Medicine in Diverse Cancers: A Meta-Analysis of Phase II Clinical Trials. J Clin Oncol. 2015; 33:3817–25.
32. Wheler JJ, Janku F, Naing A, Li Y, Stephen B, Zinner R, Subbiah V, Fu S, Karp D, Falchook GS, Tsimeridou AM, Piha-Paul S, Anderson R, et al. Cancer Therapy Directed by Comprehensive Genomic Profiling: A Single Center Study. Cancer Res. 2016; 76:3690–3701.
33. Coyne GO, Takebe N, Chen AP. Defining precision: The precision medicine initiative trials NCI-MPACT and NCI-MATCH. Curr Probl Cancer. 2017; 41:182–193.
34. Markman M. Maurie Markman on the Groundbreaking TAPUR Trial. Oncology (Williston Park). 2017; 31:158–68, 168.
35. Hirshfield KM, Tolkkunov D, Zhong H, Ali SM, Stein MN, Murphy S, Vig H, Vazquez A, Glod J, Moss RA, Belyi V, Chan CS, Chen S, et al. Clinical Actionability of Comprehensive Genomic Profiling for Management of Rare or Refractory Cancers. Oncologist. 2016; 21:1315–1325.
36. Groisberg R, Hong DS, Holla V, Janku F, Piha-Paul S, Ravi V, Benjamin R, Kumar Patel S, Somaiah N, Conley A, Ali SM, Schrock AB, Ross JS, et al. Clinical genomic profiling to identify actionable alterations for investigational therapies in patients with diverse sarcomas. Oncotarget. 2017; 8:39254–67. https://doi.org/10.18632/oncotarget.16845.
37. Ross JS, Wang K, Gay L, Otto GA, White E, Iwanik K, Palmer G, Yelensky R, Lipson DM, Chmielecki J, Erlich RL, Rankin AN, Ali SM, et al. Comprehensive Genomic Profiling of Carcinoma of Unknown Primary Site: New Routes to Targeted Therapies. JAMA Oncol. 2015; 1:40–49.
38. Ross JS, Badve S, Wang K, Sheehan CE, Boguniewicz AB, Otto GA, Yelensky R, Lipson D, Ali S, Morosini D, Chliemlecki J, Elvin JA, Miller VA, Stephens PJ. Genomic profiling of advanced-stage, metaplastic breast carcinoma by next-generation sequencing reveals frequent, targetable genomic abnormalities and potential new treatment options. Arch Pathol Lab Med. 2015; 139:642–649.
39. Dobin A, Davis CA, Schlesinger F, Drenkow J, Zaleski C, Jha S, Batut P, Chaisson M, Gingeras TR. STAR: ultrafast universal RNA-seq aligner. Bioinformatics. 2013; 29:15–21.
40. Faust GG, Hall IM. SAMBLASTER: fast duplicate marking and structural variant read extraction. Bioinformatics. 2014; 30:2503–2505.
41. Sanchez-Vega F, Mina M, Armenia J, Chatila WK, Luna A, La KC, Dimitriadoy S, Liu DL, Kantheti HS, Saghafinia S, Chakravarty D, Daian F, Gao Q, et al, and Cancer Genome Atlas Research Network. Oncogenic Signaling Pathways in The Cancer Genome Atlas. Cell. 2018; 173:321–337.e10.