
INTRODUCTION
Gastric cancer (GC) is the fourth most common cancer worldwide with an annual incidence of 952,000 and is the second leading cause of global cancer mortality [1]. More than 70% of the GC cases occur in developing countries, with Asia having the highest incidence. Despite the current effort to reduce Helicobacter Pylori infection, which is considered the most significant risk factor for GC [2-4], GC remains a prominent public health and an economic burden in Asia [2, 5]. In China, GC is the third leading cause of death from cancer with an age standardized incidence rate of 22.7 per 100,000 [6-7](Cancer Incidence and Mortality Worldwide in 2012, International Agency for Research on Cancer).
Colorectal cancer (CRC) is the third most common cancer in males and the second most common cancer in females worldwide [8], with an annual incidence of 1.4 million. Although the majority of CRC cases occur in developed countries and historically Asia has the lowest incidence, the CRC incidence rate in China has dramatically increased in recent years, with an age standardized incidence rate of 14.2 per 100,000, and ranked the fifth leading cause of death from cancer [9-10].
To improve clinical outcome of gastrointestinal cancer patients, novel molecular prognostic markers are needed as well as improved understanding of the mechanism of tumorigenesis. Lysosomal-associated membrane protein 3 (LAMP3) belongs to the LAMP family proteins. LAMP proteins are highly glycosylated type 1 integral membrane proteins, mainly residing in lysosomal membranes. LAMP3 was originally identified as a marker of mature dendritic cells (CD208, DC-LAMP) [11] as well as a lung specific gene (TSC403) [12]. It is overexpressed in several types of human cancers [12]. Although the precise function of LAMP3 is unknown, recent in vitro and in vivo studies suggest that LAMP3 may be important for tumor metastasis and resistance to therapy: LAMP3 protein was overexpressed in cancer cells from many organs, including cervix, breast, ovary, colon and liver [12]; LAMP3 induces migration and invasion of tumor cells in vitro [13-14]; LAMP3 expression has been associated with resistance to chemotherapy and radiotherapy [15-17]; finally, LAMP3 expression has been associated with lymph node metastasis and poor overall survival [18-20].
TP53 is one of the most important tumor suppressor genes, mutated in over 50% of human malignancies [21]. It regulates DNA repair, cell cycle and apoptosis and therefore plays an essential role in maintaining genetic stability [22]. Because wild type TP53 protein has a short half-life while mutant TP53 proteins are stabilized and show dominant-negative function, TP53 protein detected by immunohistochemistry assay has been widely used as a surrogate marker for TP53 mutation [23-24]. In gastrointestinal cancers, TP53 is one of the most prevalent genetic alterations [25-26], and TP53 protein detection by immunohistochemistry has been associated with better response to chemotherapy [27].
Little is known about the role of LAMP3 in gastrointestinal cancer. Thus far, only two studies have investigated the potential role of LAMP3 in gastrointestinal tumors: Ishigami et al found that the presence of intratumoral LAMP3+ (CD208+) mature interdigitating dendritic cells (IDCs) was inversely correlated with patients’ postoperative outcome in GC [28]; Adamsen et al identified LAMP3 as a novel TP53 downstream target gene in colon cancer cells [29]. In the present study, we analyzed epithelial LAMP3 and TP53 expression by immunohistochemistry analysis in both benign and malignant gastric and colorectal tissues using tissue microarrays (TMAs). We correlated epithelial LAMP3 and TP53 expression with clinicopathological characteristics as well as overall survival in patients with gastrointestinal cancers.
RESULTS
LAMP3 or TP53 expression in gastrointestinal tissues
LAMP3 protein expression was mainly detected in tumor epithelial cells, only in rare occasions (<5 cases) it was also detected in tumor infiltrating lymphocyte. LAMP3 protein was localized in the cytoplasm while TP53 protein was localized in the nuclei. Using the X-tile software program for TMA data analysis (http://www.tissuearray.org/rimmlab), we first identified significant cutoff point in terms of overall survival in gastric and colorectal cancers. For LAMP3, the cutoff 120 was selected for both gastric and colorectal cancers: score 0-120 was considered low expression while 121-300 was considered high expression. For TP53, the cutoff point 150 was selected for gastrointestinal cancer. For all subsequent analyses, LAMP3 and TP53 protein expression levels were considered either as “Low” or “High” using these cutoff values.
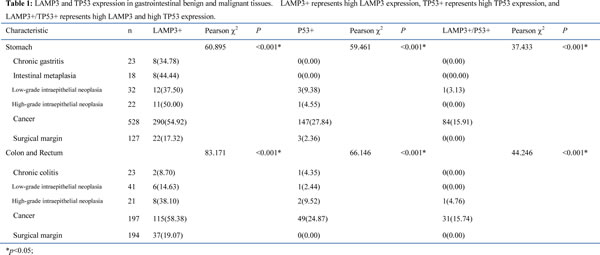
In both gastric and colorectal cancer, more than 50% of cancerous tissues had high LAMP3 expression (LAMP3+), significantly higher than normal surgical margin tissues as well benign tissues (Table 1). Similarly, the frequency of high TP53 expression (TP53+) was significantly higher in cancers than normal surgical margins and benign lesions. Interestingly, high LAMP3 and high TP53 expression (LAMP3+/TP53+) was almost exclusively present in cancerous tissues, only one case each in benign gastric and colorectal benign tissues had LAMP3+/TP53+ staining.
Association of LAMP3 and TP53 expression with clinicopathologic characteristics in gastrointestinal cancers
Next, we examined the correlation between LAMP3 or TP53 protein expression and clinical parameters among gastrointestinal cancer patients.
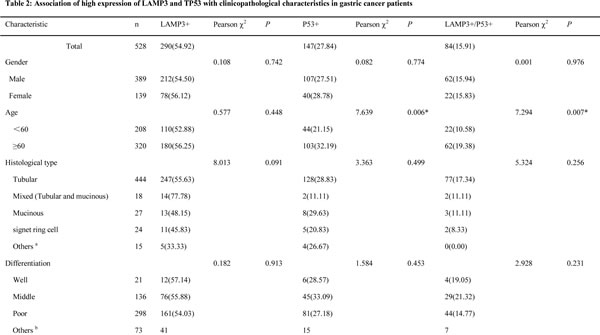
In gastric cancer, high LAMP3 expression was significantly associated with tumor stage (P=0.014), especially with lymph node metastasis (P=0.003); while high TP53 expression was significantly associated with patient age (P=0.006), tumor size (P=0.03), preoperative CEA (P=0.013) and CA19-9 (P=0.032) levels (Table 2). High LAMP3 and high TP53 expression (LAMP3+/TP53+) was significantly associated with patient age (P=0.007), tumor stage (P=0.026), and preoperative CEA level (P=0.013), marginally associated with lymph node metastasis (P=0.057). No correlation between LAMP3 and TP53 expression was detected.
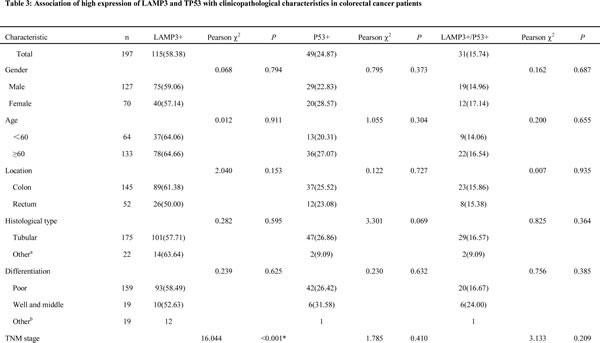
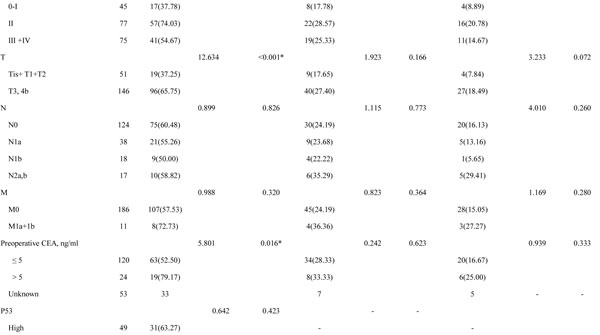
In colorectal cancer, high LAMP3 expression was significantly associated with tumor stage (p<0.001), especially with tumor size (P<0.001), and preoperative CEA level (P=0.016); while high TP53 expression was marginally associated with tumor histological type (P=0.069) (Table 3). High LAMP3 and high TP53 (LAMP3+/TP53+) expression was marginally associated with tumor size (P=0.072). No correlation between LAMP3 and TP53 expression was detected.
Prognostic value of LAMP3 and TP53 protein expression in gastrointestinal cancer
We also determined prognostic factors in gastrointestinal cancers using both univariate and multivariate analysis.
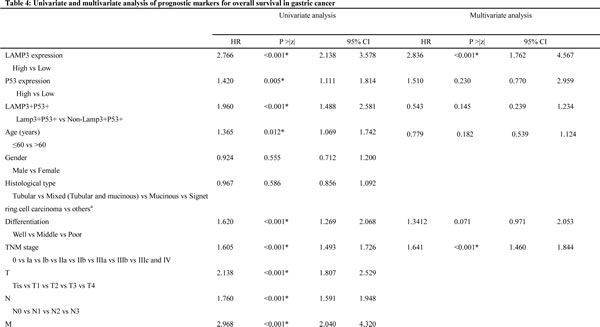
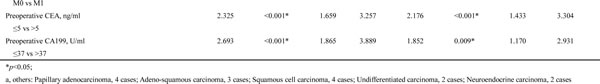
In gastric cancer, high LAMP3 expression (HR, 2.766, 95% CI, 2.138-3.578; P<0.001) was significantly associated with poor overall survival in univariate analysis, along with previously reported prognostic markers, including age (HR, 1.365, 95% CI, 1.069-1.742; P=0.012), differentiation (HR, 1.620, 95% CI, 1.269-2.068; P<0.001), tumor stage (HR, 1.605, 95% CI, 1.493-1.726; P<0.001), preoperative CEA (HR, 2.325, 95% CI, 1.659-3.257; P<0.001) and CA19-9 (HR, 2.693, 95% CI, 1.865-3.889; P<0.001) levels. High TP53 expression was significantly associated with poor overall survival (HR, 1.420, 95% CI, 1.111-1.814; P=0.005), and high LAMP3 and high TP53 (LAMP3+/TP53+) was significantly associated with poor overall survival (HR, 1.960, 95% CI, 1.488-2.581; P<0.001). In multivariate analysis, only high LAMP3 expression remained significantly associated with poor overall survival (HR, 2.836, 95% CI, 1.762-4.567; P<0.001), so did tumor stage (HR, 1.641, 95% CI, 1.460-1.844; P<0.001), preoperative CEA (HR, 2.176, 95% CI, 1.433-3.304; P<0.001) and CA19-9 levels (HR, 1.852, 95% CI, 1.170-2.931; P=0.009) (Table 4).
In colorectal cancer, high LAMP3 expression was significantly associated with poor overall survival in univariate analysis (HR, 2.919, 95% CI, 1.666-5.114; P<0.001), along with previously reported prognostic markers, including differentiation (HR, 4.047, 95% CI, 2.227-7.353; P<0.001), tumor stage (HR, 2.126, 95% CI, 1.500-3.012; P=0.003), and preoperative CEA level (HR, 2.510, 95% CI, 1.354-4.651; P=0.003). High TP53 expression was significantly associated with poor overall survival (HR, 2.051, 95% CI, 1.260-3.338; P=0.004), and high LAMP3 and high TP53 (LAMP3+/TP53+) was significantly associated with poor overall survival (HR, 3.304, 95% CI, 1.813-5.076; P<0.001). In multivariate analysis, high LAMP3 expression remained significantly associated with poor overall survival (HR, 2.519, 95% CI, 1.062-5.980; P=0.036), as did tumor differentiation (HR, 4.741, 95% CI, 2.252-9.982; P<0.001) and tumor stage (HR, 1.988, 95% CI, 1.260-3.137; P=0.003) (Table 5).
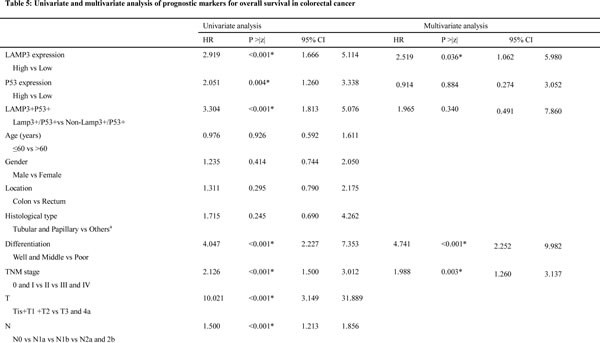
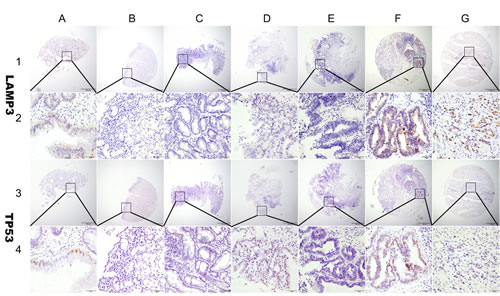
Figure 1: Representation of LAMP3 and TP53 protein expression in gastric benign and malignant tissues on TMA sections. Column A: normal surgical margin of gastric cancer with low LAMP3 expression (IHC score, 80) and low TP53 expression (IHC score, 30); column B: chronic gastritis with no LAMP3 expression (IHC score, 0) and negative TP53 expression(IHC score, 0); column C: intestinal metaplasia with low LAMP3 expression (IHC score, 30) and no TP53 expression(IHC score, 0); column D: low-grade intraepithelial neoplasia with low LAMP3 expression (IHC score, 60) and high TP53 expression (IHC score, 180); column E: high-grade intraepithelial neoplasia with low LAMP3 expression (IHC score, 40) and no TP53 expression (IHC score, 0); column F: well differentiated gastric cancer with high LAMP3 expression (IHC score, 200) and high TP53 expression (IHC score, 210); column G: poorly differentiated gastric cancer with high LAMP3 expression (IHC score, 270)and no TP53 expression (IHC score, 0). Row 1 and 2 are LAMP3 staining with x40 (bar=500 μm) and x400 (bar=50 μm) magnification respectively, and row 3 and 4 are TP53 staining with with x40 (bar=500 μm) and x400 (bar=50 μm) magnification respectively.
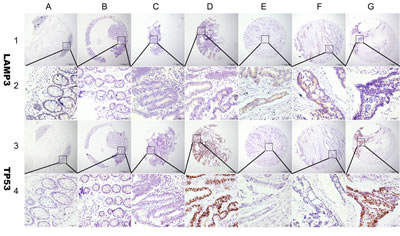
Figure 2: Representation of LAMP3 and TP53 protein expression in colorectal benign and malignant tissues on TMA sections. Column A: normal surgical margin of colorectal cancer with low LAMP3 expression (IHC score, 60) and no TP53 expression (IHC score, 0); column B: chronic colitis with no LAMP3 expression (IHC score, 0) and TP53 expression (IHC score, 0); column C: intestinal metaplasia with low LAMP3 expression (IHC score, 40) and TP53 expression (IHC score, 40); column D: low-grade intraepithelial neoplasia with low LAMP3 expression (IHC score, 100) and high TP53 expression (IHC score, 300); column E: high-grade intraepithelial neoplasia with low LAMP3 expression (IHC score, 120) and no P53 expression (IHC score, 0); column F: low-grade colorectal cancer with high LAMP3 expression (IHC score, 180) and no TP53 expression (IHC score, 0); column G: high grade colorectal cancer with low LAMP3 expression (IHC score, 100) and high TP53 expression (IHC score, 270). Row 1 and 2 are LAMP3 staining with x40 (bar=500 μm) and x400 (bar=50 μm) magnification respectively, and row 3 and 4 are TP53 staining with with x40 (bar=500 μm) and x400 (bar=50 μm) magnification respectively.
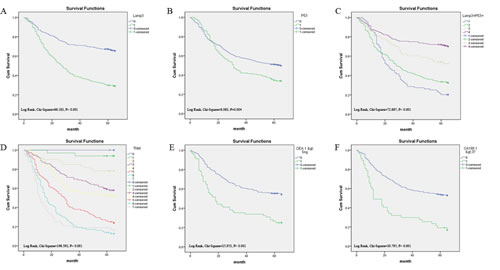
Figure 3: Survival curves of gastric cancer by the Kaplan-Meier method and the log-rank test. A: overall survival curves of LAMP3+ (green line, 1) and LAMP3- (blue line, 0); B: overall survival curves of TP53+ (green line, 1) and TP53- (blue line, 0); C: overall survival curves of LAMP3+/TP53+ (blue line, 1), LAMP3+/TP53- (green line, 2), LAMP3-/TP53+ (yellow line, 3), and LAMP3-/TP53- (purple line, 4); D: overall survival curves by stage, TNM IIIc and IV (gray line, 7), TNM IIIb (lightblue line, 6), TNM IIIa (red line, 5), TNM IIb (yellow line, 4), TNM IIa (purple line, 3), TNM Ib (lightyellow line, 2), TNM Ia (green line, 1) and TNM 0 (blue line, 0); E: overall survival curves by preoperative CEA, high (green line, 1) and low (blue line, 0); F: overall survival curves by preoperative CA19-9 level, high (green line, 1) and low (blue line, 0).
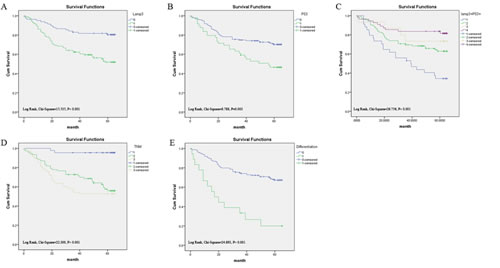
Figure 4: Survival curves of colorectal cancer by the Kaplan-Meier method and the log-rank test. A: overall survival curves of LAMP3+ (green line, 1) and LAMP3- (blue line, 0); B: overall survival curves of TP53+ (green line, 1) and TP53- (blue line, 0); C: overall survival curves of LAMP3+/TP53+ (blue line, 1), LAMP3+/TP53- (green line, 2), LAMP3-/TP53+ (yellow line, 3), and LAMP3-/TP53- (purple line, 4); D: overall survival curves by stage, TNM III and IV (yellow line, 3), TNM II (green line, 2), and TNM 1 and 0 (blue line, 1); E: overall survival curves by differentiation, poor differentiation (green line, 1), well and middle differentiation (blue line, 0).
DISCUSSION
In this study, we have determined LAMP3 and TP53 protein expression in gastrointestinal tissues by immunohistochemistry analysis on tissue microarray (TMA). We found that both LAMP3 and TP53 protein expression were significantly higher in cancerous tissues than in normal and benign tissues. In both gastric and colorectal cancers, we found high LAMP3 protein expression was associated with tumor stage, though we did not detect correlation between LAMP3 and TP53 expression. In both univariate and multivariate analysis, we found high LAMP3 expression was significantly associated with patients’ poor overall survival.
To our best knowledge, this is the first study investigating epithelial LAMP3 protein expression as well as potential LAMP3 and TP53 protein interaction in gastrointestinal cancers. LAMP3 was originally characterized as a molecular marker for mature intedigitating dendritic cells (DC) (DC-LAMP) [11]. In fact, Ishigami et al demonstrated that the presence of LAMP3+ tumor infiltrating mature DC cells had prognostic value in gastric cancer, but they did not investigate LAMP3 expression in tumor epithelial cells [28]. In our study, we mainly detected LAMP3 protein expression in epithelial cells, only in rare occasions (<5 cases) did we also observe tumor infiltrating lymphocytes positive for LAMP3 protein. The difference between Ishigami’s study and ours might be due to the different antibodies used: monoclonal antibody (Ishigami study) vs polyclonal antibody (our study); or difference in study populations: 47% (Ishigami’s study) vs 22% (our study) stage I gastric cancer patients. LAMP3 protein expression has been detected in both DC and epithelial cells in other types of cancer. Liu et al identified LAMP3+ (CD208+) mature DCs in the margin of cancerous tissues of esophageal squamous cell carcinoma [30]. Expression of LAMP3 protein in both dendritic cell and tumor epithelial cell had prognostic value in breast cancer [18, 31]. In cervical cancer, only epithelial LAMP3+ expression was detected [14]. Future studies are needed to resolve discrepancies between DC and tumor epithelial cell LAMP3 expression in cancer tissues.
To investigate downstream TP53 target genes involved in 5-fluorouracil (5-FU) resistance, Adamsen et al compared gene expression changes after 5-FU treatment in colon cancer cells with wild type or mutant TP53 [29]. They identified LAMP3 gene as being upregulated by TP53 gene but downregulated by 5-FU in colon cancer cell lines with mutant TP53. In this clinical study, we observed neither protein expression correlation between LAMP3 and TP53, nor prognostic synergy between LAMP3 and TP53 expression on overall survival: only LAMP3 expression but not the combination of LAMP3 and TP53 was an independent prognostic marker for survival.
Our data indicated that high TP53 expression was associated with poor overall survival in both gastric and colorectal cancer [32-34]. This is consistent with studies in colon and breast cancers, but in contrast with a recent study in gastric cancer where high TP53 expression is associated with better response to chemotherapy [27]. Because not all TP53 mutations lead to accumulation of TP53 protein [35-36], cautions should be taken when interpreting TP53 IHC data. Havrilesky et al demonstrated that TP53 mutation but not TP53 overexpression was associated patients’ survival in ovarian cancer [24]. Future studies are needed to directly compare TP53 protein expression with TP53 mutation detected by sequencing in gastrointestinal cancers and their association with overall survival.
LAMP3 is the newest member of the LAMP protein family, which is a lysosomal-associated membrane protein that is rarely expressed in normal cells but abundant in cancer cells. Because LAMP genes are major carriers of sialylated lewis x antigens, it has been hypothesized that LAMP genes are involved in tumor invasion and metastasis by regulating tumor adhesion to endothelial cells through tumor associated sialylated lewis x antigen and E-selectin on endothelial cells [12].
Other studies indicate that LAMP3 is a novel hypoxia-regulated gene and a mediator of hypoxia induced metastasis [37]. Both LAMP3 mRNA and protein are induced by hypoxia. In cervical cancer, expression of LAMP3 is associated with hypoxia and mediates hypoxia-driven nodal metastasis through regulating cell migration [14, 19]. In breast cancer xenografts, LAMP3 protein expression colocalizes with hypoxic areas and is associated with locoregional recurrence[18]. Mechanistically, it has been shown that tumor hypoxia induces unfolded protein response (UPR) pathway, which in turn induces LAMP3 via the PKR-like ER kinase (PERK)/activating transcription factor 4 (ATF4)-arm of the UPR [13, 37].
Our study has several limitations: first, it is a retrospective observational study, the conclusions might not be applicable to the general population. Larger prospective studies are needed to confirm our findings. Secondly, we have used TMA to analyze LAMP3 and TP53 protein level, the expression pattern might not represent the expression pattern of the whole tissue, thus introducing potential biases in the data. Thirdly, IHC data are semiquantitative, additional methods are needed to evaluate and confirm LAMP3 and TP53 expression in tumor cells. Finally, we do not know whether LAMP3 protein is induced by hypoxia in gastrointestinal cancer. Future in vitro studies are needed to investigate the mechanism of LAMP3 in tumorigenesis.
In conclusion, we have shown that high LAMP3 protein expression is an independent prognostic marker in gastrointestinal cancers. Because of the role of LAMP3 in tumor-associated hypoxia, future research is warranted to investigate whether LAMP3 plays a role in hypoxia-associated treatment failure and whether LAMP3 is a valid novel therapy target in gastrointestinal cancers.
METHODS
Human tissue specimens and patient clinical information
A total of 1229 formalin-fixed paraffin-embedded (FFPE) tissue samples were collected from 908 patients. These include 761 stomach tissues: 539 cancer, 127 matched normal surgical margins, 23 chronic gastritis, 18 intestinal metaplasia, 32 low-grade intraepithelial neoplasia, and 22 high-grade intraepithelial neoplasia; 479 colon and rectum tissues: 200 cancer, 194 matched normal surgical margins, 23 chronic colitis, 41 low-grade intraepithelial neoplasia, and 21 high-grade intraepithelial neoplasia. All tissue blocks were obtained from the Department of Pathology, Affiliated Hospital of Nantong University from 2003 to 2010. Clinical characteristics of cancer patients were extracted from their medical record, including: age, sex, histological type, differentiation grade, tumor stage, preoperative serum CEA and CA19-9 levels. None of the cancer patients received any types of treatments (radiation therapy, chemotherapy, or immunotherapy) before surgery. Overall survival (OS) was defined as the period from initial biopsy confirmed diagnosis to death. Patients who were alive at the last follow-up date were censored from the analysis. The study protocol was approved by the Human Research Ethics Committee of the Affiliated Hospital of Nantong University, Jiangsu, China.
Tissue microarray (TMA) construction and immunohistochemistry analysis (IHC)
TMA was generated using the manual Tissue Microarrayer System Quick Ray (UT06, UNITMA, Korea) in the Department of Clinical Pathology, Nantong University Hospital, Jiangsu, China. Specifically, core tissue biopsies (2 mm in diameter) were taken from ~70 individual FFPE blocks and arranged in a new recipient paraffin block. A total 22 TMAs were made, including 13 gastric TMAs and 9 colorectal TMAs. Four-micron sections were cut and placed on super frost-charged glass microscope slides to generate TMA slides.
Tissue sections were deparaffinized and rehydrated through graded alcohols. Endogenous peroxidase activity was blocked by incubation in 3% H2O2. Antigen retrieval was carried out with 0.01 M citrate buffer pH 6.0 and microwave heat induction. LAMP3 was detected by rabbit polyclonal anti-human LAMP3 antibody (dilution 1:100) (Abcam, ab111090), and TP53 was detected by rabbit polyclonal anti-human TP53 antibody (dilution 1:100) (DAKO, M3629). Reactions were detected with Envision+TM peroxidase kit (Dako, Carpinteria, CA, USA). Color development was accomplished by incubating with 3,3’-diaminobenzidine plus (Dako, Carpinteria,CA, USA), counterstained with Hematoxylin, dehydrated through graded alcohols, cleared in xylene, and coverslipped with permanent mounting media.
All cases were reviewed and scored without knowledge of clinical characteristics. The expression of LAMP3 and TP53 was scored using the semi-quantitative H-score method, taking into account both the staining intensity and the percentage of cells at that intensity [38]. The staining intensity was scored as 0 (no staining), 1+ (weak staining), 2+ (moderate staining), or 3+ (intense staining). For each of the four staining intensity scores, the percentage of cells stained at the respective intensity was determined and multiplied by the intensity score to yield an intensity percentage score. The final staining scores were then calculated from the sum of the four intensity percentage scores; thus the staining score had a minimum value of 0 (no staining) and a maximum of 300 (100% of cells with 3+ staining intensity).
Statistical analysis
For statistical analysis, the continuous LAMP3 and TP53 expression data from IHC were first converted into dichotic data (low vs high) using specific cutoff values, which were selected to be significant in terms of overall survival (OS) using the X-tile software program (The Rimm Lab at Yale University; http://www.tissuearray.org/rimmlab) [20, 39].
Student t test and Pearson χ2 test were used to determine the statistical significance of differences between comparison groups. The correlation between LAMP3 and TP53 protein expression was calculated using Spearman’s test. The cumulative patient survival was estimated using the Kaplan-Meier method, and a log-rank test was used to compare the survival curves. A Cox proportional hazards model was used to calculate univariate and multivariate hazard ratios for the variables. A P-value of less than 0.05 was considered statistically significant. All statistical analyses were carried out using the SPSS 20.0 statistical software package (SPSS Inc., Chicago, IL).
ACKNOWLEDGEMENTs
This study was supported by the Postdoctoral study (2013-40-5) and Translational Medicine Research (TDFzh2014011) from the Affiliated Hospital of Nantong University, Jiangsu, China.
REFERENCES
1. Fock KM. Review article: the epidemiology and prevention of gastric cancer. Aliment Pharmacol Ther. 2014; 40(3):250-260.
2. Rahman R, Asombang AW and Ibdah JA. Characteristics of gastric cancer in Asia. World J Gastroenterol. 2014; 20(16):4483-4490.
3. Peleteiro B, Bastos A, Ferro A and Lunet N. Prevalence of Helicobacter pylori Infection Worldwide: A Systematic Review of Studies with National Coverage. Dig Dis Sci. 2014; 59(8):1698-1709.
4. Lu B and Li M. Helicobacter pylori eradication for preventing gastric cancer. World J Gastroenterol. 2014; 20(19):5660-5665.
5. Lordick F, Allum W, Carneiro F, Mitry E, Tabernero J, Tan P, Van Cutsem E, van de Velde C and Cervantes A. Unmet needs and challenges in gastric cancer: the way forward. Cancer Treat Rev. 2014; 40(6):692-700.
6. Zhu X and Li J. Gastric carcinoma in China: Current status and future perspectives (Review). Oncol Lett. 2010; 1(3):407-412.
7. Yang L. Incidence and mortality of gastric cancer in China. World J Gastroenterol. 2006; 12(1):17-20.
8. Jemal A, Bray F, Center MM, Ferlay J, Ward E and Forman D. Global cancer statistics. CA Cancer J Clin. 2011; 61(2):69-90.
9. Yu Y, Zheng S, Zhang S, Jin W, Liu H, Jin M, Chen Z, Ding Z, Wang L and Chen K. Polymorphisms of inflammation-related genes and colorectal cancer risk: a population-based case-control study in China. Int J Immunogenet. 2014; 41(4):289-297.
10. Xu AG, Yu ZJ, Jiang B, Wang XY, Zhong XH, Liu JH, Lou QY and Gan AH. Colorectal cancer in Guangdong Province of China: a demographic and anatomic survey. World J Gastroenterol. 2010; 16(8):960-965.
11. de Saint-Vis B, Vincent J, Vandenabeele S, Vanbervliet B, Pin JJ, Ait-Yahia S, Patel S, Mattei MG, Banchereau J, Zurawski S, Davoust J, Caux C and Lebecque S. A novel lysosome-associated membrane glycoprotein, DC-LAMP, induced upon DC maturation, is transiently expressed in MHC class II compartment. Immunity. 1998; 9(3):325-336.
12. Ozaki K, Nagata M, Suzuki M, Fujiwara T, Ueda K, Miyoshi Y, Takahashi E and Nakamura Y. Isolation and characterization of a novel human lung-specific gene homologous to lysosomal membrane glycoproteins 1 and 2: significantly increased expression in cancers of various tissues. Cancer Res. 1998; 58(16):3499-3503.
13. Nagelkerke A, Bussink J, Mujcic H, Wouters BG, Lehmann S, Sweep FC and Span PN. Hypoxia stimulates migration of breast cancer cells via the PERK/ATF4/LAMP3-arm of the unfolded protein response. Breast Cancer Res. 2013; 15(1):R2.
14. Mujcic H, Nagelkerke A, Rouschop KM, Chung S, Chaudary N, Span PN, Clarke B, Milosevic M, Sykes J, Hill RP, Koritzinsky M and Wouters BG. Hypoxic activation of the PERK/eIF2alpha arm of the unfolded protein response promotes metastasis through induction of LAMP3. Clin Cancer Res. 2013; 19(22):6126-6137.
15. Pennati M, Lopergolo A, Profumo V, De Cesare M, Sbarra S, Valdagni R, Zaffaroni N, Gandellini P and Folini M. miR-205 impairs the autophagic flux and enhances cisplatin cytotoxicity in castration-resistant prostate cancer cells. Biochem Pharmacol. 2014; 87(4):579-597.
16. Nagelkerke A, Bussink J, van der Kogel AJ, Sweep FC and Span PN. The PERK/ATF4/LAMP3-arm of the unfolded protein response affects radioresistance by interfering with the DNA damage response. Radiother Oncol. 2013; 108(3):415-421.
17. Nagelkerke A, Sieuwerts AM, Bussink J, Sweep FC, Look MP, Foekens JA, Martens JW and Span PN. LAMP3 is involved in tamoxifen resistance in breast cancer cells through the modulation of autophagy. Endocr Relat Cancer. 2014; 21(1):101-112.
18. Nagelkerke A, Mujcic H, Bussink J, Wouters BG, van Laarhoven HW, Sweep FC and Span PN. Hypoxic regulation and prognostic value of LAMP3 expression in breast cancer. Cancer. 2011; 117(16):3670-3681.
19. Kanao H, Enomoto T, Kimura T, Fujita M, Nakashima R, Ueda Y, Ueno Y, Miyatake T, Yoshizaki T, Buzard GS, Tanigami A, Yoshino K and Murata Y. Overexpression of LAMP3/TSC403/DC-LAMP promotes metastasis in uterine cervical cancer. Cancer Res. 2005; 65(19):8640-8645.
20. Zhai X, Zhu H, Wang W, Zhang S, Zhang Y and Mao G. Abnormal expression of EMT-related proteins, S100A4, vimentin and E-cadherin, is correlated with clinicopathological features and prognosis in HCC. Med Oncol. 2014; 31(6):970.
21. Hollstein M, Sidransky D, Vogelstein B and Harris CC. p53 mutations in human cancers. Science. 1991; 253(5015):49-53.
22. Vogelstein B and Kinzler KW. p53 function and dysfunction. Cell. 1992; 70(4):523-526.
23. Casey G, Lopez ME, Ramos JC, Plummer SJ, Arboleda MJ, Shaughnessy M, Karlan B and Slamon DJ. DNA sequence analysis of exons 2 through 11 and immunohistochemical staining are required to detect all known p53 alterations in human malignancies. Oncogene. 1996; 13(9):1971-1981.
24. Havrilesky L, Darcy k M, Hamdan H, Priore RL, Leon J, Bell J and Berchuck A. Prognostic significance of p53 mutation and p53 overexpression in advanced epithelial ovarian cancer: a Gynecologic Oncology Group Study. J Clin Oncol. 2003; 21(20):3814-3825.
25. Bellini MF, Cadamuro AC, Succi M, Proenca MA and Silva AE. Alterations of the TP53 gene in gastric and esophageal carcinogenesis. J Biomed Biotechnol. 2012; 2012:891961.
26. Jang BG and Kim WH. Molecular pathology of gastric carcinoma. Pathobiology. 2011; 78(6):302-310.
27. Xu HY, Xu WL, Wang LQ, Chen MB and Shen HL. Relationship between p53 status and response to chemotherapy in patients with gastric cancer: a meta-analysis. PLoS One. 2014; 9(4):e95371.
28. Ishigami S, Ueno S, Matsumoto M, Okumura H, Arigami T, Uchikado Y, Setoyama T, Arima H, Sasaki K, Kitazono M, Shinchi H, Kijima Y and Natsugoe S. Prognostic value of CD208-positive cell infiltration in gastric cancer. Cancer Immunol Immunother. 2010; 59(3):389-395.
29. Adamsen BL, Kravik KL, Clausen OP and De Angelis PM. Apoptosis, cell cycle progression and gene expression in TP53-depleted HCT116 colon cancer cells in response to short-term 5-fluorouracil treatment. Int J Oncol. 2007; 31(6):1491-1500.
30. Liu J, Lu G, Li Z, Tang F, Liu Y and Cui G. Distinct compartmental distribution of mature and immature dendritic cells in esophageal squamous cell carcinoma. Pathol Res Pract. 2010; 206(9):602-606.
31. Treilleux I, Blay JY, Bendriss-Vermare N, Ray-Coquard I, Bachelot T, Guastalla JP, Bremond A, Goddard S, Pin JJ, Barthelemy-Dubois C and Lebecque S. Dendritic cell infiltration and prognosis of early stage breast cancer. Clin Cancer Res. 2004; 10(22):7466-7474.
32. Chen J, Tang H, Wu Z, Zhou C, Jiang T, Xue Y, Huang G, Yan D and Peng Z. Overexpression of RBBP6, alone or combined with mutant TP53, is predictive of poor prognosis in colon cancer. PLoS One. 2013; 8(6):e66524.
33. Arriaga JM, Bravo IA, Bruno L, Morales Bayo S, Hannois A, Sanchez Loria F, Pairola F, Huertas E, Roberti MP, Rocca YS, Aris M, Barrio MM, Baffa Trasci S, Levy EM, Mordoh J and Bianchini M. Combined metallothioneins and p53 proteins expression as a prognostic marker in patients with Dukes stage B and C colorectal cancer. Hum Pathol. 2012; 43(10):1695-1703.
34. Mojarad S, Venturini B, Fulgenzi P, Papaleo R, Brisigotti M, Monti F, Canuti D, Ravaioli A, Woo L, Dlay S and Sherbet GV. Prediction of nodal metastasis and prognosis of breast cancer by ANN-based assessment of tumour size and p53, Ki-67 and steroid receptor expression. Anticancer Res. 2013; 33(9):3925-3933.
35. Davidoff AM, Humphrey PA, Iglehart JD and Marks JR. Genetic basis for p53 overexpression in human breast cancer. Proc Natl Acad Sci U S A. 1991; 88(11):5006-5010.
36. Poon GM, Brokx RD, Sung M and Gariepy J. Tandem dimerization of the human p53 tetramerization domain stabilizes a primary dimer intermediate and dramatically enhances its oligomeric stability. J Mol Biol. 2007; 365(4):1217-1231.
37. Mujcic H, Rzymski T, Rouschop KM, Koritzinsky M, Milani M, Harris AL and Wouters BG. Hypoxic activation of the unfolded protein response (UPR) induces expression of the metastasis-associated gene LAMP3. Radiother Oncol. 2009; 92(3):450-459.
38. Detre S, Saclani Jotti G and Dowsett M. A “quickscore” method for immunohistochemical semiquantitation: validation for oestrogen receptor in breast carcinomas. J Clin Pathol. 1995; 48(9):876-878.
39. Ni S, Xu L, Huang J, Feng J, Zhu H, Wang G and Wang X. Increased ZO-1 expression predicts valuable prognosis in non-small cell lung cancer. Int J Clin Exp Pathol. 2013; 6(12):2887-2895.