
INTRODUCTION
The Wilms tumor 1 gene (WT1) encodes a zinc finger transcriptional regulator that acts as a tumor suppressor in various cell types, with target genes implicated in cell differentiation, apoptosis and cell cycle regulation [1, 2]. Discerning the role of WT1 in hematopoietic malignancies has proven to be complex, with conflicting reports of the prognostic value of WT1 expression and its possible role as an oncogene [3–7]. The first evidence that a WT1 mutation could be leukemogenic was a report describing a Wilms tumor survivor with WAGR syndrome, who by definition harbored a germline heterozygous deletion of the WT1 gene, and later developed acute myeloid leukemia (AML) with a new somatic WT1 mutation in the remaining allele [8].
Multiple reports have since shown that somatic WT1 mutations are present in approximately 10–15% of both adult [9, 10] and pediatric [11, 12] patients with normal-karyotype (NK)-AML. Clusters of mutational “hot spots” occur in exons 7 and 9, which encode the zinc finger DNA-binding domain. Mutations in exon 7 tend to be frameshift mutations and often occur as biallelic compound heterozygous mutations, resulting in a truncated WT1 protein and loss of the zinc finger DNA-binding domain [9, 11]. Exon 9 mutations are often missense mutations, believed to act in a dominant negative manner, interfering with the function of wild type WT1 [13]. WT1 mutations have also been reported in 3–4% of myelodysplastic syndrome (MDS) [14] and have been associated with an increased risk of transformation to AML [15]. Recent studies of large MDS cohorts have defined WT1 mutations as an independent poor prognostic indicator [16], and have shown correlations of WT1 mutations with lower hemoglobin levels and a higher percentage of bone marrow blasts [17].
WT1 mutations frequently coexist with FLT3/ITD mutations in AML, suggesting possible leukemogenic cooperativity. Even when accounting for the poor prognostic implication of FLT3/ITD mutations, WT1 mutations have been independently associated with treatment failure and a poor prognosis [10, 18–20]. The largest and most recent of these reports demonstrated that WT1 mutations have an independent adverse impact on event free survival (EFS) in adults with NK-AML [20]. In pediatric AML, WT1 mutations were also found to independently confer a poor prognosis and a higher cumulative incidence of relapse [11].
For the present study, we sought to investigate the in vivo effects of a Wt1 mutation in a mouse model and describe the hematologic phenotype. We obtained mice heterozygous for the R394W mutation, the result of a C to T transition in exon 9 in the DNA-binding domain [21]. R394W has been reported in cases of human AML [22]. We found that Wt1+/R394W mice develop MDS, which is recapitulated with 100% penetrance in a transplant mouse model at a shortened latency. To specifically investigate the relationship between WT1 mutations and FLT3/ITD mutations in human AML, we created a novel mouse model by cross-breeding mice with a constitutively knocked-in Flt3/ITD mutation with Wt1+/R394W mice. Flt3+/ITD mice are well characterized and develop a fatal myeloproliferative neoplasm (MPN) [23]. We show that mice harboring both Wt1/R394W and Flt3/ITD mutations develop an aggressive MDS/MPN phenotype. Using these models, we identified a functional role for a WT1 mutation in myeloid neoplasms.
RESULTS
Wt1+/R394W mice develop late-onset myelodysplastic syndrome
To investigate the effects of a WT1 mutation on the hematopoietic system in vivo, we utilized a previously described knock-in Wt1 mutant mouse model, containing the germline heterozygous mutation R394W (Wt1+/R394W) [21]. R394W is located in the DNA-binding domain of WT1 and is the most common mutation described in Denys-Drash syndrome (DDS). R394W has also been reported in cases of human leukemia [22]. Gao et al. reported that R394W knock-in mice develop DDS in a strain-specific background [21]. We utilized a mixed strain Wt1+/R394W mouse model that does not develop DDS in order to study the functional effects of R394W on hematopoiesis.
We hypothesized that Wt1+/R394W mice would develop an abnormal hematologic phenotype over time. We found no impact on the early survival of these mice, but observed a trend towards an inferior late survival compared to wild type littermates (Figure 1A). Multiple Wt1+/R394W mice were found dead at an older age, and therefore we did not fully analyze all mice. However, we observed that several older Wt1+/R394W mice appeared quite ill, and we evaluated the hematologic parameters of six moribund Wt1+/R394W mice. Three of 5 moribund Wt1+/R394W mice with available CBC data were anemic, compared to a cohort of age-matched wild type mice (mean hemoglobin of the five Wt1+/R394W mice, 9.7 ± 1.6 g/dL vs. wild type mice, 12.9 ± 0.5 g/dL, p = 0.03; Figure 1B). Other CBC parameters (WBC, platelet counts) from the moribund Wt1+/R394W mice did not show significant differences compared to the wild type counterparts (data not shown). To confirm that the observed anemia in the Wt1+/R394W mice was of a purely hematologic etiology and not due to renal disease, we measured erythropoietin levels in these mice and did not observe a difference when comparing wild type and Wt1+/R394W mice, but did observe an appropriate increase in erythropoietin in anemic mice, regardless of genotype (Supplementary Figure 1). We conclude that the anemia in the Wt1+/R394W mice was of a primary hematologic etiology.
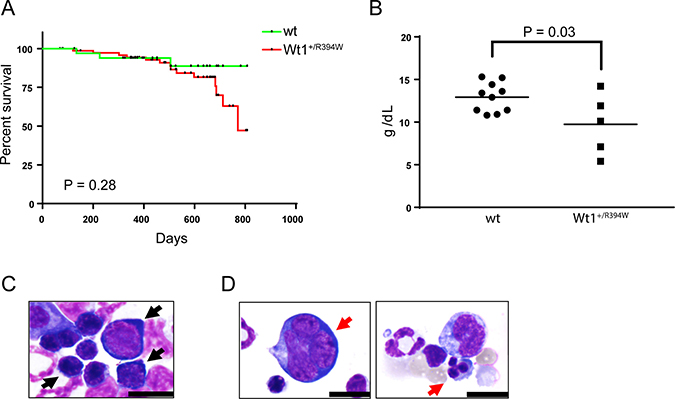
Figure 1: Hematologic characterization of knock-in Wt1+/R394W mice. (A) Kaplan–Meier survival curve of knock-in Wt1+/R394W mice (n = 76) and wild type (wt) littermates (n = 36). (B) Hemoglobin values of moribund Wt1+/R394W mice (n = 5, mean hemoglobin 9.74 g/dL ± 1.59) compared to age-matched wt mice (n = 10, mean hemoglobin 12.93 g/dL ± 0.55, p = 0.03). Horizontal bars represent the mean values. Representative bone marrow cytospins are shown of (C) wild type mice and (D) moribund Wt1+/R394W mice (100×; scale bars are 10 microns). (C) Bone marrow from wt mice demonstrates no significant dysplasia in the myeloid or erythroid lineages; black arrows indicate normal erythroid precursors. In (D), red arrows denote early and late erythroid precursors with dysplastic changes in Wt1+/R394W bone marrow.
Morphologic examination of the bone marrow of wild type mice demonstrates normal trilineage hematopoiesis (Figure 1C). In contrast, the bone marrow of the moribund Wt1+/R394W mice demonstrates dysplastic changes limited to the erythroid lineage, including multinucleation and irregular nuclear borders (Figure 1D). Further, Wt1+/R394W mice demonstrate a trend toward a decreased myeloid to erythroid (M:E) cell ratio in the bone marrow compared to wild type mice (mean M:E, 2.1 ± 0.29 vs. 2.8 ± 0.26 for wild type, p = 0.14; Supplementary Figure 2). A limited flow cytometry panel performed on Wt1+/R394W bone marrow and splenocytes demonstrated no abnormal population (data not shown). Thus, Wt1+/R394W mice, with incomplete penetrance, develop a primary marrow disorder that closely recapitulates MDS with single lineage dysplasia (formerly refractory anemia) whereas the vast majority of age-matched wild type controls have no evidence of marrow disease. None of the knock-in Wt1+/R394W mice developed overt leukemia.
Wt1+/R394W bone marrow demonstrates expansion of hematopoietic progenitor cells
In order to determine if young Wt1+/R394W mice demonstrate any early abnormalities in hematopoiesis, we evaluated cohorts of 2-month old mice. Wt1+/R394W mice have mild splenomegaly compared to wild type mice (spleen weights, 0.11 ± 0.005 g vs. 0.09 ± 0.007 g for wild type, p = 0.049), but there were no appreciable differences in the peripheral blood counts between 2-month old wild type and Wt1+/R394W littermates (Supplementary Figure 3). In the bone marrow, we observe an overall increase in the number of progenitor cells in Wt1+/R394W mice, with a statistically significant increase in the common myeloid progenitor (CMP; mean absolute number of CMPs per 5 × 10⁵ bone marrow cells, 5811 ± 560 vs. 1973 ± 486 for wild type, p = 0.002) and megakaryocyte-erythroid progenitor (MEP; mean absolute number of MEPs per 5 × 10⁵ bone marrow cells, 12143 ± 2809 vs. 3659 ± 839 for wild type, p = 0.028) compartments (Figure 2A). Flow cytometry did not reveal any abnormalities in the differentiated cell populations in the bone marrow (data not shown). In methylcellulose colony-forming assays, lineage-depleted bone marrow cells from 2-month old Wt1+/R394W mice demonstrate a significant decrease in the number of erythroid colonies (BFU-E) formed compared to wild type (Figure 2B–2C). Together, these data indicate that subgroups of Wt1+/R394W progenitor cells are aberrantly expanded in number in vivo, and demonstrate ineffective erythropoiesis in vitro.
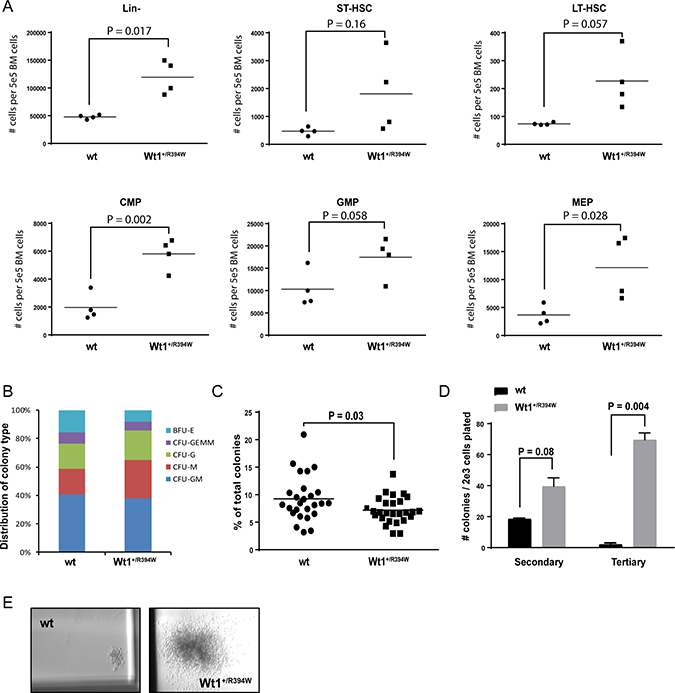
Figure 2: In vitro progenitor cell analysis of 2-month old wild type (wt) and Wt1+/R394W bone marrow. (A) Absolute number of cells in each progenitor cell compartment per 5 × 10⁵ live bone marrow cells of wt or Wt1+/R394W mice (n = 4 each), as analyzed by flow cytometry. Short-term hematopoietic stem cells (ST-HSCs) were defined as lineage (Lin)-sca1+ckit+ (LSK) and CD34+135–; long-term (LT)-HSCs as LSK and CD34–135–; common myeloid progenitors (CMP) as Lin-sca-ckit+CD34+FcγR-; granulocyte-monocyte progenitors (GMP) as Lin-sca-ckit+CD34+FcγR+; and megakaryocyte-erythroid progenitors (MEP) as Lin-sca-ckit+CD34-FcγR–. (B) Distribution of colony type formation in methylcellulose culture at Day 7 after initial plating. Lineage-depleted bone marrow cells from 2-month old mice were originally plated at 2 × 10³ cells per mL of methylcellulose, in triplicate. Results are representative of nine separate experiments. BFU-E = burst-forming unit-erythroid; CFU-GEMM = colony-forming unit-granulocyte, erythrocyte, monocyte/macrophage, megakaryocyte; CFU-G = colony-forming unit-granulocyte; CFU-M = colony-forming unit-macrophage; CFU-GM = colony-forming unit-granulocyte/macrophage. (C) Number of BFU-E colonies generated from Wt1+/R394W lineage-depleted bone marrow compared to wt bone marrow at Day 7. (D) Colony counts after secondary and tertiary re-plating of Wt1+/R394W or wt bone marrow cells in methylcellulose culture, done in triplicate. Cells were harvested and re-plated every 10–12 days. (E) Representative colony size at tertiary re-plating (magnification 20×). Horizontal bars represent the mean values, error bars represent the SEM.
We also found that Wt1+/R394W progenitor cells possess significantly increased serial re-plating capacity, with markedly increased colony number and size at tertiary plating (mean colony number, 69.5 vs. 2 for wild type, p = 0.004; Figure 2D–2E). These data suggest that the Wt1 R394W mutation leads to aberrant self-renewal capacity in vitro, indicative of transformative potential.
Wt1+/R394W megakaryocyte-erythroid progenitor cells demonstrate a functional disadvantage in a competitive transplant model
Given the enhanced self-renewal capacity of the Wt1+/R394W stem cells in vitro, we sought to determine if the Wt1 mutation confers a competitive advantage in vivo. Using a 1:1 mixture of wild type CD45.1 bone marrow and either wild type or Wt1+/R394W CD45.2 bone marrow (Figure 3A), cells were transplanted into lethally irradiated CD45.1 recipients (n = 5 recipient mice/each). As expected, we observe an average of roughly 50% engraftment of CD45.2 wild type cells at both 4 and 12 weeks, as measured by peripheral blood chimerism (Supplementary Figure 4A). Interestingly, despite an early engraftment disadvantage (less than 50% at 4 weeks), the Wt1+/R394W CD45.2 cells demonstrate improved engraftment in the peripheral blood at 12 weeks post-transplant.
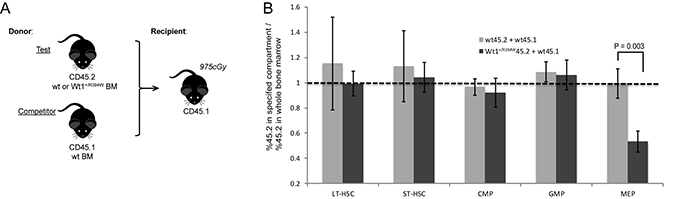
Figure 3: Competitive bone marrow transplant with wild type (wt) and Wt1+/R394W progenitor cells. (A) Competitive transplant schema. N = 5 mice in each test group (wt or Wt1+/R394W CD45.2 cells). (B) Engraftment contribution of CD45.2 bone marrow to each individual progenitor cell compartment at 16 weeks after transplant. Ratio of 1 (dotted horizontal line) defines an equal contribution of CD45.2 cells to that compartment normalized to the amount of CD45.2 cells in the total bone marrow. (ST-HSCs = short-term hematopoietic stem cells, LT-HSCs = long-term hematopoietic stem cells, CMP = common myeloid progenitors, GMP = granulocyte-monocyte progenitors, and MEP = megakaryocyte-erythroid progenitors). Error bars represent the SD.
Sixteen weeks after transplant, we sacrificed the mice and evaluated the engraftment contribution of CD45.2 cells in the bone marrow. We found no statistically significant competitive advantage of the CD45.2 Wt1+/R394W cells in the bone marrow (mean CD45.2%, 63.5 ± 12.6% for Wt1+/R394W vs. 53.5 ± 10.2% for wild type; p = 0.21; Supplementary Figure 4B). Therefore, although the R394W Wt1 mutation clearly leads to increased progenitor cell self-renewal in vitro (Figure 2D–2E), it does not confer a fully proliferative competitive advantage in vivo. We next evaluated the relative engraftment contribution of CD45.2 bone marrow to each individual progenitor cell compartment (Figure 3B). A ratio of 1 suggests an equal contribution of CD45.2 cells to that compartment, normalized to the amount of CD45.2 cells in the total bone marrow. In the control group that received wild type CD45.2 donor bone marrow, all compartments have an equal relative engraftment of CD45.2. Interestingly, the Wt1+/R394W CD45.2 bone marrow exhibit a statistically significant, relative engraftment disadvantage in the MEP compartment (mean ratio 0.53 ± 0.08 vs. 1.0 ± 0.12 for wild type, p = 0.003). Thus, although the MEPs are numerically expanded in the bone marrow of Wt1+/R394W mice (Figure 2A), these competitive repopulation data suggest that the Wt1+/R394W MEPs are functionally abnormal, complementary to our finding that Wt1+/R394W mice develop MDS characterized by dyserythropoiesis and anemia.
Wt1+/R394W mice with concomitant Flt3/ITD mutations develop MDS/MPN
Patients with AML and WT1 mutations frequently also harbor FLT3/ITD mutations, suggesting cooperative leukemogenesis [9, 11]. Therefore, we utilized a previously described knock-in mouse model heterozygous for a Flt3/ITD mutation (Flt3+/ITD), and crossbred these with Wt1+/R394W mice. Flt3+/ITD mice develop a fatal myeloproliferative neoplasm (MPN) at a mean latency of 10 months, but do not independently develop myeloid leukemia [23]. In other Flt3/ITD cooperative models, both myeloid and lymphoid leukemic phenotypes have been observed [24, 25]. Here, we found that mice harboring both mutations (Flt3+/ITD/Wt1+/R394W) have an inferior survival compared to Flt3+/ITD mice (p < 0.001; Figure 4A). By flow cytometry analysis, Flt3+/ITD/Wt1+/R394W mice develop either an MPN-like disease or T cell acute lymphoblastic leukemia (T-ALL; not shown) similar to Flt3+/ITD mice previously described, although with a shorter average latency. One of 17 evaluated Flt3+/ITD mice did develop AML, though this mouse was found to have loss of heterozygosity (LOH) of the wild type Flt3 allele (Supplementary Figure 5A). This phenomenon of LOH of wild type FLT3 has previously been described, and causes a more aggressive disease phenotype in both humans and mice [24, 26, 27]. Three of the Flt3+/ITD/Wt1+/R394W mice developed AML, one of which had LOH of wild type Flt3.
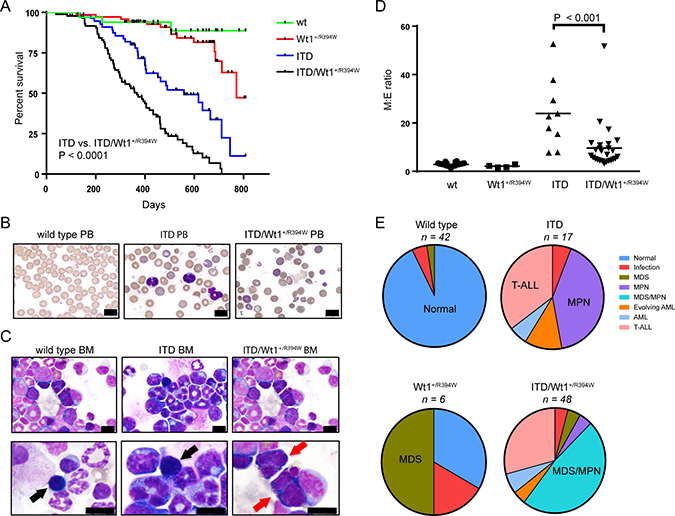
Figure 4: Hematologic characterization of a crossbred Wt1+/R394W x Flt3+/ITD mouse model. (A) Kaplan–Meier survival curve of the crossbred mice containing both mutations (ITD/Wt1+/R394W) compared to mice with either mutation alone (Wt1+/R394W, p < 0.0001 or ITD, p < 0.0001) and compared to wild type (wt) littermates. (B) Representative peripheral blood smears from wt, ITD, and ITD/Wt1+/R394W mice(40×; scale bars are 10 microns). (C) Representative bone marrow cytospins from wt, ITD, and ITD/Wt1+/R394Wmice. Black arrows point to normal erythroid precursors, and red arrows indicate erythroid precursors with dysplastic changes in the ITD/Wt1+/R394W mice (top row 40×, bottom row 100×; all scale bars are 10 microns). (D) Comparison of myeloid to erythroid (M:E) ratios in the bone marrow of each genotype. Mean values for each genotype: wt 2.89 ± 0.12 (n = 40), Wt1+/R934W 2.13 ± 0.29 (n = 4), ITD 32.46 ± 5.94 (n = 12), ITD/Wt1+/R394W 10.11 ± 1.67 (n = 32). Horizontal bars represent the mean values, error bars represent the SEM. (E) Distribution of hematologic phenotype by mouse genotype. Phenotype definitions are based on the Bethesda classification, and the predominant phenotype in each genotype is highlighted. MDS = myelodysplastic syndrome, MPN = myeloproliferative neoplasm, AML = acute myeloid leukemia, T-ALL = T-cell acute lymphoblastic leukemia.
Although 35% (6/17) of Flt3+/ITD mice and 29% (14/48) of Flt3+/ITD/Wt1+/R394W mice developed T-ALL, we were specifically interested in studying the impact of these mutations on myeloid development. Analysis of mice that died of myeloid disease shows that Flt3+/ITD/Wt1+/R394W mice have lower median hemoglobin values compared to mice with either mutation alone, though these differences are not statistically significant (Supplementary Figure 6). In the peripheral blood, Flt3+/ITD mice have circulating atypical monocytes (as previously described) [23] and red blood cell (RBC) polychromasia, suggesting increased premature release of RBCs from the marrow (Figure 4B). Flt3+/ITD/Wt1+/R394W mice also demonstrate RBC polychromasia in the peripheral blood, but have more pronounced RBC fragmentation and anisopoikilocytosis (Figure 4B). The bone marrow morphology of Flt3+/ITD mice demonstrates a marked myeloid predominance compared to wild type bone marrow, with a relatively decreased number of erythroid precursors, consistent with an MPN (Figure 4C). Though few in number, the erythroid precursors in the Flt3+/ITD bone marrow show no overt dysplasia. In striking contrast, Flt3+/ITD/Wt1+/R394W mice exhibit dysplastic changes in the erythroid lineage with irregular nuclear borders and multinucleate erythroid precursors reminiscent of the Wt1+/R394W mice (Figure 4C), though with myeloid proliferation reflective of the ITD-induced MPN. The findings of both dysplastic and proliferative features in the Flt3+/ITD/Wt1+/R394W mice are compatible with a myelodysplastic disorder/myeloproliferative neoplasm (MDS/MPN) [28].
Further, we noted a relative increase in the number of erythroid precursors in the bone marrow of Flt3+/ITD/Wt1+/R394W mice compared to the Flt3+/ITD mice. Flt3+/ITD mice have very high M:E ratios due to the proliferation of myeloid precursors, and the highest M:E ratios were seen in mice with ITD mutations and LOH of wild type Flt3. In contrast, Flt3+/ITD/Wt1+/R394W mice have relatively lower M:E ratios (mean M:E ratio, 10.11 ± 1.67 vs. 32.46 ± 5.94 for Flt3+/ITD; Figure 4D), consistent with the increased erythroid precursors also seen in the Wt1+/R394W mice. In comparing the small numbers of mice with Flt3 LOH, the M:E ratios are again lower in the Flt3+/ITD/Wt1+/R394W mice compared to Flt3+/ITD mice (Supplementary Figure 5B). Therefore, each genotype is associated with characteristic hematologic phenotypes (Figure 4E, Table 1). The vast majority of wild type mice have normal bone marrow, the majority of Flt3+/ITD mice develop a myeloid neoplasm (primarily MPN), the predominant phenotype in the Wt1+/R394W mice evaluated is MDS, and the majority of Flt3+/ITD/Wt1+/R394W mice develop an MDS/MPN.
Table 1: Distribution of hematologic phenotype by mouse genotype
Disease Phenotype |
Wild type (n = 42) |
Wt1+/R394W (n = 6) |
Flt3/+/ITD (n = 17) |
Flt3/+/ITD/Wt1+/R394W (n = 48) |
|---|---|---|---|---|
Normal |
39 (93%) |
2 (33%) |
0 (0%) |
0 (0%) |
Infection |
2 (5%) |
1 (17%) |
1 (6%) |
2 (4%) |
MDS |
1 (2%) |
3 (50%) |
0 (0%) |
2 (4%) |
MPN |
0 (0%) |
0 (0%) |
7 (41%) |
2 (4%) |
MDS/MPN |
0 (0%) |
0 (0%) |
0 (0%) |
23 (48%) |
Evolving AML |
0 (0%) |
0 (0%) |
2 (12%) |
2 (4%) |
AML |
0 (0%) |
0 (0%) |
1 (6%) |
3 (6%) |
T-ALL |
0 (0%) |
0 (0%) |
6 (35%) |
14 (29%) |
Abbreviations: MDS = myelodysplastic syndrome, MPN = myeloproliferative neoplasm, AML = acute myeloid leukemia, T-ALL = T-cell acute lymphoblastic leukemia.
Transplant model of Wt1+/R394W accelerates and enhances MDS phenotype
To isolate the hematopoietic effects of the mutations, we transplanted pre-disease bone marrow from six-to-eight month old mice from each genotype into lethally irradiated congenic CD45.1 mice (Figure 5A). The Flt3+/ITD/Wt1+/R394W bone marrow recipients demonstrate inferior survival compared to Wt1+/R394W recipients (p = 0.02), and the Wt1+/R394W bone marrow recipients show a trend toward inferior survival compared to wild type recipients (Figure 5B). Recipients of wild type bone marrow also have a shortened survival in this model, though in the majority of cases, there was no abnormal hematological phenotype found. We hypothesize the wild type marrow recipients may have eventually died from late radiation effects, although among other possibilities is graft versus host disease.
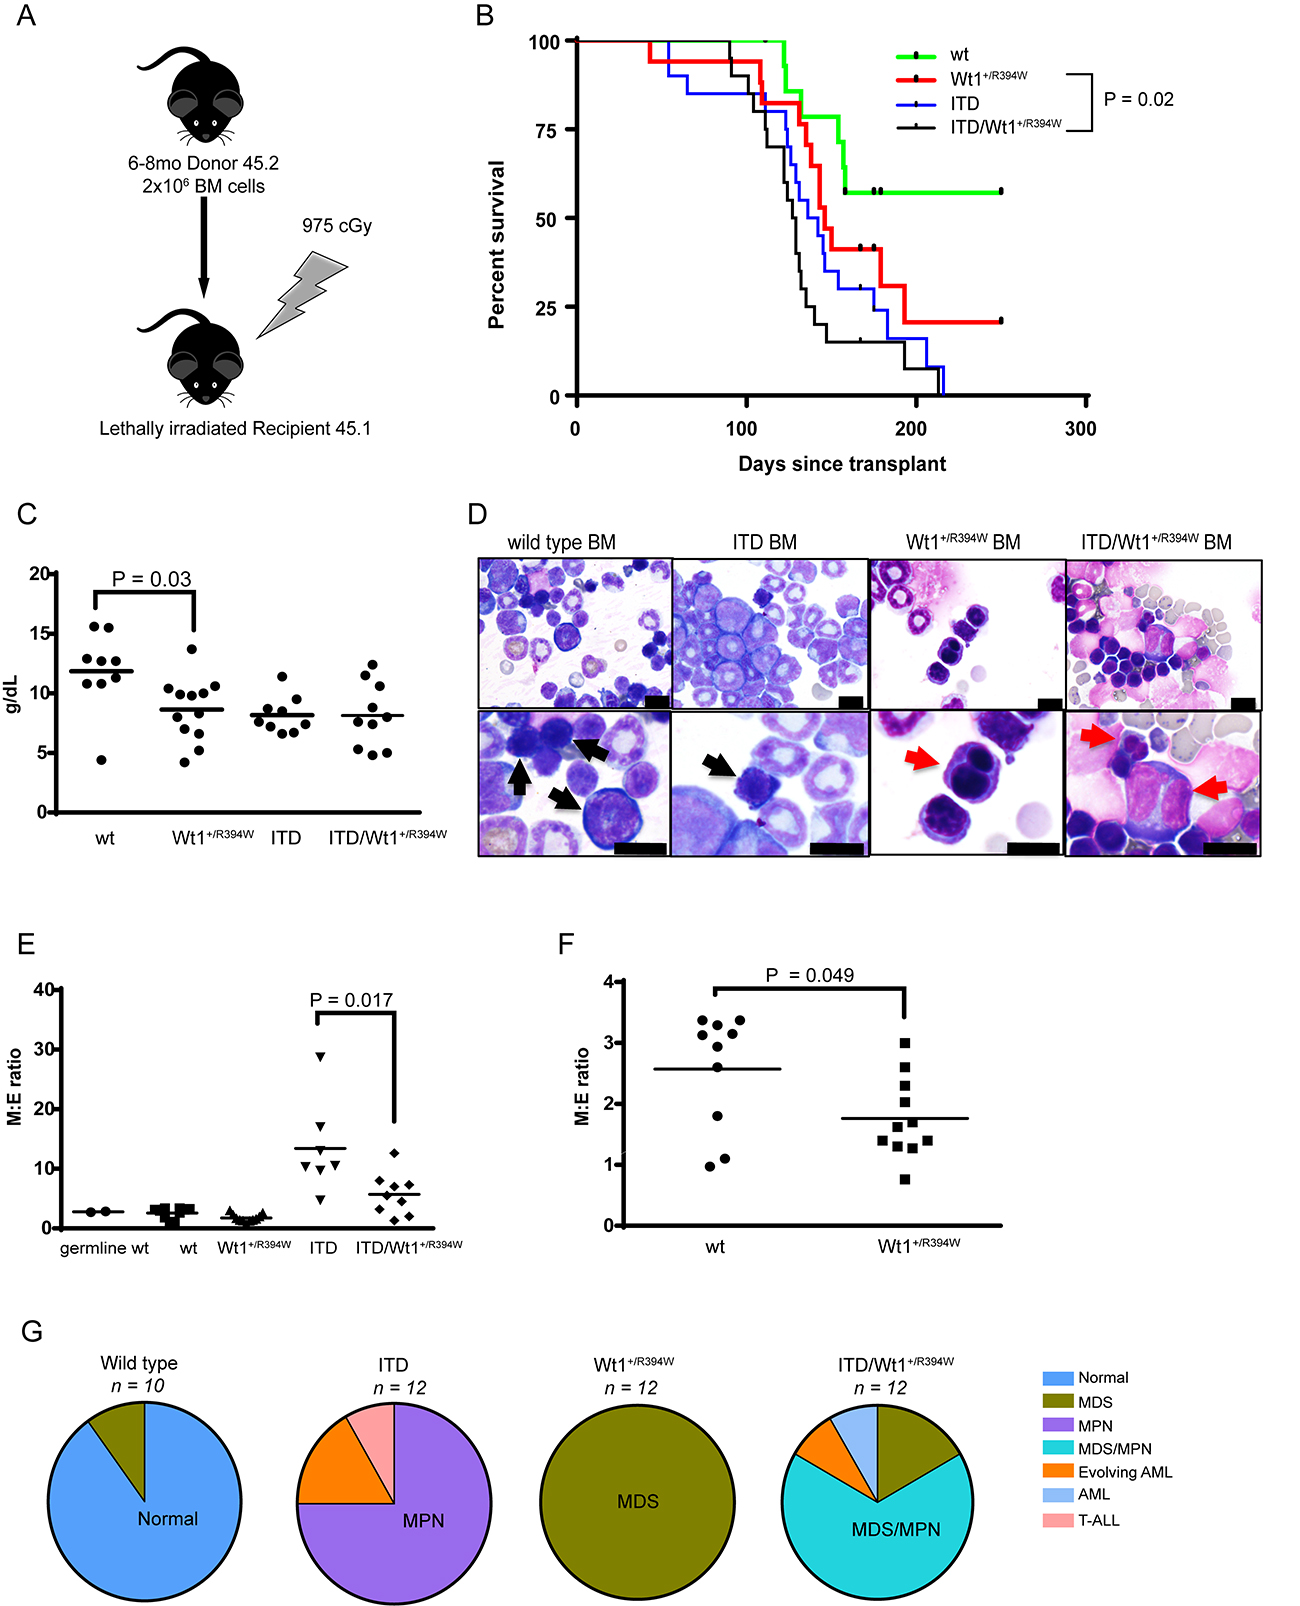
Figure 5: Hematologic characterization of a transplant model of Wt1+/R394W x Flt3+/ITD. (A) Schema of creation of transplant model. Donor mice were aged 6–8 months. (B) Kaplan–Meier survival curve of the transplanted mice: recipients of bone marrow with both mutations (ITD/Wt1+/R394W), either mutation alone (Wt1+/R394W or ITD), or wild type (wt). Survival is measured as days post-transplant; p = 0.2 for ITD vs. ITD/Wt1+/R394W; p=0.02 for Wt1+/R394W vs. ITD/Wt1+/R394W; p = 0.14 for Wt1+/R394W vs. wt. (C) Hemoglobin values of transplanted moribund mice of each bone marrow genotype at time of sacrifice. Horizontal bars represent the mean hemoglobin value for each genotype: wt 11.86 ± 1.11 g/dL, Wt1+/R394W 8.64 ± 0.76 g/dL, ITD 8.18 ± 0.51 g/dL, ITD/Wt1+/R394W 8.14 ± 0.86 g/dL. (D) Representative bone marrow cytospins from wt, ITD, Wt1+/R394W and ITD/Wt1+/R394W recipient mice. Black arrows indicate normal erythroid precursors in the wt and ITD bone marrows, and red arrows point to the dysplastic erythroid precursors in the Wt1+/R394W and ITD/Wt1+/R394W bone marrows (top row 40×, bottom row 100×; all scale bars are 10 microns). (E) Comparison of myeloid to erythroid (M:E) ratios in the bone marrow. Mean values: germ line wt 2.78 ± 0.11; transplanted wt 2.57 ± 0.3, Wt1+/R394W 1.76 ± 0.2, ITD 13.41 ± 2.91, ITD/Wt1+/R394W 5.71 ± 1.17. (F) Zoomed view comparison of M:E ratios in Wt1+/R394W versus wt transplanted bone marrow. Horizontal bars represent the mean value. (G) Distribution of hematologic phenotype by bone marrow genotype of the transplanted mice. The predominant phenotype in each genotype is highlighted. MDS = myelodysplastic syndrome, MPN = myeloproliferative neoplasm, AML = acute myeloid leukemia, T-ALL = T-cell acute lymphoblastic leukemia.
This transplant model recapitulates the phenotypes observed in the germline models of these mutations, with a shorter latency to disease onset. Anemia is observed in recipients of all abnormal marrow genotypes, but not in wild type bone marrow recipients (mean hemoglobin, 8.64 ± 0.76 g/dL for Wt1+/R394W recipients, vs. 11.86 ± 1.11 g/dL for wild type, p = 0.03; Figure 5C). Morphologic examination of the bone marrow demonstrates erythrodysplasia in all Wt1+/R394W recipient mice, myeloid proliferation in the majority of the Flt3+/ITD recipient mice, and features of both MDS and MPN in the majority of the Flt3+/ITD/Wt1+/R394W recipient mice (Figure 5D). T-ALL in recipients of ITD mutant bone marrow is rare in this transplant model. We determined the M:E ratios of these transplanted mice, and observe a similar pattern similar to that seen in the germline model (Figure 5E–5F). Therefore, the predominant hematologic phenotypes are the same in this transplant model as compared to the germline mutant mice (Figure 5G, Table 2). Strikingly, in this model, 100% of the evaluable Wt1+/R394W marrow transplant recipients develop MDS. These data demonstrate that the Wt1 R394W mutation consistently produces transplantable myeloid neoplasms in a mouse model.
Table 2: Distribution of hematologic phenotype by bone marrow genotype of transplanted mice
Disease Phenotype |
Wild type BM (n = 10) |
Wt1+/R394W BM (n = 12) |
Flt3/+/ITD BM (n = 12) |
Flt3/+/ITD/Wt1+/R394W BM (n = 12) |
|---|---|---|---|---|
Normal |
9 (90%) |
0 (0%) |
0 (0%) |
0 (0%) |
Infection |
0 (0%) |
0 (0%) |
0 (0%) |
0 (0%) |
MDS |
1 (10%) |
12 (100%) |
0 (0%) |
2 (17%) |
MPN |
0 (0%) |
0 (0%) |
9 (75%) |
0 (0%) |
MDS/MPN |
0 (0%) |
0 (0%) |
0 (0%) |
8 (67%) |
Evolving AML |
0 (0%) |
0 (0%) |
2 (17%) |
1 (8%) |
AML |
0 (0%) |
0 (0%) |
0 (0%) |
1 (8%) |
T-ALL |
0 (0%) |
0 (0%) |
1 (8%) |
0 (0%) |
Abbreviations: BM = bone marrow, MDS = myelodysplastic syndrome, MPN = myeloproliferative neoplasm, AML = acute myeloid leukemia, T-ALL = T-cell acute lymphoblastic leukemia.
DISCUSSION
Multiple reports have shown that WT1 mutations are a recurrent event in AML and MDS, yet it is not well understood how WT1 mutations contribute to the development of hematologic malignancies. In the present study, we show that mice heterozygous for a knocked-in Wt1 R394W mutation can develop anemia with concomitant erythroid dysplasia, consistent with ineffective erythropoiesis and MDS. In human disease, MDS limited to the erythroid series often does not show overt phenotypic abnormalities in a limited flow panel; therefore, the normal flow cytometry analysis of bone marrow from moribund Wt1+/R394W mice with MDS in our series was not unexpected. We found that Wt1+/R394W mice demonstrate disordered hematopoiesis as young as two months of age, as evidenced by an abnormal quantity and quality of myeloid progenitor cell compartments, and Wt1+/R394W hematopoietic progenitor cells demonstrate aberrant self-renewal behavior in vitro. Interestingly, in a competitive in vivo model, Wt1 mutant cells exhibited a relative repopulation disadvantage, specific to the MEP compartment. We found that marrow reconstitution with a heterozygous Wt1 R394W in a lethally irradiated transplant mouse model results in the development of MDS with a shortened latency and with 100% penetrance, whereas not all mice in the germline model developed MDS. Conversely, only one of 10 mice (10%) transplanted with wild type bone marrow developed signs of MDS. This is compelling evidence that the Wt1 R394W mutation is sufficient to cause MDS.
Further, when we crossed Flt3+/ITD mice with Wt1+/R394W mice, the majority of double mutant offspring developed an MDS/MPN. These mice displayed disease manifestations of shortened survival, myeloid expansion in the bone marrow (exaggerated in cases of LOH of wild type Flt3), anemia, erythroid dysplasia, and a relatively decreased M:E ratio compared to the Flt3+/ITD mice. Although coincident Flt3/ITD and Wt1/R394W mutations do not appear sufficient to consistently recapitulate human AML in a mouse model, our results demonstrate that Flt3/ITD and Wt1/R394W mutations are capable of cooperation, resulting in a more aggressive disease than resulted from either individual mutant genotype alone. Of interest, a small number of mice with Flt3/ITD with or without a Wt1 mutation did develop AML, suggesting that an additional acquired “hit” may have contributed to leukemogenesis in these mice.
Previous mouse models have examined the effect of loss of Wt1 on murine hematopoiesis. Chimeric mice generated from a mixture of normal blastocysts and embryonic stem cells with homozygous loss of Wt1 showed that cells lacking Wt1 did not contribute to the hematopoietic system in a competitive environment [29]; an interesting parallel to the relative lack of contribution of Wt1+/R394W bone marrow cells to the MEP compartment in our competitive repopulation model. Another study found that Wt1 null fetal liver cells could normally repopulate the hematopoietic system in lethally irradiated adult mice in the absence of competition, and found no difference in in vitro colony forming capacity between wild type and Wt1 null cells [30]. Finally, a recent study demonstrated that a subset of aged Wt1-haploinsufficient mice developed features of myeloproliferation and myelodysplasia, including hepatomegaly with CD45+/Mac1+/Gr1+ infiltration, and megakaryocyte dysplasia in the bone marrow [31]. Further, a subset of secondary transplant recipients of Wt1-haploinsufficent bone marrow developed T-ALL after acquiring additional mutations in known leukemic alleles such as Notch1. In comparison, our data supports that the R394W Wt1 mutation behaves in a dominant fashion to induce dyserythropoiesis and myeloid neoplasms. Pronier et al. showed that C57BL/6 mice homozygous for Flt3/ITD and Wt1-haploinsufficient developed AML, whereas mice heterozygous for Flt3/ITD and Wt1-haploinsufficent did not develop leukemia [31]. In comparison, a subset of our Flt3+/ITD/Wt1+/R394W mice developed AML, including one mouse with LOH of Flt3. Overall, there is mounting evidence for the role of disrupted WT1 function contributing to the development of hematologic malignancies.
Interestingly, there are several striking similarities between our mouse model and Tet2 knockout mouse models. A model of complete conditional Tet2 loss in the hematopoietic compartment demonstrates increased stem cell self-renewal in vitro by serial replating studies and in vivo by competitive transplant studies, occurring to a lesser degree with haploinsufficient Tet2 cells, and mice develop a phenotype resembling chronic myelomonocytic leukemia (CMML) [32]. In a knockout Tet2 model, mice developed a variety of myeloid malignancies, including CMML, MPN, and MDS; and bone marrow showed a decreased M:E ratio with erythroid infiltration [33]. In another model, concurrent deletion of Tet2 and Ezh2 cooperated to cause more advanced myelodysplasia and accelerated the development of myeloid disorders including MDS/MPN [34]. These similarities are of interest to the present study, as reports of mutual exclusivity among WT1, TET2 and IDH mutations in human AML [35] and a physical interaction between WT1 and TET2 suggest these mutations converge on a common functional pathway [36].
Our novel observations generate several hypotheses. The irregular expansion and dysfunction of pre-disease Wt1 mutant hematopoietic MEP progenitor cells in our model, coupled with the eventual development of erythroid dysplasia and anemia in the Wt1 mutant mouse model, indicate that a mutation in Wt1 leads to a disease phenotype by interfering with normal erythropoiesis. Preliminary in vitro work from our lab suggest that WT1 mutations can block terminal myeloid differentiation [37], and the results from our mouse model suggest Wt1 mutations may lead to disordered erythroid maturation and differentiation. This model could also be used to further explore the functional interaction between WT1 and TET2. Evidence supports a functional relationship between WT1 and TET2, and it has been demonstrated that WT1 alters gene expression, methylation and hydroxymethylation [36, 38]. Promoter DNA methylation profiling of WT1 mutant AML patient samples demonstrated aberrant hypermethylation compared to wild type bone marrow or AML1-ETO AML [38]. Significant overlap was seen between hypermethylated loci in WT1-mutant AML compared to that seen in TET2- and IDH1/2-mutant AML patient samples, further supporting a common oncogenic pathway involving these genes [38]. Rampal et al. also reported a global decrease in DNA hydroxymethylation (5-hmC) levels in WT1-, TET2-, and IDH1/2-mutant AML samples [38]. Our Wt1+/R394W mouse model can serve as a tool to further investigate differences in DNA methylation and hydroxymethylation, both globally and at the gene level, in the setting of a leukemogenic WT1 mutation, which has potential therapeutic implications.
There are several limitations to the current study. The knock-in germline Wt1+/R394W mice develop MDS, but only after a long latency and with incomplete penetrance. Although this pattern does in fact recapitulate the timeline and penetrance of human disease, this model alone could make disease study challenging. Additionally, the Wt1+/R394W germline mouse model has potential to develop Denys-Drash syndrome in a strain-dependent manner, leading to other non-hematopoietic morbidities. We did not observe clinically significant DDS in the model described here. Importantly, both of these potential limitations are addressed by utilizing a transplant model, which limits the expression of mutant Wt1 to the hematopoietic system, and leads to increased penetrance of disease with a shortened latency. It is interesting that only 3–4% of MDS patients are reported to have WT1 mutations, although a significant proportion of patients with MDS have TET2 mutations, and therefore are unlikely to harbor concurrent WT1 mutations if these mutations are linked in a common functional pathway.
In our model, roughly a third of mice with Flt3/ITD mutations develop T-ALL. FLT3/ITD mutations are observed in human T-ALL [39], and a combination of myeloid and lymphoid malignancies have previously been reported in cooperative mouse models with ITD mutations [24, 25]. However, the majority of Flt3+/ITD mice in our model developed MPN, and the majority of Flt3+/ITD/Wt1+/R394W mice developed MDS/MPN. In the transplant model, T-ALL was only rarely observed in mice with Flt3/ITD mutant bone marrow. The Flt3/ITD and Wt1 mutations did not consistently cooperate to recapitulate human AML in our model; thus, a third hit is likely necessary to transform fully to leukemia. These mutations did, however, demonstrate cooperativity by resulting in inferior survival and more aggressive myeloid neoplasms.
In conclusion, we demonstrate here that the presence of Wt1+/R394W in the murine hematopoietic system leads to the development of MDS with single lineage dysplasia, manifested as anemia and erythroid dysplasia, and contributing to a trend in decreased survival. Additionally, mice with both Wt1/R394W and Flt3/ITD mutations develop an aggressive mixed MDS/MPN. To our knowledge, this is the first characterization of a hematologic phenotype of a WT1 mutation in vivo, and provides an important research tool given a relative paucity of MDS model systems.
MATERIALS AND METHODS
Mouse models
Mice in a mixed C57BL/6 and 129/SvEv background and heterozygous for the point mutation C1180T knocked into in exon 9 of the Wt1 gene (encoding the amino acid change R394W), and C57BL/6 mice heterozygous for an 18-base pair ITD knocked into the juxtamembrane domain of the Flt3 gene, had been generated previously [21, 23]. The Wt1+/R394W mice were backcrossed to a C57BL/6 background. These two models were crossbred and offspring were characterized as wild type, positive for the Wt1 R394W mutation (Wt1+/R394W), positive for the Flt3/ITD mutation (Flt3+/ITD), or positive for both mutations (Flt3+/ITD/Wt1+/R394W), based on PCR analysis of germline DNA using primers previously described [21, 23].
Complete blood count and cytology
Complete blood cell counting was performed using the Hemavet950 (Drew Scientific). Peripheral blood smears and cytospins were visualized using a modified Wright-Giemsa stain (Sigma-Aldrich). Representative histopathology images were acquired using an Olympus BX46 microscope with an Olympus DP72 camera (at 100×). The image acquisition software used was Olympus CellSens Standard 1.5.
Erythropoietin quantification
Erythropoietin levels from mouse serum were measured using the Quantikine® ELISA Mouse Erythropoietin Immunoassay (R&D Systems, Minneapolis, MD, USA). Briefly, mouse plasma was diluted and processed along with internal standards, adding mouse erythropoietin conjugate to wells prior to quantification on a microplate reader (Bio-Rad, Hercules, CA, USA) at 450 and 540 nm. Readings from 540 nm were subtracted from the 450 nm readings. A standard curve was generated, and sample data were plotted against the standard curve.
In vitro clonogenic and serial re-plating assays
Lineage-negative bone marrow progenitor cells from 2-month-old mice were plated at 2 × 10³ cells/mL in methylcellulose medium supplemented with recombinant murine SCF (50 ng/mL), IL-3 (10 ng/mL), IL-6 (10 ng/mL), GM-CSF (10 ng/mL), and EPO (3U/mL) (Methocult M3434: StemCell technologies, Vancouver, BC, USA). Lineage depletion was performed as previously described, using a magnetic-column exclusion method [23]. Colonies in methylcellulose were scored 9–11 days after plating. For serial re-plating, cells were passaged in fresh methylcellulose every 10–12 days. Cells were isolated from the plates and analyzed by flow cytometry. Experiments were performed in triplicate.
Flow cytometry
Cells were prepared and stained as previously described [24] with details in supplemental methods.
Competitive bone marrow repopulation assay
A total of 5 × 10⁵ CD45.1+ competitor bone marrow cells obtained from wild type B6-Ly5.2 (CD45.1+ mice; National Cancer Institute and Charles River) were mixed with 5 × 10⁵ CD45.2+ test bone marrow cells (wild type or Wt1+/R394W mice) and injected retroorbitally into lethally irradiated (975c Gy) B6-Ly5.2 recipient mice. Beginning at 4 weeks after transplant, peripheral blood cells were analyzed for CD45.1 and CD45.2 expression by flow cytometry.
Transplant mouse model
Wild type CD45.1+ mice (National Cancer Institute) received 975cGy of gamma irradiation, followed by retroorbital injection of 2 × 10⁶ whole bone marrow cells from CD45.2+ wild type, Wt1+/R394W, Flt3+/ITD or Flt3+/ITD/Wt1+/R394W mice. Donor CD45.2+ mice were six to eight months of age, and donor marrow was pre-disease or had mild characteristics of early hematopoietic disease. Engraftment was evaluated by the percentage of CD45.2+ cells in the peripheral blood of recipient mice, as measured by flow cytometry. All animal experiments were reviewed and approved by the Johns Hopkins University Animal Care and Use Committee.
Statistics
Data are expressed as the mean ± SEM or SD, where applicable. Unpaired t-tests or log-rank tests were used to compare groups (GraphPad Prism, LaJolla, CA, USA). Mantel-Cox log-rank tests were used to compare survival between groups. Values of p < 0.05 were considered to be significant.
Author contributions
C.E.A., D.L. and P.B. designed the research; C.E.A, R.E.R., and D.M. performed the mouse experiments; C.E.A. and R.E.R. performed the in vitro experiments; A.S.D. performed immunohistochemistry and photographed cytospins of mouse tissues; V.H., L.L, and D.S. developed and provided the mouse models; C.E.A., C.A.R., A.S.D., R.E.R., D.L and P.B. analyzed data; and C.E.A, C.A.R., D.L. and P.B. wrote the manuscript.
ACKNOWLEDGMENTS
The authors thank the members of the Brown, Loeb and Small laboratories for providing informative discussion and helpful suggestions. The Giant Food Pediatric Oncology Research Fund supported use of the FACSCalibur. An institutional grant from the National Institutes of Health (P30 CA006973) supported the use of core laboratory equipment and animal facilities.
CONFLICTS OF INTEREST
V.H. has ownership interest in Codified Genomics, LLC. The remaining authors declare no competing financial interests.
FUNDING
This work was supported in part by the St. Baldrick’s Foundation (Post-Doctoral Fellowship for Childhood Cancer Research Award, to C.E.A.), the Damon Runyon Cancer Research Foundation (Damon Runyon-Sohn Pediatric Fellowship Award, to C.A.R.), the Leukemia and Lymphoma Society (Translational Research Program Grant, Scholar in Clinical Research Award, to P.B.), and the American Cancer Society (Research Scholar Grant, to P.B.).
Editorial note
This paper has been accepted based in part on peer-review conducted by another journal and the authors’ response and revisions as well as expedited peer-review in Oncotarget.
REFERENCES
1. Ellisen LW, Carlesso N, Cheng T, Scadden DT, Haber DA. The Wilms tumor suppressor WT1 directs stage-specific quiescence and differentiation of human hematopoietic progenitor cells. EMBO J. 2001; 20:1897–909. https://doi.org/10.1093/emboj/20.8.1897.
2. Scharnhorst V, van der Eb AJ, Jochemsen AG. WT1 proteins: functions in growth and differentiation. Gene. 2001; 273:141–61. https://doi.org/10.1016/S0378-1119(01)00593-5.
3. Bergmann L, Miething C, Maurer U, Brieger J, Karakas T, Weidmann E, Hoelzer D. High levels of Wilms’ tumor gene (wt1) mRNA in acute myeloid leukemias are associated with a worse long-term outcome. Blood. 1997; 90:1217–25.
4. Schmid D, Heinze G, Linnerth B, Tisljar K, Kusec R, Geissler K, Sillaber C, Laczika K, Mitterbauer M, Zöchbauer S, Mannhalter C, Haas OA, Lechner K, et al. Prognostic significance of WT1 gene expression at diagnosis in adult de novo acute myeloid leukemia. Leukemia. 1997; 11:639–43. https://doi.org/10.1038/sj.leu.2400620.
5. Trka J, Kalinová M, Hrusák O, Zuna J, Krejcí O, Madzo J, Sedlácek P, Vávra V, Michalová K, Jarosová M, Starý J, and For Czech Paediatric Haematology Working Group. Real-time quantitative PCR detection of WT1 gene expression in children with AML: prognostic significance, correlation with disease status and residual disease detection by flow cytometry. Leukemia. 2002; 16:1381–89. https://doi.org/10.1038/sj.leu.2402512.
6. Noronha SA, Farrar JE, Alonzo TA, Gerbing RB, Lacayo NJ, Dahl GV, Ravindranath Y, Arceci RJ, Loeb DM. WT1 expression at diagnosis does not predict survival in pediatric AML: a report from the Children’s Oncology Group. Pediatr Blood Cancer. 2009; 53:1136–39. https://doi.org/10.1002/pbc.22142.
7. Ho PA, Alonzo TA, Gerbing RB, Kuhn J, Pollard JA, Hirsch B, Raimondi SC, Gamis AS, Meshinchi S. The prognostic effect of high diagnostic WT1 gene expression in pediatric AML depends on WT1 SNP rs16754 status: report from the Children’s Oncology Group. Pediatr Blood Cancer. 2014; 61:81–88. https://doi.org/10.1002/pbc.24700.
8. Pritchard-Jones K, Renshaw J, King-Underwood L. The Wilms tumour (WT1) gene is mutated in a secondary leukaemia in a WAGR patient. Hum Mol Genet. 1994; 3:1633–37. https://doi.org/10.1093/hmg/3.9.1633.
9. Summers K, Stevens J, Kakkas I, Smith M, Smith LL, Macdougall F, Cavenagh J, Bonnet D, Young BD, Lister TA, Fitzgibbon J. Wilms’ tumour 1 mutations are associated with FLT3-ITD and failure of standard induction chemotherapy in patients with normal karyotype AML. Leukemia. 2007; 21:550–51. https://doi.org/10.1038/sj.leu.2404514.
10. Paschka P, Marcucci G, Ruppert AS, Whitman SP, Mrózek K, Maharry K, Langer C, Baldus CD, Zhao W, Powell BL, Baer MR, Carroll AJ, Caligiuri MA, et al. Wilms’ tumor 1 gene mutations independently predict poor outcome in adults with cytogenetically normal acute myeloid leukemia: a cancer and leukemia group B study. J Clin Oncol. 2008; 26:4595–602. https://doi.org/10.1200/JCO.2007.15.2058.
11. Hollink IH, van den Heuvel-Eibrink MM, Zimmermann M, Balgobind BV, Arentsen-Peters ST, Alders M, Willasch A, Kaspers GJ, Trka J, Baruchel A, de Graaf SS, Creutzig U, Pieters R, et al. Clinical relevance of Wilms tumor 1 gene mutations in childhood acute myeloid leukemia. Blood. 2009; 113:5951–60. https://doi.org/10.1182/blood-2008-09-177949.
12. Ho PA, Zeng R, Alonzo TA, Gerbing RB, Miller KL, Pollard JA, Stirewalt DL, Heerema NA, Raimondi SC, Hirsch B, Franklin JL, Lange B, Meshinchi S. Prevalence and prognostic implications of WT1 mutations in pediatric acute myeloid leukemia (AML): a report from the Children’s Oncology Group. Blood. 2010; 116:702–10. https://doi.org/10.1182/blood-2010-02-268953.
13. Little MH, Williamson KA, Mannens M, Kelsey A, Gosden C, Hastie ND, van Heyningen V. Evidence that WT1 mutations in Denys-Drash syndrome patients may act in a dominant-negative fashion. Hum Mol Genet. 1993; 2:259–64. https://doi.org/10.1093/hmg/2.3.259.
14. Bejar R, Lord A, Stevenson K, Bar-Natan M, Pérez-Ladaga A, Zaneveld J, Wang H, Caughey B, Stojanov P, Getz G, Garcia-Manero G, Kantarjian H, Chen R, et al. TET2 mutations predict response to hypomethylating agents in myelodysplastic syndrome patients. Blood. 2014; 124:2705–12. https://doi.org/10.1182/blood-2014-06-582809.
15. Makishima H, Yoshizato T, Yoshida K, Sekeres MA, Radivoyevitch T, Suzuki H, Przychodzen B, Nagata Y, Meggendorfer M, Sanada M, Okuno Y, Hirsch C, Kuzmanovic T, et al. Dynamics of clonal evolution in myelodysplastic syndromes. Nat Genet. 2017; 49:204–12. https://doi.org/10.1038/ng.3742.
16. Xu F, Wu LY, He Q, Wu D, Zhang Z, Song LX, Zhao YS, Su JY, Zhou LY, Guo J, Chang CK, Li X. Exploration of the role of gene mutations in myelodysplastic syndromes through a sequencing design involving a small number of target genes. Sci Rep. 2017; 7:43113. https://doi.org/10.1038/srep43113.
17. Papaemmanuil E, Gerstung M, Malcovati L, Tauro S, Gundem G, Van Loo P, Yoon CJ, Ellis P, Wedge DC, Pellagatti A, Shlien A, Groves MJ, Forbes SA, et al, and Chronic Myeloid Disorders Working Group of the International Cancer Genome Consortium. Clinical and biological implications of driver mutations in myelodysplastic syndromes. Blood. 2013; 122:3616–27. https://doi.org/10.1182/blood-2013-08-518886.
18. Virappane P, Gale R, Hills R, Kakkas I, Summers K, Stevens J, Allen C, Green C, Quentmeier H, Drexler H, Burnett A, Linch D, Bonnet D, et al. Mutation of the Wilms’ tumor 1 gene is a poor prognostic factor associated with chemotherapy resistance in normal karyotype acute myeloid leukemia: the United Kingdom Medical Research Council Adult Leukaemia Working Party. J Clin Oncol. 2008; 26:5429–35. https://doi.org/10.1200/JCO.2008.16.0333.
19. Renneville A, Boissel N, Zurawski V, Llopis L, Biggio V, Nibourel O, Philippe N, Thomas X, Dombret H, Preudhomme C. Wilms tumor 1 gene mutations are associated with a higher risk of recurrence in young adults with acute myeloid leukemia: a study from the Acute Leukemia French Association. Cancer. 2009; 115:3719–27. https://doi.org/10.1002/cncr.24442.
20. Krauth MT, Alpermann T, Bacher U, Eder C, Dicker F, Ulke M, Kuznia S, Nadarajah N, Kern W, Haferlach C, Haferlach T, Schnittger S. WT1 mutations are secondary events in AML, show varying frequencies and impact on prognosis between genetic subgroups. Leukemia. 2015; 29:660–67. https://doi.org/10.1038/leu.2014.243.
21. Gao F, Maiti S, Sun G, Ordonez NG, Udtha M, Deng JM, Behringer RR, Huff V. The Wt1+/R394W mouse displays glomerulosclerosis and early-onset renal failure characteristic of human Denys-Drash syndrome. Mol Cell Biol. 2004; 24:9899–910. https://doi.org/10.1128/MCB.24.22.9899-9910.2004.
22. King-Underwood L, Pritchard-Jones K. Wilms’ tumor (WT1) gene mutations occur mainly in acute myeloid leukemia and may confer drug resistance. Blood. 1998; 91:2961–68.
23. Li L, Piloto O, Nguyen HB, Greenberg K, Takamiya K, Racke F, Huso D, Small D. Knock-in of an internal tandem duplication mutation into murine FLT3 confers myeloproliferative disease in a mouse model. Blood. 2008; 111:3849–58. https://doi.org/10.1182/blood-2007-08-109942.
24. Rau R, Magoon D, Greenblatt S, Li L, Annesley C, Duffield AS, Huso D, McIntyre E, Clohessy JG, Reschke M, Pandolfi PP, Small D, Brown P. NPMc+ cooperates with Flt3/ITD mutations to cause acute leukemia recapitulating human disease. Exp Hematol. 2014; 42:101–13.e5. https://doi.org/10.1016/j.exphem.2013.10.005.
25. Lee BH, Williams IR, Anastasiadou E, Boulton CL, Joseph SW, Amaral SM, Curley DP, Duclos N, Huntly BJ, Fabbro D, Griffin JD, Gilliland DG. FLT3 internal tandem duplication mutations induce myeloproliferative or lymphoid disease in a transgenic mouse model. Oncogene. 2005; 24:7882–92. https://doi.org/10.1038/sj.onc.1208933.
26. Li L, Bailey E, Greenblatt S, Huso D, Small D. Loss of the wild-type allele contributes to myeloid expansion and disease aggressiveness in FLT3/ITD knockin mice. Blood. 2011; 118:4935–45. https://doi.org/10.1182/blood-2011-01-328096.
27. Stirewalt DL, Pogosova-Agadjanyan EL, Tsuchiya K, Joaquin J, Meshinchi S. Copy-neutral loss of heterozygosity is prevalent and a late event in the pathogenesis of FLT3/ITD AML. Blood Cancer J. 2014; 4:e208. https://doi.org/10.1038/bcj.2014.27.
28. Kogan SC, Ward JM, Anver MR, Berman JJ, Brayton C, Cardiff RD, Carter JS, de Coronado S, Downing JR, Fredrickson TN, Haines DC, Harris AW, Harris NL, et al, and Hematopathology subcommittee of the Mouse Models of Human Cancers Consortium. Bethesda proposals for classification of nonlymphoid hematopoietic neoplasms in mice. Blood. 2002; 100:238–45. https://doi.org/10.1182/blood.V100.1.238.
29. Alberta JA, Springett GM, Rayburn H, Natoli TA, Loring J, Kreidberg JA, Housman D. Role of the WT1 tumor suppressor in murine hematopoiesis. Blood. 2003; 101:2570–74. https://doi.org/10.1182/blood-2002-06-1656.
30. King-Underwood L, Little S, Baker M, Clutterbuck R, Delassus S, Enver T, Lebozer C, Min T, Moore A, Schedl A, Pritchard-Jones K. Wt1 is not essential for hematopoiesis in the mouse. Leuk Res. 2005; 29:803–12. https://doi.org/10.1016/j.leukres.2004.11.020.
31. Pronier E, Bowman RL, Ahn J, Glass J, Kandoth C, Merlinsky TR, Whitfield JT, Durham BH, Gruet A, Hanasoge Somasundara AV, Rampal R, Melnick A, Koche RP, et al. Genetic and epigenetic evolution as a contributor to WT1-mutant leukemogenesis. Blood. 2018; 132:1265–78. https://doi.org/10.1182/blood-2018-03-837468.
32. Moran-Crusio K, Reavie L, Shih A, Abdel-Wahab O, Ndiaye-Lobry D, Lobry C, Figueroa ME, Vasanthakumar A, Patel J, Zhao X, Perna F, Pandey S, Madzo J, et al. Tet2 loss leads to increased hematopoietic stem cell self-renewal and myeloid transformation. Cancer Cell. 2011; 20:11–24. https://doi.org/10.1016/j.ccr.2011.06.001.
33. Li Z, Cai X, Cai CL, Wang J, Zhang W, Petersen BE, Yang FC, Xu M. Deletion of Tet2 in mice leads to dysregulated hematopoietic stem cells and subsequent development of myeloid malignancies. Blood. 2011; 118:4509–18. https://doi.org/10.1182/blood-2010-12-325241.
34. Muto T, Sashida G, Oshima M, Wendt GR, Mochizuki-Kashio M, Nagata Y, Sanada M, Miyagi S, Saraya A, Kamio A, Nagae G, Nakaseko C, Yokote K, et al. Concurrent loss of Ezh2 and Tet2 cooperates in the pathogenesis of myelodysplastic disorders. J Exp Med. 2013; 210:2627–39. https://doi.org/10.1084/jem.20131144.
35. Patel JP, Gönen M, Figueroa ME, Fernandez H, Sun Z, Racevskis J, Van Vlierberghe P, Dolgalev I, Thomas S, Aminova O, Huberman K, Cheng J, Viale A, et al. Prognostic relevance of integrated genetic profiling in acute myeloid leukemia. N Engl J Med. 2012; 366:1079–89. https://doi.org/10.1056/NEJMoa1112304.
36. Wang Y, Xiao M, Chen X, Chen L, Xu Y, Lv L, Wang P, Yang H, Ma S, Lin H, Jiao B, Ren R, Ye D, et al. WT1 recruits TET2 to regulate its target gene expression and suppress leukemia cell proliferation. Mol Cell. 2015; 57:662–73. https://doi.org/10.1016/j.molcel.2014.12.023.
37. Annesley C, Duffield A, Rau R, McCarty G, Magoon D, Li L, Huff V, Small D, Loeb D, Brown P. A Wilms Tumor 1 (WT1) Mutation Causes Myelodysplastic Syndrome in a Knock-in Mouse Model, and a Mixed Myelodysplastic/Myeloproliferative Neoplam in Double Knock-in Mice with WT1 and FLT3/ITD Mutations. Blood. 2015; 126:312.
38. Rampal R, Alkalin A, Madzo J, Vasanthakumar A, Pronier E, Patel J, Li Y, Ahn J, Abdel-Wahab O, Shih A, Lu C, Ward PS, Tsai JJ, et al. DNA hydroxymethylation profiling reveals that WT1 mutations result in loss of TET2 function in acute myeloid leukemia. Cell Reports. 2014; 9:1841–55. https://doi.org/10.1016/j.celrep.2014.11.004.
39. Neumann M, Heesch S, Gökbuget N, Schwartz S, Schlee C, Benlasfer O, Farhadi-Sartangi N, Thibaut J, Burmeister T, Hoelzer D, Hofmann WK, Thiel E, Baldus CD. Clinical and molecular characterization of early T-cell precursor leukemia: a high-risk subgroup in adult T-ALL with a high frequency of FLT3 mutations. Blood Cancer J. 2012; 2:e55. https://doi.org/10.1038/bcj.2011.49.