
INTRODUCTION
Cancer can arise via the accumulation of genetic mutations, which cause the cancer cells to proliferate without restriction, leading to tumor growth and metastasis [1]; however, the molecular and genetic cascades involved in tumor formation and cancer progression are largely unknown. The forkhead box (FOX) family of transcription factors includes 17 subfamilies, from FOXA to FOXR, that control a wide range of biological processes such as cell growth, proliferation, differentiation, and longevity [1]. Notably, aberrant FOXC2 expression has been implicated in a number of malignancies and is correlated with metastasis, chemoresistance, and patient prognosis [1]. For example, FOXC2 regulates epidermal growth factor receptor (EGFR) in glioblastoma, activates two intracellular signaling pathways—mitogen-activated protein kinase (MAPK) and phosphatidylinositol 3-kinase (PI3K)/AKT—that promote the proliferation of colon cancer cells, promotes the proliferation of breast cancer cells by inducing glioma-associated oncogene homolog 1 (GLI1) and sonic hedgehog (SHH)/GLI1 signaling, and accelerates cancer progression by inducing the epithelial mesenchymal transition (EMT). FOXC2 also influences cancer growth and progression by acting as a mediator of both angiogenesis and lymphangiogenesis [1].
The goal of this study was to characterize the relationship between FOXC2 expression and cancer progression by conducting a meta-analysis of studies that reported the frequency of FOXC2 expression in tumors of different stages (T1, T2, T3, T4) [2], and then calculating the pooled relative risk of FOXC2 expression in stage T1-T2 (early) and in stage T3-T4 (late) tumors. We identified 9 reports that met all inclusion criteria and evaluated a total of 1433 samples from a wide range of cancer types. Our results suggest that the frequency of FOXC2 expression is significantly higher in late-stage than in early-stage tumors.
MATERIALS AND METHODS
Our meta-analysis was conducted and reported according to guidelines provided in the PRISMA for Network Meta-Analyses (PRISMA-NMA) checklist [3]. To reduce the likelihood of duplicate results, we used a single database (Medline), which is consistent with the PRISMA-NMA requirements. Relevant studies were identified by using the PubMed interface to search for the terms “FOXC2” and “cancer,” and the studies included in our meta-analysis were of multivariate cohort design, evaluated FOXC2 expression via immunohistochemical staining, and assessed the relationship between FOXC2 expression and cancer T-stage (T1, T2, T3, T4). The meta-analysis was performed with an open-source program as described previously [4–6].
RESULTS
Study selection
The initial Medline search was conducted on and identified 139 articles (Supplementary Table 1); 122 of the studies were excluded because they did not investigate the relationship between FOXC2 expression and cancer or did not categorize their results by tumor stage, and 8 studies did not evaluate FOXC2 expression immunohistochemically (Figure 1). The remaining 9 studies (Table 1) were multivariate analyses and met all inclusion criteria.
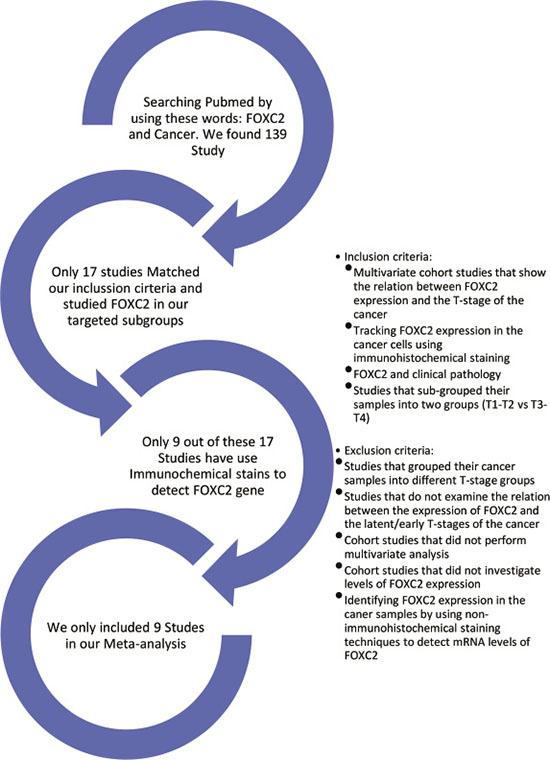
Figure 1: Summary of study selection. The Medline database was searched for the terms FOXC2 and Cancer. The studies included in our meta-analysis were multivariate cohort investigations of the relationship between FOXC2 expression and cancer T-stage in which the results were grouped according to tumor stage (T1, T2, T3, T4) and FOXC2 expression was detected via immunohistochemical staining.
Table 1: Summary of studies
Study name and location |
Year |
Type of cancer |
T1-T2 Tumor samples |
T3-T4 Tumor samples |
||||
|---|---|---|---|---|---|---|---|---|
Total |
FOXC2+ |
FOXC2– |
Total |
FOXC2+ |
FOXC2– |
|||
Zhu, et al., China |
2013 |
Gastric carcinoma |
95 |
47 |
44 |
230 |
186 |
95 |
Lim, et al., Singapore |
2015 |
Breast cancer |
186 |
53 |
67 |
84 |
17 |
186 |
Sasahira, et al., Japan |
2014 |
OSCC |
105 |
26 |
46 |
58 |
12 |
105 |
Sun, et al., China |
2015 |
RCC |
23 |
13 |
2 |
39 |
37 |
23 |
Imayama, et al., Japan |
2015 |
OSCC |
45 |
14 |
8 |
16 |
8 |
45 |
Cui, et al., China |
2014 |
Colorectal cancer |
38 |
16 |
77 |
168 |
91 |
38 |
Watanbe, et al., Japan |
2013 |
Cholangi carcinoma |
40 |
7 |
26 |
37 |
11 |
40 |
Shimoda, et al., Japan |
2018 |
Hepatocellular carcinoma |
33 |
8 |
33 |
51 |
18 |
33 |
Li, et al. China |
2015 |
Colon cancer |
30 |
9 |
69 |
155 |
86 |
30 |
OSCC: oral squamous cell carcinoma. RCC: renal cell carcinoma.
Risk of bias in individual studies
Each individual study had selection bias, because the study samples were not randomly selected. Furthermore, the immunohistochemical methods used to detect FOXC2 expression varied across the studies, and this variation could also induce bias.
Data collection
Zhu, et al. (2013) [7]
The authors evaluated 325 tumor samples from patients with gastric carcinoma; 95 samples were categorized as stage T1-T2 and 230 samples were categorized as stage T3-T4. High levels of FOXC2 expression were observed in 49.5% (47/95) of T1-T2 samples and in 80.9% (186/230) T3-T4 samples (p < 0.001) (Figure 2). For our meta-analysis, “high” expression levels were considered positive for FOXC2 and “low” expression levels were considered FOXC2-negative.
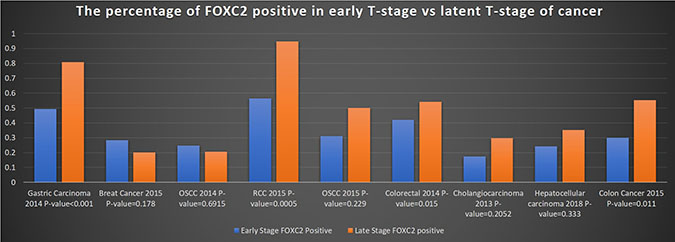
Figure 2: Frequency of FOXC2 expression in early- and late-stage tumors. The percentage of early-stage (T1-T2) and late-stage (T3-T4) tumor samples that expressed FOXC2 was calculated for each of the 9 studies included in the meta-analysis and reported according to cancer type. OSCC: oral squamous cell carcinoma; RCC: renal cell carcinoma.
Lim, et al. (2015) [8]
Samples (n = 270) were evaluated from the tumors of patients with breast cancer; 186 samples were from stage T1-T2 tumors, 84 samples were from stage T3-T4 tumors, and the proportion of FOXC2-positive tumors in each group was 28.5% (53/186) and 20.2% (17/84), respectively. The authors found that FOXC2 expression was associated with a higher tumor grade (p = 0.178), and that patients with high FOXC2 expression had poorer prognoses and survival.
Sasahira, et al. (2014) [9]
Samples (n = 163) were evaluated from the tumors of patients with oral squamous carcinoma; 31.0% (9/29) of stage T1 tumor samples, 22.4% (17/76) of stage T2 tumor samples, 22.9% (8/35) of stage T3 tumor samples, and 17.4% (4/23) of stage T4 tumor samples were positive for FOXC2 expression. The proportion of FOXC2 positive was not significant (p = 0.6915). Data from the T1 and T2 tumors and from the T3 and T4 tumors were combined for our meta-analysis; thus, FOXC2 expression was observed in 24.8% (26/105) of T1-T2 samples and in 20.7% (12/58) of T3-T4 samples.
Sun, et al. (2015) [10]
Samples (n = 62) were evaluated from the tumors of patients with renal cell carcinoma; 80% of cancerous renal tissue samples were positive for FOXC2 expression. Among the 62 tumor samples, the proportion of FOXC2-positive cells was significantly (p = 0.0005) for T3-T4 tumors (94.9%; 37 of 39) than for T1-T2 samples (56.5%; 13 of 23).
Imayama, et al. (2015) [11]
Samples (n = 61) were evaluated from the tumors of patients with oral squamous cell carcinoma; 45 of the samples were from T1-T2 tumors, and 16 samples were from T3-T4 tumors. The frequency of FOXC2 expression was 31.1% (14/45) in T1-T2 tumor samples and 50% (8/16) in T3-T4 tumor samples.
Cui, et al. (2014) [12]
Samples (n = 206) were evaluated from the tumors of patients with colorectal cancer. The samples were divided into three groups: stage T1-T2 (n = 38), stage T3 (n = 110), and stage T4 (n = 58). The frequency of FOXC2 expression in the three groups was 42.1% (16/38), 48% (53/110), and 65.5% (38/58), respectively, and differed significantly across the three groups (p = 0.015). For our meta-analysis, data from the T3 and T4 tumors were summed, indicating that FOXC2 expression was observed in 54.2% (91/168) of T3-T4 samples.
Watanabe, et al. (2013) [13]
Samples (n = 77) were evaluated from the tumors of patients with cholangiocarcinoma. The samples were categorized as stage T1-T2 (n = 40) or stage T3-T4 (n = 37), and the frequency of FOXC2 expression in the two groups was 17.5% (7/40) and 29.7% (11/37), respectively.
Shimoda, et al. (2018) [14]
Samples (n = 84) were evaluated from the tumors of patients with hepatocellular carcinoma. Data for each of the four tumor stages were assessed independently; 37.5% (3/8) of stage T1 samples, 20% (5/25) of stage T2 samples, 31.7% (13/41) of stage T3 samples, and 50% (5/10) of stage T4 samples were positive for FOXC2 expression. Thus, when data from the T1 and T2 tumors and from the T3 and T4 tumors were combined for our meta-analysis, FOXC2 expression was observed in 24.2% (8/33) of T1-T2 samples and in 35.3% (18/51) of T3-T4 samples.
Li, et al. (2015) [15]
Samples (n = 185) were evaluated from the tumors of patients with colon cancer. The frequency of FOXC2 expression differed significantly (p = 0.011) across the four tumor stages; 0% (0/7) of T1 samples, 39% (9/23) of T2 samples, 50 % (37/73) of T3 samples, and 59% (49/82) of T4 samples were positive for FOXC2 expression. Thus, when summed for our meta-analysis, FOXC2 expression was observed in 30.0% (9/30) of T1-T2 samples and in 55.5% (86/155) of T3-T4 samples.
Synthesis of results
A total of 1433 tumor samples were evaluated in the 9 studies; 596 samples were from stage T1-T2 tumors, and 838 samples were from stage T3-T4 tumors. FOXC2 was expressed in 46.0% (659/1433) of all samples, in 32.4% (193/596) of T1-T2 samples, and in 55.6% (466/838) of stage T3-T4 samples. Within the individual studies, the relative risk of FOXC2 expression tended to be greater in T3-T4 tumor samples than in T1-T2 tumor samples (Figure 3). Across all nine studies, the pooled relative risk (PRR) for FOXC2 expression in samples from stage T1-T2 tumors versus samples from stage T3-T4 tumors was 0.731 with a 95% confidence interval (95% CI) of 0.590–0.907 and a statistically significant p-value (p = 0.004) (Figure 4). These results are consistent with those obtained when the pooled relative risk was calculated for stage T3-T4 tumor samples versus stage T1-T2 tumor samples (PRR = 1.367, 95%CI = 1.103–1.695, p = 0.004) Thus, the results from our meta-analysis indicate that FOXC2 is 36.7% more likely to be expressed in stage T3-T4 tumors than in stage T1-T2 tumors (Table 2).
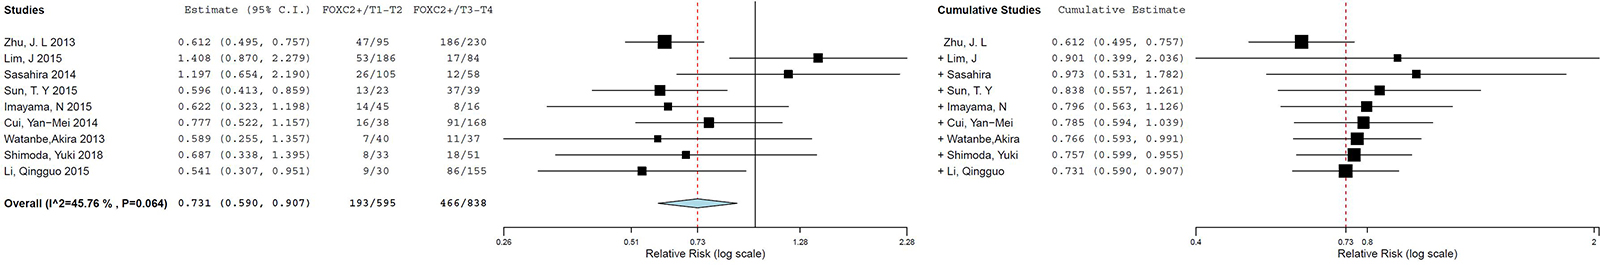
Figure 3: Relative risk of FOXC2 expression in early- and late-stage tumors (individual studies). The relative risk and 95% confidence intervals of FOXC2 expression in early-stage (T1-T2) versus late-stage (T3-T4) and in late-stage versus early-stage tumor samples was calculated for each individual study and displayed in a forest plot.
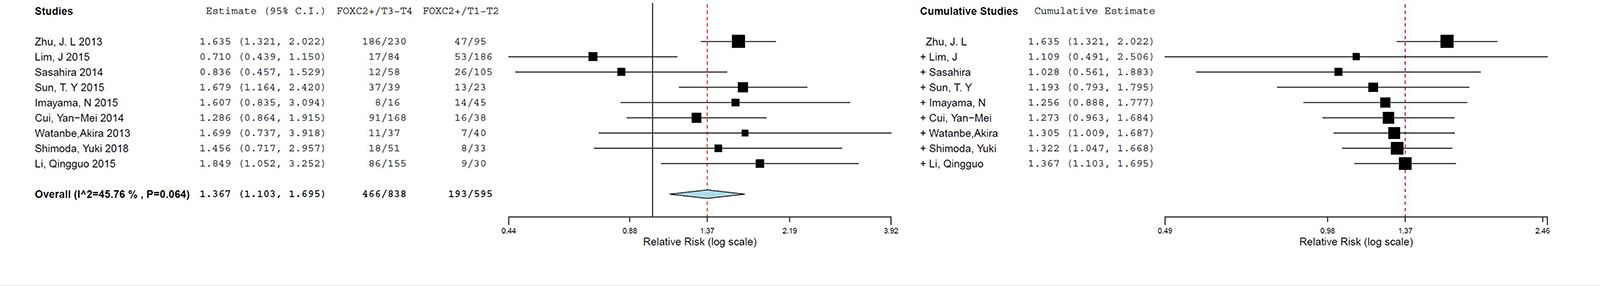
Figure 4: Pooled relative risk of FOXC2 expression in early- and late-stage tumors (meta-analysis of 9 studies). The pooled relative risk and 95% confidence intervals of FOXC2 expression in early-stage (T1-T2) versus late-stage (T3-T4) and in late-stage versus early-stage tumor samples was calculated as the data for all 9 studies was accumulated and displayed in a forest plot.
Table 2: Calculation of pooled relative risk of FOXC2 expression in early- and late-stage tumors (meta-analysis)
Study name |
Study weight |
Pooled Relative Risk, T1-T2 versus T3-T4 |
Pooled Relative Risk, T3-T4 versus T1-T2 |
||||||||
|---|---|---|---|---|---|---|---|---|---|---|---|
Estimate |
95% CI Lower bound |
95% CI Upper bound |
Standard error |
p-value |
Estimate |
95% CI Lower bound |
95% CI Upper bound |
Standard error |
p-Value |
||
Zhu, et al. |
21.4% |
0.612 |
0.495 |
0.757 |
0.109 |
NA |
1.635 |
1.321 |
2.022 |
0.109 |
NA |
+ Lim, et al. |
11.5% |
0.901 |
0.399 |
2.036 |
0.416 |
0.803 |
1.109 |
0.491 |
2.506 |
0.416 |
0.803 |
+ Sasahira, et al. |
8.6% |
0.973 |
0.531 |
1.782 |
0.309 |
0.929 |
1.028 |
0.561 |
1.883 |
0.309 |
0.929 |
+ Sun, et al. |
15.2% |
0.838 |
0.557 |
1.261 |
0.208 |
0.398 |
1.193 |
0.793 |
1.795 |
0.208 |
0.398 |
+ Imayama, et al. |
7.7% |
0.796 |
0.563 |
1.126 |
0.177 |
0.198 |
1.256 |
0.888 |
1.777 |
0.177 |
0.198 |
+ Cui, et al. |
14.0% |
0.785 |
0.594 |
1.039 |
0.143 |
0.090 |
1.273 |
0.963 |
1.684 |
0.143 |
0.090 |
+Watanbe, et al. |
5.3% |
0.766 |
0.593 |
0.991 |
0.131 |
0.043 |
1.305 |
1.009 |
1.687 |
0.131 |
0.043 |
+ Shimoda, et al. |
6.9% |
0.757 |
0.599 |
0.955 |
0.119 |
0.019 |
1.322 |
1.047 |
1.668 |
0.119 |
0.019 |
+ Li, et al. |
9.4% |
0.731 |
0.590 |
0.907 |
0.110 |
0.004 |
1.367 |
1.103 |
1.695 |
0.110 |
0.004 |
Final estimate |
100% |
0.731 |
0.590 |
0.907 |
0.110 |
0.004 |
1.367 |
1.103 |
1.695 |
0.110 |
0.004 |
95% CI: 95% confidence interval, NA: not applicable.
Exploration for inconsistency and risk of bias across studies
Differences in the immunohistochemical protocols and techniques used for FOXC2 staining could produce some inconsistencies in FOXC2 detection. Biases that may affect the cumulative evidence include sample selection, because samples were not chosen randomly in all studies, and our inclusion of multivariate cohort studies which, because they evaluate multiple parameters simultaneously, could increase the heterogeneity of our results. We attempted to minimize heterogeneity by limiting study eligibility. We only selected the multivariate cohort design which evaluated FOXC2 expression via immunohistochemical staining. The I2 of the meta-analysis study has shown a moderate heterogeneity with 45.7% with a p-value = 0.064 (Table 3).
Table 3: Heterogeneity
tau2 |
Q (df = 4) |
Heterogeneity p-value |
I2 |
|---|---|---|---|
0.044 |
14.748 |
0.064 |
45.756 |
DISCUSSION
Most of the studies chosen in our meta-analysis suggested that FOXC2 expression and cancer were associated, but none of them reported the relative risk between tumor stage and FOXC2 levels. Our meta-analysis compared the expression of FOXC2 in stage T1-T2 and stage T3-T4 tumors, and we reduced selection bias by restricting our analysis to multivariate cohort studies that detected FOXC2 expression via immunohistochemical staining and based the T-stage definition on tumor size, which does not predict morbidity but is a definitive indicator of tumor growth. Our results indicate that FOXC2 expression is significantly more common in later-stage (T3-T4) tumors than in early stage (T1-T2) tumors and, consequently, that FOXC2 may be a marker for the T-stage of cancer.
ACKNOWLEDGMENTS
This work was supported by the National Institutes of Health (NIH) (HL 126920 to T. K.). The authors thank W. Kevin Meisner, PhD, ELS, for editorial assistance.
CONFLICTS OF INTEREST
We certify that there is no conflict of interest with any financial organization regarding the material discussed in the manuscript.
REFERENCES
1. Wang T, Zheng L, Wang Q, Hu YW. Emerging roles and mechanisms of FOXC2 in cancer. Clin Chim Acta. 2018; 479:84–93. https://doi.org/10.1016/j.cca.2018.01.019.
2. Giuliano AE, Connolly JL, Edge SB, Mittendorf EA, Rugo HS, Solin LJ, Weaver DL, Winchester DJ, Hortobagyi GN. Breast Cancer-Major changes in the American Joint Committee on Cancer eighth edition cancer staging manual. CA Cancer J Clin. 2017; 67:290–303. https://doi.org/10.3322/caac.21393.
3. Moher D, Liberati A, Tetzlaff J, Altman DG, Group P, and PRISMA Group. Preferred reporting items for systematic reviews and meta-analyses: the PRISMA statement. PLoS Med. 2009; 6:e1000097. https://doi.org/10.1371/journal.pmed.1000097.
4. Lau J, Antman EM, Jimenez-Silva J, Kupelnick B, Mosteller F, Chalmers TC. Cumulative meta-analysis of therapeutic trials for myocardial infarction. N Engl J Med. 1992; 327:248–54. https://doi.org/10.1056/NEJM199207233270406.
5. Viechtbauer W. Conducting meta-analyses in R with the metafor package. J Stat Softw. 2010; 36:1-48. https://doi.org/10.18637/jss.v036.i03.
6. Wallace BC, Dahabreh IJ, Trikalinos TA, Lau J, Trow P, Schmid CH. Closing the gap between methodologists and end-users: R as a computational back-end. J Stat Softw. 2012; 49:1–15. https://doi.org/10.18637/jss.v049.i05.
7. Zhu JL, Song YX, Wang ZN, Gao P, Wang MX, Dong YL, Xing CZ, Xu HM. The clinical significance of mesenchyme forkhead 1 (FoxC2) in gastric carcinoma. Histopathology. 2013; 62:1038–48. https://doi.org/10.1111/his.12132.
8. Lim JC, Koh VC, Tan JS, Tan WJ, Thike AA, Tan PH. Prognostic significance of epithelial-mesenchymal transition proteins Twist and Foxc2 in phyllodes tumours of the breast. Breast Cancer Res Treat. 2015; 150:19–29. https://doi.org/10.1007/s10549-015-3296-4.
9. Sasahira T, Ueda N, Yamamoto K, Kurihara M, Matsushima S, Bhawal UK, Kirita T, Kuniyasu H. Prox1 and FOXC2 act as regulators of lymphangiogenesis and angiogenesis in oral squamous cell carcinoma. PLoS One. 2014; 9:e92534. https://doi.org/10.1371/journal.pone.0092534.
10. Sun TY, Xie HJ, Li Z, Kong LF. Expression of FOXC2 in renal cell carcinoma and its relationship to clinical pathological features. Int J Clin Exp Med. 2015; 8:13388–92.
11. Imayama N, Yamada S, Yanamoto S, Naruse T, Matsushita Y, Takahashi H, Seki S, Fujita S, Ikeda T, Umeda M. FOXC2 expression is associated with tumor proliferation and invasion potential in oral tongue squamous cell carcinoma. Pathol Oncol Res. 2015; 21:783–91. https://doi.org/10.1007/s12253-014-9891-6.
12. Cui YM, Jiang D, Zhang SH, Wu P, Ye YP, Chen CM, Tang N, Liang L, Li TT, Qi L, Wang SY, Jiao HL, Lin J, et al. FOXC2 promotes colorectal cancer proliferation through inhibition of FOXO3a and activation of MAPK and AKT signaling pathways. Cancer Lett. 2014; 353:87–94. https://doi.org/10.1016/j.canlet.2014.07.008.
13. Watanabe A, Suzuki H, Yokobori T, Altan B, Kubo N, Araki K, Wada S, Mochida Y, Sasaki S, Kashiwabara K, Hosouchi Y, Kuwano H. Forkhead box protein C2 contributes to invasion and metastasis of extrahepatic cholangiocarcinoma, resulting in a poor prognosis. Cancer Sci. 2013; 104:1427–32. https://doi.org/10.1111/cas.12249.
14. Shimoda Y, Ubukata Y, Handa T, Yokobori T, Watanabe T, Gantumur D, Hagiwara K, Yamanaka T, Tsukagoshi M, Igarashi T, Watanabe A, Kubo N, Araki K, et al. High expression of forkhead box protein C2 is associated with aggressive phenotypes and poor prognosis in clinical hepatocellular carcinoma. BMC Cancer. 2018; 18:597. https://doi.org/10.1186/s12885-018-4503-6.
15. Li Q, Wu J, Wei P, Xu Y, Zhuo C, Wang Y, Li D, Cai S. Overexpression of forkhead Box C2 promotes tumor metastasis and indicates poor prognosis in colon cancer via regulating epithelial-mesenchymal transition. Am J Cancer Res. 2015; 5:2022–34.