
INTRODUCTION
Interleukin (IL)-11 is a member of the IL-6 family of cytokines and exerts pleiotropic effects, conferring protection in the intestine, promoting tumorigenesis in gastrointestinal, breast, and thyroid tumors, regulating macrophage differentiation, and stimulating hemopoiesis and thrombopoiesis; however, IL-11 regulatory mechanisms in vivo remain unclear. While recent progress has been made toward elucidating the IL-6 and IL-11 modes of action [1–4], the effects of these molecules on certain human diseases, including osteoarthritis (OA), are not well understood. OA is characterized by joint pain and varying degrees of functional limitation in the peripheral joints, especially the knee [5], resulting from cartilage degradation and erosion [6–10].
IL-11 shares characteristics with both immune-regulatory (IL-6) and neuro-protective (leukemia inhibitory factor and ciliary neurotrophic factor) members of this cytokine family. IL-11 forms a hexameric signaling complex similar to that of IL-6, but the IL-11 receptor complex contains a single glycoprotein 130 (gp130) chain and a cytokine-specific receptor α chain. Janus kinase-signal transducer and activator of transcription (JAK-STAT) signaling, including dissociation of receptor-associated JAK molecules, endocytosis of the receptor complex, and nuclear export of activated STAT molecules. Suppressor of cytokine signaling 3 (SOCS3) limits gp130-mediated signaling in a negative-feedback loop by binding to a tyrosine residue at position 757 in mice and 759 in humans [11–13].
Zac1 (also known as pleomorphic adenoma gene-like 1, PLAGL1) is a zinc-finger protein that regulates apoptosis and cell cycle arrest 1. Zac1 and p53 were identified through induction of type I pituitary adenylate cyclase-activating polypeptide receptor (PACAP1-R) expression [14–16]. As a transcription factor, Zac1 appears to recognize GC-rich DNA elements within the PACAP1-R, cytokeratin, peroxisome proliferator-activated receptor-γ (PPAR-γ), insulin-regulated glucose transporter GLUT4, atrial natriuretic factor (ANF), and SOCS3 genes [14, 17–21]. We previously found that the Zac1 N-terminal motif is important for dimerization, nuclear sub-cellular localization, and protein-protein interactions [20, 22–24]. Zac1 is also a transcription cofactor for p53, human papillomavirus (HPV) oncoproteins (E2, E6, and E7), nuclear receptors (NRs), and NR coactivators for AP-1, CBP, p300, PML, Sp1, and SUMO [24–32]. In some cases, Zac1 may act as a transcriptional repressor via recruitment of histone deacetylase 1 or the NF-κB [21, 33, 34].
IL-11 transcription is largely dependent upon AP-1 transcription factors. Studies also demonstrate that CREB, SMADs, and NF-κB [35–38]. Several other transcription factors, including AP-1, NF-κB, and CCAAT/enhancer-binding protein β (C/EBPβ), also bind the IL-6 promoter region [39]. Among these, NF-κB activation, particularly via Toll-like receptor 4, is considered the most important trigger for IL-6 transcription and secretion [40]. These findings suggest that Zac1 might be a transcription factor regulating IL-11 expression.
IL-6 and IL-11 are largely absent from body fluids of healthy individuals [39, 41]. However, a wide variety of cell types produce these cytokines following an appropriate stimulus. In contrast to the plethora of cell types that can produce cytokines, expression of their respective receptors is much more restricted. This limits the spectrum of cells that can be directly activated by IL-11 and IL-6. Dysregulation of IL-6 and IL-11 signaling contributes to several diseases, such as inflammatory bowel disease, osteoporosis, rheumatoid arthritis, and various types of cancer [11, 12]. In particular, the relationship between IL-6 and IL-11 in human articular tissues remains unclear. This study assessed IL-11 regulatory mechanisms and compared clinical IL-6 and IL-11 levels to better elucidate the value of the IL-6/IL-11 ratio in OA patients. Our findings provide novel insights into therapeutic strategies for treating IL-6-related disorders.
RESULTS
IL-11 and IL-11 receptor α (IL-11Rα) were induced in Zac1 stably-expressing HeLa cells
We overexpressed Zac1 in the HPV type 18 infected cervical carcinoma cell line, HeLa, to identify its potential target genes. Our mRNA expression array revealed that 890 genes were upregulated and 385 were downregulated. Table 1 lists the top 20 up- and downregulated genes. IL-11 and IL-11Rα were dramatically induced by Zac1 in HeLa cells (Table 2). We then addressed whether or not Zac1 directly targeted IL-11.
Table 1: Top 20 ranking up- and down-regulation by Zac1 in HeLa cell line
Ranking |
log2 (Fold) |
P-value (Differentially expressed) |
Gene symbol |
Description |
|---|---|---|---|---|
1 |
6.21 |
1.34E-34 |
BIRC7 |
baculoviral IAP repeat-containing 7 |
2 |
5.62 |
1.29E-28 |
CALHM3 |
calcium homeostasis modulator 3 |
3 |
5.41 |
5.73E-30 |
ITIH3 |
inter-alpha (globulin) inhibitor H3 |
4 |
5.41 |
1.86E-29 |
HM13 |
histocompatibility (minor) 13 |
5 |
5.31 |
2.11E-34 |
COL9A3 |
collagen, type IX, alpha 3 |
6 |
5.21 |
5.54E-24 |
IL-11 |
interleukin 11 |
7 |
5.15 |
7.24E-26 |
LGALS7B |
lectin, galactoside-binding, soluble, 7B |
8 |
4.98 |
4.20E-23 |
BIK |
BCL2-interacting killer (apoptosis-inducing) |
9 |
4.91 |
7.75E-31 |
CLIC3 |
chloride intracellular channel 3 |
10 |
4.74 |
4.23E-20 |
AMBP |
alpha-1-microglobulin/bikunin precursor |
11 |
4.67 |
1.52E-22 |
S100A2 |
S100 calcium binding protein A2 |
12 |
4.66 |
1.70E-25 |
KREMEN1 |
kringle containing transmembrane protein 1 |
13 |
4.65 |
6.38E-24 |
GPR153 |
G protein-coupled receptor 153 |
14 |
4.59 |
7.94E-29 |
FAM69B |
family with sequence similarity 69, member B |
15 |
4.58 |
6.85E-14 |
TNNT3 |
troponin T type 3 (skeletal, fast) |
16 |
4.53 |
5.17E-26 |
GPT |
glutamic-pyruvate transaminase (alanine aminotransferase) |
17 |
4.53 |
1.30E-12 |
LAT2 |
linker for activation of T cells family, member 2 |
18 |
4.45 |
8.43E-30 |
CRLF1 |
cytokine receptor-like factor 1 |
19 |
4.44 |
1.75E-25 |
C6orf218 |
chromosome 6 open reading frame 218 |
20 |
4.38 |
3.82E-22 |
KCNQ2 |
potassium voltage-gated channel, KQT-like subfamily, member 2 |
1 |
−3.66 |
1.31E-29 |
C8orf22 |
chromosome 8 open reading frame 22 |
2 |
−3.30 |
2.94E-19 |
AKR1C3 |
aldo-keto reductase family 1, member C3 |
3 |
−3.00 |
3.99E-19 |
RNF182 |
ring finger protein 182 |
4 |
−2.66 |
1.81E-10 |
TSPAN8 |
tetraspanin 8 |
5 |
−2.54 |
2.15E-22 |
METTL7A |
methyltransferase like 7A |
6 |
−2.35 |
8.04E-11 |
COL3A1 |
collagen, type III, alpha 1 |
7 |
−2.35 |
3.35E-17 |
FAM64A |
family with sequence similarity 64, member A |
8 |
−2.31 |
2.89E-14 |
DOCK11 |
dedicator of cytokinesis 11 |
9 |
−2.30 |
7.02E-13 |
TDRD3 |
tudor domain containing 3 |
10 |
−2.23 |
4.75E-13 |
MAP2K6 |
mitogen-activated protein kinase kinase 6 |
11 |
−2.15 |
5.55E-11 |
NOP56 |
NOP56 ribonucleoprotein homolog (yeast) |
12 |
−2.13 |
9.21E-09 |
MMP28 |
matrix metallopeptidase 28 |
13 |
−2.03 |
4.02E-11 |
MAMLD1 |
mastermind-like domain containing 1 |
14 |
−1.99 |
6.99E-16 |
SLC25A14 |
solute carrier family 25, member 14 |
15 |
−1.97 |
4.97E-13 |
DTX4 |
deltex homolog 4 (Drosophila) |
16 |
−1.96 |
2.20E-12 |
RRM2 |
ribonucleotide reductase M2 |
17 |
−1.96 |
6.14E-16 |
PRAME |
preferentially expressed antigen in melanoma |
18 |
−1.95 |
2.93E-14 |
SNAP25 |
synaptosomal-associated protein, 25kDa |
19 |
−1.92 |
0.001141 |
PDGFRL |
platelet-derived growth factor receptor-like |
20 |
−1.92 |
3.43E-11 |
COX7B2 |
cytochrome c oxidase subunit VIIb2 |
Table 2: IL-11 and its receptor (IL-11Rα) differentially expressed in the Zac1-stable HeLa cells
Gene name |
log2 (Fold) |
P-value (Differentially expressed) |
|---|---|---|
IL-11 |
5.21 |
5.5E-24 |
IL-11 receptor, alpha (IL-11Rα) |
2.61 |
1.1E-15 |
In the tetracycline-inducible Zac1 expression system, we observed that IL-11 expression was dependent on doxycycline (Dox) concentration (Figure 1A). IL-6 was not induced under these experimental conditions. We previously showed that the two SUMO-binding lysine residues in Zac1, K237 and K424, repress Zac1 transactivation activity [32]. We examined the importance of these two sites with respect to IL-11 regulation. The Zac1 K237/K424A double mutant did not induce IL-11 expression in HeLa cells (Figure 1B). K237A or K424A single mutants reduced Zac1-induced IL-11 expression by half. RT-PCR data were consistent with the reduced Zac1 transactivation activity and no effect on IL-6 expression.
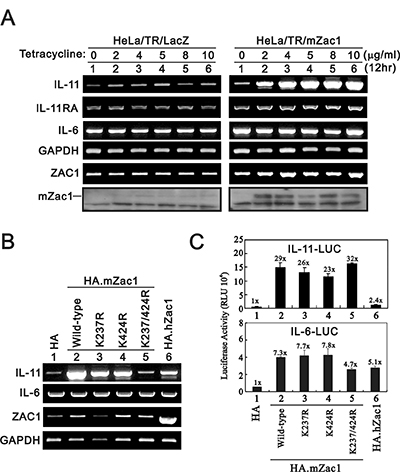
Figure 1: Effects of overexpressing Zac1 on the IL-11 mRNA and promoter in HeLa cells. (A) HeLa/TR/mZac1 or HeLa/TR-LacZ control cells were induced for 12 h using the indicated amounts of Dox. The cells were collected and subjected to RT-PCR analysis of IL-11, IL-6, IL-11Rα, Zac1, and GAPDH (loading control) mRNA expression, and to immunoblot analysis for detection of Zac1 protein. (B) HeLa cells were transiently transfected with 0.5 μg of the indicated pSG5.HA.Zac1 for 36 h. The cells were then collected and subjected to RT-PCR analysis of IL-11, IL-6, IL-11Rα, Zac1, and GAPDH (loading control) expression. (C) HeLa cells were transiently transfected with 0.5 μg of IL-11-LUC or IL-6-LUC along with 0.5 μg of the indicated pSG5.HA Zac1 for 36 h prior to use in luciferase reporter assays. The numbers above the columns indicate the luciferase activity relative to an index of 1 assigned to the reporter with empty vector. Results are representative of three independent experiments.
We observed different responsive patterns for wild-type and mutant Zac1 in the IL-11 and IL-6 promoter reporter systems (Figure 1C). Double and single mutant Zac1 had similar effects as wild-type Zac1 on IL-11 promoter activity, and all Zac1 constructs had differential transactivation activities on IL-6 promoter activity in HeLa cells. The consistent enhancement on gene expressions by mouse Zac1 was higher than that of human Zac1 [14, 16].
In addition to regulating IL-11, AP-1 also binds the IL-6 promoter region [39]. Our previous work revealed that Zac1 might regulate AP-1 function via enhancement of c-Jun and c-Fos transactivation activities [29]. Here, we transiently transfected various c-Jun family proteins, including c-Jun, JunB, and JunD, with c-Fos, Zac1, or both into HeLa cells to examine their effects on IL-11, IL-6, and SOCS3 promoter activities. Our data revealed that Zac1 worked synergistically with c-Jun/c-Fos to enhance IL-11 and SOCS3 promoter activities (Figure 2A and 2C), whereas Zac1 suppressed the effects of c-Jun/c-Fos on IL-6 promoter activity (Figure 2B). Zac1 selectively synergistically worked with JunD/c-Fos to enhance IL-6 promoter activity (Figure 2B).
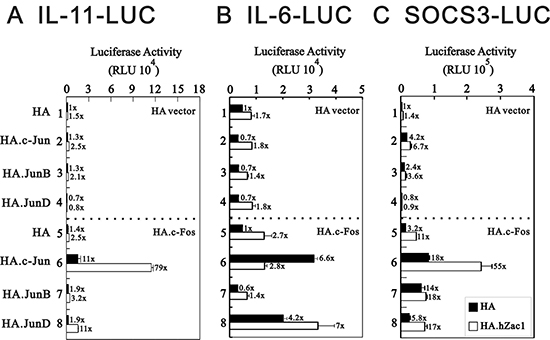
Figure 2: Effect of cross-talk between Zac1 and AP1 on the promoter activities of IL-11, IL-6 and SOCS3. HeLa cells were transiently transfected for 36 h with 0.5 μg of IL-11-LUC (A), IL-6-LUC (B), or SOCS3-LUC (C) along with 0.5 μg of pSG5.HA, pSG5.HA.c-Jun, pSG5.HA.JunB, and pSG5.HA.JunD in the absence and presence of 0.5 μg of pSG5.HA, pSG5.HA.c-Fos or pSG5.HA.hZac1. The transfectants were then harvested for luciferase reporter assays. The numbers above the columns (A–C) indicate the luciferase activity relative to an index of 1 assigned to the reporter with empty vector. Results are representative of three independent experiments.
Zac1 acted synergistically with HPV E2 to enhance IL-11 promoter activity in HeLa cells
HeLa cells are an HPV-infected cervical cancer cell line containing integrated HPV 18 DNA [42]. The integration interrupts the E2 open reading frame and the encoded protein is not produced. We examined the functional role of HPV E2 in IL-11 gene regulation. Our data showed that high risk HPV type 18 E2 (HPV18E2) and low risk HPV type 11 E2 (HPV11E2) proteins downregulated IL-11 expression, and Zac1 could rescue this suppressive effect (Figure 3A). Phorbol 12-myristate 13-acetate (PMA) enhanced endogenous IL-11 expression (Figure 3A and 3B, lane 1). The histone deacetylase inhibitor, trichostatin A (TSA), suppressed endogenous IL-11 expression (Figure 3A and 3C, lane 1). TSA also suppressed Zac1-induced IL-11 expression and Zac1 rescue of HPV E2 protein-induced IL-11 suppression, but reversed the functional roles of HPV E2 proteins to induce, rather than repress, IL-11 expression (Figure 3A and 3C, lanes 1, 3, 4). PMA and TSA combined selectively suppressed Zac1 and enhance HPV18 E2 functionality with respect to IL-11 expression (Figure 3A and 3D, lanes 1, 3, 5). IL-6 expression was not affected by these treatments (Figure 3).
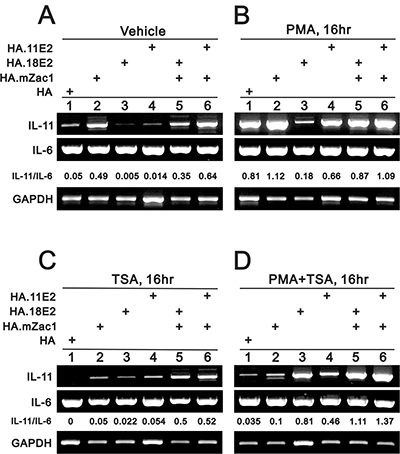
Figure 3: The rescue effect of Zac1 on HPV E2 proteins suppresses IL-11 mRNA expression. HeLa cells were transiently transfected for 20 h with 0.5 μg of pSG5.HA, pSG5.HA.mZac1, pSG5.HA.11E2, and pSG5.HA.18E2 and then treated with vehicle (A), PMA (B), TSA (C), or PMA (D) for 16 h. The cells were then collected and subjected to RT-PCR analysis of IL-11, IL-6, and GAPDH (loading control) expression. The IL-11/IL-6 ratio is presented as fold change. Results are representative of three independent experiments.
Our previous work showed that Zac1 physically and functionally interacts with AP-1 and HPV E2 proteins [26, 29]. Thus, the effects of c-Jun/c-Fos and PMA on endogenous IL-11 expression prompted us to examine whether c-Jun/c-Fos might work with Zac1 and HPV E2 proteins in the IL-11 promoter system. We observed that the c-Jun/c-Fos complex worked synergistically with hZac1, HPV E2, and both in combination in the IL-11 promoter reporter system (Figure 4A, histograms 1 and 17–24). In general, there was no apparent effect on the IL-6 promoter reporter system, except for the combination of hZac1 and HPV E2 proteins (Figure 4B, histograms 1, 4, 8, 12, 16, 20, 24). We further examined the effects of the combination of mouse or human Zac1 and HPV18 E2 on IL-11, IL-6, and SOCS3 levels using RT-PCR and western blotting. Our data showed that both mouse and human Zac1 acted synergistically with E2 to induce IL-11 transcription, but not translation, in HeLa cells (Figure 4C, 4D). No apparent effect on the IL-6 mRNA was observed, but the combination randomly affected IL-6 proteins.
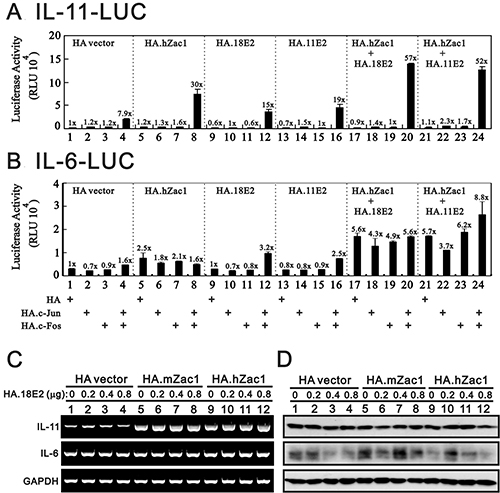
Figure 4: HPV E2 protein within the Zac1/AP1 complex enhances IL-11 promoter activities. HeLa cells were transiently transfected for 36 h with 0.5 μg of IL-11-LUC (A) or IL-6-LUC (B) along with 0.5 μg of pSG5.HA, pSG5.HA.c-Jun, pSG5.HA.c-Fos, pSG5.HA.hZac1, pSG5.HA.11E2 or pSG5.HA.18E2. Cells were then harvested for luciferase reporter assays. The numbers above the columns (A and B) indicate the luciferase activity relative to an index of 1 assigned to the reporter with empty vector. HeLa cells were transiently transfected for 36 h with 0.5 μg of pSG5.HA, pSG5.HA.mZac1, pSG5.HA.hZac1, and pSG5.HA.18E2 along with 0.5 μg of pSG5.HA.18E2. The cells were then collected and subjected to RT-PCR analysis of IL11, IL-6, and GAPDH (loading control) mRNA expression (C) and immunoblot analysis of IL-11, IL-6, and ACTN (loading control) protein expression (D). Results are representative of three independent experiments.
HIF-1α acted synergistically with AP-1 to enhance IL-11 promoter activity in HeLa cells
Hypoxia can induce IL-11 expression in the human colon cancer cell line, HCT116, through cooperative interactions between HIF-1α and AP-1 within the IL-11 promoter [43]. We treated HeLa cells with the hypoxia mimetic, cobalt chloride (CoCl2), or 1% O2 for 4 h. Neither CoCl2 nor 1% O2 induced IL-11 expression (Figure 5A). The Zac1/AP-1, Zac1/HIF-1α, and HIF-1α/AP-1 complexes acted synergistically within the IL-11 promoter region in PMA- and copper sulfate-treated HeLa cells (Figure 5B). The Zac1/HIF-1α complex induced the greatest amount of IL-11 promoter activity.
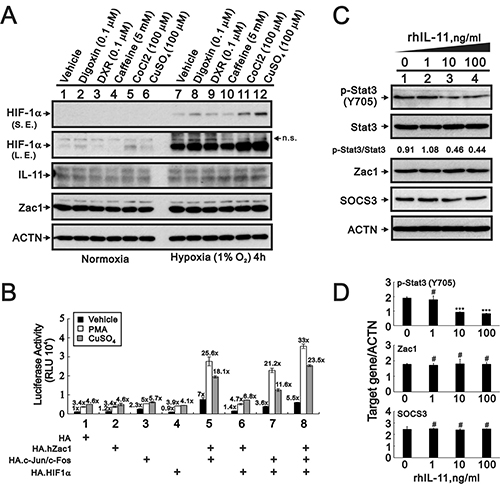
Figure 5: Expression of IL-11 protein is modulated by cobalt chloride, copper sulfate, and hypoxia. (A) HeLa cells were cultured for 4 h in the presence of digoxin (0.1 μM), DXR (0.1 μM), caffeine (5 mM), CoCl2 (100 μM), or CuSO4 (100 μM). The cells were then collected and subjected to Western blot analysis for detection of HIF1α, IL-11, Zac1, and PCNA (loading control) expression. S.E.: shorter exposure, L.E.: longer exposure, n.s.: not specific band. (B) HeLa cells were transiently transfected with 0.5 μg of IL-11-LUC along with 0.5 μg of pSG5.HA, pSG5.HA.HIF-1α, pSG5.HA.c-Jun, or pSG5.HA.c-Fos in the presence of vehicle, PMA, or copper sulfate for 36 h. Cells were then harvested for luciferase reporter assays. The numbers above the columns indicate the luciferase activity relative to an index of 1 assigned to the reporter with empty vector and vehicle. (C–D) HeLa cells were treated for 24 h with indicated amounts of rIL-11. (C) The cells were collected and subjected to immunoblot analysis for the detection of p-Stat3 (Y705), Stat3, Zac1, SOCS3, and ACTN (loading control) expression. (D) Quantitative analysis of proteins is presented as the mean ± S.D. of at least three independent experiments; #p > 0.05 and ***p < 0.001 vs the level of ACTN (Student’s t-test).
Multiple studies have shown that the IL-11/IL-11R/STAT3/NF-κB signaling axis plays important roles in tumor growth, angiogenesis, and metastasis [44–52]. We examined the functional role of IL-11 in HeLa cells using a recombinant IL-11 (rIL-11) protein. Our western blotting results showed that p-Stat3 (Y705) and the p-Stat3(Y705)/Stat3 ratio were decreased in a rIL-11 dependent manner in HeLa cells (Figure 5C and 5D). Zacl and SOCS3 were not affected by the addition of rIL-11.
ZAC1 silencing downregulated IL-11 expression
We stably silenced ZAC1 expression in HeLa cells. The silencing efficacy of clone #262361 was better than that of #262362 (Figure 6A). Our data suggested that IL-11, not SOCS3 or IL-11Rα, was suppressed in HeLa cells. Caffeine, digoxin, TSA, cobalt chloride, and rIL-11 were employed separately to examine their impacts on ZAC1-induced IL-11 expression in HeLa cells. We observed no apparent effects on ZAC1 target mRNA expression (Figure 6B). We further examined the effects of copper sulfate, digoxin, and caffeine on p53, SOCS3, and IL-11 proteins in shZAC1 HeLa cells. All three of these agents suppressed IL-11 protein expression in these cells (Figure 6C–6E), including copper sulfate decreased IL-11 expression, digoxin selectively decreased SOCS3 and IL-11 expression, and caffeine decreased IL-11 expression. Consistent with our previous work, digoxin and caffeine increased the β form of p53 in shZAC1 HeLa cells [53, 54].
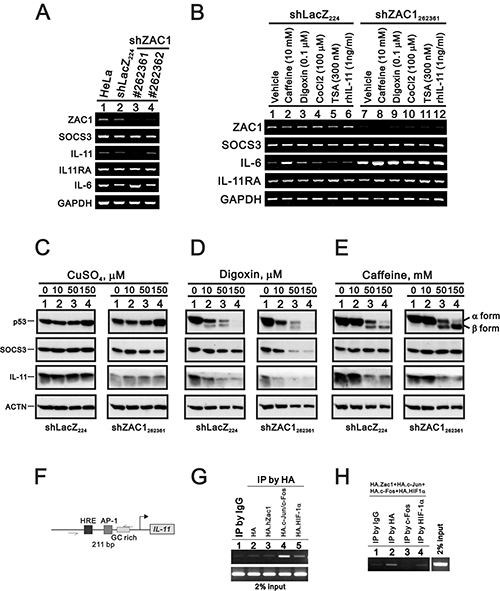
Figure 6: Effects of copper sulfate, digoxin, and caffeine on p53 and SOCS3 expression in ZAC1 knockdown cells. (A) Parental HeLa cells, an shLacZ control clone and two shZAC1 knockdown clones were collected and subjected to RT-PCR analysis of ZAC1, SOCS3 IL-11, IL-6, IL-11Rα, and GAPDH (loading control) mRNA expression. (B) HeLa shLacZ and shZAC1262361 cells were treated for 20 h with caffeine (10 mM), digoxin (0.1 μM), CoCl2 (100 μM), TSA (300 nM), or rIL-11 (1 ng/ml), after which they were subjected to RT-PCR analysis of ZAC1, SOCS3 IL-11, IL-6, IL-11Rα, and GAPDH (loading control) mRNA expression. HeLa shLacZ and shZAC1262361 cells were treated for 20 h with indicated amounts of copper sulfate (C), digoxin (D), or caffeine (E) and subjected to immunoblot analysis for the detection of p53, SOCS3, IL11, and ACTN (loading control) protein expression. (F) Schematic representation of the hypoxia responsive element (HRE), AP-1 binding element, and GC-rich region of the IL-11 promoter. (G–H) HeLa cells were transiently transfected for 36 h with 4 μg of pSG5HA vector, pSG5HA.Zac1, pSG5HA.c-Jun+pSG5HA.c-Fos, or pSG5HA.HIF-1α (G) or with 2 μg of pSG5HA.Zac1, pSG5HA.c-Jun+pSG5HA.c-Fos, and pSG5HA.HIF-1α (H). Cell lysates were immunoprecipitated using anti-IgG and anti-HA antibodies (G) or with anti-IgG, anti-HA, anti-c-Fos, or anti-HIF-1α antibody (H) and then subjected to PCR analysis. Results are representative of three independent experiments.
We further assessed ZAC1-regulated IL-11 expression using the chromatin immunoprecipitation (ChIP) assay in HeLa cells. Previous studies showed that the IL-11 promoter region contains two AP-1 sites adjacent to a GC-rich region, a potential Zac1-binding site (Figure 6F). Our ChIP analysis demonstrated that ZAC1 failed to directly bind this 211 bp fragment, but c-Fos did (Figure 6G). However, Zac1 might primarily bind the AP-1 site of the IL-11 promoter in complex with AP-1 in HeLa cells (Figure 6H).
The IL-6/IL-11 ratio is clinically relevant for guiding OA treatment options
Cartilage degradation and erosion are important pathogenetic mechanisms in OA [6]. Chemokines and cytokines play key roles in OA pathogenesis. We analyzed the abundance of various cytokines, including IL-1β, IL-6, and IL-11 from the synovial fluids of 77 OA patients using the Cytometric Bead Array (CBA) flex sets (Figure 7). We compared IL-6 and IL-11 median values from the CBA data to define high vs. low IL-6 or IL-11 levels in this study (Table 3). We analyzed 65 OA cases to identify trends in IL-6 level, which was the primary determinant for aggressive vs. conventional clinical treatment (Table 4). In general, high IL-6 level of OA patients received the aggressive treatment, whereas high IL-11 level had the possibility to receive the conventional treatment. Most of low IL-6 level of OA patients received the conventional treatment, whereas low IL-11 level had the possibility to receive the aggressive treatment. Based on the analysis, we further found one OA case with high IL-6 and low IL-11 levels (10731 ng/ml IL-6 vs. 1255 ng/ml IL-11) in the synovial fluid of the right knee associated with recurrent joint effusion and progressive OA joint damage. In contrast, a patient with high IL-11 and low IL-6 levels (538 ng/ml IL-11 vs. 15 ng/ml IL-6) in the left knee responded well to conventional treatment over two years. Thus, the use of high vs. low IL-11 or IL-6 levels to determine OA treatment options requires additional clinical study.
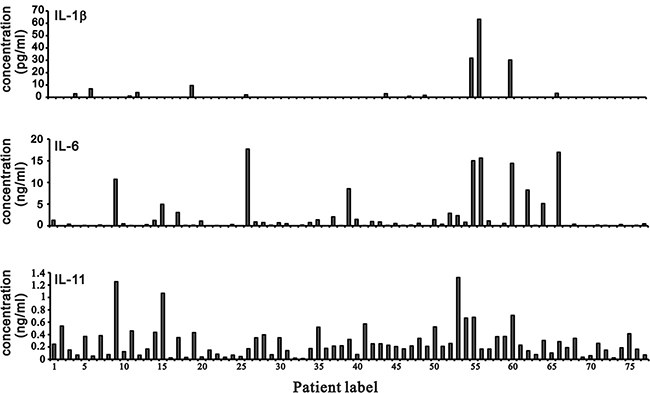
Figure 7: IL-1β, IL-6, and IL-11 levels in synovial fluid from OA patients. IL-1β, IL-6, and IL-11 levels were measured in samples of synovial fluid from OA patients using a BD™ CBA Human Soluble Protein Flex Set System.
Table 3: Summary of IL-6 and IL-11 values of OA patients
IL-6 |
IL-11 |
||||
|---|---|---|---|---|---|
Statistic |
Standard error |
Statistic |
Standard error |
||
Mean |
2005.86 |
504.37 |
295.49 |
32.91 |
|
95% Confidence interval for mean |
Lower bound |
998.28 |
229.75 |
||
Upper Bound |
3013.45 |
361.24 |
|||
Median |
371.09 |
219.73 |
|||
Skewness |
2.63 |
.297 |
2.10 |
.297 |
|
Kurtosis |
6.09 |
.586 |
5.36 |
.586 |
|
Table 4: Summary of aggressive or conventional treatment of OA patients based on the relative amount of IL-6 and IL-11
Group |
Total |
||||
|---|---|---|---|---|---|
Aggressive treatment |
Conventional treatment |
||||
high IL-6 |
low IL-11 |
Count |
12 |
0 |
12 |
Expected Count |
5.7 |
6.3 |
12.0 |
||
% within IL-6_IL-11 |
100.0% |
0.0% |
100.0% |
||
% within Group |
38.7% |
0.0% |
18.5% |
||
high IL-11 |
Count |
18 |
3 |
21 |
|
Expected Count |
10.0 |
11.0 |
21.0 |
||
% within IL-6_IL-11 |
85.7% |
14.3% |
100.0% |
||
% within Group |
58.1% |
8.8% |
32.3% |
||
low IL-6 |
low IL-11 |
Count |
1 |
19 |
20 |
Expected Count |
9.5 |
10.5 |
20.0 |
||
% within IL-6_IL-11 |
5.0% |
95.0% |
100.0% |
||
% within Group |
3.2% |
55.9% |
30.8% |
||
high IL-11 |
Count |
0 |
12 |
12 |
|
Expected Count |
5.7 |
6.3 |
12.0 |
||
% within IL-6_IL-11 |
0.0% |
100.0% |
100.0% |
||
% within Group |
0.0% |
35.3% |
18.5% |
||
Total |
Count |
31 |
34 |
65 |
|
Expected Count |
31.0 |
34.0 |
65.0 |
||
% within IL-6_IL-11 |
47.7% |
52.3% |
100.0% |
||
% within Group |
100.0% |
100.0% |
100.0% |
||
Synoviocytes and chondrocytes from OA patients
To investigate the possible effects of IL-6 and IL-11 on OA progression, we cultured synoviocytes and chondrocytes from OA patient synovial tissue and articular hyaline cartilage, respectively, and measured Il-6 and IL-11 levels. We assessed cell morphology and verified cell characteristics using RT-PCR and western blotting analysis (Figure 8A and 8B; cadherin-11: synoviocyte marker, aggrecan: chondrocyte marker) [55, 56]. We measured the effects of 10 ng/ml rIL-11 on gene expression in synoviocytes and chondrocytes, including that of cadherin-11, aggrecan, IL-6, IL-11, matrix metalloproteinase-2 (MMP-2), and MMP-9. IL-11 induced IL-6 and MMP-9 expression in synoviocytes and suppressed IL-11 expression in chondrocytes (Figure 8C). We observed no effects on cadherin-11, aggrecan, or MMP-2 levels. IL-11 and IL-6 increased Akt phosphorylation, but did not impact other signaling pathways, including STAT3, m-TOR, and ERK (Figure 8D).
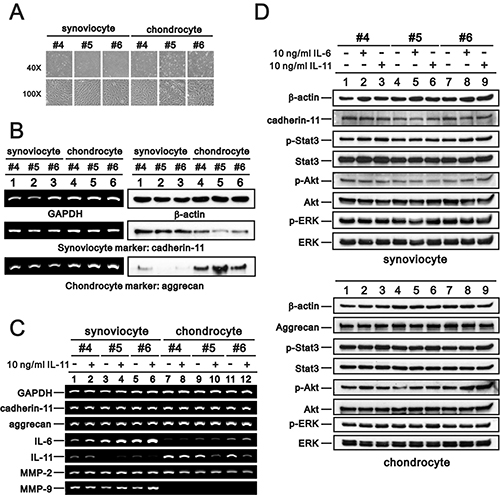
Figure 8: Characteristics of primary synoviocytes and chondrocytes. Synoviocytes and chondrocytes from OA patients were observed under a light microscope (A) and subjected to RT-PCR analysis of cadherin-11, aggrecan, and GAPDH (loading control) mRNA expression and immunoblot analysis of cadherin-11, aggrecan, and β-actin (loading control) protein expression (B). (C, D) Synoviocytes and chondrocytes were treated with 10 ng/ml rIL-11 for 20 h, after which the cells were subjected to RT-PCR analysis of cadherin-11, aggrecan, IL-6, IL-11, MMP-2, MMP-9, and GAPDH (loading control) mRNA expression (C) and immunoblot analysis of cadherin-11 (for synoviocytes), aggrecan (for chondrocytes), p-Stat3, Stat3, p-ERK, ERK, p-Akt, Akt, and β-actin (loading control) protein expression (D). Results are representative of three independent experiments.
DISCUSSION
In this work, we verified that Zac1 induced IL-11 expression in HeLa cells. Zac1 might indirectly bind the IL-11 promoter as a transcription factor or/and cofactor complexed with AP-1, HIF-1α, or other transcription factors (Figure 9). Zac1 may also induce IL-6 expression under specific conditions. Finally, we observed that high or low IL6 or IL-11 levels might serve as indicators to determine which treatment strategy would best benefit a given OA patient. Our work provides novel insight into IL-11 expression regulation and the clinical relevance of the IL-11/IL-6 ratio in OA patients.
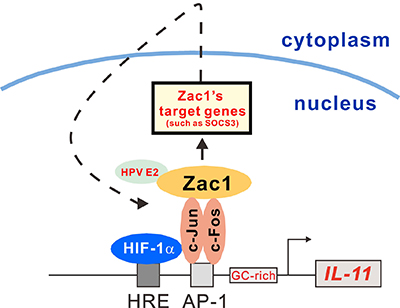
Figure 9: Schematic representation of the HRE and AP-1 binding element and the GC-rich region of the IL-11 promoter. Transcription factor Zac1 may not only induce transcription of target genes, such as SOCS3, it may also bind to host cellular proteins involved into the IL-11 gene regulation, such as HPV E2. Zac1 might also act as a transcriptional factor coactivator for AP-1 and HIF-1α to form induction complexes on the IL-11 promoter in HeLa cells.
A functional IL-11Rα subunit might trigger signal transduction by IL-11 in human cancer cells cultured under hypoxic conditions [43]. Zac1 also induced IL-11Rα, and recombinant IL-11 proteins failed to activate STAT3 phosphorylation in this study. Most of current experimental conditions might not be performed in the hypoxic situation and the expression of IL-11 mRNA is inconsistent with a hypoxia-inducible gene in HeLa cells. One study showed that IL-11 and IL-11Rα are co-expressed in rheumatoid arthritis synovitis fluid fibroblasts and endothelial cells and thus interconnect the function of these two cell types, whereas macrophages are not IL-11 responder cells because of no IL-11Rα expression [57]. Therefore, activation of the IL-11/IL-11Rα complex under hypoxic conditions must be addressed with respect to tumorigenesis. Previous studies demonstrated that copper sulfate induced HIF-1α expression via the c-Fos and hypoxia reduced some AP-1 protein expression [58, 59]. However, our results suggested that copper sulfate might positively or negatively regulate HIF-1α expression depending on hypoxic conditions.
Cartilage consists of two main extracellular matrix (ECM) macromolecules: type II collagen (COL2A1) and a large aggregating proteoglycan, aggrecan [10]. COL2A1, the major cartilage collagen, and types IX and X encoding so-called cartilage-specific collagens are the predominant ECM structural proteins involved into OA pathogenesis. COL9A3 is associated with knee OA in the Japanese population [60] and was among the top five Zac1-induced genes in our study. Zac1 expression patterns correlated with COL2A1 distribution during cartilage development [61]. Hence, ZAC1 might promote OA progression through regulation of cytokines, such as IL-11, or the collagens, such as COL2A1 or COL9A3, although verification of this hypothesis will require further study.
IL-6 and its family of proteins, including oncostatin M, are among the most prominently elevated cytokines in the OA inflammatory response [62]. Many studies have correlated of IL-6 levels in synovial fluid with cartilage pathology and associated outcomes in knee OA. Unlike IL-6, IL-11 is well studied with respect to OA [7–10]. MMP-9 activity is crucial for the destruction of articular cartilage in OA. Our data suggest that ZAC1 upregulates both IL-6 and IL-11 via AP-1 family proteins. Zac1 may directly induce expression of MMP-related genes through AP-1- and Sp1- dependent pathways. Thus, we propose that high vs. low IL-6 or IL-11 levels can be indicators for OA clinical treatments. However, there are likely additional factors within synovial fluid that could impact treatment decisions, and these require further study.
MATERIALS AND METHODS
Tetracycline-induced Zac1 and short-hairpin Zac1 RNA in HeLa cells
We established tetracycline-induced Zac1 expression in HeLa cells using the standard protocols for Tet-On Inducible Gene Expression System (Clontch, USA). Two vectors, pTet-On and pTRE-Zac1 (or control vector pTRE-LacZ), were screened and selected using G418 and hygromycin, respectively (Clontch, USA). Positive clones were expanded and sorted for Zac1 expression induced by doxycycline.
Zac1shRNA-containing lentiviral vectors were purchased from the National RNAi Core Facility (Academia Sinica, Taiwan, Republic of China) and prepared using standard protocols. Cells were infected with the indicated lentiviruses in selection medium containing 2 μg/ml polybrene. Forty-eight hours after infection, the cells were treated with 8 μg/ml puromycin for selection of resistant clones.
Cell culture, plasmid DNAs, and chemicals
HeLa cells were cultured in Dulbecco’s modified Eagle’s medium (DMEM) supplemented with 10% fetal bovine serum (FBS; Invitrogen, CA, USA) and 1% penicillin-streptomycin (Invitrogen). The pSG5.HA.Zac1, AP-1, and HPV E2 expression plasmids and IL-6 (−1260/+84)-LUC reporter have been described previously [26, 28, 29, 63]. IL-11(-750/+70)-LUC and SOCS3 promoter fragments were introduced into the pGL3-LUC vector at the BamHI/XhoI site. An expression vector for HIF-1α was constructed from a PCR fragment and introduced into the pSG5.HA vector at the EcoRI/XhoI site. Recombinant IL-6 and IL-11 proteins were purchased from R&D Systems (MN, USA). PMA, TSA, caffeine, digoxin, cobalt chloride, and copper sulfate were purchased from Sigma-Aldrich (MO, USA).
Total RNA isolation, mRNAs expression profiles, and first strand cDNA synthesis
Total RNA was isolated from HeLa cells using TRIzol reagent (Invitrogen) following the instructions provided by the manufacturer. Gene expression profiles were determined using the HOA OneArray method and HmiOA v5. RNA quantitation was provided by the Phalanx Biotech Group (HsinChu, Taiwan, ROC). The pass criteria indicating acceptable RNA purity using NanoDrop ND-1000 were the following absorbance ratios A260/A280 ≥ 1.8 and A260/A230 ≥ 1.5. RNA integrity (RIN) values were determined using an Agilent RNA 6000 Nano assay. The pass criterion was a value ≥ 6. Contamination by genomic DNA was evaluated using gel electrophoresis. Data were processed though the Rosetta Resolver® System (Rosetta Biosoftware). Reverse transcription for first strand cDNA synthesis was carried out using a ThermoScript™ RT-PCR system (Invitrogen) with 1 μg of total RNA. GAPDH was used as an internal control for normalization.
Luciferase reporter assay
HeLa cells were plated in 24-well plates and transfected using jetPEI (Polyplus Transfection Inc., New York, NY, USA) following the manufacturer’s protocol (Promega luciferase assay kit and DLR2 model). The total DNA was adjusted to 1.0 μg using empty vector. Cells were harvested for luciferase reporter assays using a Promega Luciferase Assay Kit. Values are expressed numerically as relative light units. Luciferase activity is presented as the mean ± SD of three transfected wells and is representative of at least three independent experiments.
Reverse transcription-polymerase chain reaction (RT-PCR)
One microgram of total RNA was subjected to the reverse transcription using MMLV reverse transcriptase for 60 min at 37° C (Epicentre Biotechnologies, USA). The PCR reactions were run in a Veriti Thermal Cycler (Applied Biosystems, MA, USA). PCR was performed in the linear range (30 cycles) with primers specific for hZac1, IL-11, IL-6, SOCS3, IL-11Rα, cadherin-11, aggrecan, MMP-2, MMP-9, and GAPDH. The sequences of the primers for the amplification of target genes are shown in Table 5. The thermocycling conditions were as follows: one cycle at 95° C for 5 mins followed by 30 cycles of 95° C for 45 s, 55° C for 30 s, and 72° C for 40 s. Amplified products were subjected to 1.2 % agarose gel electrophoresis and visualized by staining with ethidium bromide.
Table 5: PCR primers used in this study
Gene name |
Primer sequence (5′→3') |
|---|---|
hZac1 |
Forward: 5'-ttcctcaccctggagaag-3' Reverse: 5'-tccttgcatcctgtgtgg-3' |
IL-11 |
Forward: 5'-atgaactgtgtttgccgcctggtc-3' Reverse: 5'-tcacagccgagtcttcagcagcag-3' |
IL-6 |
Forward: 5'-atgaactccttctccacaagcgc-3' Reverse: 5'-ctacatttgccgaagagccctca-3' |
SOCS3 |
Forward: 5'-atggtcacccacagcaagtttccc-3' Reverse: 5'-ttaaagcggggcatcgtactggtc-3' |
IL-11Rα |
Forward: 5′-acctacatctgccagaccct-3' Reverse: 5′-tggtactgactctacccgca-3' |
cadherin-11 |
Forward: 5′-cgtggagggttcagtcggcaga-3′ Reverse: 5′-tactgatactcaggtttgat-3′ |
aggrecan |
Forward: 5′-cagaatctagcagtgagacgtc-3' Reverse: 5′-gtctgcagcagttgattctgat-3' |
MMP-2 |
Forward: 5′-cctgagatctgcaaacaggacatt-3' Reverse: 5′-ttcttcttcacctcattgtatctcc-3' |
MMP-9 |
Forward: 5′-aagtggcaccaccacaacat-3' Reverse: 5′-tttcccatcagcattgccgt-3' |
GAPDH |
Forward: 5'-aacggatttggccgtattggg-3' Reverse: 5'-gggatgaccttgcccacagcc-3' |
Western blotting analysis
For Western blotting, HeLa cells were lysed in RIPA buffer (100 mM Tris-HCl pH 8.0, 150 mM NaCl, 0.1% SDS, and 1% Triton 100) at 4° C, separated by SDS-PAGE, and analyzed by immunoblotting with antibodies against Zac1 (MW: 51 kDa; 1:2000 dilution) and p-Stat 3 (Y705) (MW: 88 kDa; 1:1000 dilution) (Abcam, Cambridge, UK); ACTN (MW: 100 kDa; 1:10000 dilution), aggrecan (MW: 200 kDa; 1:1000 dilution), cadherin-11 (MW: 110 kDa; 1:500 dilution), HIF-1α (MW: 132 kDa; 1:1000 dilution), IL-11 (MW: 23 kDa; 1:1000 dilution), IL-6 (MW: 21/27 kDa; 1:1000 dilution), SOCS3 (MW: 30 kDa; 1:1000 dilution), p53 (MW: 53 kDa; 1:2000 dilution), PCNA (MW: 36 kDa; 1:10000 dilution), and β-actin (MW: 43 kDa; 1:10000 dilution) (Santa Cruz, TX, USA); and Akt (MW: 60 kDa; 1:5000 dilution), p-Akt (MW: 60 kDa; 1:1000 dilution), ERK (MW: 42/44 kDa; 1:2000 dilution), p-ERK (MW: 42/44 kDa; 1:2000 dilution), Stat 3 (MW: 79/86 kDa; 1:1000 dilution), ChIP-grade Hemagglutinin (HA), ChIP-grade c-Fos, and ChIP-grade HIF-1α (Cell Signaling, MA, USA).
Chromatin Immunoprecipitation (ChIP) assays
ChIP assays were performed according to the manufacturer’s protocol (Cell Signaling Technology, #9003S). Briefly, chromatin/DNA proteins complexes were prepared from HeLa cells transfected for 24 h with 1 μg of pSG5-HA (empty vector), HA-mZac1, HA-Jun or/and HA-HIF-1α. Chemical cross-linking of DNA-proteins was carried out using 1% formaldehyde for 10 min at room temperature. The Cross-linking was quenched by addition of glycine for 5 min at room temperature and followed by two washes with ice-cold PBS. Cells were then scraped into PBS containing Protease Inhibitor Cocktail (PIC). The resultant cell suspension was centrifuged, and the pellet was mixed by inverting the tube every 3 min in buffer A + DTT+ PIC and then incubated for 10 min on ice. The pellet (nuclei) was resuspended in 100 μl of Buffer B +DTT + 0.5 μl of micrococcal nuclease and incubated for 20 min at 37° C with frequent mixing to digest the DNA to lengths of approximately 150–900 bp. The nuclei were then completely lysed by sonication using Q125 sonicator (Qsonica, NY, USA). The lysate was incubated overnight at 4° C with rotation with appropriate ChIP-grade anti-HA, anti-c-Fos, or anti-HIF-1α antibody (Cell Signaling Technology) to immunoprecipitate chromatin. This was followed by incubation 2 h at 4° C with rotation with ChIP-grade protein G magnetic beads. The magnetic beads were washed using buffers supplied with the kit. The eluted DNA was purified using ChIP DNA Clean & Concentrator Kits (Zymo Research, CA, USA) and analyzed using PCR to assess binding of c-Jun, HIF-1α, or Zac1 to the IL-11 promoter. The PCR primers were designed using criteria described in the kit. A region of the human IL-11 promoter bearing putative binding sites for both AP-1 and HRE and a GC-rich potential Zac1 binding site were amplified using the following primers: 5′-AGC CTG AGT GTC TGC TCC G-3′ (forward) and 5′-TGA CAC ATC CTG ACT CAC CCT CC-3′ (reverse). The control primers for human RPL30 exon 3 were provided with the kit. End-point PCR amplification was performed using EmeraldAmp MAX HS PCR Master Mix (Clontech, CA, USA) and using the Applied Biosystems Veriti Mastercycler.
Patient recruitment and collection of synovial fluid
Synovial fluids were collected from patients who underwent medical examinations at the National Defense Medical Center (Taipei, Taiwan, ROC). The Institutional Review Board of Tri-Service General Hospital, Taipei, Taiwan approved the study protocol, and signed informed consent was obtained from all subjects before study participation (TSGHIRB No:1-104-05-066). Radiographs were reviewed to determine the size and stage of progression of the OA lesions. Synovial fluid was collected from OA patients using a 22-gauge needle and then stored at −80° C until assayed.
IL-1β, IL-6, and IL-11 measurement
IL-1β, IL-6, and IL-11 levels were measured using a BD™ CBA Human Soluble Protein Flex Set System (Becton Dickson, San Jose, CA) according to the manufacturer’s instructions. For CBA analysis, diluted synovial fluid or standards were mixed with Capture Beads, vortexed, centrifuged, and transferred to tubes containing PE Detection Reagents for incubation and analysis. The complexes were then analyzed using flow cytometry (FACScan argon laser cytometer) to identify particles with fluorescence characteristics of both the bead and the detector. Data were analyzed using FCAP Array software (No. 652099).
Cultures of chondrocytes and synoviocytes
To culture chondrocytes, samples of articular hyaline cartilage were collected from patients who underwent total knee replacement to treat OA. The cartilage was minced into 1–5 mm3 pieces and digested in 5–8 ml of 0.2% collagenase II (Sigma-Aldrich) for 12–16 h at 37° C under 5% CO2. The dissociated chondrocytes were then centrifuged, after which the pellets were re-suspended in 5 ml of DMEM/F12 (Invitrogen) containing 15% FBS and 1% penicillin/streptomycin solution, transferred to a culture flask, and incubated for 24 h at 37° C under 5% CO2. After refreshing the growth medium, the remaining adherent cells were cultured for an additional 2 weeks, changing the growth medium every 3 days. Chondrocyte passages 1 and 2 were used for experiments.
To culture synoviocytes, samples of synovial tissues were treated with trypsin (10% v/v) for 15 min in a 37° C water bath, and the resultant tissue fragments were transferred to DMEM containing 5% FCS, penicillin-streptomycin-Fungizone and 2 mg/ml clostridial collagenase type IV (Sigma-Aldrich). The fragments were then digested on a gyratory shaker for approximately 3 h to dissociate the synoviocytes. The cells were washed and cultured in T175 flasks for 24 h. After refreshing the medium, the adherent synovial cells were further cultured until experiments were performed.
Light microscopic analysis of cell morphology
Human chondrocytes (or synoviocytes) grown in 24-well plates to 80% confluence were examined using an Zeiss Axiovert 40 C light microscope (Göttingen, Germany).
Statistical analysis
Student’s t-test was used to compare protein amounts derived from Western blot analysis. The Mann–Whitney U test was used to compare levels of IL-11 and IL-6 in samples from recruited OA patients. All values are expressed as means ± SEM. Values of P < 0.05 were considered significant.
Abbreviations
IL: Interleukin; OA: osteoarthritis; Zac1: a zinc finger protein which regulates apoptosis and cell cycle arrest; gp130: glycoprotein 130; JAK: Janus tyrosine Kinase; STAT: Signal Transducer and Activator of Transcription; PACAP1-R: type I pituitary adenylate cyclase-activating polypeptide receptor gene; HPV: human papillomavirus; NRs: nuclear receptors; IL-11Rα: receptor alpha of IL-11; RT-PCR: reverse transcription-polymerase chain reaction; Dox: doxycycline; PMA: phorbol 12-myristate 13-acetate; TSA: trichostatin A; rIL-11: recombinant IL-11; MMP: matrix metalloproteinase; ACTN: α-actinin; HA: hemagglutinin; ChIP: chromatin immunoprecipitation; FACS: fluorescence-activated cell sorting; PI: propidium iodide.
ACKNOWLEDGMENTS
We gratefully acknowledge all of the funding sources.
CONFLICTS OF INTEREST
The authors declare that they have no conflicts of interest.
GRANT SUPPORT
This work was supported by grants from the Ministry of National Defense-Medical Affairs Bureau [MAB–106–021 to S-M HUANG], and the Ministry of Science and Technology [NSC 102-2320-B-016-015-MY3 to S-M HUANG], Taiwan, ROC.
REFERENCES
1. Lokau J, Agthe M, Flynn CM, Garbers C. Proteolytic control of Interleukin-11 and Interleukin-6 biology. Biochim Biophys Acta. 2017; 1864:2105–17.
2. Schaper F, Rose-John S. Interleukin-6: Biology, signaling and strategies of blockade. Cytokine Growth Factor Rev. 2015; 26:475–87.
3. Garbers C, Scheller J. Interleukin-6 and interleukin-11: same same but different. Biol Chem. 2013; 394:1145–61.
4. Naka T, Nishimoto N, Kishimoto T. The paradigm of IL-6: from basic science to medicine. Arthritis Res. 2002; 4:S233–42.
5. Muraki S, Oka H, Akune T, Mabuchi A, En-yo Y, Yoshida M, Saika A, Suzuki T, Yoshida H, Ishibashi H, Yamamoto S, Nakamura K, Kawaguchi H, et al. Prevalence of radiographic knee osteoarthritis and its association with knee pain in the elderly of Japanese population-based cohorts: the ROAD study. Osteoarthritis Cartilage. 2009; 17:1137–43.
6. van der Kraan PM, van den Berg WB. Chondrocyte hypertrophy and osteoarthritis: role in initiation and progression of cartilage degeneration. Osteoarthritis Cartilage. 2012; 20:223–32.
7. Walmsley M, Butler DM, Marinova-Mutafchieva L, Feldmann M. An anti-inflammatory role for interleukin-11 in established murine collagen-induced arthritis. Immunology. 1998; 95:31–7.
8. Sandell LJ, Aigner T. Articular cartilage and changes in arthritis. An introduction: cell biology of osteoarthritis. Arthritis Res. 2001; 3:107–13.
9. Mort JS, Billington CJ. Articular cartilage and changes in arthritis: matrix degradation. Arthritis Res. 2001; 3:337–41.
10. Roughley PJ. Articular cartilage and changes in arthritis: noncollagenous proteins and proteoglycans in the extracellular matrix of cartilage. Arthritis Res. 2001; 3:342–7.
11. Heinrich PC, Behrmann I, Haan S, Hermanns HM, Muller-Newen G, Schaper F. Principles of interleukin (IL)-6-type cytokine signalling and its regulation. Biochem J. 2003; 374:1–20.
12. Putoczki T, Ernst M. More than a sidekick: the IL-6 family cytokine IL-11 links inflammation to cancer. J Leukoc Biol. 2010; 88:1109–17.
13. Ernst M, Najdovska M, Grail D, Lundgren-May T, Buchert M, Tye H, Matthews VB, Armes J, Bhathal PS, Hughes NR, Marcusson EG, Karras JG, Na S, et al. STAT3 and STAT1 mediate IL-11-dependent and inflammation-associated gastric tumorigenesis in gp130 receptor mutant mice. J Clin Invest. 2008; 118:1727–38.
14. Varrault A, Ciani E, Apiou F, Bilanges B, Hoffmann A, Pantaloni C, Bockaert J, Spengler D, Journot L. hZAC encodes a zinc finger protein with antiproliferative properties and maps to a chromosomal region frequently lost in cancer. Proc Natl Acad Sci U S A. 1998; 95:8835–40.
15. Hoffmann A, Ciani E, Houssami S, Brabet P, Journot L, Spengler D. Induction of type I PACAP receptor expression by the new zinc finger protein Zac1 and p53. Ann N Y Acad Sci. 1998; 865:49–58.
16. Spengler D, Villalba M, Hoffmann A, Pantaloni C, Houssami S, Bockaert J, Journot L. Regulation of apoptosis and cell cycle arrest by Zac1, a novel zinc finger protein expressed in the pituitary gland and the brain. EMBO J. 1997; 16:2814–25.
17. Czubryt MP, Lamoureux L, Ramjiawan A, Abrenica B, Jangamreddy J, Swan K. Regulation of cardiomyocyte Glut4 expression by ZAC1. J Biol Chem. 2010; 285:16942–50.
18. Yuasa S, Onizuka T, Shimoji K, Ohno Y, Kageyama T, Yoon SH, Egashira T, Seki T, Hashimoto H, Nishiyama T, Kaneda R, Murata M, Hattori F, et al. Zac1 is an essential transcription factor for cardiac morphogenesis. Circ Res. 2010; 106:1083–91.
19. Barz T, Hoffmann A, Panhuysen M, Spengler D. Peroxisome proliferator-activated receptor gamma is a Zac target gene mediating Zac antiproliferation. Cancer Res. 2006; 66:11975–82.
20. Hoffmann A, Ciani E, Boeckardt J, Holsboer F, Journot L, Spengler D. Transcriptional activities of the zinc finger protein Zac are differentially controlled by DNA binding. Mol Cell Biol. 2003; 23:988–1003.
21. Schmidt-Edelkraut U, Hoffmann A, Daniel G, Spengler D. Zac1 regulates astroglial differentiation of neural stem cells through Socs3. Stem Cells. 2013; 31:1621–32.
22. Ho CL, Huang YC, Tai CK, Liu ST, Wang JK, Wang WM, Huang SM. Modulation of the Zac1’s transactivation and coactivation functions via PML and Daxx within distinct subcellular localizations. Int J Biochem Cell Biol. 2010; 42:902–10.
23. Huang SM, Huang SP, Wang SL, Liu PY. Importin alpha1 is involved in the nuclear localization of Zac1 and the induction of p21WAF1/CIP1 by Zac1. Biochem J. 2007; 402:359–66.
24. Huang SM, Schonthal AH, Stallcup MR. Enhancement of p53-dependent gene activation by the transcriptional coactivator Zac1. Oncogene. 2001; 20:2134–43.
25. Wang WM, Chung MH, Huang SM. Regulation of nuclear receptor activities by two human papillomavirus type 18 oncoproteins, E6 and E7. Biochem Biophys Res Commun. 2003; 303:932–9.
26. Wu MH, Huang CJ, Liu ST, Liu PY, Ho CL, Huang SM. Physical and functional interactions of human papillomavirus E2 protein with nuclear receptor coactivators. Biochem Biophys Res Commun. 2007; 356:523–8.
27. Rozenfeld-Granot G, Krishnamurthy J, Kannan K, Toren A, Amariglio N, Givol D, Rechavi G. A positive feedback mechanism in the transcriptional activation of Apaf-1 by p53 and the coactivator Zac-1. Oncogene. 2002; 21:1469–76.
28. Huang SM, Stallcup MR. Mouse Zac1, a transcriptional coactivator and repressor for nuclear receptors. Mol Cell Biol. 2000; 20:1855–67.
29. Wang WM, Liu ST, Huang SM, Lin WS, Chen SG, Chang YL. Zac1 functional interactions mediate AP-1 transcriptional activity. Biochim Biophys Acta. 2011; 1813:2050–60.
30. Tian H, Qian GW, Li W, Chen FF, Di JH, Zhang BF, Pei DS, Ma P, Zheng JN. A critical role of Sp1 transcription factor in regulating the human Ki-67 gene expression. Tumour Biol. 2011; 32:273–83.
31. Liu ST, Lu GY, Hsu YJ, Chang LC, Ho CL, Huang SM. Dual roles for lysine 490 of promyelocytic leukemia protein in the transactivation of glucocorticoid receptor-interacting protein 1. Biochim Biophys Acta. 2013; 1833:1799–810.
32. Liu ST, Chang YL, Wang WM, Chung MH, Lin WS, Chou WY, Huang SM. A non-covalent interaction between small ubiquitin-like modifier-1 and Zac1 regulates Zac1 cellular functions. Int J Biochem Cell Biol. 2012; 44:547–55.
33. Liu PY, Chan JY, Lin HC, Wang SL, Liu ST, Ho CL, Chang LC, Huang SM. Modulation of the Cyclin-Dependent Kinase Inhibitor p21WAF1/Cip1 Gene by Zac1 through the Antagonistic Regulators p53 and Histone Deacetylase 1 in HeLa Cells. Mol Cancer Res. 2008; 6:1204–14.
34. Shu G, Tang Y, Zhou Y, Wang C, Song JG. Zac1 is a histone acetylation-regulated NF-kappaB suppressor that mediates histone deacetylase inhibitor-induced apoptosis. Cell Death Differ. 2011; 18:1825–35.
35. Matsumoto T, Kuriwaka-Kido R, Kondo T, Endo I, Kido S. Regulation of osteoblast differentiation by interleukin-11 via AP-1 and Smad signaling. Endocr J. 2011; 59:91–101.
36. Kido S, Kuriwaka-Kido R, Umino-Miyatani Y, Endo I, Inoue D, Taniguchi H, Inoue Y, Imamura T, Matsumoto T. Mechanical stress activates Smad pathway through PKCdelta to enhance interleukin-11 gene transcription in osteoblasts. PLoS One. 2010; 5:e13090.
37. Lecureur V, Arzel M, Ameziane S, Houlbert N, Le Vee M, Jouneau S, Fardel O. MAPK- and PKC/CREB-dependent induction of interleukin-11 by the environmental contaminant formaldehyde in human bronchial epithelial cells. Toxicology. 2012; 6:13–22.
38. Kido S, Kuriwaka-Kido R, Imamura T, Ito Y, Inoue D, Matsumoto T. Mechanical stress induces Interleukin-11 expression to stimulate osteoblast differentiation. Bone. 2009; 45:1125–32.
39. Wolf J, Rose-John S, Garbers C. Interleukin-6 and its receptors: a highly regulated and dynamic system. Cytokine. 2014; 70:11–20.
40. Shimizu H, Mitomo K, Watanabe T, Okamoto S, Yamamoto K. Involvement of a NF-kappa B-like transcription factor in the activation of the interleukin-6 gene by inflammatory lymphokines. Mol Cell Biol. 1990; 10:561–8.
41. Yamazumi K, Nakayama T, Kusaba T, Wen CY, Yoshizaki A, Yakata Y, Nagayasu T, Sekine I. Expression of interleukin-11 and interleukin-11 receptor alpha in human colorectal adenocarcinoma; immunohistochemical analyses and correlation with clinicopathological factors. World J Gastroenterol. 2006; 12:317–21.
42. Inagaki Y, Tsunokawa Y, Takebe N, Nawa H, Nakanishi S, Terada M, Sugimura T. Nucleotide sequences of cDNAs for human papillomavirus type 18 transcripts in HeLa cells. J Virol. 1988; 62:1640–6.
43. Onnis B, Fer N, Rapisarda A, Perez VS, Melillo G. Autocrine production of IL-11 mediates tumorigenicity in hypoxic cancer cells. J Clin Invest. 2013; 123:1615–29.
44. Pollari S, Kakonen RS, Mohammad KS, Rissanen JP, Halleen JM, Warri A, Nissinen L, Pihlavisto M, Marjamaki A, Perala M, Guise TA, Kallioniemi O, Kakonen SM. Heparin-like polysaccharides reduce osteolytic bone destruction and tumor growth in a mouse model of breast cancer bone metastasis. Mol Cancer Res. 2012; 10:597–604.
45. Zhang Z, Zhang J, Miao L, Liu K, Yang S, Pan C, Jiao B. Interleukin-11 promotes the progress of gastric carcinoma via abnormally expressed versican. Int J Biol Sci. 2012; 8:383–93.
46. Sommer J, Effenberger T, Volpi E, Waetzig GH, Bernhardt M, Suthaus J, Garbers C, Rose-John S, Floss DM, Scheller J. Constitutively active mutant gp130 receptor protein from inflammatory hepatocellular adenoma is inhibited by an anti-gp130 antibody that specifically neutralizes interleukin 11 signaling. J Biol Chem. 2012; 287:13743–51.
47. Shin SY, Choi C, Lee HG, Lim Y, Lee YH. Transcriptional regulation of the interleukin-11 gene by oncogenic Ras. Carcinogenesis. 2012; 33:2467–76.
48. Li TM, Wu CM, Huang HC, Chou PC, Fong YC, Tang CH. Interleukin-11 increases cell motility and up-regulates intercellular adhesion molecule-1 expression in human chondrosarcoma cells. J Cell Biochem. 2012; 113:3353–62.
49. Lay V, Yap J, Sonderegger S, Dimitriadis E. Interleukin 11 regulates endometrial cancer cell adhesion and migration via STAT3. Int J Oncol. 2012; 41:759–64.
50. Vinuesa AG, Sancho R, Garcia-Limones C, Behrens A, ten Dijke P, Calzado MA, Munoz E. Vanilloid receptor-1 regulates neurogenic inflammation in colon and protects mice from colon cancer. Cancer Res. 2012; 72:1705–16.
51. Ernst M, Putoczki TL. Stat3: linking inflammation to (gastrointestinal) tumourigenesis. Clin Exp Pharmacol Physiol. 2012; 39:711–8.
52. Huang G, Yu L, Cooper LJ, Hollomon M, Huls H, Kleinerman ES. Genetically modified T cells targeting interleukin-11 receptor alpha-chain kill human osteosarcoma cells and induce the regression of established osteosarcoma lung metastases. Cancer Res. 2012; 72:271–81.
53. Lu GY, Huang SM, Liu ST, Liu PY, Chou WY, Lin WS. Caffeine induces tumor cytotoxicity via the regulation of alternative splicing in subsets of cancer-associated genes. Int J Biochem Cell Biol. 2014; 47:83–92.
54. Lu GY, Liu ST, Huang SM, Chang YL, Lin WS. Multiple effects of digoxin on subsets of cancer-associated genes through the alternative splicing pathway. Biochimie. 2014; 106:131–9.
55. Sive JI, Baird P, Jeziorsk M, Watkins A, Hoyland JA, Freemont AJ. Expression of chondrocyte markers by cells of normal and degenerate intervertebral discs. Mol Pathol. 2002; 55:91–7.
56. Agarwal SK, Lee DM, Kiener HP, Brenner MB. Coexpression of two mesenchymal cadherins, cadherin 11 and N-cadherin, on murine fibroblast-like synoviocytes. Arthritis Rheum. 2008; 58:1044–54.
57. Suen Y, Chang M, Lee SM, Buzby JS, Cairo MS. Regulation of interleukin-11 protein and mRNA expression in neonatal and adult fibroblasts and endothelial cells. Blood. 1994; 84:4125–34.
58. Rigiracciolo DC, Scarpelli A, Lappano R, Pisano A, Santolla MF, De Marco P, Cirillo F, Cappello AR, Dolce V, Belfiore A, Maggiolini M, De Francesco EM. Copper activates HIF-1alpha/GPER/VEGF signalling in cancer cells. Oncotarget. 2015; 6:34158–77. https://doi.org/10.18632/oncotarget.5779.
59. Yadav S, Kalra N, Ganju L, Singh M. Activator protein-1 (AP-1): a bridge between life and death in lung epithelial (A549) cells under hypoxia. Mol Cell Biochem. 2017; 436:99–110.
60. Ikeda T, Mabuchi A, Fukuda A, Kawakami A, Ryo Y, Yamamoto S, Miyoshi K, Haga N, Hiraoka H, Takatori Y, Kawaguchi H, Nakamura K, Ikegawa S. Association analysis of single nucleotide polymorphisms in cartilage-specific collagen genes with knee and hip osteoarthritis in the Japanese population. J Bone Miner Res. 2002; 17:1290–6.
61. Tsuda T, Markova D, Wang H, Evangelisti L, Pan TC, Chu ML. Zinc finger protein Zac1 is expressed in chondrogenic sites of the mouse. Dev Dyn. 2004; 229:340–8.
62. Akeson G, Malemud CJ. A Role for Soluble IL-6 Receptor in Osteoarthritis. J Funct Morphol Kinesiol. 2017; 2:pii27.
63. Wang WM, Chen JF, Liu ST, Hsu YJ, Liu YC, Huang SM. Biochemical properties of the recurrent LMX1b truncated mutant carried in a Taiwanese family with nail-patella syndrome. Br J Dermatol. 2014; 171:356–62.