
INTRODUCTION
Response to tyrosine kinase inhibitors (TKI) is usually monitored by measurement of hematologic, cytogenetic, and molecular responses [1, 2]. BCR-ABL mRNA transcripts are the major parameter used to assess the TKI molecular response and are usually measured in the peripheral blood at diagnosis, every 3 months until BCR-ABL transcripts are <0.1%, and then every 3-6 months thereafter [3]. According to the National Comprehensive Cancer Network (NCCN), Imatinib therapy is working if BCR-ABL transcripts are ≤10% after 3 months, <1% after 6 months, or undetectable after 18 months of therapy.
However, TKI-treated patients in which the BCR-ABL gene is no longer found or is un-detacted copies do not seem to be cured. In most of the cases, either the CML moves towards to the advanced phase, or BCR-ABL and CML cells show remission in more than half of the people who cease TKI treatment [4, 5].
Hence, genome-wide profiling of different phases of Imatinib-treated CML is expected to uncover signaling pathways and molecular mechanisms involved in Imatinib treatment at different phases of CML. Recent studies have suggested that clonal Copy Number Aberrations (CNAs) are rare or even absent in pediatric/adult-CML-chronic phase (CML-CP) and are relatively common at progressed stages [7, 12–14]. At the transcript level, signature genes identified in whole blood and leukemic stem cells have been shown to distinguish chronic phase (CP) from blast crisis (BC) [6] and to predict major cytogenetic response and non-response in chronic-phase CML patients treated with Imatinib [7]. However, an in vitro study and found no alteration in genomic changes of bone marrow-derived HSCs and HPCs from CML patients on Imatinib treatment [8].
Activation of ERK/MAPK, JAK-STAT, ErbB, cell surface genes, genes of oxidative metabolism and DNA repair pathways, activation of inflammatory cytokines and dysregulation of key cancer signaling pathways, as well as down-regulation of pro-differentiation and TGF-β/BMP signaling pathways have also been responsible for proliferation in CML [8–10].
In addition to copy number variations (CNVs) and expression profiling, genome-wide scoring of SNPs in different phases of Imatinib-treated CML will further help us to understand the resistance mechanism to TKIs.
At the transcript level, we were able to cluster TKI-sensitive and TKI-resistant cases and, after comparing, we identified the up-regulation of autophagy, complement, Tie-2 and Basigin signaling mediated homeostasis, protein ubiquitination, stem cell and down-regulation of immune system and TGF-beta pathways. Deregulation of these pathways was accompanied by low CNVs in CP-new and CP-UT-TKI-sensitive cases with undetectable BCR-ABL copies. High CNVs (previously reported gain of 9q34) were observed in BCR-ABL-independent and -dependent TKI, non-sensitive-CP-UT/AP-UT/B-UT and B-new samples. Further, using genotyping arrays, we assessed associations between individual SNPs and CML-resistance risk using odds ratios (ORs) and 95% confidence intervals (CIs) derived from logistic regression models. We identified that rsID239798 and 9475077 associated with the FAM83B gene, which may be directly related to treatment resistance in Imatinib-treated unrelated CML cases versus controls.
This analysis will be useful for a large segment of the medical research community for clinical screening of TKI-resistant and TKI-sensitive CML cases and develop a signature profile, which may help in monitoring therapy.
RESULTS
Differential gene expression levels among 35 CML-samples
To identify significant differential gene expression levels between 4 control and 35 CML samples (including both TKI-treated and newly diagnosed cases), a one-way between-subjects ANOVA algorithm was used. Differentially expressed coding and non-coding transcript clusters were identified using default filtering criteria (fold-change (linear) < -2 or fold-change (linear) > 2 and ANOVA p value ≤0.05). The array that was used measures 67,528 genes, including both coding (44,699) and non-coding (22,829) genes. Out of the total number of genes, only 2,073 genes were differentially expressed (1,425 coding and 648 non-coding). Compared to control among all CML samples, 69 genes were up-regulated (49 coding and 20 non-coding), and 2,004 genes were down-regulated (1,376 coding and 628 non-coding). Hierarchical clustering of the gene-level data revealed distinct clustering of 35 CML samples, including tri-phasic-TKI-treated, new cases and four normal controls (p=0.01, Figure 1a, Table 1 ). When comparing clusters with copies of BCR-ABL, samples with un-detected copies of BCR-ABL (CP-UT, AP-UT and some of CP-new cases) were classified under the first cluster as non-sensitive cases (p=0.01). The second cluster-sub-cluster-I included all control samples, and the second cluster-sub-cluster-II included CP new cases and cases in which copies of BCR-ABL were undetectable. The third cluster included samples showing ≥1-10% copies of BCR-ABL (CP-UT, AP-UT and new blast cases) (Table 1).
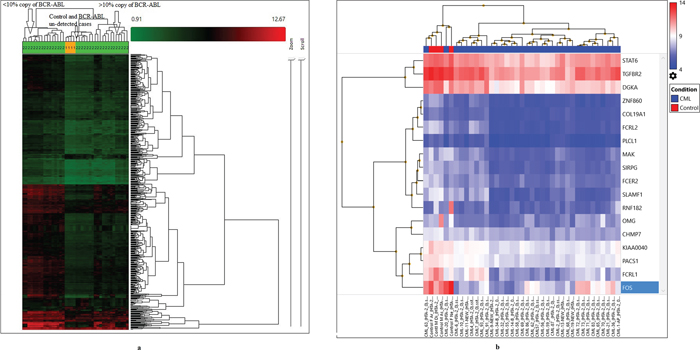
Figure 1: (a) Hierarchical clustering of the gene-level data revealed a distinct clustering of subgroups of all CML cases (35) and control (4) using default filtering criteria (fold-change (linear) < -2 or fold-change (linear) > 2 and ANOVA p value ≤0.05). (b) Gene level differential expression between 4 control and 35 CML samples using strict criteria (fold-change=2, p=0.001, and FDR p value=0.05) and considering only NM IDs, a highly significant down-regulation of 18 genes based upon which three clusters were formed.
Table 1: Hierarchical clustering of the gene-level data revealed distinct clustering of 35 samples of CML including all the three phases and 4 normal controls at p=0.01
Cluster-I-Sub-cluster-I |
||||||||
|---|---|---|---|---|---|---|---|---|
Sample-ID |
CML-Phases and treatment status |
Age/gender |
Sample collection date |
Time of Assessment |
Treatment |
Date of BCR-ABL assessment |
BCR-ABL percentage |
Comments based on BCR-ABL and treatment |
CML-69 |
AP-UT-69 |
40/F |
16-04-2015 |
3 months |
Imatinib |
04-11-2014 |
14.08 |
Imatinib non-sensitive |
29-04-2015 |
9.75 |
|||||||
CML-83 |
CP-New-83 |
70/M |
27-04-2015 |
New |
Imatinib |
18-04-2015 |
77.02 |
Not known |
CML-86 |
AP-UT-86 |
49/M |
27-04-2015 |
5 months |
Imatinib and march 2015 Nilotinib |
25-11-2014 |
18.04 |
Imatinib non-sensitive |
01-05-2015 |
2.45 |
|||||||
CML-72 |
AP-UT-72 |
45/M |
16-04-2015 |
6 months |
Imatinib and june 2015 Nilotinib |
16-10-2014 |
25.19 |
Imatinib non-sensitive and Nilotinib sensitive (TKI-sensitive) |
01-05-2015 |
5.45 |
|||||||
CML-73 |
CP-New-73 |
50/M |
22-04-2015 |
New |
Imatinib |
25-04-2015 |
73.8 |
Not known |
CML-70 |
AP-UT-70 |
30/M |
16-04-2015 |
1.0 year |
Imatinib and december 2014 nilotinib |
10-01-2015 |
20 |
Imatinib and Nilotinib non-sensitive(TKI-non sensitive) |
22-04-2015 |
1.63 |
|||||||
CML-71 |
CP-UT-71 |
52/M |
16-04-2015 |
8.2 yrs |
Initially Hydab, Unidrea and since october 2012 Imatinib and switched to nilotinib December 2014 |
15-04-2014 |
20 |
Initially Hydab, Unidrea and since october 2012 Imatinib and switched to nilotinib December 2014, TKI-non-sensitive |
22-06-2015 |
8.63 |
|||||||
Cluster-I-Sub-cluster-II |
||||||||
CML-55 |
CP-UT-55 |
60/M |
06-02-2015 |
3 months |
Hydroxyurea, Zyloric and Imatinib |
02-12-2014 |
98.47 |
Hydroxyurea, Zyloric and Imatinib non- sensitive |
01-05-2015 |
9.75 |
|||||||
CML-56 |
CP-UT-56 |
43/F |
09-02-2015 |
1.0 yr |
Hydroxyurea, Zyloric and Imatinib |
29-02-2014 |
89.5 |
Hydroxyurea, Zyloric and Imatinib non-sensitive |
24-03-2015 |
1.2 |
|||||||
CML-58 |
CP-UT-58 |
32/F |
09-02-2015 |
9 months |
Hydroxyurea, Zyloric and Imatinib |
12-04-2015 |
58.75 |
Hydroxyurea, Zyloric and Imatinib non-sensitive |
12-04-2015 |
9.8 |
|||||||
CML-62 |
AP-UT-62 |
42/M |
09-04-2015 |
4.4 yrs |
Unidrea, Imatinib and since February 2014 Nilotinib |
06-06-2014 |
14.96 |
Uridrea, Imatinib and Nilotinib non-sensitive (TKI-non-sensitive) |
22-06-2015 |
4.03 |
|||||||
CML-65 |
CP-UT-65 |
43/M |
20-04-2015 |
7.9 yrs |
Hydroxyurea, Zyloric and Imatinib later Nilotinib |
24-06-2014 |
18.95 |
Hydroxyurea, Zyloric Imatinib and Nilotinib was sensitive (TKI-non-sensitive) |
22-04-2015 |
4.63 |
|||||||
CML-57 |
CP-UT-57 |
42/F |
09-02-2015 |
7 months |
Hydroxyurea, Zyloric and Imatinib |
22-07-2014 |
67.45 |
Hydroxyurea, Zyloric and Imatinib non-sensitive |
22-04-2015 |
8 |
|||||||
CML-59 |
CP-UT-59 |
15/M |
01-04-2015 |
3 months |
Hydroxyurea, Zyloric and Imatinib |
11-12-2014 |
15.75 |
Hydroxyurea, Zyloric and Imatinib non-sensitive |
29-04-2015 |
9.75 |
|||||||
CML-14 |
B-New-14 |
35/F |
29-05-2014 |
New |
Hydroxyurea, Zyloric and Imatinib |
09-06-2014 |
85.56 |
Not known |
All controls |
||||||||
Cluster-2-sub cluster-II |
||||||||
CML-10 |
CP-New-10 |
20/M |
28-05-2014 |
New |
Imatinib |
28-05-2014 |
120 |
Not known |
06-02-2015 |
0.95 |
|||||||
CML-07 |
CP-UT-07 |
41/M |
22-05-2014 |
7.2 yrs |
Imatinib |
28-02-2007 |
100% |
Imatinib sensitive |
22-07-2014 |
not detected |
|||||||
CML-6 |
CP-UT-6 |
24/M |
22-05-2014 |
7 months |
Imatinib |
21-11-2013 |
75 |
Imatinib sensitive |
17-06-2014 |
not detected |
|||||||
CML-04 |
CP-UT-4 |
14/M |
22-05-2014 |
1.2 year |
Imatinib |
15-03-2013 |
100 |
Imatinib sensitive |
06-09-2014 |
not detected |
|||||||
CML-02 |
CP-UT-2 |
50/M |
22-05-2014 |
4 yrs |
Initially with Droxygel (Antacid), Unidrea and later with Imatinib |
14-02-2013 |
100% |
Initially with Droxygel (Antacid), Unidrea and later with Imatinib-sensitive |
20-03-2014 |
not detected |
|||||||
CML-1 |
AP-UT-1 |
35/M |
22-05-2014 |
1.8 yrs |
Imatinib |
30-08-2012 |
26 |
Imatinib sensitive |
CML-20 |
CP-UT-20 |
33/F |
05-06-2014 |
1 month |
Imatinib |
21-05-2014 |
97.54 |
NA |
Cluster-3-sub cluster-I |
||||||||
CML-34 |
B-New-34 |
24/M |
12-06-2014 |
New |
Imatinib and since February 2015 Nilotinib |
20-06-2014 |
35.63 |
Imatinib non-sensitive |
27-11-2014 |
95.37 |
|||||||
CML-09 |
CP-New-9 |
46/M |
28-05-2014 |
New |
Imatinib |
28-05-2014 |
100 |
Not known |
CML-32 |
AP-UT-32 |
27/F |
12-06-2014 |
15 yrs |
Initially treated with Myeleron, Hydab, Zyloric since may 2005 on Imatinib |
13-07-2014 |
55.63 |
Initially treated with Myeleron, Hydab, Zyloric since may 2005 on Imatinib-non-sensitive |
17-11-2014 |
35.37 |
|||||||
Cluster-3-sub cluster-II |
||||||||
CML-13 |
CP-UT-13 |
50/M |
29-05-2014 |
7.1 yrs |
Droxygel (Antacid), Unidrea and Imatinib |
20-02-2014 |
30 |
Droxygel (Antacid), Unidrea and Imatinib sensitive |
12-03-2015 |
0.1 |
|||||||
CML-21 |
CP-UT-21 |
60/M |
05-06-2014 |
3.8 yrs |
Droxygel (Antacid), Unidrea and Imatinib |
14-11-2013 |
75 |
Droxygel (Antacid), Unidrea and Imatinib sensitive |
31-07-2014 |
0.11 |
|||||||
CML-19 |
B-New-19 |
28/M |
29-05-2014 |
New |
Imatinib |
15-05-2014 |
100 |
Not known |
CML-11 |
CP-UT-11 |
33/F |
28-05-2014 |
4.2 yrs |
Hydab and Imatinib |
21-04-2010 |
97.54 |
Hydab and Imatinib sensitive |
21-05-2014 |
Not detectable |
|||||||
CML-36 |
CP-UT-36 |
23/M |
03-07-2014 |
6.10 yrs |
Initially Hydab and presently on Imatinib |
20-02-2010 |
30 |
Initially Hydab and Imatinib sensitive |
30-10-2014 |
0.11 |
|||||||
Cluster-3-sub cluster-III |
||||||||
CML-93 |
CP-UT-93 |
60/M |
08-06-2015 |
11 months |
Imatinib |
14-05-2014 |
100 |
Imatinib non-sensitive |
11-03-2015 |
70.13 |
|||||||
CML-68 |
CP-UT-68 |
28/M |
16-04-2015 |
4 months |
Imatinib |
22-09-2014 |
45.2 |
Imatinib non-sensitive |
22-04-2015 |
16.1 |
|||||||
CML-91 |
CP-UT-91 |
66/F |
08-06-2015 |
6 months |
Imatinib |
10-09-2014 |
38.52 |
Imatinib non-sensitive |
22-04-2015 |
26.1 |
|||||||
CML-63 |
CP-UT-63 |
37/M |
09-04-2015 |
7 months |
Imatinib |
21-08-2014 |
100 |
Imatinib non-sensitive |
09-04-2015 |
80 |
|||||||
CML-87 |
CP-UT-87 |
45/F |
08-06-2015 |
2.9 yrs |
Imatinib |
01-07-2015 |
86 |
Imatinib non-sensitive |
Both sub-cluster-I and II of I-cluster included non-sensitive cases with un-detected copies of BCR-ABL samples (Chronic Phase under treatment; CP-UT, accelerated phase under treatment; AP-UT and some of Chronic Phase-new; CP-new cases) In cluster-I sub-cluster-II all were treated with Hydroxyurea, Zyloric and Imatinib and were non-sensitive to the treatment. The second cluster-sub-cluster-I included all control samples and second cluster-sub-cluster-II included CP-new cases and cases where copies of BCR-ABL were undetectable. Third cluster included samples showing > or = 1 to 10% copies of BCR-ABL samples (CP-UT, AP-UT and new blast cases). In cluster-3 sub-cluster-I one patient was initially treated with Myeleron (Busulfan-15 years back), Hydab, Zyloric and later with Imatinib and in cluster-3 sub-cluster-II the samples except CML-19 all other were treated with Droxygel (Antacid), Unidrea/Hydab and Imatinib.
In the first cluster-sub-cluster-II, the CML-55, 56, 57, 58, 59 samples were all from patients treated with Hydroxyurea, Zyloric and Imatinib and were non-sensitive to treatment but for shorter time period (all within one year). In the third cluster sub-cluster-I, one patient was initially treated with Myeleron (Busulfan 15 years earlier), Hydab, and Zyloric and then later with Imatinib and then developed resistance. The third cluster sub-cluster-II contained samples treated with Droxygel (Antacid), Unidrea/Hydab and Imatinib for a longer time period (3.8 years-7.1 years).
Supplementary Table 1 shows the differential expression of genes between 4 control and 35 CML samples, including both TKI-treated and fresh diagnosed cases (p=0.01, fold-change=2, default FDR p value). These differentially expressed genes showed highly significant involvement with the Retinoblastoma (RB) (24 up-regulated and 1 down-regulated), cell cycle (14 up-regulated and 2 down-regulated), DNA replication (8 up-regulated), DNA IR-damage and cellular response via ATR (9 up-regulated and 1 down-regulated), allograft rejection (10 down-regulated), T cell antigen receptor (TCR) signaling pathway (9 down-regulated), Vitamin D receptor pathway (12 down-regulated), histone modifications (7 up-regulated), gastric cancer networks 1 and 2 (5 and 6 genes up-regulated, respectively), G1 to S cell cycle control (6 up-regulated and 1 down-regulated), mitotic G1-G1/S phases (12 up-regulated), spinal cord injury (2 up-regulated and 6 down-regulated), hair follicle development: cyto-differentiation (1 up-regulated and 6 down-regulated) and TGF-beta signaling pathways (2 up-regulated and 6 down-regulated, Supplementary Table 2a).
With strict criteria (fold-change=2, p=0.001, and FDR p value=0.05) and considering only NM IDs on gene level differential expression between 4 control and 35 CML samples, a highly significant down-regulation of 18 genes was identified upon which the following three clusters were formed: the first cluster included control samples CML-20 and CML-63; the second cluster included CML-4, 7, 91, 93, 1, 11, 19, 6 and 10; and the third cluster included three sub-clusters-I (21, 36, 72, 73, 71, 83, 65, and 70), sub-cluster-II (32, 55, 9, 58, 14, 34, and 69) and sub-cluster-III (56, 59, 86, 62, 57, 2, 13, 68, and 87, Figure 1b).
At a significance level of p=0.001 and an FDR p value=0.05, 18 genes showed significant down-regulation (p=0.05) among 36 pathways in CML, including the highly significant PDGFR-beta pathway (significance of 3.77 at p=0.000171), the TGF-beta receptor signaling pathway (significance of 3.21 at p=0.000618), the spinal cord injury pathway (significance of 2.56 at p=0.002758), the TGF-beta signaling pathway (significance of 2.44 at p=0.003649), and the MAPK signaling pathway (significance of 1.94 at p=0.011546, Supplementary Table 2b).
Exon-specific expression among control and 35-CML samples
Relative exon-specific expression was measured between two conditions (control and all 35-CML samples) after excluding gene level data and passing through default filtering criteria (Splicing Index (linear) < -2 or Splicing Index (linear) > 2, ANOVA p value < 0.05, a gene must be expressed in both conditions, a PSR/Junction must be expressed in at least one condition, and a gene must contain at least one PSR) using the following algorithms: 1.) Splicing Index; 2.) one-way between-subjects ANOVA (unpaired); 3.) false discovery rate < 0.05; 4.) use an eligible PSR to determine gene expression if it presents in >=50% of all transcript isoforms; 5.) a gene is expressed in a sample if >=50% of its eligible PSRs have DABG p value < 0.05; 6.) a condition has this gene expressed if >=50% of its samples express this gene; and 7.) a PSR/Junction is expressed in a condition if >=50% of samples have DABG p value < 0.05 among the samples analyzed.
However, on applying strict criteria (Exon-Splicing Index (linear) < -10 or Splicing Index (linear) > 10, exon ANOVA p value < 0.001, exon FDR p value < 0.05, fold-change < -10 or > 10 for genes expressed in both conditions), we observed 7.59-, 15.22- and 5.09-fold down-regulation of IL-2-inducible T cell kinase (ITK-exon SI -10.28, exon p value=0.0000123, exon FDR p value=0.0201), FBJ murine osteosarcoma viral oncogene homolog (FOS-exon SI -12.57, exon p value=0.000000587, exon FDR p value=0.006), and src kinase associated phosphoprotein 1 (SKAP1-exon SI -10.37, exon p value= 0.0000354, exon FDR p value=0.031), respectively, among CML samples. However, Myeloperoxidase (MPO-exon SI -30.08, exon p value=0.0001, exon FDR p value=0.044), Thymidylate synthetase (TYMS-exon SI= -15.08, exon p value=0.0000896, exon FDR p value=0.044) and TPX2, microtubule-associated (TPX2-exon SI=13.79, exon p value= 0.0001, exon FDR p value=0.046) showed up-regulation of 121.81-, 10.12- and 7.56-fold, respectively, among CML cases. After submitting these genes to the Reactome Pathway database, we identified ITK, FOS and SKAP1 mediated down-regulation of the immune system (Supplementary Table 3). MPO, TPX2, TYMS specifically up-regulated cell cycle pathways and individually, TPX2 mediated the up-regulation of phosphorylation altering the transcriptional regulation of TP53 activity and TYMS-related G1/S-Specific transcription through interconversion of nucleotide di- and triphosphates. Further, MPO enhanced neutrophil degranulation, thereby affecting the innate immune system (Supplementary Table 3).
Copy number variation profiling of 34 CML-samples
CNV profiling was completed for 39 CML-samples (34 CML and five control samples), and the results were analyzed using Nexus version 7.5 (Biodiscovery, Inc. CA USA). Samples were further categorized on the basis of CNVs, percent loss of heterozygosity (LOH) and percent genome change (Table 2a). In group I, CP-new and B-New cases (CML9, 10, 14) and CP-UT cases with un-detected BCR-ABL levels (CML56, 57, 58, CML55, 59) showed low copy number variation, i.e., there were no significant gains, but there were losses of HOXA9, HOXA11, HOXA13 (7p15.2) and CDK4 (12q14.1, Table 2b and 2c). In group II, high CNVs were observed in both samples with undetectable and <20% BCR-ABL copies, including both sensitive and non-sensitive cases and >20% BCR-ABL copies (AP-UT-22, 37, 38 and B-New-34, B-UT-47, 48)] (Table 2b). On aggregate analysis, the high CNVs-TKIs non-sensitive group showed significant gains of SDHB (1p36.13), FGFR3, WHSC1 (4p16.3), FNBP1, ABL1, NUP214, TSC1, RALGDS (9q34.11 - q34.2), YWHAE (17p13.3), CDK12 (17q12) and U2AF1 (21q22.3), with some important losses as listed in Table 2c.
Table 2a: Percent genome change identified in chronic myeloid leukemia samples of different phases undergoing treatment (Chronic Phase under treatment; CP-UT, accelerated phase under treatment; AP-UT and Blast Phase under treatment; B-UT ) and new cases (Chronic Phase-new; CP-new and Blast new; B-new) cases through copy number and somatic mutation related molecular inversion probe based array
Sample |
Quality |
Total CN aberrations |
% LOH |
% Genome Changed |
OS-MAPD |
OS-ndSNPQC |
OS-CelPair Check Status |
OS-nd WavinessSd |
OS-% Aberr. Cells |
OS-Ploidy |
OS-Low Diploid Flag |
|
|---|---|---|---|---|---|---|---|---|---|---|---|---|
1 |
CML-09 |
1.57E-01 |
62 |
7.55E-01 |
4.23E-01 |
2.69E-01 |
3.30E+01 |
Pass |
1.90E-01 |
homogeneous |
2.00E+00 |
No |
2 |
CML-10 |
4.92E-01 |
60 |
3.42E+01 |
3.53E+00 |
4.68E-01 |
1.01E+01 |
Pass |
2.16E-01 |
NA |
NaN |
Yes |
3 |
CML-14 |
1.60E-01 |
34 |
2.61E+00 |
2.88E-01 |
2.69E-01 |
3.17E+01 |
Pass |
1.38E-01 |
homogeneous |
2.00E+00 |
No |
4 |
CML-55 |
3.64E-01 |
79 |
8.32E+00 |
1.20E+01 |
3.91E-01 |
1.31E+01 |
Pass |
8.74E-02 |
NA |
NaN |
No |
5 |
CML-56 |
1.97E-01 |
91 |
3.30E+00 |
2.66E+00 |
3.03E-01 |
1.23E+01 |
Pass |
1.59E-01 |
NA |
NaN |
No |
6 |
CML-57 |
1.51E-01 |
80 |
2.73E+00 |
1.41E+00 |
2.68E-01 |
1.12E+01 |
Pass |
1.36E-01 |
NA |
NaN |
No |
7 |
CML-58 |
1.53E-01 |
118 |
5.50E+00 |
4.89E+00 |
2.69E-01 |
1.03E+01 |
Pass |
1.37E-01 |
NA |
NaN |
No |
8 |
CML-59 |
4.12E-01 |
97 |
1.13E+01 |
1.01E+01 |
4.35E-01 |
9.17E+00 |
Pass |
1.87E-01 |
NA |
NaN |
No |
9 |
CML-13 |
1.77E-01 |
99 |
2.01E+00 |
7.69E-01 |
2.84E-01 |
3.00E+01 |
Pass |
2.34E-01 |
homogeneous |
2.00E+00 |
No |
10 |
CML-21 |
1.29E-01 |
81 |
7.30E-01 |
4.99E-01 |
2.42E-01 |
4.16E+01 |
Pass |
1.53E-01 |
homogeneous |
2.00E+00 |
No |
11 |
CML-23 |
1.60E-01 |
191 |
3.56E+00 |
3.07E+00 |
2.58E-01 |
3.37E+01 |
Pass |
2.47E-01 |
70 |
2.00E+00 |
No |
12 |
CML-26 |
1.35E-01 |
52 |
1.34E+00 |
4.32E-01 |
2.50E-01 |
4.11E+01 |
Pass |
1.40E-01 |
homogeneous |
2.00E+00 |
No |
13 |
CML-29 |
4.25E-01 |
63 |
1.29E+01 |
1.45E+01 |
4.44E-01 |
1.05E+01 |
Pass |
1.09E-01 |
NA |
NaN |
No |
14 |
CML-30 |
1.85E-01 |
226 |
2.77E+00 |
4.18E+00 |
2.78E-01 |
3.27E+01 |
Pass |
2.68E-01 |
NA |
NaN |
No |
15 |
CML-33 |
1.86E-01 |
172 |
5.18E+00 |
3.03E+00 |
2.83E-01 |
2.72E+01 |
Pass |
2.18E-01 |
35 |
2.00E+00 |
No |
16 |
CML-35 |
1.84E-01 |
106 |
4.45E+00 |
9.00E-01 |
2.80E-01 |
3.03E+01 |
Pass |
2.54E-01 |
homogeneous |
2.00E+00 |
No |
17 |
CML-36 |
2.03E-01 |
255 |
7.45E+00 |
2.51E+00 |
2.93E-01 |
3.14E+01 |
Pass |
3.14E-01 |
95 |
2.00E+00 |
No |
18 |
CML-43 |
1.53E-01 |
106 |
1.56E+00 |
8.02E-01 |
2.61E-01 |
3.88E+01 |
Pass |
1.83E-01 |
homogeneous |
2.00E+00 |
No |
19 |
CML-02 |
1.54E-01 |
84 |
1.86E+00 |
5.93E-01 |
2.61E-01 |
3.47E+01 |
Pass |
2.23E-01 |
homogeneous |
2.00E+00 |
No |
20 |
CML-04 |
1.72E-01 |
183 |
3.43E+00 |
4.52E+00 |
2.74E-01 |
3.35E+01 |
Pass |
2.47E-01 |
NA |
NaN |
No |
21 |
CML-07 |
1.64E-01 |
82 |
1.98E+00 |
6.86E-01 |
2.77E-01 |
3.48E+01 |
Pass |
2.06E-01 |
homogeneous |
2.00E+00 |
No |
22 |
CML-11 |
1.85E-01 |
158 |
5.40E+00 |
1.38E+00 |
2.83E-01 |
3.14E+01 |
Pass |
2.92E-01 |
homogeneous |
2.00E+00 |
No |
23 |
CML-48 |
1.70E-01 |
186 |
3.22E+00 |
1.98E+00 |
2.71E-01 |
3.26E+01 |
Pass |
2.36E-01 |
50 |
2.00E+00 |
No |
24 |
CML-49 |
2.17E-01 |
205 |
6.64E+00 |
4.14E+00 |
3.12E-01 |
2.99E+01 |
Pass |
2.89E-01 |
85 |
2.00E+00 |
No |
25 |
CML-51 |
2.39E-01 |
166 |
4.62E+00 |
1.44E+00 |
3.29E-01 |
3.23E+01 |
Pass |
2.80E-01 |
homogeneous |
2.00E+00 |
No |
26 |
CML-24 |
1.75E-01 |
295 |
4.62E+00 |
3.65E+00 |
2.69E-01 |
3.41E+01 |
Pass |
2.84E-01 |
40 |
2.00E+00 |
No |
27 |
CML-01 |
2.44E-01 |
197 |
9.40E+00 |
5.90E+00 |
3.18E-01 |
1.67E+01 |
Pass |
2.74E-01 |
NA |
NaN |
No |
28 |
CML-22 |
2.40E-01 |
86 |
3.80E+00 |
1.00E+01 |
3.31E-01 |
1.82E+01 |
Pass |
1.49E-01 |
NA |
NaN |
No |
29 |
CML-32 |
2.06E-01 |
241 |
7.83E+00 |
3.12E+00 |
2.89E-01 |
2.92E+01 |
Pass |
2.98E-01 |
65 |
2.00E+00 |
No |
30 |
CML-34 |
4.45E-01 |
231 |
1.09E+01 |
1.26E+01 |
4.60E-01 |
2.06E+01 |
Pass |
2.83E-01 |
NA |
NaN |
No |
31 |
CML-37 |
1.95E-01 |
135 |
6.61E+00 |
1.20E+00 |
2.83E-01 |
2.51E+01 |
Pass |
2.73E-01 |
homogeneous |
2.00E+00 |
No |
32 |
CML-38 |
2.08E-01 |
353 |
5.44E+00 |
8.73E+00 |
3.01E-01 |
3.20E+01 |
Pass |
3.11E-01 |
NA |
NaN |
No |
33 |
CML-47 |
2.82E-01 |
153 |
3.53E+00 |
1.72E+00 |
3.56E-01 |
3.07E+01 |
Pass |
2.86E-01 |
homogeneous |
2.00E+00 |
No |
34 |
CML- 8 |
1.94E-01 |
187 |
1.04E+01 |
5.75E+00 |
2.81E-01 |
3.04E+01 |
Pass |
3.46E-01 |
85 |
2.00E+00 |
No |
Table 2b: Nexus 7.5 analysed chronic myeloid leukemia samples of different undergoing treatment (Chronic Phase under treatment; CP-UT, accelerated phase under treatment; AP-UT and Blast Phase under treatment; B-UT ) and new cases (Chronic Phase-new; CP-new and Blast new; B-new) cases: clustered on the basis of copy number variations in relation to BCR-ABL transcript levels
Sample-ID |
CML-Phases and treatment status |
Age/Sex |
Sample collection date |
Time of Assessment |
Treatment |
Date |
BCR-ABL% |
Comments based on BCR-ABL |
|---|---|---|---|---|---|---|---|---|
Low CNVs group with undetectable BCR-ABL transcript levels, new cases or <10% |
||||||||
CML-09 |
CP-New-9 |
46/M |
28-05-2014 |
New |
Imatinib |
28-05-2014 |
100 |
- |
CML-14 |
B-New-14 |
35/F |
29-05-2014 |
New |
Hydroxyurea, Zyloric and Imatinib |
09-06-2014 |
85.56 |
- |
CML-10 |
CP-New-10 |
20/M |
28-05-2014 |
New |
Imatinib |
28-05-2014 |
120 |
- |
0.95 |
||||||||
CML-55 |
CP-UT-55 |
60/M |
06-02-2015 |
3 months |
Hydroxyurea, Zyloric and Imatinib |
02-12-2014 |
98.47 |
Hydroxyurea, Zyloric and Imatinib non-sensitive |
01-05-2015 |
9.75 |
|||||||
CML-56 |
CP-UT-56 |
43/F |
09-02-2015 |
1.0 yr |
Hydroxyurea, Zyloric and Imatinib |
29-02-2014 |
89.5 |
Hydroxyurea, Zyloric and Imatinib non sensitive |
24-03-2015 |
1.2 |
|||||||
CML-57 |
CP-UT-57 |
42/F |
09-02-2015 |
7 months |
Hydroxyurea, Zyloric and Imatinib |
22-07-2014 |
67.45 |
Hydroxyurea, Zyloric and Imatinib non sensitive |
22-04-2015 |
8 |
|||||||
CML-58 |
CP-UT-58 |
32/F |
09-02-2015 |
9 months |
Hydroxyurea, Zyloric and Imatinib |
12-06-2014 |
58.75 |
Hydroxyurea, Zyloric and Imatinib sensitive |
12-04-2015 |
9.8 |
|||||||
CML-59 |
CP-UT-59 |
15/M |
01-04-2015 |
3 months |
Hydroxyurea, Zyloric and Imatinib |
11-12-2014 |
15.75 |
Hydroxyurea, Zyloric and Imatinib sensitive |
29-04-2015 |
9.75 |
|||||||
High CNVs in undetectable/<20% BCR-ABL transcript |
||||||||
CML-13 |
CP-UT-13 |
50/M |
29-05-2014 |
7.1 yrs |
Droxygel (Antacid), Unidrea and Imatinib |
20-02-2014 |
30 |
Droxygel (Antacid), Unidrea and Imatinib sensitive |
12-03-2015 |
0.1 |
|||||||
CML-21 |
CP-UT-21 |
60/M |
05-06-2014 |
3.8 yrs |
Droxygel (Antacid), Unidrea and Imatinib |
14-11-2013 |
75 |
Droxygel (Antacid), Unidrea and Imatinib sensitive |
31-07-2014 |
0.11 |
|||||||
CML-23 |
CP-UT-23 |
40/M |
05-06-2014 |
2.4 yrs |
Unidrea and Imatinib, Nilotinib |
31-07-2013 |
28.35 |
Unidrea Imatinib and Nilotinib-non-sensitive |
13-05-2014 |
11.9 |
|||||||
CML-26 |
CP-UT-26 |
32/M |
05-06-2014 |
2.1 yrs |
Imatinib |
26-03-2012 |
150 |
Imatinib non-sensitive |
10-05-2014 |
13.6 |
|||||||
CML-29 |
B-UT-29 |
35F |
05-06-2014 |
1 month |
Imatinib |
04-05-2014 |
89.12 |
Imatinib non-sensitive |
01-08-2014 |
15.89 |
|||||||
CML-30 |
CP-New-30 |
22/M |
12-06-2014 |
- |
Imatinib |
24-06-2014 |
11 |
Not known |
30-09-2014 |
12.65 |
|||||||
CML-33 |
AP-UT-33 |
20/M |
28-06-2014 |
2 yrs |
Imatinib |
24-07-2012 |
100 |
Imatinib non-sensitive |
27-06-2014 |
12.18 |
|||||||
CML-35 |
AP-UT-35 |
28/F |
03-07-2014 |
6.3 yrs |
Imatinib |
24-07-2010 |
100 |
Imatinib non-sensitive |
13-04-2013 |
0.02 |
|||||||
03-07-2014 |
8.56 |
|||||||
CML-36 |
CP-UT-36 |
23/M |
03-07-2014 |
6.10 yrs |
Hydab and Imatinib |
20-02-2010 |
30 |
Hydab and Imatinib sensitive |
30-10-2014 |
0.16 |
|||||||
CML-43 |
CP-UT-43 |
27/M |
10-07-2014 |
7 yrs |
Initially Hydroxyurea and Imatinib |
23-02-2012 |
55.89 |
Hydroxyurea and Imatinib-sensitive |
17-06-2014 |
11.18 |
|||||||
14-03-2015 |
0 |
|||||||
CML-24 |
CP-UT-24 |
26/F |
05-06-2014 |
8.5 yrs |
Initially treated with Myeleron, Hydab irocos, Zyloric since may 2005 on Imatinib |
24-04-2014 |
30 |
Initially treated with Myeleron, Hydab irocos, Zyloric since may 2005 on Imatinib-non-sensitive |
21-05-2015 |
15.85 |
|||||||
CML-02 |
CP-UT-2 |
50/M |
22-05-2014 |
4 yrs |
Droxygel (Antacid), Unidrea and Imatinib |
14-02-2013 |
100% |
Droxygel (Antacid), Unidrea and Imatinib-sensitive |
20-03-2014 |
not detected |
|||||||
CML-04 |
CP-UT-4 |
14/M |
22-05-2014 |
1.2 yrs |
Imatinib |
15-07-2013 |
100 |
Imatinib sensitive |
06-09-2014 |
not detected |
|||||||
CML-07 |
CP-UT-7 |
41/M |
22-05-2014 |
7.2 yrs |
Imatinib |
28-02-2007 |
100% |
Imatinib-sensitive |
22-07-2014 |
not detected |
|||||||
CML-11 |
CP-UT-11 |
33/F |
28-05-2014 |
4.2 yrs |
Hydab and Imatinib |
21-04-2010 |
97.54 |
Hydab and Imatinib sensitive |
21-05-2014 |
Not detectable |
|||||||
CML-48 |
CP-UT48 |
33/M |
31-07-2014 |
10.4 yrs |
Initially Hydroxyurea and since December 2004 Imatinib |
01-10-2004 |
100 |
Initially Hydroxyurea and since December 2004 Imatinib non-sensitive |
29-05-2014 |
9.94 |
|||||||
CML-49 |
Blast-UT-49 |
15/M |
31-07-2014 |
1.4 yrs |
Imatinib |
06-03-2013 |
100 |
Imatinib non-sensitive |
30-06-2014 |
not detected |
|||||||
CML-51 |
CP-UT-51 |
60/M |
31-07-2014 |
25 yrs |
Initially treated with Myeleron, Hydab irocos, Zyloric since may 2005 on Imatinib |
12-05-2013 |
30 |
Initially treated with Myeleron, Hydab irocos, Zyloric since may 2005 on Imatinib non-sensitive |
11-06-2014 |
8.98 |
|||||||
CML-01 |
AP-UT-1 |
35/M |
22-05-2014 |
1.8 yrs |
Imatinib |
30-08-2012 |
26 |
Imatinib sensitive |
High CNVs with BCR-ABL transcript levels >20% |
||||||||
CML-22 |
AP-UT-22 |
40/M |
05-06-2014 |
5.2 yrs |
Hydab and Imatinib |
17-11-2013 |
39.07 |
Hydab and Imatinib non-sensitive |
05-08-2014 |
20.11 |
|||||||
CML-32 |
AP-UT-32 |
27/F |
12-06-2014 |
15 yrs |
Initially treated with Myeleron, Hydab irocos, Zyloric since may 2005 on Imatinib |
13-07-2014 |
55.63 |
Initially treated with Myeleron, Hydab irocos, Zyloric since may 2005 on Imatinib-non-sensitive |
17-11-2014 |
35.37 |
|||||||
CML-34 |
B-New-34 |
24/M |
12-06-2014 |
New |
Imatinib and since February 2015 Nilotinib |
20-06-2014 |
35.63 |
Imatinib and Nilotinib non-sensitive |
27-11-2014 |
95.37 |
|||||||
CML-37 |
AP-UT-37 |
27/F |
03-07-2014 |
8 months |
Imatinib |
01-04-2013 |
100 |
Imatinib non-sensitive |
03-07-2014 |
50 |
|||||||
CML-38 |
AP-UT-38 |
60/M |
03-07-2014 |
1.5 yrs |
Imatinib |
29-03-2013 |
79.01 |
Imatinib non-sensitive |
24-06-2014 |
35.12 |
|||||||
CML-47 |
B-UT-47 |
48/M |
17-07-2014 |
3 months |
Imatinib and 29-05-2014 Uridrea |
27-07-2014 |
40.12 |
Unidrea and Imatinib non-sensitive |
29-10-2014 |
32.45 |
|||||||
CML-08 |
B-UT-8 |
24/M |
22-05-2014 |
8 months |
Imatinib |
26-09-2013 |
100 |
Imatinib non-sensitive |
20-06-2014 |
26.89 |
|||||||
Table 2c: Aggregate analysis through Nexus 7.5 of low and high copy number variation group in relation to BCR-ABL levels
Low CNVs with undetectable BCR-ABL (TKIs-sensitive) group |
|||
Cytoband Location |
Event |
P-Value |
CancerGeneCensus-Sanger.txt |
7p15.2 |
CN Loss |
0.001 |
HOXA9, HOXA11, HOXA13 |
12q14.1 |
CN Loss |
0.002 |
CDK4 |
High CNVs (CN loss)-BCR-ABL dependent and independent (TKIs-non-sensitive) group |
|||
Cytoband Location |
Event |
P-Value |
CancerGeneCensus-Sanger.txt |
1p36.33 - p36.32 |
CN Loss |
0.007 |
TNFRSF14 |
1p36.32 |
CN Loss |
0.007 |
PRDM16 |
1p32.1 |
CN Loss |
0.007 |
JUN |
2p24.3 |
CN Loss |
0.002 |
MYCN |
2p23.1 |
CN Loss |
0.002 |
ALK |
2p16.1 |
CN Loss |
0.002 |
REL |
2q13 |
CN Loss |
0.001 |
PAX8 |
2q31.1 |
CN Loss |
0.001 |
HOXD13, HOXD11 |
5q13.1 |
CN Loss |
0.002 |
PIK3R1 |
5q32 |
CN Loss |
0.002 |
PDGFRB |
5q35.1 |
CN Loss |
0.002 |
NPM1 |
5q35.2 |
CN Loss |
0.002 |
NSD1 |
6p21.33 |
CN Loss |
0.006 |
POU5F1 |
7q31.2 |
CN Loss |
0.002 |
MET |
10q11.21 |
CN Loss |
0.001 |
RET |
10q23.31 |
CN Loss |
0.001 |
PTEN |
11p15.5 |
CN Loss |
0.01 |
HRAS |
11q13.3 |
CN Loss |
0.004 |
CCND1 |
13q12.2 |
CN Loss |
0.019 |
CDX2 |
13q14.2 |
CN Loss |
0.019 |
RB1 |
15q24.1 |
CN Loss |
0.001 |
PML |
15q26.1 |
CN Loss |
0.012 |
IDH2 |
16p13.3 |
CN Loss |
0.002 |
TSC2 |
19p13.3 |
CN Loss |
0.017 |
STK11 |
19p13.3 |
CN Loss |
0.017 |
STK11, TCF3 |
19q13.2 |
CN Loss |
0.012 |
AKT2 |
19q13.2 |
CN Loss |
0.012 |
CD79A |
20q13.32 |
CN Loss |
0.019 |
GNAS |
21q22.11 |
CN Loss |
0.001 |
OLIG2 |
High CNVs (CN gain)-BCR-ABL dependent and independent (TKIs-non-sensitive) group |
|||
Cytoband Location |
Event |
P-Value |
CancerGeneCensus-Sanger.txt |
1p36.13 |
CN Gain |
0.002 |
SDHB |
Cytoband Location |
Event |
P-Value |
CancerGeneCensus-Sanger.txt |
4p16.3 |
CN Gain |
0.008 |
FGFR3, WHSC1 |
9q34.11 - q34.2 |
CN Gain |
0.004 |
FNBP1, ABL1, NUP214, TSC1, RALGDS |
17p13.3 |
CN Gain |
0.001 |
YWHAE |
17q12 |
CN Gain |
0.004 |
CDK12 |
21q22.3 |
CN Gain |
0.022 |
U2AF1 |
Analysis of 13 CML samples with common transcriptomics and CNV
The 13 CML samples with common transcriptomics and CNV profiles were separately compared to control through TAC using the same filter criteria (p value = 0.001 and FDR value p value = 0.001). CNV-based clustering was similar to transcript-based clustering, except for samples CML 2, 4 and 10. These samples were in the same transcript cluster as undetectable-BCR-ABL transcript (Cluster-II-sub-cluster-II); in the CNV-based cluster, samples 2 and 4 were grouped in the higher CNV group (undetectable/<20% BCR-ABL transcript), and CML-10 was grouped in the CNV group with undetectable BCR-ABL transcript levels, new cases or un-detected BCR-ABL (Table 3).
Table 3: Transcriptionally clustered (at the significance level p=0.001 and FDR p=0.0001 and Fold Change<-4 or >4) 13-CML samples (Chronic Phase-new; CP-new and Blast new; B-new and Chronic Phase under treatment; CP-UT) which were also processed for CNVs-profiling
Cluster-I |
||||||||
|---|---|---|---|---|---|---|---|---|
Sample-ID |
CML-Phases and treatment status |
Age/gender |
Sample collection date |
Time of Assessment |
Treatment |
Date of BCR-ABL assessment |
BCR-ABL percentage |
Comments based on BCR-ABL |
CML-10 |
CP-New-10 |
20/M |
28-05-2014 |
New |
Imatinib |
28-05-2014 |
120 |
Not known |
06-02-2015 |
0.95 |
|||||||
CML-02 |
CP-UT-2 |
50/M |
22-05-2014 |
4 yrs |
Initially with Droxygel (Antacid), Unidrea and later with Imatinib |
14-02-2013 |
100% |
Initially with Droxygel (Antacid), Unidrea and later with Imatinib-sensitive (TKI- sensitive) |
20-03-2014 |
0.12 |
|||||||
CML-04 |
CP-UT-4 |
14/M |
22-05-2014 |
1.2 year |
Imatinib |
15-03-2013 |
100 |
Imatinib sensitive (TKI- sensitive) |
06-09-2014 |
0.95 |
|||||||
Cluster-II |
||||||||
CML-13 |
CP-UT-13 |
50/M |
29-05-2014 |
7.1 yrs |
Droxygel (Antacid), Unidrea and Imatinib |
20-02-2014 |
30 |
Droxygel (Antacid), Unidrea and Imatinib sensitive (TKI- sensitive) |
12-03-2015 |
0.1 |
|||||||
CML-21 |
CP-UT-21 |
60/M |
05-06-2014 |
3.8 yrs |
Droxygel (Antacid), Unidrea and Imatinib |
14-11-2013 |
75 |
Droxygel (Antacid), Unidrea and Imatinib sensitive (TKI-sensitive) |
31-07-2014 |
0.11 |
|||||||
CML-36 |
CP-UT-36 |
23/M |
03-07-2014 |
6.10 yrs |
Initially Hydab and presently on Imatinib |
20-02-2010 |
30 |
Initially Hydab and Imatinib sensitive (TKI- sensitive) |
30-10-2014 |
0.11 |
|||||||
CML-11 |
CP-UT-11 |
33/F |
28-05-2014 |
4.2 yrs |
Hydab and Imatinib |
21-04-2010 |
97.54 |
Hydab and Imatinib (TKI-sensitive) |
21-05-2014 |
Not detectable |
|||||||
Cluster-III |
||||||||
CML-55 |
CP-UT-55 |
60/M |
06-02-2015 |
3 months |
Hydroxyurea, Zyloric and Imatinib |
02-12-2014 |
98.47 |
Hydroxyurea, Zyloric and Imatinib non- sensitive |
01-05-2015 |
9.75 |
|||||||
CML-56 |
CP-UT-56 |
43/F |
09-02-2015 |
1.0 yr |
Hydroxyurea, Zyloric and Imatinib |
29-02-2014 |
89.5 |
Hydroxyurea, Zyloric and Imatinib sensitive |
24-03-2015 |
1.2 |
|||||||
CML-58 |
CP-UT-58 |
32/F |
09-02-2015 |
9 months |
Hydroxyurea, Zyloric and Imatinib |
12-04-2015 |
58.75 |
Hydroxyurea, Zyloric and Imatinib sensitive |
12-04-2015 |
9.8 |
|||||||
CML-57 |
CP-UT-57 |
42/F |
09-02-2015 |
7 months |
Hydroxyurea, Zyloric and Imatinib |
22-07-2014 |
67.45 |
Hydroxyurea, Zyloric and Imatinib non-sensitive |
22-04-2015 |
8 |
|||||||
CML-59 |
CP-UT-59 |
15/M |
01-04-2015 |
3 months |
Hydroxyurea, Zyloric and Imatinib |
11-12-2014 |
15.75 |
Hydroxyurea, Zyloric and Imatinib non-sensitive |
29-04-2015 |
9.75 |
|||||||
CML-14 |
B-New-14 |
35/F |
29-05-2014 |
New |
Hydroxyurea, Zyloric and Imatinib |
09-06-2014 |
85.56 |
Not known |
We identified up-regulation of 2,230 genes and down-regulation of 2,683 genes among Imatinib-resistant versus Imatinib-sensitive samples at the gene expression level after applying strict criteria [ANOVA p value < 0.001, FDR p value <0.0001, and gene fold-change < -4 or gene fold-change (linear) > 4, Figure 2, Table 3]. We identified highly significant up-regulation of helicase-like transcription factor (HLTF, p= 0.00000000589, FDR p= 0.0000492), small nuclear ribonucleoprotein D1 polypeptide (SNRPD1, p= 0.000000012, FDR p= 0.0000492), 1-acylglycerol-3-phosphate O-acyltransferase 5 (AGPAT5, p= 0.0000000191, FDR p= 0.0000633), NOP58 ribonucleoprotein (NOP58, p= 0.0000000347, FDR p= 0.0000711), ribosome production factor 2 homolog (RPF2, p= 0.0000000502, FDR p= 0.0000865) and zinc finger protein 711 (ZNF711, p= 0.000000058, FDR p= 0.0000933). The genes were up-regulated in the AGPAT5-mediated triacylglyceride (significance=2.27, p=0.005357), glycerophospholipid synthesis (significance=1.51, p=0.0031133), NOP58-mediated SUMOylation of RNA binding proteins (significance=1.89, p=0.012906), SNRPD1-mediated metabolism of non-coding RNA (significance=1.84, p=0.014454), mRNA processing (significance=1.55, p=0.028078), HLTF-mediated Retinoblastoma (RB) in cancer (significance=1.7, p= 0.019966), and E3 ubiquitin ligases ubiquitinate target proteins pathways (significance=1.63, p=0.023481).
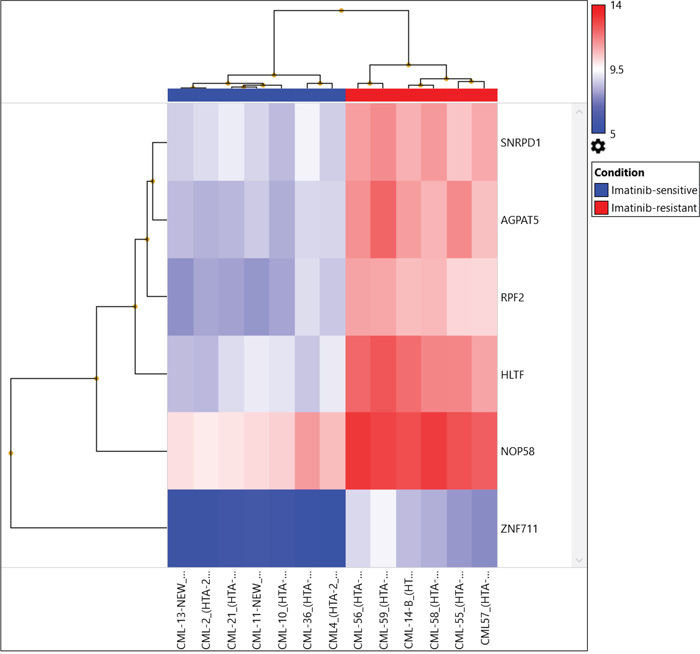
Figure 2: Hierarchical clustering of 13 CML samples (TKI-sensitive cases and TKI resistant cases) common between transcriptomics and CNV analysis were compared to control using the same filter criteria as for all CML cases and control at p=0.01.
Further, when comparing Cluster III (TKI-resistant cases: CML-CP (CML-CP-UT 55-59, CML-B-14)) and Cluster I+Cluster-II (TKI sensitive cases: CML-CP-UT-2, 4, 10, 13, 21 and 36 and CML-CP-UT-11 as Imatinib/Imatinib plus other drugs-sensitive){ at the exon level using specific splicing index filter criteria [(1.) Exon Splicing Index (linear) < -4 or Exon Splicing Index (linear and exon expressed in at least one condition) >4; 2.) ANOVA exon p value < 0.001, exon FDR p value <0.001; 3.) gene fold-change (linear and expressed in both conditions) <-5 or Gene fold-change (linear) > 5], approximately 0.01% coding-genes passed filter criteria (Figures 2 and 3). Considering SI at the exon level, lysosomal protein transmembrane 4 beta (LAPTM4B, FC17.99), piezo-type mechanosensitive ion channel component 2 (PIEZO2, FC-8.36), angiopoietin 1 (ANGPT1, FC-6.04), complement factor H (CFH, FC-6.39), helicase-like transcription factor (HLTF, FC-8.44), serine palmitoyltransferase, long-chain base subunit 3 (SPTLC3, FC-5.23), 1-acylglycerol-3-phosphate O-acyltransferase 5 (AGPAT5, FC-7.30), CD109 molecule (CD109 FC-6.07), and zinc finger protein 711 (ZNF711, FC-6.91) were up-regulated in TKI-resistant cases. The up-regulation resulted from the following: a cassette exon splicing event in LAPTM4B (0.46), PIEZO2 (0.32), ANGPT1 (0.29), CFH (0.28), HLTF (0.28), and SPTLC3 (0.26); splicing of an alternative 3' acceptor site in AGPAT5 (0.22); and junctional splicing in CD109 and ZNF711. These genes were further processed using Reactome Pathway analysis software (https://reactome.org/), and hemostasis (Supplementary Figure 1) with specific involvement of Tie2 [11], Basigin-transmembrane glycoprotein signaling [12] (Supplementary Figures 2 and 3), CFH-mediated complement cascade, HTLF-mediated protein-ubiquitination, SPTLC3 mediated sphingolipid metabolism, and ZNF711-mediated RNA polymerase II transcription pathways were overexpressed in TKI-resistant cases.
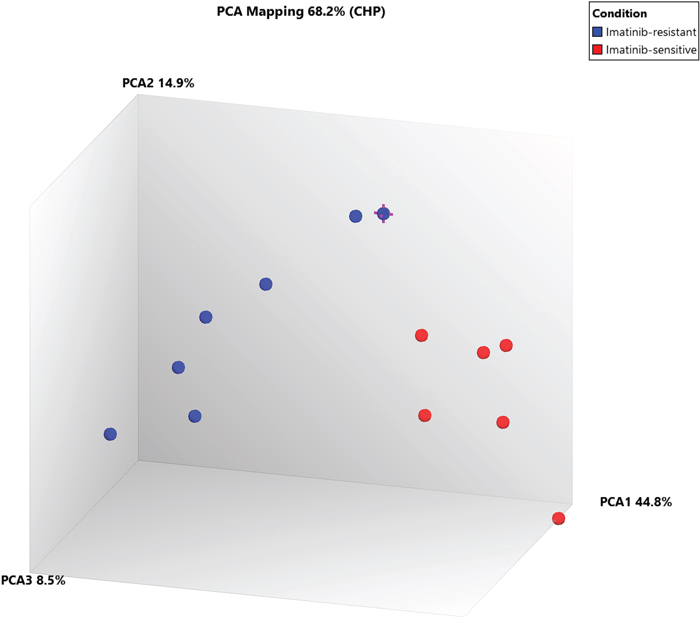
Figure 3: PCA plot between Cluster III (TKI-sensitive cases) and Cluster I+II (TKI resistant cases) at exonic-level using specific splicing index filter criteria [(1.) Exon Splicing Index (linear) < -4 or Exon Splicing Index (linear and exon expressed in atleast one condition) >4; 2.) ANOVA Exon p value < 0.001; Exon FDR p value <0.001. 3.) Gene fold change (linear and expressed in both conditions) < -5 or Gene fold change (linear) > 5], 0.01% coding-genes passed filter criteria.
Validation of array-based transcripts by differential expression analysis
Down-regulated FOS, TGFβR2 and up-regulated TPX2 among all drug-treated CML cases as well as significantly up-regulated LAPTM4B, PIEZO2, ANGPT1, CFH, CD109 and HLTF molecule in TKI-resistant cases were validated in 23 Imatinib-treated CML cases. The samples were categorized on the basis of major molecular response (>1% and not-detected BCR-ABL copies). FOS and TGFβR2 down-regulated in ~48% of all Imatinib-treated CML cases (Table 4a and 4b). While TPX2 was up-regulated in 21.73% Imatinib-treated cases with >1% BCR-ABL copies and down-regulated or non-significant in most of the Imatinib-treated cases.
Table 4: Validation of (array-based) FOS, TGFβR2, TPX2, LAPTM4B, PIEZO2, ANGPT1, CFH, CD109 and HLTF transcripts by differential expression analysis in >1% and not detected %BCR-ABL 23 Imatinib-treated CML cases using beta actin and 18s ribosomal house-keeping gene as reference
Duration |
%BCR-ABL |
Treatment |
FOS |
TGFBR2 |
TPX2 |
CFH |
PIEZO2 |
CD109 |
ANGPTI |
LAPTM4B |
HLTF |
|
|---|---|---|---|---|---|---|---|---|---|---|---|---|
CML-1 (CP-UT) |
6 mths |
5.56 |
Imatinib |
NS |
UP (≥0.020) |
NS |
UP (≥0.012) |
NS |
NS |
UP (≥0.000) |
UP (≥0.020) |
|
CML2 (CP-UT) |
4 yrs |
38.78 |
Imatinib |
Down (≥0.020) |
UP (≥0.041) |
Down (≥0.020) |
Down (≥0.020) |
Down (≥0.020) |
Down (≥0.020) |
Down (≥0.020) |
NS |
Down (≥0.020) |
CML-3 (CP-UT) |
6 mths |
20.01 |
Imatinib |
NS |
NS |
Down (≥0.040) |
NS |
UP (≥0.000) |
NS |
UP (≥0.030) |
UP (≥0.000) |
NS |
CML6 (CP-UT) |
3 yrs |
4.37 |
Imatinib |
Down (≥0.020) |
NS |
NS |
Down (≥0.033) |
NS |
NS |
Down (≥0.036) |
NS |
NS |
CML-7 (B-UT) |
6 mth |
12.56 |
Imatinib |
Down (≥0.031) |
NS |
NS |
NS |
UP (≥0.048) |
NS |
NS |
UP (≥0.024) |
NS |
CML-9 (CP-UT) |
5 yrs |
4.32 |
Imatinib |
NS |
Down (≥0.000) |
NS |
NS |
UP (≥0.000) |
NS |
UP (≥0.000) |
UP (≥0.000) |
NS |
CML12 (AP-UT) |
2 yrs |
6.17 |
Imatinib |
NS |
NS |
UP (≥0.020) |
NS |
NS |
UP (≥0.020) |
UP (≥0.041) |
UP (≥0.011) |
UP (≥0.000) |
CML13 (AP-UT) |
2 yrs |
3.65 |
Imatinib |
NS |
Down (≥0.029) |
NS |
UP (≥0.000) |
NS |
UP (≥0.023) |
UP (≥0.031) |
UP (≥0.000) |
NS |
CML14 (CP-UT) |
1 yrs |
1.23 |
Imatinib |
NS |
Down (≥0.008) |
NS |
UP (≥0.031) |
NS |
UP (≥0.000) |
UP (≥0.049) |
UP (≥0.000) |
NS |
CML-16 (CP-UT) |
3 mths |
0.03 |
Imatinib |
NS |
Down (≥0.011) |
NS |
NS |
UP (≥0.020) |
NS |
UP (≥0.000) |
UP (≥0.032) |
NS |
CML17 (CP-UT) |
3 mths |
16.13 |
Imatinib |
Down (≥0.036) |
Down (≥0.036) |
UP (≥0.000) |
UP (≥0.000) |
UP (≥0.000) |
UP (≥0.034) |
Down (≥0.036) |
NS |
UP (≥0.000) |
CML29 (B-UT) |
3 yrs |
11.74 |
Imatinib |
NS |
Down (≥0.046) |
NS |
NS |
NS |
NS |
NS |
NS |
NS |
CML31 (AP-UT) |
2 yrs |
15.23 |
Imatinib |
Down (≥0.039) |
NS |
UP (≥0.000) |
UP (≥0.000) |
UP (≥0.000) |
UP (≥0.000) |
UP (≥0.050) |
NS |
UP (≥0.000) |
CML32 (B-UT) |
2 yrs |
6.85 |
Imatinib |
Down (≥0.029) |
NS |
UP (≥0.000) |
UP (≥0.000) |
UP (≥0.000) |
UP (≥0.000) |
UP (≥0.000) |
NS |
UP (≥0.000) |
CML33 (B-UT) |
3 mths |
126 |
Imatinib |
Down (≥0.008) |
Down (≥0.034) |
NS |
UP (≥0.030) |
UP (≥0.028) |
UP (≥0.033) |
NS |
NS |
UP (≥0.008) |
CML37 (CP-UT) |
3 yrs |
3.38 |
Imatinib |
NS |
NS |
Down (≥0.042) |
NS |
NS |
NS |
NS |
NS |
UP (≥0.011) |
Percent -Up |
6.666666 |
6.666667 |
26.66667 |
46.66667 |
60 |
53.33333 |
53.33333 |
53.33333 |
46.66666 |
|||
Percent - Down |
40 |
46.66667 |
20 |
13.33333 |
6.666667 |
6.666667 |
13.33333 |
0 |
6.666666 |
|||
Sensitive Cases- |
Duration |
%BCR-ABL |
Treatment |
FOS |
TGFBR2 |
TPX2 |
CFH |
PIEZO2 |
CD109 |
ANGPTI |
LAPTM4B |
HLTF |
CML8 (CP-UT) |
6 yrs |
Not detected |
Imatinib |
NS |
NS |
NS |
NS |
NS |
NS |
NS |
NS |
UP (≥0.000) |
CML4 (CP-UT) |
5 yrs |
Not detected |
Imatinib |
Down (≥0.038) |
Down (≥0.038) |
NS |
Down (≥0.038) |
NS |
Down (≥0.038) |
Down (≥0.049) |
NS |
Down (≥0.038) |
CML5 (CP-UT) |
2 yrs |
Not detected |
Imatinib |
NS |
NS |
Down (≥0.031) |
Down (≥0.031) |
Down (≥0.020) |
Down (≥0.031) |
Down (≥0.042) |
NS |
Down (≥0.031) |
CML11 (CP-UT) |
3 yrs |
Not detected |
Imatinib |
Down (≥0.047) |
Down (≥0.047) |
Down (≥0.047) |
Down (≥0.047) |
NS |
Down (≥0.047) |
Down (≥0.038) |
NS |
Down (≥0.047) |
CML34 (CP-UT) |
4 yrs |
Not detected |
Imatinib |
Down (≥0.036) |
Down (≥0.036) |
Down (≥0.036) |
NS |
NS |
NS |
NS |
NS |
Down (≥0.036) |
CML10 (CP-UT) |
2 yrs |
Not detected |
Imatinib |
Down (≥0.024) |
Down (≥0.019) |
NS |
NS |
NS |
Down (≥0.021) |
Down (≥0.041) |
NS |
NS |
CML15 (CP-UT) |
3 yrs |
Not detected |
Imatinib |
NS |
NS |
NS |
NS |
Down (≥0.038) |
NS |
NS |
NS |
NS |
Percent -Up |
0 |
0 |
0 |
0 |
0 |
0 |
0 |
0 |
14.28571 |
|||
Percent - Down |
57.14285714 |
57.14286 |
42.85714 |
14.28571 |
6.666667 |
57.14286 |
57.14286 |
0 |
57.14285 |
NS = Non-sensitive.
LAPTM4B (53.33% cases), PIEZO2 (60% cases), ANGPT1 (53.33% cases), CFH (46.66% cases), CD109 (53.33% cases) and HLTF (46.66% cases) molecule were up-regulated in >1% BCR-ABL copies Imatinib-treated CML cases and 57.14%, 14.28%, 57.14%, 6.66%, 0%, 57.14%, HLTF, CFH, CD109, PIEZO2, LAPTM4B and ANGPT1 respectively down-regulated in not detected BCR-ABL copies (Table 4a and 4b).
Biobank genotyping of CML resistant cases
Axiom Biobank genotyping data was analyzed through automated Genotyping Console Software, which includes allele-calling algorithms and user-friendly visualization tools. All analyzed samples passed QC, and 99.571% was the average call rate. An explanation of the SNP metrics summary is provided in Supplementary Table 4. On the basis of gender, 69 samples were from male patients, and 27 samples were from female patients.
pLink software (http://zzz.bwh.harvard.edu/plink/) was used to perform a range of basic, large-scale analyses in a computationally efficient manner. Associations between individual SNPs and CML risk were assessed using p=0.001 and ORs > 4.0 and 95% CIs derived from logistic regression models.
Seventeen SNPs reached genome-wide significance (p=0.001) for TKI-treated CML samples (2 SNPs on chromosome 1, 2 SNPs on chromosome 2, 1 SNP on chromosome 4, 1 SNP on chromosome 5, 4 SNPs on chromosome 6, 1 SNP on chromosome 12, 2 SNPs on chromosome 13, 2 SNPs on chromosome 16, 1 SNP on chromosome 20, and 1 SNP on chromosome 21) (Supplementary Table 5a). Furthermore, regional LD plot was generated for each query SNP (identified through pLink software) through SNAP Proxy search software using r2 threshold=0.8, a distance limit between query and proxy SNP=500, 1000 genomes pilot 1 data-set from the 1000 Genomes Project, which uses phased genotypes for 179 individuals from the HapMap CEU (Utah residents with Northern and Western European ancestry from the CEPH collection), YRI (Yoruba in Ibadan, Nigeria), and JPT+CHB (combined panel of Japanese in Tokyo, Japan and Han Chinese in Beijing, China) panels. From these analyses, rs239798 showed complete correlation with rs9475077, such that r2=1 at a maximum distance of 801 (Supplementary Table 5b). rs12057639 was correlated with rs1327107 (r2=0.934 at a distance of 1, 03, 649) (Supplementary Table 5b). Association plots for rs9475077 and rs12057639 are shown in Supplementary Figure 4a and 4b. Importantly, both rsID239798 (Ch6:54940890) and rsID9475077 (Ch6:54941691) were associated with FAM83B. Hence, we validated rs239798 and rs9475077 with the Taqman genotyping protocol (Figures 4 and 5, Table 5) and identified similar allele frequency as observed through Axiom Biobank Array.
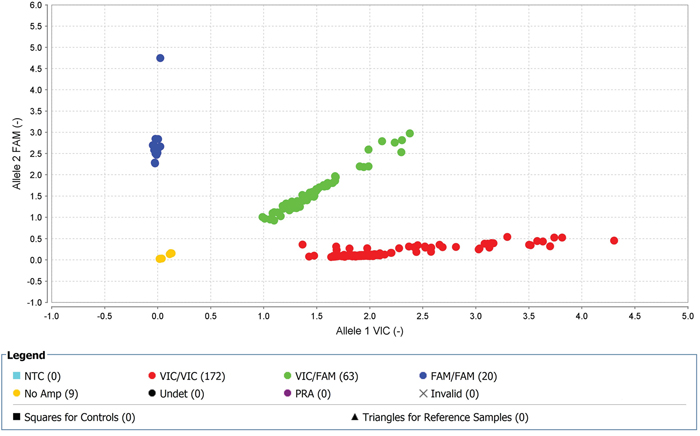
Figure 4: With high-quality threshold the each sample is clustered on the basis of genotype call. Here the cluster observed shows the presence of FAM-labelled allele-2 (C) in all samples in rs239798. The yellow spots are the negative controls.
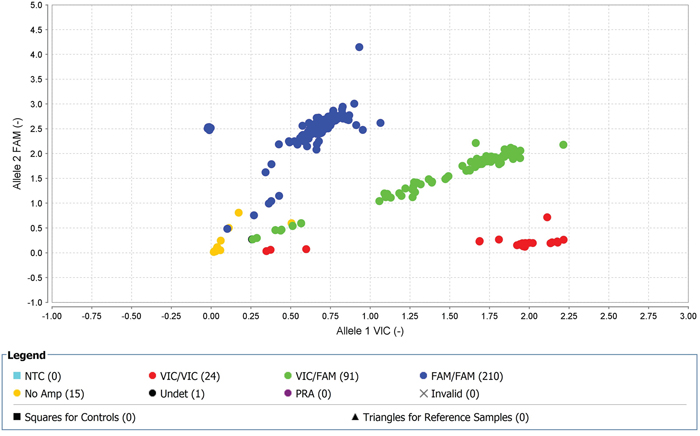
Figure 5: With high-quality threshold the each sample is clustered on the basis of genotype call. Here the cluster observed shows the presence of FAM-labelled allele-2 (A) in all samples in rs9475077. The yellow spots are the negative controls.
Table 5: Genotyping of rs2854344 and rs9475077 through unlabeled PCR primers and TaqMan® MGBprobes (FAM ™ and VIC® dye-labeled in 40X assay mix
rs239798 |
|||||||
|---|---|---|---|---|---|---|---|
Population |
Allele 1 Frequency |
Allele 2 Frequency (Minor Allele Frequency-C) |
1/1 Frequency |
1/2 Frequency |
2/2 Frequency |
Chi-Squared |
P-Value |
CML |
0.728395062 |
0.27160494 |
0.5617284 |
0.333333333 |
0.10493827 |
4.021168 |
0.044937 |
Control |
0.933333333 |
0.06666667 |
0.9 |
0.066666667 |
0.03333333 |
19.40051 |
0 |
rs9475077 |
|||||||
Population |
Allele 1 Frequency (Minor Allele Frequency-A) |
Allele 2 Frequency |
1/1 Frequency |
1/2 Frequency |
2/2 Frequency |
Chi-Squared |
P-Value |
CML |
0.282978723 |
0.71702128 |
0.1021277 |
0.361702128 |
0.53617021 |
2.775499 |
0.045747 |
Control |
0.033333333 |
0.96666667 |
0 |
0.066666667 |
0.93333333 |
0.107015 |
0.743586 |
DISCUSSION
This study provides evidence to support that, in addition to the BCR-ABL translocation t(9;22) (q34;q11), specific gene abnormalities contribute to the transformation from CML-chronic phase (CML-CP) with no copy number aberrations (CNAs) to CML-blast crisis (CML-BC) in adult and pediatric CML [13–17]. In pediatric CML-BC of lymphoid origin, deletions in IKZF1, PAX5, and/or CDKN2A have been frequently reported [13, 14]. In adults, Hosoya et al. performed genome-wide screening of DNA in a total of 55 CML patients at different stages using a high-resolution array-based comparative genomic hybridization technique [18]. They identified losses in 2q26.2-q37.3, 5q23.1-q23.3, 5q31.2-q32, 7p21.3-p11.2, 7q31.1-q31.33, 8pter-p12(p11.2), 9p, and 22q13.1-q13.31 and gains in 3q26.2-q29, 6p22.3, 7p15.2-p14.3, 8p12, 8p21.3, 8p23.2, 8q24.13-q24.21, 9q, 19p13.2-p12, and 22q13.1-q13.32 in chronic phase and reported that these alterations occurred at a higher frequency in AP and blast crisis [18]. Another study by Brazma et al. [19] reported losses at 1p36, 5q21, and 9p21 and gains at 1q, 8q24, 9q34, 16p, and 22q11 after genome-wide screening at a resolution of 1 Mb among 54 samples at different stages of CML together with 12 CML cell lines. Furthermore, Mullighan et al. [20] found higher CNAs in CML-AP and CML-BC of lymphoid origin (1.14 and 7.8, respectively) compared to CML-CP (0.47) using SNP array analysis of 34 adult CML cases [20].
Compared to the references described above [18–20] in undetectable-BCR-ABL-TKI-sensitive group, we similarly observed the previously reported loss of 7p15.2-HOXA9, HOXA11, and HOXA13. In BCR-ABL-dependent/independent TKI-non-sensitive group, we also observed the previously reported loss of 1p36 (TNFRSF14, PRDM16), 2q31.1 (HOXD13, HOXD11), 5q32(PDGFRB), and 7q31.2 (MET) and gain of 9q34.11-q34.2 (FNBP1, ABL1, NUP214, TSC1, and RALGDS genes (Table 2b and 2c). Hence, through above references and our study, we conclude that CNAs were absent in CML-CP-New and CML-CP-UT-TKI-sensitive cases. However, these reported variations were relatively common in samples at progressed stages and TKI-non-sensitive cases. These observations support the notion that the BCR-ABL fusion protein is sufficient to induce CML, but additional genomic changes are required for disease progression and play important roles in resistance to TKI [13–17].
Further, genome-wide transcriptomics have also provided insight into the mechanisms of distinction between CP and BC, progression and resistance of CML on the whole blood of different phases of CML-patients, cell lines, leukemia stem cells, and normal stem and progenitor cell populations [6, 10, 17] Radich et al. [6] showed an association of decreased expression of Jun B and Fos with other deregulated pathways with early accelerated phase and identified 6 genes (NOB1, DDX47, IGSF2, LTB4R, SCARB1, and SLC25A3) that discriminated CP from BC [6]. Later, Wang et al. [17] reported over-expression of early erythroid-related factors [9, 21] transcription factors and activation of proliferative markers like ERK/MAPK, JAK-STAT, and ErbB pathways in K562 cell line [22]. Gerber et al. [10] performed genome-wide transcriptome analysis of CML leukemia stem cells and normal stem and progenitor cell populations using exon arrays. They identified 97 genes that were differentially expressed in CML versus normal stem and progenitor cells. These included significantly up-regulated cell surface genes and genes involved in oxidative metabolism, DNA repair pathways and the activation of inflammatory cytokines. They also observed down-regulation of pro-differentiation and TGF-β/BMP signaling pathways [10]. However, methylation and down-regulation of 897 genes including tumor-suppressor genes or regulators of cell proliferation were observed during disease progression, i.e., conversion of CP to AP/Blast [23].
We also identified up-regulation of highly significant proliferative (24 genes in the RB pathway, ARG1 and CDK1), cell cycle (6 genes involved in G1 to S cell cycle control and 12 genes involved in Mitotic G1-G1/S phases), replicative (8 genes involved in DNA replication) and DNA repair markers (9 genes involved in DNA repair) and down-regulation of several genes related to the immune system (10 genes involved in allograft rejection and 12 genes involved in the Vitamin D receptor pathway), TCR signaling, TGF-beta signaling (FOS, FOSB, TGFBR2, ETS1, JUNB, and LIMK2) and chemokine signaling pathway (CCR6, CCR4, CCR7, CX3CR1, XCL1, CXCL16, JAK3, LYN, ITK, and TIAM1) (Supplementary Table 2) in all drug-treated CML samples when compared against control.
At the exon level, high splicing index affected the dysregulation of normal cellular processes in drug-treated CML cases, including up-regulation of Myeloperoxidase (MPO)-induced neutrophil degranulation affecting the innate immune system [24], TPX2 up-regulation, suggesting inhibition of TP53 transcriptional activity [25, 26], and TYMS, suggesting CML cells are more within the G1/S transition through more formation of TMP and dihydrofolate. Overall, these three factors affected the up-regulation of cell cycle (Reactome Analysis). Further, down-regulation of SKAP1 (Src Kinase Associated Phosphoprotein 1), ITK and TGFBR2 and FOS in CML cases led to down-regulation of the TCR signaling and immune system pathways Additionally, the Src-family kinases (SFKs) have been implicated in BCR-ABL signaling and in the progression of CML [27]. ITK and FOS are involved in the down-regulation of TCR signaling and immune system, respectively, as reported by [6, 10]. On validation in more samples, FOS and TGFBR2 were down-regulated in ~ fifty percent cases and were independent of major molecular response. Contrarily, TPX2 was up-regulated in cases with >1% BCR-ABL copies further validate suppression of TP53 transcriptional activity in resistance [25, 26].
Further, CML-resistant versus -sensitive cases at the exon level, due to high splicing index, nine genes were differentially expressed. Out of which six genes were further validated in additional resistant (>1% BCR-ABL copies in CML-CP-UT, CML-AP-UT, CML-B-UT,) and sensitive (undetectable levels BCR-ABL copies in CML-CP-UT) cases. These genes showed specific involvement of Tie2 (Supplementary Figures 1 and 2) and Basigin-transmembrane glycoprotein (Supplementary Figure 3) in Imatinib-resistant CML cases as reported previously [11, 12]. Tie-2 receptor tyrosine kinase and its ligand ANGPT1 are involved in CML progression or resistance [28]. Basigin also plays important role in tumor invasion, as it is co-expressed in the presence of high lactate and has been reported as a poor prognostic indicator in GIST [35] and imatinib-resistant indicator in CML cells [29]. Amplification of LAPTM4B, which contributes to chemotherapy resistance and recurrence of breast cancer [30, 31] and other solid tumors [32] was over-expressed in our TKI-resistant CML cases. Additionally, inactive EGFR complexes with LAPTM4B recruits Sec5exocyst sub complex which binds to autophagy inhibitor and activates autophagy [33]. Up-regulation of HLTF is associated with tumor progression in hypopharyngeal and cervical cancers [34, 35] was over-expressed in our TKI-resistant CML cases. Recently, Cipolla et al [36] suggested that HLTF repairs DNA damage by acting as a ubiquitin ligase caused by drug-induced reactive oxygen species, leading to resistance [36] and also modulates lysosomal autophagy [37]. CD109 regulates TGF-β receptor endocytosis and degradation to inhibit TGF-β signaling [38] and over-expression of CD109 in Imatinib resistant cases may further down-regulate TGF- β signaling. CFH co-factor for complement factor 1 inhibits C3 activation cascade in alternative pathway by promoting cleavage of C3b to iC3b-over-expression has been reported in cutaneous squamous cell carcinoma cells [39]. Expression of CFH help in immune escape and it has been documented in malignant ovarian and bladder cancers [40]. CFH also controls the stemness of liver cancer cells [41]. PIEZO2 which has been proposed as biomarker for CML stem cells [8] was also over-expressed in our Imatinib resistant cases.
Analysis of CML patients in the chronic phase and under treatment (CML-CP-UT) with BCR-ABL10-77.02% as identified through the genotyping array, which has been designed for a broad range of applications to give us complete flexibility both for identification of genotypic markers and to explore the complexity of diseases [42, 43], we found that rsID239798 (Ch6:54940890) and rsID9475077 (Ch6:54941691) were associated with FAM83B. FAM83B is a proto-oncogene involved in the epidermal growth factor receptor (EGFR) signaling pathway and activates both the EGFR itself and downstream RAS/MAPK and PI3K/AKT/TOR signaling cascades [44–46]. Both the rsIDs are missense mutations and show a minor allele frequency of C=0.2895/1450 (rsID239798; lysine (K) to Threonine (T) transition at position 640) and A=0.2893/1449 (rsID9475077; threonine (T) to Asparagine (N) transition at position 907) as established by 1000 Genome Project [47]. Grant [48] also suggested a role for FAM83A and FAM83B in therapeutic resistance to TKI [49].
MATERIALS AND METHODS
Ethics statement
All the samples were obtained after informed consent, and the study was approved by the Institutional Ethics Committee, King George's Medical University. All experiments have been performed in accordance with relevant guidelines and regulations.
Patients and sample preparation
We collected peripheral blood samples from 4 healthy volunteers and 70 clinically diagnosed CML patients, which included treated and new chronic phase (CML-CP-UT and CML-CP-New), treated CML-accelerated phase (CML-AP-UT), and treated fresh blast phase (CML-B-UT and CML-B-New) samples from the Department of Clinical Hematology, King George’s Medical University, Lucknow, India. All CML samples displayed a myeloid phenotype. More than 90% of patient cells were Philadelphia chromosome-positive (Ph), and blast crisis was characterized by >30% or >50% blasts and promyelocytes in peripheral blood or bone marrow, respectively [50].
All patients (Table 6) were treated with Imatinib alone or in combination with Hydrea/Hydroxyurea. Importantly, when patients failed to achieve time-dependent molecular targets, we switched to nilotinib or high-dose Imatinib. Clinical outcomes included molecular response based on BCR-ABL. Additionally, because patients were from a remote area, the samples used in the study were collected on dates other than the date of disease initiation or the date on which BCR-ABL expression was assessed.
Table 6: Chronic myeloid leukemia - clinical presentation showing different phases without (Chronic Phasenew; CP-new and Blast new; B-new) and with (Chronic Phase under treatment; CP-UT, accelerated phase under treatment; AP-UT and Blast Phase under treatment; B-UT ) treatment for the samples being processed for copy number variations and transcriptomics analysis
Sample ID |
Age/Sex |
Sample collection date |
Time of Assessment |
Date disease initiated |
Follow up date |
Treatment |
Date of BCR-ABL detection |
BCR-ABL% |
Comments based on BCR-ABL |
|
|---|---|---|---|---|---|---|---|---|---|---|
1 |
9 |
46/M |
28-05-2014 |
New |
28-05-2014 |
28-05-2015 |
Imatinib |
28-05-2014 |
100 |
- |
2 |
10 |
20/M |
28-05-2014 |
New |
28-05-2014 |
30-03-2015 |
Imatinib |
28-05-2014 |
120 |
- |
06-02-2015 |
0.95 |
- |
||||||||
3 |
30 |
22/M |
12-06-2014 |
New |
24-06-2014 |
24-06-2014 |
Imatinib |
24-06-2014 |
100 |
- |
30-09-2014 |
12.65 |
|||||||||
4 |
73 |
50/M |
22-04-2015 |
New |
25-04-2015 |
29-04-2015 |
Imatinib |
25-04-2015 |
73.8 |
- |
5 |
83 |
70/M |
27-04-2015 |
New |
18-04-2015 |
01-05-2015 |
Imatinib |
18-04-2015 |
77.02 |
- |
Chronic myeloid Leukemia-Chronic Phase Under Treatment (CML-CP-UT) |
||||||||||
Sample No |
Age/Sex |
Sample collection date |
Time of Assessment |
Date disease initiated |
Follow up date |
Treatment |
Date of BCR-ABL detection |
BCR-ABL% |
Comments based on BCR-ABL |
|
6 |
2 |
50/M |
22-05-2014 |
4 yrs |
10-06-2010 |
20-03-2014 |
Droxygel (Antacid), Unidrea and Imatinib |
14-02-2013 |
100% |
Initially with Droxygel (Antacid), Unidrea and later with Imatinib sensitive |
20-03-2014 |
not detected |
|||||||||
7 |
4 |
14/M |
22-05-2014 |
10 months |
04-07-2013 |
20-04-2015 |
Imatinib |
15-07-2013 |
100 |
Imatinib sensitive |
06-09-2014 |
Not detected |
|||||||||
18-03-2015 |
81.88 |
|||||||||
8 |
6 |
24/M |
22-05-2014 |
7 months |
21-11-2013 |
22-06-2015 |
Imatinib |
21-11-2013 |
75 |
Imatinib sensitive |
17-06-2014 |
0.09 |
|||||||||
9 |
7 |
41/M |
22-05-2014 |
7.2 yrs |
29-03-2007 |
21-05-2015 |
Imatinib |
28-02-2007 |
100% |
Imatinib sensitive |
22-07-2014 |
not Detected |
|||||||||
10 |
11 |
33/F |
28-05-2014 |
4.2 yrs |
21-05-2014 |
23-04-2015 |
Hydab and Imatinib |
21-04-2010 |
97.54 |
|
21-05-2014 |
not Detected |
Hydab and Imatinib sensitive |
||||||||
11 |
13 |
50/M |
29-05-2014 |
7.1 yrs |
26-04-2007 |
06-07-2015 |
Droxygel (Antacid), Unidrea and Imatinib |
20-02-2014 |
30 |
Droxygel (Antacid), Unidrea and Imatinib sensitive |
12-03-2015 |
0.1 |
|||||||||
12 |
16 |
30/M |
29-05-2014 |
10 months |
23-03-2015 |
19-03-2015 |
Imatinib |
23-05-2014 |
43.2 |
Imatinib non-sensitive |
19-03-2015 |
35 |
|||||||||
13 |
20 |
33/F |
05-06-2014 |
1 month |
21-05-2014 |
05-06-2014 |
Imatinib |
21-05-2014 |
97.54 |
NA |
14 |
21 |
60/M |
05-06-2014 |
3.8 yrs |
09-09-2010 |
11-06-2015 |
Droxygel (Antacid), Unidrea and Imatinib |
14-11-2013 |
75 |
Droxygel (Antacid), Unidrea and Imatinib-sensitive |
31-07-2014 |
0.11 |
|||||||||
15 |
23 |
40/M |
05-06-2014 |
2.4 yrs |
24-02-2012 |
05-06-2014 |
Unidrea and Imatinib, Nilotinib |
31-07-2013 |
28.35 |
Unidrea and Imatinib, Nilotinib-non-sensitive (TKI non sensitive) |
13-05-2014 |
11.9 |
|||||||||
16-02-2015 |
16.53 |
|||||||||
16 |
24 |
26/F |
05-06-2014 |
8.5 yrs |
05-01-2006 |
21-05-2015 |
Initially treated with Myeleron, Hydab irocos, Zyloric since may 2005 on Imatinib |
24-04-2014 |
30 |
Initially treated with Myeleron, Hydab irocos, Zyloric since may 2005 on Imatinib non-sensitive |
21-05-2015 |
15.85 |
|||||||||
17 |
26 |
32/M |
05-06-2014 |
2.1 yrs |
10-05-2012 |
22-09-2014 |
Imatinib |
26-03-2012 |
100 |
Imatinib non-sensitive |
10-05-2014 |
13.6 |
|||||||||
18 |
36 |
23/M |
03-07-2014 |
6.10 yrs |
08-09-2007 |
07-05-2015 |
Hydab and Imatinib |
20-02-2010 |
30 |
Hydab and Imatinib-sensitive |
30-10-2014 |
not detected |
|||||||||
19 |
43 |
27/M |
10-07-2014 |
7 yrs |
21-07-2007 |
Initially Hydroxyurea and Imatinib |
23-02-2012 |
55.89 |
Imatinib non-sensitive |
|
17-06-2014 |
11.18 |
|||||||||
14-03-2015 |
0 |
|||||||||
20 |
48 |
33/M |
31-07-2014 |
10.4 yrs |
16-03-2004 |
18-09-2014 |
Initially Hydroxyurea and since December 2004 Imatinib |
01-10-2004 |
100 |
Imatinib non-sensitive |
07-03-2013 |
60 |
|||||||||
05-09-2013 |
41.1 |
|||||||||
03-09-2013 |
41.41 |
|||||||||
29-05-2014 |
9.94 |
|||||||||
21 |
50 |
21/M |
31-07-2014 |
4.3 yrs |
01-04-2010 |
18-09-2014 |
Imatinib |
20-11-2013 |
23.3 |
Imatinib non-sensitive |
13-08-2014 |
10.12 |
|||||||||
22 |
51 |
60/M |
31-07-2014 |
25 year |
Initially treated with Myeleron, Hydab irocos, Zyloric since may 2005 on Imatinib |
12-05-2013 |
30 |
Initially treated with Myeleron, Hydab irocos, Zyloric since may 2005 on Imatinib non-sensitive |
||
11-06-2014 |
8.98 |
|||||||||
23 |
52 |
40/M |
31-07-2014 |
4.3 yrs |
01-04-2010 |
31-07-2014 |
Imatinib |
10-04-2010 |
100 |
Imatinib non-sensitive |
01-07-2014 |
18 |
|||||||||
24 |
53 |
24/M |
08-01-2015 |
3.1 yrs |
08-12-2011 |
08-01-2015 |
Imatinib |
08-12-2011 |
100 |
Imatinib non-sensitive |
22-02-2015 |
17.23 |
|||||||||
25 |
54 |
28/M |
06-02-2015 |
4.4 yrs |
15-10-2010 |
22-12-2014 |
Imatinib |
15-05-2014 |
100 |
Imatinib non-sensitive |
06-11-2014 |
40.4 |
|||||||||
26 |
55 |
60M |
06-02-2015 |
3 months |
02-12-2014 |
01-05-2015 |
Hydroxyurea, Zyloric and Imatinib |
02-12-2014 |
98.47 |
Hydroxyurea, Zyloric and Imatinib-non- sensitive |
01-05-2015 |
9.75 |
|||||||||
27 |
56 |
43F |
09-02-2015 |
1.0 yr |
29-02-2014 |
24-03-2015 |
Hydroxyurea, Zyloric and Imatinib |
29-02-2014 |
89.5 |
Hydroxyurea, Zyloric and Imatinib non- sensitive |
24-03-2015 |
1.2 |
|||||||||
28 |
57 |
42F |
09-02-2015 |
7 months |
22-07-2014 |
22-04-2015 |
Hydroxyurea, Zyloric and Imatinib |
22-07-2014 |
67.45 |
Hydroxyurea, Zyloric and Imatinib non- sensitive |
22-04-2015 |
8 |
|||||||||
29 |
58 |
32/F |
09-02-2015 |
9 months |
12-04-2015 |
12-04-2015 |
Hydroxyurea, Zyloric and Imatinib |
12-04-2015 |
58.75 |
Hydroxyurea, Zyloric and Imatinib non- sensitive |
12-04-2015 |
9.8 |
|||||||||
30 |
59 |
15/M |
01-04-2015 |
3 months |
10-12-2014 |
13-04-2015 |
Hydroxyurea, Zyloric and Imatinib |
11-12-2014 |
15.75 |
Hydroxyurea, Zyloric and Imatinib non- sensitive |
29-04-2015 |
9.75 |
|||||||||
31 |
60 |
29/F |
09-04-2015 |
4.5 yrs |
28-12-2010 |
Imatinib |
08-04-2011 |
18 |
Imatinib non-sensitive |
|
24-02-2015 |
16 |
|||||||||
32 |
61 |
26/F |
09-04-2015 |
9.4 yrs |
18-12-2005 |
Imatinib |
08-04-2011 |
18% |
Imatinib non-sensitive |
|
24-02-2014 |
BCR-ABL positive in 200 cells |
|||||||||
33 |
63 |
37/M |
09-04-2015 |
7 months |
21-08-2014 |
09-04-2015 |
Imatinib |
21-08-2014 |
100 |
Imatinib non-sensitive |
09-04-2015 |
80 |
|||||||||
34 |
65 |
43/M |
20-04-2015 |
7.9 yrs |
29-06-2007 |
22-04-2015 |
Imatinib |
24-06-2014 |
18.95 |
Imatinib non-sensitive, however, nilotinib sensitive |
22-04-2015 |
4.63 |
|||||||||
35 |
66 |
30/F |
20-04-2015 |
4.4yrs |
15-05-2010 |
22-12-2014 |
Imatinib |
15-05-2014 |
100 |
Imatinib non-sensitive |
06-01-2015 |
40.4 |
|||||||||
36 |
67 |
52/M |
16-04-2015 |
6.1 yrs |
21-02-2009 |
01-06-2015 |
Initially Hydab, Uridrea and since october 2012 Imatinib |
15-04-2014 |
20 |
Initially Hydab, Uridrea and since october 2012 Imatinib-non-sensitive |
01-06-2015 |
18.63 |
|||||||||
37 |
68 |
28/M |
16-04-2015 |
4 months |
01-11-2014 |
08-06-2015 |
Imatinib |
22-09-2014 |
45.2 |
Imatinib non-sensitive |
22-04-2015 |
16.1 |
|||||||||
38 |
71 |
52/M |
16-04-2015 |
8.1 yrs |
21-02-2007 |
21-06-2015 |
Initially Hydab, Uridrea and since october 2012 Imatinib |
15-04-2014 |
20 |
Initially Hydab, Uridrea and since october 2012 Imatinib non-sensitive |
22-06-2015 |
8.63 |
|||||||||
39 |
75 |
20/M |
27-04-2015 |
2.1 yrs |
02-03-2013 |
02-05-2015 |
Initially Hydab, Uridrea and since march 2013 Imatinib |
02-03-2013 |
100 |
Initially Hydab, Uridrea and since march 2013 Imatinib non-sensitive |
01-04-2015 |
20 |
|||||||||
40 |
77 |
25/M |
27-04-2015 |
7.2 yrs |
19-02-2008 |
03-05-2015 |
Imatinib |
19-02-2008 |
80 |
Imatinib non-sensitive |
03-04-2015 |
8 |
|||||||||
41 |
78 |
30/F |
27-04-2015 |
3.1 yrs |
21-03-2013 |
03-05-2015 |
Imatinib |
28-10-2013 |
74.91 |
Imatinib non-sensitive |
10 |
||||||||||
42 |
79 |
45/M |
27-04-2015 |
2.3 yrs |
17-01-2013 |
27-04-2015 |
Imatinib |
10-01-2013 |
110 |
Imatinib non-sensitive |
04-03-2015 |
39.09 |
|||||||||
43 |
80 |
26/M |
27-04-2015 |
3.2 yrs |
10-02-2012 |
03-05-2015 |
Imatinib |
10-02-2012 |
80 |
Imatinib non-sensitive |
03-04-2015 |
29 |
|||||||||
44 |
81 |
26/F |
27-04-2015 |
2.6 yrs |
25-10-2012 |
03-05-2015 |
Imatinib |
25-10-2012 |
100 |
Imatinib non-sensitive |
03-04-2015 |
31.02 |
|||||||||
45 |
84 |
23/M |
27-04-2015 |
8 yrs |
26-04-2007 |
27-04-2015 |
Imatinib |
10-12-2014 |
20 |
|
27-03-2015 |
8 |
|||||||||
46 |
85 |
30/M |
27-04-2015 |
9 .7yrs |
13-09-2005 |
03-05-2015 |
Hydab and Imatinib |
08-07-2005 |
110 |
Hydab and Imatinib non-sensitive |
02-02-2015 |
13.12 |
|||||||||
47 |
87 |
45/F |
08-06-2015 |
2.9 yrs |
14-09-2011 |
08-06-2015 |
Imatinib |
01-07-2015 |
86 |
Imatinib non-sensitive |
48 |
88 |
48/M |
08-06-2015 |
4.8 yrs |
28-10-2010 |
08-06-2015 |
Imatinib |
17-07-2014 |
30 |
Imatinib non-sensitive |
13-05-2015 |
10 |
|||||||||
49 |
89 |
25/M |
08-05-2015 |
8 months |
23-08-2014 |
08-06-2015 |
Imatinib |
23-08-2014 |
100 |
Imatinib non-sensitive |
24-03-2015 |
2 |
|||||||||
50 |
91 |
66/F |
08-06-2015 |
6 months |
10-11-2014 |
08-06-2015 |
Imatinib |
10-09-2014 |
38.52 |
Imatinib non-sensitive |
22-04-2015 |
26.1 |
|||||||||
51 |
93 |
60/M |
08-06-2015 |
11 months |
17-07-2014 |
08-06-2015 |
Imatinib |
14-05-2014 |
100 |
Imatinib non-sensitive |
11-03-2015 |
70.13 |
|||||||||
Chronic Myeloid Leukemia-Accelerated Phase-Under Treatment (CML-AP-UT) |
||||||||||
Sample No |
Age/Sex |
Sample collection date |
Time of Assessment |
Date disease initiated |
Follow up date |
Treatment |
Date of BCR-ABL detection |
BCR-ABL% |
Comments based on BCR-ABL |
|
52 |
1 |
35/M |
22-05-2014 |
1.8 yrs |
20-09-2012 |
30-03-2015 |
Imatinib |
30-08-2012 |
26 |
Imatinib non-sensitive |
53 |
22 |
40/M |
05-06-2014 |
5.2 yrs |
02-04-2009 |
18-06-2014 |
Hydab and Imatinib |
17-11-2013 |
39.07 |
Hydab and Imatinib non-sensitive |
05-08-2014 |
20.11 |
|||||||||
54 |
32 |
27/F |
12-06-2014 |
15 yrs |
02-06-1999 |
30-03-2015 |
Initially treated with Myeleron, Hydab irocos, Zyloric since may 2005 on Imatinib |
13-07-2014 |
55.63 |
Initially treated with Myeleron, Hydab irocos, Zyloric since may 2005 on Imatinib-non-sensitive |
17-11-2014 |
35.37 |
|||||||||
30-03-2015 |
26.93 |
|||||||||
55 |
33 |
20/M |
28-06-2014 |
2 yrs |
19-07-2012 |
18-06-2015 |
Imatinib |
24-07-2012 |
Imatinib non-sensitive |
|
27-06-2014 |
12.18 |
|||||||||
14-03-2015 |
0 |
|||||||||
56 |
35 |
28/F |
03-07-2014 |
6.3 yrs |
03-04-2008 |
03-07-2014 |
Imatinib |
24-07-2010 |
100 |
Imatinib non-sensitive |
13-04-2013 |
0.02 |
|||||||||
03-07-2014 |
8.56 |
|||||||||
57 |
37 |
27/F |
03-07-2014 |
8 months |
19-12-2013 |
04-06-2015 |
Imatinib |
01-04-2013 |
100 |
Imatinib non-sensitive |
03-07-2014 |
50 |
|||||||||
58 |
38 |
60/M |
03-07-2014 |
1.5 yrs |
21-02-2013 |
13-03-2014 |
Imatinib |
29-03-2013 |
79.01 |
Imatinib non-sensitive |
24-06-2014 |
35.12 |
|||||||||
59 |
62 |
42/M |
09-04-2015 |
4.4 yrs |
04-11-2010 |
09-04-2015 |
Uridrea, Imatinib and since February 2014 Nilotinib |
06-06-2014 |
14.96 |
Uridrea, Imatinib was non-sensitive but Nilotinib was TKI-non-sensitive |
22-06-2015 |
4.03 |
|||||||||
60 |
69 |
40/F |
16-04-2015 |
3 months |
29-12-2014 |
13-04-2015 |
Imatinib |
04-11-2014 |
14.08 |
Imatinib non-sensitive |
29-04-2015 |
9.75 |
|||||||||
61 |
70 |
30/M |
16-04-2015 |
1.0 year |
01-04-2014 |
22-04-2015 |
Imatinib and december 2014 nilotinib |
10-01-2015 |
20 |
Imatinib and Nilotinib sensitive |
22-04-2015 |
1.63 |
|||||||||
62 |
72 |
45/M |
16-04-2015 |
6 months |
29-10-2014 |
08-06-2015 |
Imatinib and june 2015 Nilotinib |
16-10-2014 |
25.19 |
Imatinib non-sensitive |
01-05-2015 |
5.45 |
|||||||||
63 |
86 |
49/M |
27-04-2015 |
5 months |
11-12-2014 |
08-06-2015 |
Imatinib and march 2015 Nilotinib |
25-11-2014 |
18.04 |
Imatinib non-sensitive |
01-05-2015 |
2.45 |
|||||||||
Chronic Myeloid Leukemia-Blast Phase New (CML-BP-New) |
||||||||||
Sample No |
Age/Sex |
Sample collection date |
Time of Assessment |
Date disease initiated |
Follow up date |
Treatment |
Date of BCR-ABL detection |
BCR-ABL% |
Comments based on BCR-ABL |
|
64 |
14 |
35/F |
29-05-2014 |
New |
25-05-2014 |
04-05-2015 |
Imatinib |
09-06-2014 |
85.56 |
|
65 |
19 |
28/M |
29-05-2014 |
New |
15-05-2014 |
22-12-2014 |
Imatinib |
15-05-2014 |
100 |
Imatinib non-sensitive switched to nilotinib |
66 |
34 |
24/M |
12-06-2014 |
New |
20-06-2014 |
22-07-2015 |
Imatinib and since February 2015 Nilotinib |
20-06-2014 |
35.63 |
Imatinib non-sensitive |
27-11-2014 |
95.37 |
|||||||||
67 |
8 |
24/M |
22-05-2014 |
8 months |
26-09-2013 |
15-05-2014 |
Imatinib |
26-09-2013 |
100 |
Imatinib non-sensitive |
20-06-2014 |
26.89 |
|||||||||
68 |
29 |
35F |
05-06-2014 |
1 month |
04-05-2014 |
Imatinib |
04-05-2014 |
89.12 |
Imatinib non-sensitive |
|
01-08-2014 |
15.89 |
|||||||||
69 |
47 |
48/M |
17-07-2014 |
3 months |
17-07-2014 |
29-04-2015 |
Imatinib and 29-05-2014 Uridrea |
27-07-2014 |
40.12 |
Imatinib non-sensitive |
29-10-2014 |
32.45 |
|||||||||
70 |
49 |
15/M |
31-07-2014 |
1.4 yrs |
09-05-2013 |
11-05-2015 |
Imatinib |
06-03-2013 |
100 |
Imatinib non-sensitive |
30-06-2014 |
not detected |
|||||||||
Whole blood collected from 70 patients enrolled in this study were subjected to DNA and RNA extraction using QIAamp DNA mini kit (Qiagen, Hilden, Germany) and Trizol, respectively. The quality and quantity of DNA was checked both using a Quawell- spectrophotometer (Quawell Technology Inc., San Jose, CA 95161-2738) and a QubitBR-Fluorimeter (Agilent, Santa Clara, CA, USA). DNA samples with an absorption ratio (A260/A280) greater than 1.9 was considered for further CNV analysis using the Molecular Inversion based probe array (MIP-based array). RNA quantity and purity were determined by using the Samples with purity ratios (A260/A280) between 1.80 and 2.00 were considered for further analyses. Formaldehyde agarose gel were used to check the integrity of the extracted RNA; only samples with a 2:1 ratio of the 18S and 28S ribosomal RNAs were used for further transcriptomic analysis using the human transcriptome array 2.0 [51, 52].
Molecular inversion probe (MIP)-based oncoscan array hybridization
Using the MIP-based Oncoscan array, 34 CML (out of 70 CML) and 5 control samples (one male, two females, and kit-derived positive and negative controls) were processed for CNV profiling using 12 ng/μL DNA per sample. According to the recommended protocol, the chips were processed and scanned through GENECHIP Scanner-7G (Affymetrix, CA) for identification of copy number and somatic mutation variations as reported previously [51]. Further, the OSCHP file generated through Oncoscan Console Software (Biodiscovery, Inc., CA USA) was analyzed via Tumor Scan (TuScan) and BioDiscovery’s SNP-FASST2 algorithm using the Nexus Express for Oncoscan software version 7.5 (Biodiscovery, Inc., CA USA). The TuScan algorithm creates segmentation to differentiate between adjacent clusters of probes and determines copy number variations. The BioDiscovery’s SNP-FASST2 algorithm, a proprietary variation of a Hidden Markov Model (HMM), is used to identify allelic event calls.
Human transcriptome array 2.0 hybridization
For transcriptomics, we processed 35 CML samples (out of 70 CML-samples) and 4 control samples. The CEL files were generated by processing 500 ng of total RNA on Affymetrix HTA 2.0 arrays according to the manufacturer’s recommendations (Affymetrix, Santa Clara, Calif) and were scanned through GENECHIP Scanner-7G (Affymetrix, CA) [52]. The CEL files generated by these arrays were converted into rma-gene-ful.chp and. rma-alt-splice-dabg.chp files through Affymetrix Expression Console™ Software (version 1.3). The data was then analyzed through Transcriptome Analysis Consolev3.0. After running ANOVA, multi-testing correction was performed using Benjamini-Hochberg Step-Up FDR-controlling procedure for all expressed genes and expressed PSRs/Junctions (i.e., expressed in at least one condition). By default, the alpha level was set at 0.05 in the false discovery rate field.
Biobank genotyping array hybridization
Axiom Biobank genotyping arrays was used to genotype 65 CML-TKI-treated CML cases- (out of 70 CML-samples) and 30 control samples (Supplementary Table 3). Out of 65 cases, 19 new samples-Imatinib treated (CML-CP-UT) with BCR-ABL ranging from 10 to 77.02% (numbered 16, 50, 52-54, 60, 61, 66, 67, 75-82, 84, 85 and 88) were included in the study but were not processed for CNVs and Transcriptomics. The experiment was conducted as recommended by the manufacturer’s protocol. All processed samples passed dish quality control (DQC), quality control call rate (QC CR) and plate quality control (QC). Average quality control (QC) call rate for the passing samples was 99.571.
REAL TIME SNP genotyping
We designed unlabeled PCR primers and TaqManMGBprobes (FAM and VIC dye-labeled) in 40X assay mix (Assays-by-DesignSM Service for SNP Genotyping Assays) to genotype rs2854344 and rs9475077. Alleles were scored in each well using TaqMan Genotyping Master Mix and 20 ng of specific genomic DNA following the universal thermal cycling parameters per the recommended protocol. Each sample was processed in triplicate, and a negative control was also processed for real-time analysis with every 96-well format assay. The raw data were obtained using ABI Step OnePlus Real-Time PCR System and were analyzed through TaqMan Genotype software. The genotype call was evaluated with a threshold quality value=0.94.
BCR-ABL transcript determination
For the quantitative detection and differentiation of BCR-ABL fusion gene transcripts major (M), minor (m), and micro (μ) in peripheral blood samples from CML patients, TRUPCR BCR-ABL REAL TIME PCR KIT was used with a real-time PCR system (ABI Step one plus). This kit is designed according to the “Europe Against Cancer” (EAC) and Guidelines for the measurement of BCR-ABL transcripts in CML patients with the updated international recommendations. It has a two-step protocol in which total RNA is reverse-transcribed, and the generated cDNA is amplified by PCR using a pair of specific primers and a specific internal double-dye probe for BCR-ABL (major, minor, and micro) and ABL. A standard curve was plotted against a known number of copies of BCR-ABL 1 and ABL1. Normalized copy number (NCN) was calculated using the following formula: NCN(%)= (BCR-ABL CN/ABL1 CN)*100.
Expression analysis of selected genes using quantitative real-time PCR
Comparative relative expression of FOS, TGFBR2, TPX2, LAPTM4B, HLTF, CFH, PIEZO2, CD109, ANGPT1 against β actin and 18s ribosomal reference gene were measured by real-time PCR (RT-PCR) in 23 CML and 8 control samples. The RT-PCR amplifications were carried out using a ABI Stepone RT-PCR in a final volume of 20 μl containing 0.5 μl normalized cDNA, 10 pmol of each primer and 10 μl SYBR green master mix together with a negative control with no template by following RT-PCR steps; activation step at 95 °C for 5 min, followed by 40 cycles of: 15 s at 95 °C, 15 s at the Tm specific for the primer pairs used, and 35 s at 72 °C with a single fluorescence measurement. After the amplification phase, a melting curve cycle was set at 95 °C for 5 s, 67 °C for 1 min with acquisitions 5 per °C from 97 to 65 °C and a continuous measurement was performed to confirm later about the amplification of a single product. RT-PCR was repeated twice for each sample in triplicates. The crossing point, Ct values was acquired for both the target and reference gene using ABI Stepone RT-PCR software. The relative level of each transcript in different tissue was calculated by normalization of the value with the corresponding reference and compared among them using Ct values for tumor cDNA as positive calibrator. Comparison of relative expression level of each transcript was analyzed by REST 2009 software with 2000 time iterations (http://www.REST.de.com).
CONCLUSIONS
The highly significant down-regulation of STAT6, FOS, TGFBR2, and ITK and up-regulation of MPO, TPX2, and TYMS in drug-treated CML cases relative to normal samples led to the up-regulation of cell cycle, DNA replication, and DNA repair pathways and down-regulation of immune system, chemokine and interleukin signaling, TCR signaling, TGF beta signaling, and MAPK signaling pathways. Further, significant up-regulation of LAPTM4B, HLTF, PIEZO2, CFH, CD109, ANGPT1 influence autophagy, stem cell, complement system, TGFβ Receptor and homeostasis pathway subsequently leading to resistance in >1% BCR-ABL copies of CML treated cases.
Hence, we suggest that genes included in these pathways may be used as markers for CML development (FOS, TGFBR2, TPX2) and CML resistance to therapy (LAPTM4B, HLTF, PIEZO2, CFH, CD109, ANGPT1). This dynamic was accompanied by a loss of 7q31.2 (MET) in low CNVs in the undetectable BCR-ABL-TKI-sensitive group and were identified and previously reported as CNVs 9q34.11-q34.2 (FNBP1, ABL1, NUP214, TSC1, RALGDS) in the high CNVs-BCR-ABL-dependent and independent-TKI-non-sensitive groups. Further, rsID239798 (Ch6:54940890) and rsID9475077 (Ch6:54941691) were associated with FAM83B, a proto-oncogene that has previously been implicated in therapeutic resistance to TKI.
Author contributions
Conceived and designed the experiments: NS and RK. Clinically diagnosed samples were provided by AKT; Sample Collection, Nucleic Acid isolation and performed the experiment: DKS, NS, AM, NP, RC, HS, NA, SD, PS and AM Analyzed the data: NS, DKS ML, BA, JV, CY. Wrote the paper: NS. Contributed reagents/materials/analysis tools: RK. Reviewed the paper: RK and AKT.
CONFLICTS OF INTEREST
The authors also declare no conflicts of interest.
FUNDING
This work was supported by “2014 Tumor Profiling Grant, Affymetrix, USA”.
REFERENCES
1. Soverini S, De Benedittis C, Mancini M, Martinelli G. Best Practices in Chronic Myeloid Leukemia Monitoring and Management. Oncologist. 2016; 21:626-633.
2. Zhen C, Wang YL. Molecular monitoring of chronic myeloid leukemia: international standardization of BCR-ABL1 quantitation. J Mol Diagn. 2013; 15:556-564.
3. Radich JP, Shah NP, Mauro MJ. Integrating current treatment options for TKI-resistant chronic myeloid leukemia. Clin Adv Hematol Oncol. 2014; 12:3-17, 11.
4. El-Metnawy WH, Mattar MM, El-Nahass YH, Samra MA, Abdelhamid HM, Abdlfattah RM, Hamed AR. Predictive Value of Pretreatment BCR-ABL(IS) Transcript level on Response to Imatinib Therapy in Egyptian Patients with Chronic Phase Chronic Myeloid Leukemia (CPCML). Int J Biomed Sci. 2013; 9:48-53.
5. Hehlmann R, Muller MC, Lauseker M, Hanfstein B, Fabarius A, Schreiber A, Proetel U, Pletsch N, Pfirrmann M, Haferlach C, Schnittger S, Einsele H, Dengler J, et al. Deep molecular response is reached by the majority of patients treated with imatinib, predicts survival, and is achieved more quickly by optimized high-dose imatinib: results from the randomized CML-study IV. J Clin Oncol. 2014; 32:415-423.
6. Radich JP, Dai H, Mao M, Oehler V, Schelter J, Druker B, Sawyers C, Shah N, Stock W, Willman CL, Friend S, Linsley PS. Gene expression changes associated with progression and response in chronic myeloid leukemia. Proc Natl Acad Sci U S A. 2006; 103:2794-2799.
7. McWeeney SK, Pemberton LC, Loriaux MM, Vartanian K, Willis SG, Yochum G, Wilmot B, Turpaz Y, Pillai R, Druker BJ, Snead JL, MacPartlin M, O'Brien SG, et al. A gene expression signature of CD34+ cells to predict major cytogenetic response in chronic-phase chronic myeloid leukemia patients treated with imatinib. Blood. 2010; 115:315-325.
8. Aviles-Vazquez S, Chavez-Gonzalez A, Hidalgo-Miranda A, Moreno-Lorenzana D, Arriaga-Pizano L, Sandoval-Esquivel MA, Ayala-Sanchez M, Aguilar R, Alfaro-Ruiz L, Mayani H. Global gene expression profiles of hematopoietic stem and progenitor cells from patients with chronic myeloid leukemia: the effect of in vitro culture with or without imatinib. Cancer Med. 2017; 6:2942-2956.
9. Wang H, Hu H, Zhang Q, Yang Y, Li Y, Hu Y, Ruan X, Yang Y, Zhang Z, Shu C, Yan J, Wakeland EK, Li Q, et al. Dynamic transcriptomes of human myeloid leukemia cells. Genomics. 2013; 102:250-256.
10. Gerber JM, Gucwa JL, Esopi D, Gurel M, Haffner MC, Vala M, Nelson WG, Jones RJ, Yegnasubramanian S. Genome-wide comparison of the transcriptomes of highly enriched normal and chronic myeloid leukemia stem and progenitor cell populations. Oncotarget. 2013; 4:715-728. https://doi.org/10.18632/oncotarget.990.
11. Jones N, Dumont DJ. Tek/Tie2 signaling: new and old partners. Cancer Metastasis Rev. 2000; 19:13-17.
12. Jiang JL, Tang J. CD147 and its interacting proteins in cellular functions. Sheng Li Xue Bao. 2007; 59:517-523.
13. van der Sligte NE, Krumbholz M, Pastorczak A, Scheijen B, Tauer JT, Nowasz C, Sonneveld E, de Bock GH, Meeuwsen-de Boer TG, van Reijmersdal S, Kuiper RP, Bradtke J, Metzler M, et al. DNA copy number alterations mark disease progression in paediatric chronic myeloid leukaemia. Br J Haematol. 2014; 166:250-253.
14. Alpar D, de Jong D, Savola S, Yigittop H, Kajtar B, Kereskai L, Pajor L, Szuhai K. MLPA is a powerful tool for detecting lymphoblastic transformation in chronic myeloid leukemia and revealing the clonal origin of relapse in pediatric acute lymphoblastic leukemia. Cancer Genet. 2012; 205:465-469.
15. Nacheva EP, Brazma D, Virgili A, Howard-Reeves J, Chanalaris A, Gancheva K, Apostolova M, Valganon M, Mazzullo H, Grace C. Deletions of immunoglobulin heavy chain and T cell receptor gene regions are uniquely associated with lymphoid blast transformation of chronic myeloid leukemia. BMC Genomics. 2010; 11:41.
16. Nadarajan VS, Phan CL, Ang CH, Liang KL, Gan GG, Bee PC, Zakaria Z. Identification of copy number alterations by array comparative genomic hybridization in patients with late chronic or accelerated phase chronic myeloid leukemia treated with imatinib mesylate. Int J Hematol. 2011; 93:465-473.
17. Wang L, Howarth A, Clark RE. Ikaros transcripts Ik6/10 and levels of full-length transcript are critical for chronic myeloid leukaemia blast crisis transformation. Leukemia. 2014; 28:1745-1747.
18. Hosoya N, Sanada M, Nannya Y, Nakazaki K, Wang L, Hangaishi A, Kurokawa M, Chiba S, Ogawa S. Genomewide screening of DNA copy number changes in chronic myelogenous leukemia with the use of high-resolution array-based comparative genomic hybridization. Genes Chromosomes Cancer. 2006; 45:482-494.
19. Brazma D, Grace C, Howard J, Melo JV, Holyoke T, Apperley JF, Nacheva EP. Genomic profile of chronic myelogenous leukemia: Imbalances associated with disease progression. Genes Chromosomes Cancer. 2007; 46:1039-1050.
20. Mullighan CG, Su X, Zhang J, Radtke I, Phillips LA, Miller CB, Ma J, Liu W, Cheng C, Schulman BA, Harvey RC, Chen IM, Clifford RJ, et al. Deletion of IKZF1 and prognosis in acute lymphoblastic leukemia. N Engl J Med. 2009; 360:470-480.
21. Wang Y, Zhang J, Chen X, Jiang W, Wang S, Xu L, Tu Y, Zheng P, Wang Y, Lin X, Chen H. Profiling of Oral Microbiota in Early Childhood Caries Using Single-Molecule Real-Time Sequencing. Front Microbiol. 2017; 8:2244.
22. Tsiftsoglou AS, Vizirianakis IS, Strouboulis J. Erythropoiesis: model systems, molecular regulators, and developmental programs. IUBMB Life. 2009; 61:800-830.
23. Heller G, Topakian T, Altenberger C, Cerny-Reiterer S, Herndlhofer S, Ziegler B, Datlinger P, Byrgazov K, Bock C, Mannhalter C, Hormann G, Sperr WR, Lion T, et al. Next-generation sequencing identifies major DNA methylation changes during progression of Ph+ chronic myeloid leukemia. Leukemia. 2016; 30:1861-1868.
24. Grigorieva DV, Gorudko IV, Sokolov AV, Kostevich VA, Vasilyev VB, Cherenkevich SN, Panasenko OM. Myeloperoxidase Stimulates Neutrophil Degranulation. Bull Exp Biol Med. 2016; 161:495-500.
25. Pascreau G, Eckerdt F, Lewellyn AL, Prigent C, Maller JL. Phosphorylation of p53 is regulated by TPX2-Aurora A in xenopus oocytes. J Biol Chem. 2009; 284:5497-5505.
26. Wu L, Ma CA, Zhao Y, Jain A. Aurora B interacts with NIR-p53, leading to p53 phosphorylation in its DNA-binding domain and subsequent functional suppression. J Biol Chem. 2011; 286:2236-2244.
27. Li S. Src-family kinases in the development and therapy of Philadelphia chromosome-positive chronic myeloid leukemia and acute lymphoblastic leukemia. Leuk Lymphoma. 2008; 49:19-26.
28. Loughna S, Sato TN. Angiopoietin and Tie signaling pathways in vascular development. Matrix Biol. 2001; 20:319-325.
29. Kominsky DJ, Klawitter J, Brown JL, Boros LG, Melo JV, Eckhardt SG, Serkova NJ. Abnormalities in glucose uptake and metabolism in imatinib-resistant human BCR-ABL-positive cells. Clin Cancer Res. 2009; 15:3442-3450.
30. Xiao M, Jia S, Wang H, Wang J, Huang Y, Li Z. Overexpression of LAPTM4B: an independent prognostic marker in breast cancer. J Cancer Res Clin Oncol. 2013; 139:661-667.
31. Li Y, Zou L, Li Q, Haibe-Kains B, Tian R, Li Y, Desmedt C, Sotiriou C, Szallasi Z, Iglehart JD, Richardson AL, Wang ZC. Amplification of LAPTM4B and YWHAZ contributes to chemotherapy resistance and recurrence of breast cancer. Nat Med. 2010; 16:214-218.
32. Meng Y, Wang L, Chen D, Chang Y, Zhang M, Xu JJ, Zhou R, Zhang QY. LAPTM4B: an oncogene in various solid tumors and its functions. Oncogene. 2016; 35:6359-6365.
33. Tan X, Lambert PF, Rapraeger AC, Anderson RA. Stress-Induced EGFR Trafficking: Mechanisms, Functions, and Therapeutic Implications. Trends Cell Biol. 2016; 26:352-366.
34. Capouillez A, Decaestecker C, Filleul O, Chevalier D, Coppee F, Leroy X, Belayew A, Saussez S. Helicase-like transcription factor exhibits increased expression and altered intracellular distribution during tumor progression in hypopharyngeal and laryngeal squamous cell carcinomas. Virchows Arch. 2008; 453:491-499.
35. Capouillez A, Noel JC, Arafa M, Arcolia V, Mouallif M, Guenin S, Delvenne P, Belayew A, Saussez S. Expression of the helicase-like transcription factor and its variants during carcinogenesis of the uterine cervix: implications for tumour progression. Histopathology. 2011; 58:984-988.
36. Cipolla L, Maffia A, Bertoletti F, Sabbioneda S. The Regulation of DNA Damage Tolerance by Ubiquitin and Ubiquitin-Like Modifiers. Front Genet. 2016; 7:105.
37. Piao S, Ojha R, Rebecca VW, Samanta A, Ma XH, McAfee Q, Nicastri MC, Buckley M, Brown E, Winkler JD, Gimotty PA, Amaravadi RK. ALDH1A1 and HLTF modulate the activity of lysosomal autophagy inhibitors in cancer cells. Autophagy. 2017; 13:2056-2071.
38. Bizet AA, Liu K, Tran-Khanh N, Saksena A, Vorstenbosch J, Finnson KW, Buschmann MD, Philip A. The TGF-beta co-receptor, CD109, promotes internalization and degradation of TGF-beta receptors. Biochim Biophys Acta. 2011; 1813:742-753.
39. Riihila PM, Nissinen LM, Ala-Aho R, Kallajoki M, Grenman R, Meri S, Peltonen S, Peltonen J, Kahari VM. Complement factor H: a biomarker for progression of cutaneous squamous cell carcinoma. J Invest Dermatol. 2014; 134:498-506.
40. Parente R, Clark SJ, Inforzato A, Day AJ. Complement factor H in host defense and immune evasion. Cell Mol Life Sci. 2017; 74:1605-1624.
41. Seol HS, Lee SE, Song JS, Rhee JK, Singh SR, Chang S, Jang SJ. Complement proteins C7 and CFH control the stemness of liver cancer cells via LSF-1. Cancer Lett. 2016; 372:24-35.
42. Hoffmann TJ, Kvale MN, Hesselson SE, Zhan Y, Aquino C, Cao Y, Cawley S, Chung E, Connell S, Eshragh J, Ewing M, Gollub J, Henderson M, et al. Next generation genome-wide association tool: design and coverage of a high-throughput European-optimized SNP array. Genomics. 2011; 98:79-89.
43. Hoffmann TJ, Zhan Y, Kvale MN, Hesselson SE, Gollub J, Iribarren C, Lu Y, Mei G, Purdy MM, Quesenberry C, Rowell S, Shapero MH, Smethurst D, et al. Design and coverage of high throughput genotyping arrays optimized for individuals of East Asian, African American, and Latino race/ethnicity using imputation and a novel hybrid SNP selection algorithm. Genomics. 2011; 98:422-430.
44. Cipriano R, Graham J, Miskimen KL, Bryson BL, Bruntz RC, Scott SA, Brown HA, Stark GR, Jackson MW. FAM83B mediates EGFR- and RAS-driven oncogenic transformation. J Clin Invest. 2012; 122:3197-3210.
45. Cipriano R, Miskimen KL, Bryson BL, Foy CR, Bartel CA, Jackson MW. FAM83B-mediated activation of PI3K/AKT and MAPK signaling cooperates to promote epithelial cell transformation and resistance to targeted therapies. Oncotarget. 2013; 4:729-738. https://doi.org/10.18632/oncotarget.1027.
46. Cipriano R, Bryson BL, Miskimen KL, Bartel CA, Hernandez-Sanchez W, Bruntz RC, Scott SA, Lindsley CW, Brown HA, Jackson MW. Hyperactivation of EGFR and downstream effector phospholipase D1 by oncogenic FAM83B. Oncogene. 2014; 33:3298-3306.
47. Gerhard DS, Wagner L, Feingold EA, Shenmen CM, Grouse LH, Schuler G, Klein SL, Old S, Rasooly R, Good P, Guyer M, Peck AM, Derge JG, et al. The status, quality, and expansion of the NIH full-length cDNA project: the Mammalian Gene Collection (MGC). Genome Res. 2004; 14:2121-2127.
48. Grant S. FAM83A and FAM83B: candidate oncogenes and TKI resistance mediators. J Clin Invest. 2012; 122:3048-3051.
49. Suknuntha K, Ishii Y, Tao L, Hu K, McIntosh BE, Yang D, Swanson S, Stewart R, Wang JYJ, Thomson J, Slukvin I. Discovery of survival factor for primitive chronic myeloid leukemia cells using induced pluripotent stem cells. Stem Cell Res. 2015; 15:678-693.
50. Baccarani M, Deininger MW, Rosti G, Hochhaus A, Soverini S, Apperley JF, Cervantes F, Clark RE, Cortes JE, Guilhot F, Hjorth-Hansen H, Hughes TP, Kantarjian HM, et al. European LeukemiaNet recommendations for the management of chronic myeloid leukemia: 2013. Blood. 2013; 122:872-884.
51. Singh N, Sahu DK, Goel M, Kant R, Gupta DK. Retrospective analysis of FFPE based Wilms' Tumor samples through copy number and somatic mutation related Molecular Inversion Probe Based Array. Gene. 2015; 565:295-308.
52. Singh N, Sahu DK, Mishra A, Agarwal P, Goel MM, Chandra A, Singh SK, Srivastava C, Ojha BK, Gupta DK, Kant R. Multiomics approach showing genome-wide copy number alterations and differential gene expression in different types of North-Indian pediatric brain tumors. Gene. 2016; 576:734-742.