
INTRODUCTION
Renal cell carcinoma (RCC) is the most common kidney-associated neoplasm. Among them, clear cell RCC is the most frequent type, accounting for 70-80% of cases [1]. RCC constitutes 2-3% of human cancers, and the proportion is increasing. Worldwide, more than 350,000 people were diagnosed with RCC and 140,000 people died in 2013 [2]. Treatment for localized RCC is mainly surgical resection, which has a good prognosis, however, the prognosis for metastatic RCC at diagnosis remains poor. Treatments for RCC have grown more sophisticated. For example, since 2000, molecularly targeted therapies have focused on inhibition of angiogenesis, and more recently anti-PD-1 antibodies have been used to activate tumor immunity. However, the therapeutic outcomes fall short, and the 5-year survival of advanced RCC is still around 20% [3, 4]. Thus, discovery of new molecular targets and new treatment strategies for RCC are urgently required.
MicroRNA (miRNA) is a type of small non-coding RNA. It fine tunes expression of RNA transcripts (both protein coding and non-protein coding genes) in a sequence-dependent manner [5]. A single miRNA can control a vast number of RNA transcripts in normal and diseased cells [6]. Therefore, aberrantly expressed miRNAs can break down regulated RNA networks and contribute to cancer cells’ development, metastasis and drug resistance [7].
The traditional description of miRNA function indicates that 1 strand of the miRNA duplex is incorporated into the RNA-induced silencing complex (RISC), becoming the active strand (guide strand), whereas the other strand is degraded and has no function (passenger strand or miRNA*) [8]. However, more recent studies of miRNA biogenesis have shown that some miRNA passenger strands are functional in plant and human cells [9]. Analyses of our original miRNA expression signatures by RNA-sequencing revealed that some passenger strands of miRNAs were significantly downregulated in several types of cancers. Based on our signatures, we have found that some passenger strands target oncogenic genes e.g., miR-144-5p, miR-145-3p, miR-149-3p, miR-150-3p and miR-199a/b-3p [10-16].
In this study, we focused on both miR-455-5p (the passenger strand) and miR-455-3p (the guide strand) that derived from miR-455 duplex based on miRNA expression signatures of human cancers [17]. Interestingly, low expression of these miRNAs was significantly associated with poor prognosis of patients with RCC (miR-455-5p: p = 0.00204 and miR-455-3p: p = 0.0254) based on cohort data in The Cancer Genome Atlas (TCGA). Here, we investigated the anti-tumor roles of these miRNAs and their respective targeted oncogenic genes in RCC pathogenesis. Our present data showed that both miR-455-5p and miR-455-3p acted as anti-tumor miRNAs in RCC cells. To identify targeted oncogenes in RCC cells, we studied 27 genes, 15 of which were regulated by miR-455-5p and 12 by miR-455-3p. We found that they were significantly associated with poor prognosis by TCGA analyses.
The involvement of miRNA passenger strands in cancer pathogenesis is a novel concept in studies of miRNA biogenesis and cancer research. Identification of the function of passenger strands will enhance our understanding of the molecular pathways underlying RCC pathogenesis.
RESULTS
Expression levels of miR-455-5p and miR-455-3p in RCC clinical specimens
The public miRNA database (miRbase: release 21) revealed that miR-455 is located on chromosome 9q32 and the mature sequence of miR-455-5p (passenger strand) was 5’ – uaugugccuuuggacuacaucg – 3’ and that of miR-455-3p (guide strand) was 5’ - gcaguccaugggcauauacac – 3’. We investigated the expression of miR-455-5p and miR-455-3p in clinical RCC tissues (paired cancerous and adjacent non-cancerous tissues). Expression levels of miR-455-5p and miR-455-3p were significantly downregulated in RCC tissues compared with those in noncancerous tissues (p = 0.0014; Figure 1A and p = 0.0227; Figure 1B). Furthermore, Spearman's rank test showed a positive correlation between expression levels of miR-455-5p and miR-455-3p (p = 0.0056, R = 0.515; Figure 1C). To investigate the molecular mechanisms of silencing of miR-455-5p and miR-455-3p in RCC cells, A498 cells were treated with the demethylating agent [5-aza-2’-deoxycytidine (5-aza-dC)]. Expression of miR-455-5p and miR-455-3p were not dramatically elevated by 5-aza-dc treatment (data not shown).
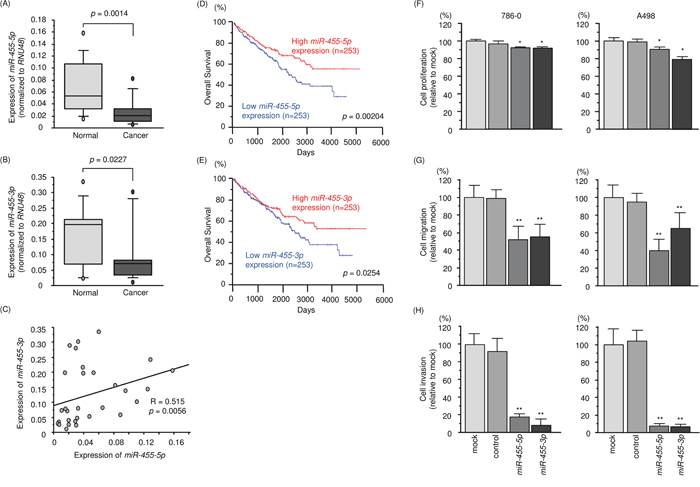
Figure 1: Expression level, clinical significance and anti-tumor function of miR-455-5p and miR-455-3p in RCC. (A, B) Expression levels of miR-455-5p and miR-455-3p in RCC clinical specimens. RNU48 was used as an internal control. (C) Spearman's rank test showed a positive correlation between the expression of miR-455-5p and miR-455-3p. (D, E) Low expression levels of miR-455-5p and miR-455-3p were associated with low overall survival (p = 0.00204 and p = 0.0254, respectively). (F) Cell proliferation was determined by XTT assays 72 h after transfection with miR-455-5p and miR-455-3p. (G) Cell migration was determined using wound-healing assays. (H) Cell invasion activity was determined using Matrigel assays. *, p < 0.01. **, p < 0.0001.
A large cohort analysis (n = 506) based on the TCGA database showed that low expression levels of miR-455-5p and miR-455-3p were associated with poor survivals in RCC patients (p = 0.00204 and p = 0.0254; Figure 1D and 1E, respectively).
Effects of ectopic expression of miR-455-5p and miR-455-3p on RCC cells
We performed gain-of-function studies by miRNAs transfection into 786-O and A498 cells. XTT assays revealed that cell proliferation was significantly inhibited in miR-455-5p and miR-455-3p transfectants compared with that in mock or control transfectants (Figure 1F). Cell migration activity was significantly inhibited in miR-455-5p and miR-455-3p transfectants in comparison with those in mock or control transfectants (Figure 1G). Likewise, Matrigel assays showed that cell invasion activity was significantly inhibited in miR-455-5p and miR-455-3p transfectants compared to those in mock or control transfectants (Figure 1H). We further investigated synergistic effects of miR-455-5p and miR-455-3p expression in RCC cells. As a result, synergistic effects were not identified in this study (Supplementary Figures 1).
Incorporation of miR-455-5p into the RISC in RCC cells
We proposed that passenger strand miR-455-5p may be incorporated into the RNA-induced silencing complex (RISC) and thereby have a role in regulating gene activities in cancer cells. To investigate that hypothesis, we performed immunoprecipitation with antibodies targeting Argonaute2 (Ago2), which plays an important role in the RISC. After transfection with miR-455-5p or miR-455-3p, Ago2-bound miRNAs were isolated, and we performed qRT-PCR to determine whether miR-455-5p and miR-455-3p were bound to Ago2. After transfection with miR-455-5p and immunoprecipitation by anti-Ago2 antibodies, miR-455-5p levels were significantly higher than those of mock- or miR-control-transfected cells and those of miR-455-3p-transfected 786-O cells (Supplementary Figure 2A). Likewise, after miR-455-3p transfection, miR-455-3p was detected by Ago2 immunoprecipitation (Supplementary Figure 2B).
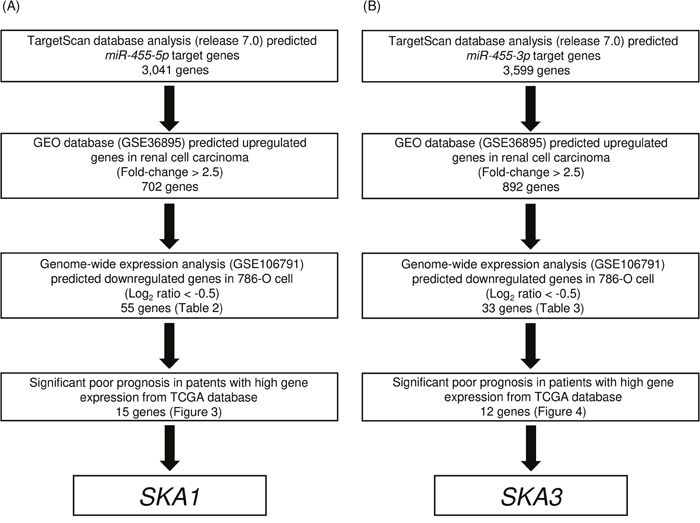
Figure 2: Flow chart illustrating the analytic strategy for identifying miR-455-5p and miR-455-3p targets in RCC cells. A total of 3,041 and 3,599 genes were putative target genes of miR-455-5p and miR-455-3p in TargetScan database analysis (release 7.0). Of those groups, 15 and 12 genes were identified as putative target genes of miR-455-5p and miR-455-3p in RCC cells, respectively.
Searching for putative targets regulated by miR-455-5p and miR-455-3p in RCC cells
We performed both in silico and gene expression analysis to identify genes targeted by miR-455-5p and miR-455-3p for regulation. The strategy for identification of miR-455-5p and miR-455-3p target genes is shown in Figure 2A and 2B. First, we identified 3,041 and 3,559 genes that had putative target sites for miR-455-5p and miR-455-3p in their 3′-UTR according to the TargetScanHuman 7.0 database. Next, we narrowed down those groups to 702 and 892 genes whose expression levels were upregulated (Fold-change > 2.5) in RCC cells using a GEO database (accession number: GSE36895). Next, we identified 55 and 33 genes that were downregulated after miR-455-5p and miR-455-3p were transfected into 786-O cell (Log2 ratio < −0.5; Tables 1 and 2).
Table 1: Putative target genes regulated by miR-455-5p in RCC cells
Gene Symbol |
Gene Name |
Conserved sites count |
Poorly conserved sites count |
GEO expression data |
786-O miR-455-5p transfection (Log2 ratio) |
Cytoband |
TCGA data OS (p value) |
|---|---|---|---|---|---|---|---|
BIRC5 |
baculoviral IAP repeat containing 5 |
0 |
1 |
2.728 |
-0.888 |
hs|18q11.2 |
2.93E-09 |
SKA1 |
spindle and kinetochore associated complex subunit 1 |
0 |
1 |
3.751 |
-0.836 |
hs|20p11.23 |
1.44E-07 |
CDCA8 |
cell division cycle associated 8 |
0 |
1 |
3.071 |
-0.547 |
hs|17q23.2 |
2.93E-06 |
CENPF |
centromere protein F, 350/400kDa |
0 |
1 |
2.699 |
-0.905 |
hs|9p13.3 |
7.01E-05 |
DEPDC1 |
DEP domain containing 1 |
0 |
2 |
2.606 |
-1.076 |
hs|9q34.11 |
0.000111 |
ELOVL2 |
ELOVL fatty acid elongase 2 |
0 |
1 |
3.11 |
-0.72 |
hs|12p13.1 |
0.000146 |
TNFSF4 |
tumor necrosis factor (ligand) superfamily, member 4 |
0 |
1 |
2.65 |
-0.948 |
hs|17q25.3 |
0.000257 |
CD72 |
CD72 molecule |
0 |
1 |
3.643 |
-1.117 |
hs|17q21.2 |
0.000668 |
KIAA0101 |
KIAA0101 |
0 |
2 |
3.358 |
-0.629 |
hs|16p13.3 |
0.00258 |
PLEKHG4 |
pleckstrin homology domain containing, family G (with RhoGef domain) member 4 |
0 |
1 |
2.743 |
-0.716 |
hs|12q24.23 |
0.00298 |
TNIP3 |
TNFAIP3 interacting protein 3 |
0 |
1 |
4.313 |
-1.142 |
hs|11q12.1 |
0.00339 |
FOXL1 |
forkhead box L1 |
0 |
1 |
2.987 |
-2.048 |
hs|19q13.41 |
0.0129 |
SLC7A11 |
solute carrier family 7 (anionic amino acid transporter light chain, xc- system), member 11 |
0 |
2 |
2.677 |
-1.518 |
hs|12q23.2 |
0.0234 |
SIRPA |
signal-regulatory protein alpha |
0 |
1 |
2.737 |
-1.484 |
hs|17p11.2 |
0.0349 |
VCAN |
versican |
1 |
1 |
5.753 |
-0.865 |
hs|22q13.31 |
0.0467 |
IL21R |
interleukin 21 receptor |
0 |
1 |
3.377 |
-1.068 |
hs|2q11.2 |
n.s. |
HLA-DPB1 |
major histocompatibility complex, class II, DP beta 1 |
0 |
1 |
2.781 |
-0.81 |
hs|5q31.1 |
n.s. |
LAYN |
layilin |
1 |
1 |
2.575 |
-1.356 |
hs|17p11.2 |
n.s. |
IKZF1 |
IKAROS family zinc finger 1 (Ikaros) |
0 |
1 |
2.548 |
-0.519 |
hs|6p21.1 |
n.s. |
SLC38A1 |
solute carrier family 38, member 1 |
0 |
1 |
3.365 |
-1.049 |
hs|12q13.11 |
n.s. |
BRIP1 |
BRCA1 interacting protein C-terminal helicase 1 |
0 |
1 |
2.71 |
-0.519 |
hs|22q11.21 |
n.s. |
GJC1 |
gap junction protein, gamma 1, 45kDa |
1 |
0 |
5.978 |
-0.895 |
hs|19q13.2 |
n.s. |
IGFBP3 |
insulin-like growth factor binding protein 3 |
0 |
1 |
11.356 |
-2.607 |
hs|12q13.11 |
n.s. |
LOX |
lysyl oxidase |
0 |
2 |
9.982 |
-1.551 |
hs|15q26.3 |
n.s. |
EHD2 |
EH-domain containing 2 |
0 |
1 |
9.206 |
-2.008 |
hs|22q13.1 |
n.s. |
DIRAS2 |
DIRAS family, GTP-binding RAS-like 2 |
0 |
1 |
6.202 |
-1.342 |
hs|11q25 |
n.s. |
LRRC25 |
leucine rich repeat containing 25 |
0 |
1 |
6.156 |
-0.685 |
hs|11q23.3 |
n.s. |
RASSF2 |
Ras association (RalGDS/AF-6) domain family member 2 |
0 |
1 |
6.146 |
-1.364 |
hs|Xq28 |
n.s. |
GAS2L3 |
growth arrest-specific 2 like 3 |
0 |
1 |
5.641 |
-0.73 |
hs|17q12 |
n.s. |
EGFR |
epidermal growth factor receptor |
0 |
1 |
4.5 |
-1.689 |
hs|19q13.2 |
n.s. |
KRBA1 |
KRAB-A domain containing 1 |
0 |
2 |
4.421 |
-1.144 |
hs|2p23.3 |
n.s. |
SLC1A3 |
solute carrier family 1 (glial high affinity glutamate transporter), member 3 |
0 |
1 |
4.302 |
-0.645 |
hs|22q13.33 |
n.s. |
TLR3 |
toll-like receptor 3 |
0 |
1 |
4.139 |
-2.606 |
hs|5q14.3 |
n.s. |
MS4A7 |
membrane-spanning 4-domains, subfamily A, member 7 |
0 |
1 |
4.088 |
-0.619 |
hs|19p13.11 |
n.s. |
PTGS1 |
prostaglandin-endoperoxide synthase 1 (prostaglandin G/H synthase and cyclooxygenase) |
0 |
1 |
4.043 |
-2.257 |
hs|12q23.3 |
n.s. |
FAM111B |
family with sequence similarity 111, member B |
0 |
1 |
3.986 |
-0.996 |
hs|17q21.32 |
n.s. |
APOLD1 |
apolipoprotein L domain containing 1 |
0 |
1 |
3.953 |
-1.385 |
hs|6p21.1 |
n.s. |
CDHR1 |
cadherin-related family member 1 |
0 |
1 |
3.727 |
-0.574 |
hs|7p12.2 |
n.s. |
PHKA2 |
phosphorylase kinase, alpha 2 (liver) |
0 |
1 |
3.661 |
-0.955 |
hs|15q15.1 |
n.s. |
LRRK1 |
leucine-rich repeat kinase 1 |
0 |
1 |
3.558 |
-0.654 |
hs|7q36.3 |
n.s. |
PGBD5 |
piggyBac transposable element derived 5 |
0 |
1 |
3.516 |
-1.466 |
hs|6p24.2 |
n.s. |
LCK |
LCK proto-oncogene, Src family tyrosine kinase |
0 |
1 |
3.269 |
-1.235 |
hs|5p13.2 |
n.s. |
HS3ST2 |
heparan sulfate (glucosamine) 3-O-sulfotransferase 2 |
0 |
1 |
2.985 |
-1.116 |
hs|1q21.3 |
n.s. |
NEURL1B |
neuralized E3 ubiquitin protein ligase 1B |
0 |
1 |
2.906 |
-1.008 |
hs|17q21.32 |
n.s. |
COL8A1 |
collagen, type VIII, alpha 1 |
0 |
1 |
2.88 |
-1.102 |
hs|2p22.2 |
n.s. |
DIAPH2 |
diaphanous-related formin 2 |
0 |
1 |
2.872 |
-0.653 |
hs|9p13.3 |
n.s. |
GJA1 |
gap junction protein, alpha 1, 43kDa |
0 |
1 |
2.797 |
-0.658 |
hs|12q23.2 |
n.s. |
LCP1 |
lymphocyte cytosolic protein 1 (L-plastin) |
0 |
1 |
2.773 |
-2.022 |
hs|2p16.2 |
n.s. |
CMPK2 |
cytidine monophosphate (UMP-CMP) kinase 2, mitochondrial |
0 |
1 |
2.747 |
-0.963 |
hs|5q31.1 |
n.s. |
TRPV2 |
transient receptor potential cation channel, subfamily V, member 2 |
0 |
4 |
2.701 |
-0.644 |
hs|11q12.1 |
n.s. |
GRAMD4 |
GRAM domain containing 4 |
0 |
1 |
2.684 |
-0.921 |
hs|3q13.12 |
n.s. |
SEMA6A |
sema domain, transmembrane domain (TM), and cytoplasmic domain, (semaphorin) 6A |
0 |
2 |
2.61 |
-1.354 |
hs|3p21.31 |
n.s. |
EDN1 |
endothelin 1 |
0 |
1 |
2.598 |
-0.774 |
hs|1p34.3 |
n.s. |
TMEM140 |
transmembrane protein 140 |
0 |
1 |
2.558 |
-0.801 |
hs|5q35.3 |
n.s. |
LRP4 |
low density lipoprotein receptor-related protein 4 |
0 |
1 |
2.525 |
-0.96 |
hs|6q22.31 |
n.s. |
n.s., not significant.
Table 2: Putative target genes regulated by miR-455-3p in RCC cells
Gene Symbol |
Gene Name |
Conserved sites count |
Poorly conserved sites count |
GEO expression data |
786-O miR-455-3p transfection (Log2 ratio) |
Cytoband |
TCGA data OS (p value) |
|---|---|---|---|---|---|---|---|
TRIM36 |
tripartite motif containing 36 |
0 |
2 |
2.822 |
-1.084 |
hs|5q22.3 |
1.66E-06 |
FXYD5 |
FXYD domain containing ion transport regulator 5 |
0 |
1 |
4.276 |
-1.377 |
hs|19q13.12 |
3.60E-06 |
CENPF |
centromere protein F, 350/400kDa |
0 |
1 |
2.699 |
-0.652 |
hs|1q41 |
7.01E-05 |
NCAPG |
non-SMC condensin I complex, subunit G |
0 |
1 |
2.746 |
-0.977 |
hs|4p15.31 |
7.27E-05 |
PARVG |
parvin, gamma |
0 |
1 |
3.403 |
-2.019 |
hs|22q13.31 |
0.000548 |
SKA3 |
spindle and kinetochore associated complex subunit 3 |
0 |
1 |
2.597 |
-0.756 |
hs|13q12.11 |
0.000596 |
ISG20 |
interferon stimulated exonuclease gene 20kDa |
0 |
1 |
5.168 |
-0.719 |
hs|15q26.1 |
0.0014 |
PAQR4 |
progestin and adipoQ receptor family member IV |
0 |
1 |
5.134 |
-1.213 |
hs|16p13.3 |
0.00152 |
COL5A1 |
collagen, type V, alpha 1 |
0 |
1 |
3.025 |
-0.547 |
hs|9q34.3 |
0.00164 |
PLXDC1 |
plexin domain containing 1 |
0 |
2 |
3.144 |
-1.3 |
hs|17q12 |
0.00186 |
PRR7 |
proline rich 7 (synaptic) |
0 |
1 |
2.503 |
-0.737 |
hs|5q35.3 |
0.00307 |
C10orf10 |
chromosome 10 open reading frame 10 |
0 |
1 |
3.95 |
-0.59 |
hs|10q11.21 |
0.0456 |
PFKP |
phosphofructokinase, platelet |
0 |
1 |
5.385 |
-0.511 |
hs|10p15.2 |
n.s. |
HK2 |
hexokinase 2 |
0 |
1 |
26.667 |
-0.864 |
hs|2p12 |
n.s. |
GRIK3 |
glutamate receptor, ionotropic, kainate 3 |
1 |
0 |
6.25 |
-0.818 |
hs|1p34.3 |
n.s. |
HSPG2 |
heparan sulfate proteoglycan 2 |
0 |
1 |
5.466 |
-0.572 |
hs|1p36.12 |
n.s. |
ARL11 |
ADP-ribosylation factor-like 11 |
0 |
1 |
5.283 |
-0.813 |
hs|13q14.2 |
n.s. |
CXorf36 |
chromosome X open reading frame 36 |
0 |
2 |
4.975 |
-1.576 |
hs|Xp11.3 |
n.s. |
FAM57A |
family with sequence similarity 57, member A |
0 |
1 |
4.89 |
-0.662 |
hs|17p13.3 |
n.s. |
FUT11 |
fucosyltransferase 11 (alpha (1,3) fucosyltransferase) |
0 |
1 |
4.124 |
-1.519 |
hs|10q22.2 |
n.s. |
DDIT4 |
DNA-damage-inducible transcript 4 |
0 |
1 |
3.996 |
-0.561 |
hs|10q22.1 |
n.s. |
PPP1R9B |
protein phosphatase 1, regulatory subunit 9B |
1 |
0 |
3.801 |
-0.523 |
hs|17q21.33 |
n.s. |
TRIM9 |
tripartite motif containing 9 |
0 |
1 |
3.763 |
-0.878 |
hs|14q22.1 |
n.s. |
DCLK1 |
doublecortin-like kinase 1 |
0 |
1 |
3.633 |
-1.087 |
hs|13q13.3 |
n.s. |
CSF1R |
colony stimulating factor 1 receptor |
0 |
1 |
3.418 |
-0.88 |
hs|5q32 |
n.s. |
KCNE4 |
potassium voltage-gated channel, Isk-related family, member 4 |
0 |
1 |
3.368 |
-0.867 |
hs|2q36.1 |
n.s. |
GPR20 |
G protein-coupled receptor 20 |
0 |
1 |
3.196 |
-1.272 |
hs|8q24.3 |
n.s. |
GPR85 |
G protein-coupled receptor 85 |
0 |
3 |
2.918 |
-0.608 |
hs|7q31.1 |
n.s. |
ADAMTS2 |
ADAM metallopeptidase with thrombospondin type 1 motif, 2 |
0 |
1 |
2.862 |
-0.679 |
hs|5q35.3 |
n.s. |
HLA-DPB1 |
major histocompatibility complex, class II, DP beta 1 |
0 |
1 |
2.781 |
-1.046 |
hs|6p21.32 |
n.s. |
BRIP1 |
BRCA1 interacting protein C-terminal helicase 1 |
0 |
1 |
2.71 |
-0.996 |
hs|17q23.2 |
n.s. |
PIK3R5 |
phosphoinositide-3-kinase, regulatory subunit 5 |
0 |
1 |
2.623 |
-0.594 |
hs|17p13.1 |
n.s. |
IKZF1 |
IKAROS family zinc finger 1 (Ikaros) |
0 |
2 |
2.548 |
-0.655 |
hs|7p12.2 |
n.s. |
n.s., not significant.
We selected 15 and 12 genes whose high expression levels were associated (p < 0.05) with low overall survivals of RCC patients according to the OncoLnc database. Kaplan-Meier survival curves showed that high expression levels of 15 and 12 genes were associated with poor prognosis in RCC patients (Figures 3 and 4, respectively). Moreover, we analyzed whether these gene sets (Tables 1 and 2) would be prognostic markers for patients with RCC. Our results showed that expression status of these gene sets were effective as prognostic markers for patients with RCC (Supplementary Figure 3). Patients with high gene signature expressions were significantly associated with short DFS and OS than those with low gene signature expressions (p < 0.0001, Supplementary Figures 3A-2, 3A-3, 3B-2 and 3B-3). These findings showed that miR-455-5p and miR-455-3p regulated molecular networks were deeply involved in RCC pathogenesis and may be therapeutic targets of RCC. Genomics Analysis and Visualization Platform were used for visualization of gene expression heatmaps (http://r2.amc.nl) [18]. The normalized mRNA expression values in the RNA sequencing data were processed and provided as Z-scores.
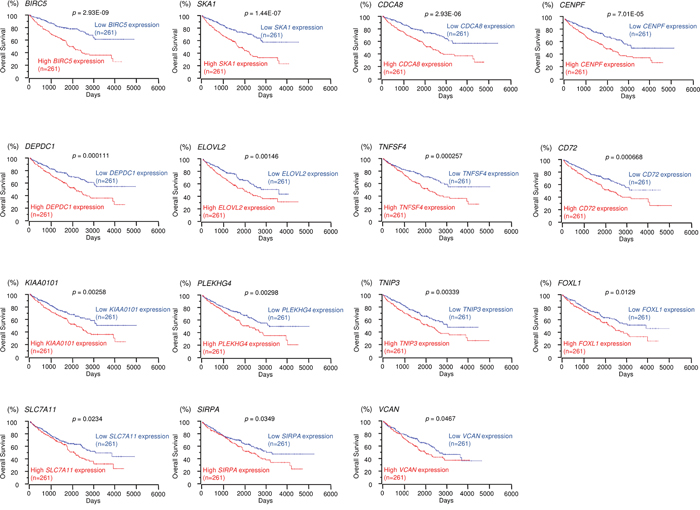
Figure 3: TCGA database analysis of putative targets of miR-455-5p in RCC. Kaplan-Meier plots of overall survival with log-rank tests for 15 genes with high and low expression from the TCGA database.
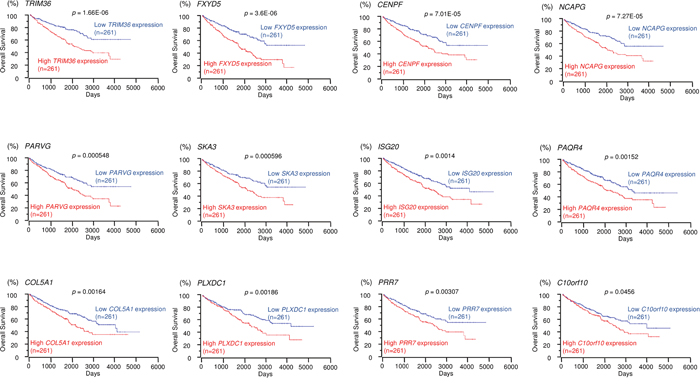
Figure 4: TCGA database analysis of putative targets of miR-455-3p in RCC. Kaplan-Meier plots of overall survival with log-rank tests for 12 genes with high and low expression from the TCGA database.
We focused on spindle and kinetochore-associated complex subunits 1 and 3 (SKA1 and SKA3) because we recently reported that regulation of SKA1 by anti-tumor miR-10a-5p was involved in RCC pathogenesis. Both SKA1 and SKA3 were pivotal candidate genes targeted by miR-455-5p and miR-455-3p, respectively, and we hypothesized that the SKA complex was closely involved in RCC pathogenesis and could be regulated by several anti-tumor miRNAs in RCC cells.
Direct regulation of SKA1 by miR-455-5p and SKA3 by miR-455-3p in RCC cells
Both mRNA and protein expression levels of SKA1/SKA1 were reduced by ectopic expression of miR-455-5p in 786-O and A498 cells (Figure 5A and 5B). The TargetScan database shows that the SKA1 gene has a single target site for miR-455-5p in its 3’-UTR region (Figure 5C). No target site for miR-455-3p was detected by the TargetScan database. Luminescence intensity was significantly reduced by co-transfection with miR-455-5p and the vector carrying the wild-type 3′-UTR of SKA1 (Figure 5D). Conversely, luminescence intensity was not reduced when the target site of miR-455-5p was deleted from the vectors (Figure 5D).
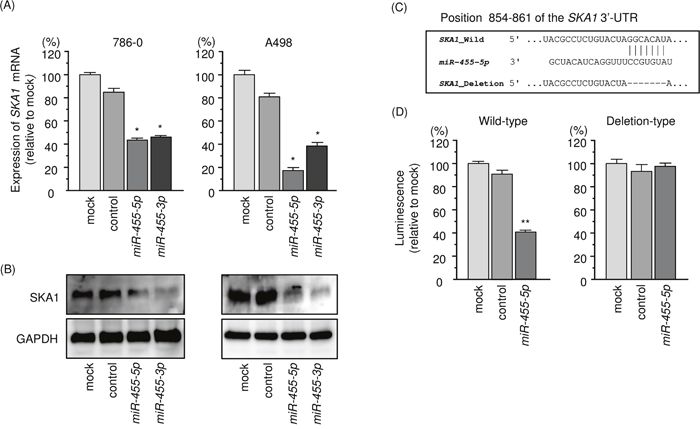
Figure 5: Regulation of SKA1 expression by miR-455-5p in RCC cells. (A) Expression levels of SKA1 mRNA 48 h after transfection of 10 nM miR-455-5p into cell lines. GUSB was used as an internal control. (B) Protein expression of SKA1 72 h after transfection of miR-455-5p. GAPDH was used as a loading control. (C) miR-455-5p binding sites in the 3′-UTR of SKA1 mRNA. (D) Dual luciferase reporter assays using vectors encoding putative miR-455-5p target sites (positions 854–861) in the SKA1 3′-UTR for both wild-type and deleted regions. Normalized data were calculated as the ratio of Renilla/firefly luciferase activities. *, p < 0.0001. **, p < 0.01.
In Figure 6A and 6B, the expression levels of SKA3/SKA3 were reduced by ectopic expression of miR-455-3p in 786-O and A498 cells. A single binding site for miR-455-3p is annotated by the TargetScan database in the 3’-UTR region of SKA3. However, no binding site for miR-455-5p was observed in the 3’-UTR region of SKA3 (Figure 6C). Luciferase reporter assays showed that luminescence intensity was significantly reduced by co-transfection with miR-455-3p and the vector carrying the wild-type 3′-UTR of SKA3 (Figure 6D).
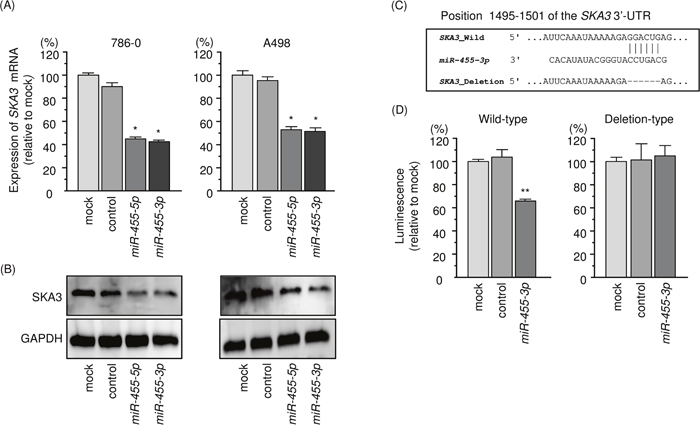
Figure 6: Regulation of SKA3 expression by miR-455-3p in RCC cells. (A) Expression levels of SKA3 mRNA 48 h after transfection of 10 nM miR-455-3p into cell lines. GUSB was used as an internal control. (B) Protein expression of SKA3 72 h after transfection with miR-455-3p. GAPDH was used as a loading control. (C) miR-455-3p binding sites in the 3′-UTR of SKA3 mRNA. (D) Dual luciferase reporter assays using vectors encoding putative miR-455-5p target sites (positions 1495–1501) in the SKA3 3′-UTR for both wild-type and deleted regions. Normalized data were calculated as the ratio of Renilla/firefly luciferase activities. *, p < 0.0001. **, p < 0.01.
Unexpectedly in these analyses, expression of SKA1/SKA1 was reduced by miR-455-3p restoration (Figure 5A and 5B). Likewise, expression of SKA3/SKA3 was affected by miR-455-5p restoration (Figure 6A and 6B). Based on these data, we proposed that the destruction of SKA1 affects SKA3, and the destruction of SKA3 affects SKA1. To verify this hypothesis, we conducted experiments using si-SKA1 and si-SKA3 in RCC cells. Our data showed that the expression levels of SKA1 were reduced by si-SKA3 transfection (Supplementary Figure 4A). Similarly, expression of SKA3 was reduced by si-SKA1 transfection (Supplementary Figure 4B). From this analysis it became clear that the expression of SKA1 and SKA3 mutually influenced each other.
SKA family consists of SKA1, SKA2 and SKA3. In addition, we investigated whether expression of SKA1 or SKA3 affected the expression of SKA2 in RCC cells. Furthermore, expression of SKA2 was reduced by si-SKA1 or si-SKA3 transfection (Supplementary Figure 4C and 4D).
Effects of silencing SKA3 in RCC cells
We performed loss-of-function experiments using si-SKA3 (si-SKA3_1 and si-SKA3_2) transfection into 786-O and A498 cells to investigate the functional significance of SKA3 in RCC cells. We demonstrated that the expression levels of SKA3 mRNA and SKA3 protein were significantly reduced in qRT-PCR and Western blotting analyses (Figure 7A and 7B). Furthermore, functional assays showed that si-SKA3 transfection significantly inhibited cell proliferation, migration, and invasion in comparison with mock- or si-control-transfected cells (Figure 7C-7E).
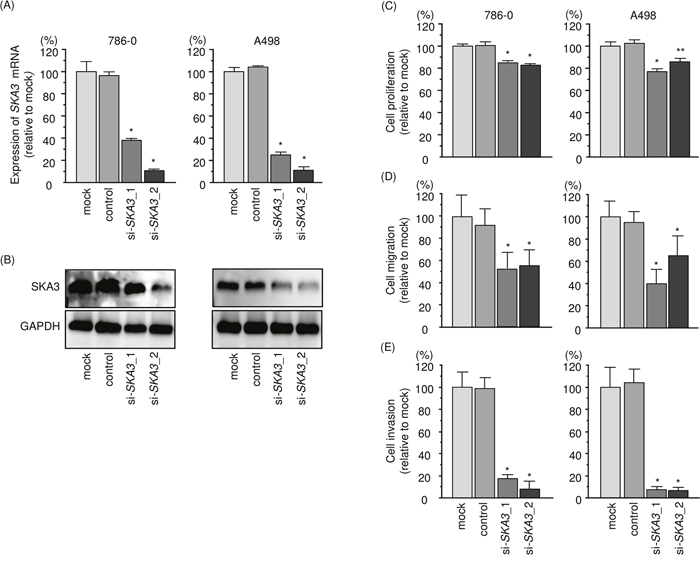
Figure 7: Effects of SKA3 silencing in RCC cell lines. (A) SKA3 mRNA expression 48 h after transfection with 10 nM si-SKA3 into RCC cell lines. GUSB was used as an internal control. (B) SKA3 protein expression 72 h after transfection with si-SKA3. GAPDH was used as a loading control. (C) Cell proliferation was determined with XTT assays 72 h after transfection of 10 nM si-SKA3_1 or si-SKA3_2. (D) Cell migration activity. (E) Cell invasion activity. *, p < 0.0001. **, p < 0.001.
Expression of SKA3 in RCC clinical tissues
A total of 15 pairs of RCC tissues plus adjacent noncancerous tissues and RCC cell lines were used to validate the mRNA expression level of SKA3 by qRT-PCR. Expression of SKA3 was significantly upregulated in RCC tissues compared with those in adjacent noncancerous tissues (p = 0.0253; Figure 8A). Furthermore, we performed immunohistochemistry with an RCC tissue microarray (cat. no. KD806; US Biomax, Rockville, MD, USA). Patient characteristics for samples used in the tissue microarray are described in http://www.biomax.us/tissue-arrays/Kidney/KD806. SKA3 protein was strongly expressed in several cancer lesions whereas it was rarely expressed in normal lesions (Figure 8B).
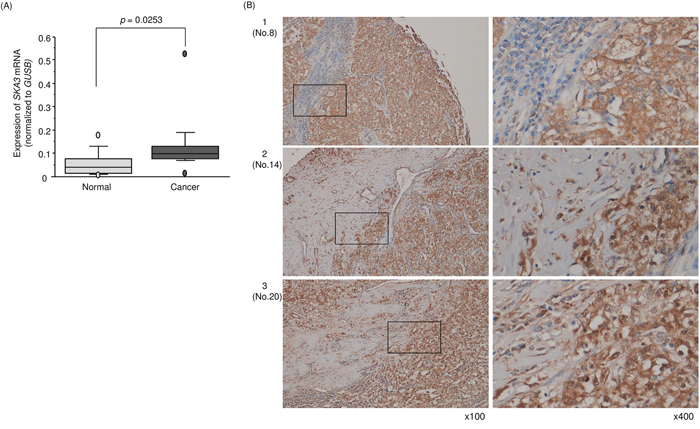
Figure 8: Expression of SKA3 in clinical specimens of RCC. (A) Expression levels of SKA3 in RCC clinical specimens. GUSB was used as an internal control. (B) Immunostaining showed that SKA3 was strongly expressed in several cancer lesions compared with normal lesions (100× and 400× magnification field).
Effects of co-transfection of SKA3 and miR-455-3p in RCC cells
We investigated SKA3 rescue studies in 786-O cells to elucidate whether the molecular pathway of SKA3/miR-455-3p was significant for RCC progression. SKA3 protein expression by Western blotting analysis is shown in Figure 9A. Functional assays showed that the proliferation, migration and invasive abilities of RCC cells were significantly recovered by SKA3 and miR-455-3p transfection compared with cells with restored miR-455-3p only (Figure 9B-9D). These results suggested that SKA3 had a pivotal role in RCC progression.
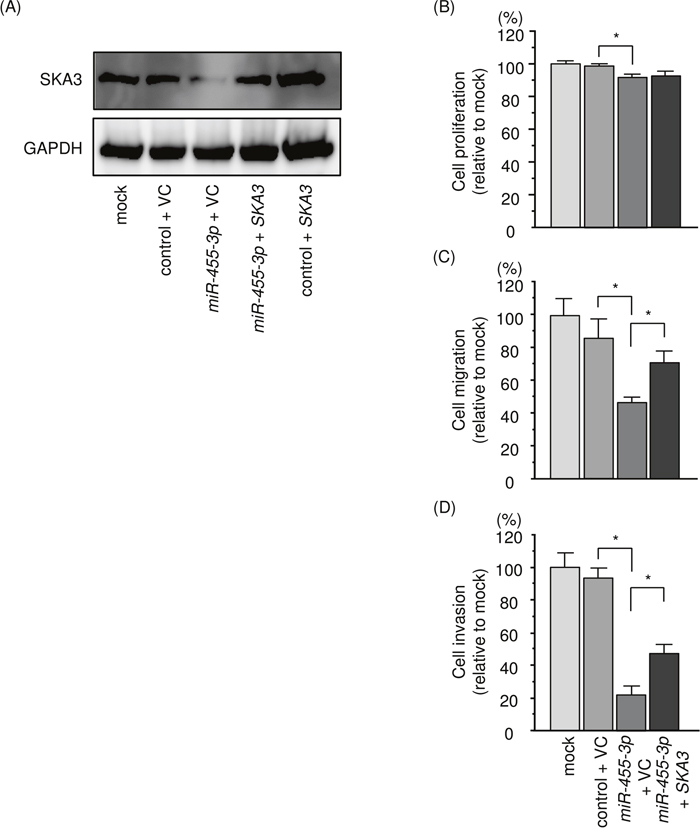
Figure 9: Effects of co-transfection of SKA3/miR-455-3p into 786-O cells. (A) SKA3 protein expression was evaluated by Western blotting analysis of 786-O cells 72 h after reverse transfection with miR-455-3p and 48 h after forward transfection with the SKA3 vector. GAPDH was used as a loading control. (B) Cell proliferation was determined using XTT assays 72 h after reverse transfection with miR-455-3p and 48 h after forward transfection with the SKA3 vector. (C) Cell migration activity was assessed by wound-healing assays 48 h after reverse transfection with miR-455-3p and 24 h after forward transfection with the SKA3 vector. (D) Cell invasion activity was characterized by invasion assays 48 h after reverse transfection with miR-455-3p and 24h after forward transfection with SKA3 vector. *, p < 0.0001.
Clinical significance of the SKA complex in RCC based on TCGA database
To validate the clinical significance of SKA complex subunits 1,2 and 3 in RCC pathogenesis, we asked whether the expression levels of SKA1, SKA2 and SKA3 were associated with the duration of disease-free survival (DFS) in RCC patients. As shown in Figure 10A, high expression levels of SKA1 and SKA3 were significantly associated with low DFS in RCC patients. Next, we analyzed the relationships among SKA1, SKA2 and SKA3 expression and disease stage and histological grade in RCC. SKA1 and SKA3 expression levels were significantly increased in the more advance tumor stage and histological grade (Figure 10B and 10C). We further investigated the clinical significance and expression status of miR-455-5p/SKA1 and miR-455-3p/SKA3 in the patients with RCC. Kaplan-Meier analyses showed that low expression of miR-455-5p/high expression of SKA1 group was significantly poor prognosis compared with high expression of miR-455-5p/low expression of SKA1 group by TCGA datasets (Supplementary Figure 5A). In a similar manner, low expression of miR-455-3p/high expression of SKA3 group was predicted poor prognosis compared with high expression of miR-455-3p/low expression of SKA3 group by TCGA datasets (Supplementary Figure 5B).
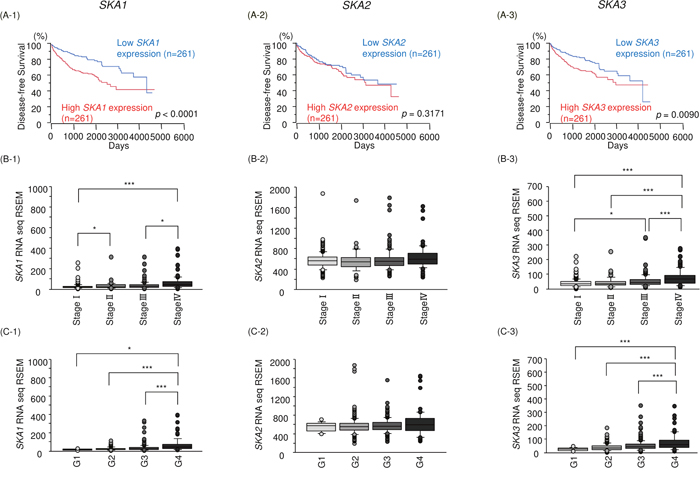
Figure 10: Relationships between expression levels of SKA1, SKA2 and SKA3 and disease-free survival, tumor stage and histological grade. All patients’ data were obtained from TCGA database. (A) Kaplan-Meier survival curves for disease-free survival based on SKA1, SKA2 and SKA3 expression in patients with RCC. (B, C) Relationships between expression levels of SKA1, SKA2 and SKA3 and disease stage and histological grade. *, p < 0.01. **, p < 0.001. ***, p < 0.0001.
We performed univariable and multivariable Cox hazard regression analysis to investigate the clinical significance of SKA1 and SKA3 expression together with other clinical factors for overall survival in RCC patients. After multivariate analysis, high SKA1 and SKA3 expression levels, age, tumor stage and histological grade were independent predictive factors for overall survival (hazard ration (HR) = 1.48, p = 0.0134, HR = 1.53, p = 0.0073, HR = 2.75, p < 0.0001 and HR = 1.67, p = 0.004, respectively; Table 3). These results suggested that high expression of SKA1 and SKA3 is closely associated with cancer progression and the patient’s prognosis in RCC.
Table 3: Univariable and multivariable Cox hazard regression models for overall survival in RCC patients
Variables |
Group |
HR |
Univariable |
Multivariable |
||||
|---|---|---|---|---|---|---|---|---|
95% CI |
p value |
HR |
95% CI |
p value |
||||
SKA1 and SKA3 expression |
both high / other |
2.04 |
1.51-2.75 |
< 0.0001 |
1.48 |
1.09-2.02 |
0.0134 |
|
Age |
≥60 / <60 |
1.81 |
1.33-2.50 |
0.0001 |
1.53 |
1.12-2.12 |
0.0073 |
|
Gender |
Male / Female |
0.96 |
0.71-1.32 |
0.804 |
- |
- |
- |
|
Stage |
III+IV / I+II |
3.74 |
2.74-5.16 |
< 0.0001 |
2.75 |
1.97-3.90 |
< 0.0001 |
|
Histlogical grade |
G3+4 / G1+2 |
2.61 |
1.87-3.70 |
< 0.0001 |
1.67 |
1.17-2.42 |
0.004 |
|
DISCUSSION
Due to recently developed molecularly targeted drugs, RCC treatment outcomes have improved. However, the appearance of drug-resistant cancer cells during the course of treatment is a major obstacle in continued therapy [19]. Discovery of molecular targets for resistant cancer cells has occupied an important position in the development of the latest cancer therapies. To discover novel targets for RCC treatment, we have identified several anti-tumor miRNAs that regulate oncogenic targets in RCC cells, including miR-26a, miR-26b, miR-29a, miR-29b, miR-29c, miR-101-3p and miR-10a-5p [17, 20-22]. Our studies revealed that ubiquitin-like with PHD and ring finger domains 1 (UHRF1) was directly regulated by miR-101-3p and overexpression of UHRF1 was observed in sunitinib-treated RCC tissues [17]. It was reported that 2 genes (lysyl oxidase-like 2 (LOXL2) and procollagen-lysine, 2-oxoglutarate 5-dioxygenase 2 (PLOD2)) were direct targets of the miR-29-family and miR-26a/miR-26b, respectively. Overexpression of these genes enhanced cancer cell migration and invasive abilities [20]. More recently, the gene encoding spindle and kinetochore associated protein 1 (SKA1) was identified as a target of anti-tumor miR-10a-5p. Overexpression of SKA1 was detected in clinical specimens from patients treated with tyrosine kinase inhibitors and its expression contributed to cancer cell aggressiveness [22]. Interestingly, high expression of 4 genes targeted by anti-tumor miRNAs was significantly associated with poor prognosis of patients with RCC according to TCGA database analyses (UHRF1: p = 4.87E-06, LOXL2: p = 0.0343, PLOD2: p = 0.000855 and SKA1: p = 1.44E-07). These findings indicate that our miRNA-based approaches effectively identify molecular targets for RCC treatments.
Our recent studies showed that some miRNA passenger strands (miR-144-5p, miR-145-3p, miR-149-3p, miR-150-3p and miR-199a/b-3p) acted as anti-tumor miRNAs through their targeting of oncogenic genes in several cancers [10, 12-14, 16]. Our data represent an exception to the general concept of miRNA biogenesis and may offer new approaches to miRNA analysis. It has been reported by other research groups that passenger strands of miRNAs were functional in cancer cells. For examples, miR-149-3p inhibited cancer aggressiveness and metastasis in breast cancer [23]. Furthermore, miR-21-3p functions as a tumor suppressor via targeting methionine adenosyltransferase (MAT) in hepatocellular carcinoma [24]. In clear cell RCC, the miR-514a-3p expression level was significantly downregulated and behaves as a tumor suppressor through its targeting of epidermal growth factor receptor (EGFR) [25].
In RCC cells, we identified a total of 55 oncogenes that were putative targets of miR-455-5p and 33 that were likely targets of miR-455-3p (Tables 1 and 2). Among them, several genes have been reported to be involved in RCC pathogenesis. KIAA0101 induced by erythropoietin, promoted cancer proliferation and migration, and higher expression of KIAA0101 was associated with a poorer prognosis in RCC [26]. VCAN was overexpressed in clear cell RCC tissues and high expression of the gene was associated with metastasis and poorer survival after nephrectomy [27]. PARVG was also reported to be highly associated with RCC prognosis [28]. Furthermore, our research groups have revealed that CENPF, directly regulated by miR-205-5p, was overexpressed and involved in prostate cancer pathogenesis [29]. These target genes represent potential therapeutic targets for RCC. Our data suggested that both strands of miR-455 duplex controlled several types of genes which contributed to cancer cell proliferation, invasion and migration. Thus, the elucidation of genes directly regulated by anti-tumor miR-455 significantly help our understanding of pathogenesis in RCC.
Here, we focused on the SKA complex, which is a sub-complex of the outer kinetochore and attaches to spindle microtubules to maintain the metaphase plate during mitosis. The structure of the SKA complex is a coiled dimer formed by interaction between SKA1, SKA2 and SKA3 proteins [30]. Among them, C-terminal domains of SKA1 and SKA3 were especially important for microtubule binding and mitotic progression [30-32]. The SKA complex likely plays a pivotal role in the onset of anaphase in mitosis [33]. In cancer cells, including RCC, genes that regulate the cell cycle can mutate and produce excessive growth [34].
Our previous study showed overexpression of SKA1 in RCC clinical specimens, and its expression was associated with poor prognosis of RCC patients [22]. In this study, we demonstrated that expression of SKA3 significantly contributed to RCC pathogenesis. Other studies showed that overexpression of SKA1 and SKA3 was related to cancer aggressiveness in several other cancers, including non-small cell lung cancer, prostate cancer, bladder cancer, gastric cancer, colorectal cancer and adenoid cystic carcinoma [35-40]. Previous study showed that overexpression of SKA2 was observed in breast cancer and lung cancer specimens and its expression was enhanced to cancer cell proliferation [41]. Interestingly, several oncogenic signaling pathways, including ERK1/2, AKT, FAK and SRC, are regulated by expression of SKA1 in cancer cells [22]. These findings indicate that a member of the SKA complex might be a therapeutic target for RCC treatment.
In conclusions, both strands of the miR-455 duplex, miR-455-5p and miR-455-3p, acted as anti-tumor miRNAs through their targeting of several oncogenes in RCC. Genome-wide gene expression analyses and in silico approaches revealed that SKA1 and SKA3 were regulated by these miRNAs. Overexpression of SKA1 and SKA3 was involved in RCC pathogenesis, and these molecules might be potential prognostic markers and therapeutic targets for RCC. Involvement of passenger strands of miRNAs in cancer pathogenesis is a novel concept that provides new approaches to the treatment of RCC pathogenesis.
MATERIALS AND METHODS
Clinical specimen collection, cell lines and cell culture
We collected tissues from 15 patients who were diagnosed with renal tumors and who underwent radical nephrectomy at Chiba University Hospital (Chiba, Japan) between 2012 and 2015. Table 4 shows clinicopathological features of the 15 patients. All patients were diagnosed with clear cell carcinoma. Prior to surgery, all patients agreed that their own specimens would be used for research and they signed informed consent documents. We used 2 human RCC cell lines (786-O and A498) obtained from the American Type Culture Collection (ATCC, Manassas, VA, USA) as previously described [29, 42, 43]. The 2 cell lines were cultured in RPMI1640 with 10% fetal bovine serum (FBS) (HyClone, Utah, USA).
Table 4: Characteristics of 15 patients with clear cell RCC
No. |
Age |
Gender |
Grade |
pT |
INF |
v |
ly |
e.g or ig |
fc |
im |
rc |
rp |
s |
|---|---|---|---|---|---|---|---|---|---|---|---|---|---|
1 |
65 |
F |
G1>G2 |
T1a |
a |
0 |
0 |
e.g |
1 |
0 |
0 |
0 |
0 |
2 |
59 |
M |
G3>G2 |
T1b |
a |
0 |
0 |
e.g |
1 |
0 |
0 |
0 |
0 |
3 |
70 |
M |
G2>G3>G1 |
T1a |
a |
0 |
0 |
e.g |
1 |
0 |
0 |
0 |
0 |
4 |
52 |
M |
G2>G3 |
T1b |
a |
0 |
0 |
e.g |
1 |
1 |
0 |
0 |
0 |
5 |
76 |
F |
G2>G3 |
T3a |
a |
1 |
0 |
e.g |
1 |
0 |
0 |
0 |
0 |
6 |
64 |
M |
G2>G3>G1 |
T3a |
b |
1 |
0 |
ig |
0 |
1 |
1 |
0 |
0 |
7 |
67 |
M |
G2>G3>G1 |
T3a |
b |
1 |
0 |
ig |
1 |
0 |
0 |
0 |
0 |
8 |
59 |
M |
G3 |
T3a |
b |
1 |
0 |
ig |
0 |
0 |
0 |
0 |
0 |
9 |
77 |
M |
G1>G2 |
T1b |
a |
0 |
0 |
e.g |
1 |
0 |
0 |
0 |
0 |
10 |
51 |
F |
G2>G1>G3 |
T3a |
b |
1 |
0 |
ig |
0 |
0 |
0 |
0 |
0 |
11 |
51 |
M |
G2>G1 |
T1b |
a |
0 |
0 |
e.g |
0 |
0 |
0 |
0 |
0 |
12 |
78 |
M |
G2>G1>>G3 |
T1b |
b |
0 |
0 |
e.g |
1 |
0 |
0 |
0 |
0 |
13 |
57 |
M |
G2 |
T1b |
a |
0 |
0 |
e.g |
0 |
0 |
0 |
0 |
0 |
14 |
54 |
M |
G2>G1 |
T3a |
a |
0 |
0 |
e.g |
0 |
0 |
1 |
0 |
0 |
15 |
74 |
F |
G3 |
T3a |
b |
1 |
0 |
e.g |
0 |
0 |
0 |
1 |
1 |
F, female; M, male; INF, infiltration; v, vein; ly, lymph node; e.g, expansive growth; ig, infiltrative growth; fc, capsular formation; im, intrarenal metastasis; rc, renal capsule invasion; rp, pelvis invasion; s, sinus invasion.
Transfection of mature miRNA, siRNA or plasmid vectors into RCC cells
The following mature miRNA species were used in this study: mature miRNA and Pre-miR miRNA Precursors (hsa-miR-455-5p; P/N: PM10529 and hsa-miR-455-3p; P/N: PM11142; from Applied Biosystems, Foster City, CA, USA). The following siRNAs were used: Stealth Select RNAi siRNA, si-SKA3 (HSS137458 and HSS176800; Invitrogen, Carlsbad, CA, USA), and negative control miRNA/siRNA (P/N: AM17111; Applied Biosystems). SKA3 plasmid vectors were designed and created by Kazusa DNA Research Institution (Product ID: FHC28197; Kisarazu, Japan). miRNAs and siRNAs were incubated with Opti-MEM (Invitrogen) and Lipofectamine RNAiMax transfection reagents (Invitrogen), as previously described [29, 42, 43]. Plasmid vectors were incubated with Opti-MEM and Lipofectamine 3000 reagents (Invitrogen) by forward transfection with the manufacturer's protocol.
Incorporation of miR-455-5p or miR-455-3p into the RISC
786-O cells were transfected with 10 nM miRNA by reverse transfection. After 48 h, immunoprecipitation was performed using a human Ago2 miRNA isolation kit (Wako, Osaka, Japan) with the manufacturer's protocol. Expression levels of miR-455-5p or miR-455-3p were determined by qRT-PCR. The expression data were normalized to the expression of miR-26a (product ID: 000404; Applied Biosystems), which was not influenced by either miR-455-5p or miR-455-3p transfection.
Quantitative real-time reverse transcription polymerase chain reaction (qRT-PCR)
Total RNA was extracted with TRIzol reagent (Invitrogen) according to the manufacturer's protocol, as described previously [29, 42, 43]. The procedure for PCR quantification was described previously [29, 42, 43]. Expression levels of miR-455-5p (Assay ID: 001280) and miR-455-3p (Assay ID: 002244) were determined by TaqMan qRT-PCR (TaqMan MicroRNA Assay; Applied Biosystems) and normalized to RNU48 expression (assay ID: 001006; Applied Biosystems). TaqMan probes and primers for SKA1 (P/N: Hs00536843_m1; Applied Biosystems), SKA3 (P/N: Hs00384927_m1; Applied Biosystems), GAPDH (an internal control; P/N: Hs02758991_m1; Applied Biosystems) and GUSB (an internal control; P/N: Hs00939627_ml; Applied Biosystems) were assay-on-demand gene expression products.
Cell proliferation, migration and invasion assays
Cell proliferation assays were carried out with XTT protocols, migration was assessed by wound-healing assays and invasion assays were carried out with Matrigel-coated Boyden chambers, as previously described [29, 42, 43].
Identification of putative target genes regulated by miR-455-5p and 455-3p in RCC cells
To identify genes regulated by miR-455-5p and miR-455-3p, we used in silico analyses and genome-wide gene expression analysis, as described previously [29, 42, 43]. We used the TargetScanHuman 7.0 (August, 2015 release), TCGA, and OncoLnc databases to select and narrow down putative miRNA target genes [44-46]. An oligo microarray (Human Ge 60K; Agilent Technologies) was used for gene expression analysis. The microarray data were deposited into the GEO database (accession number: GSE106791).
Western blot analysis
Cells were harvested 48 h after transfection, and lysates were prepared. Immunoblotting was performed with anti-SKA1 antibodies (1:500 dilution, SAB2701430; Sigma-Aldrich, St. Louis, MO, USA) and anti-SKA3 antibodies (1:1,000 dilution, ab175951; Abcam, Cambridge, UK). Anti-glyceraldehyde 3-phosphate dehydrogenase (GAPDH) antibodies (1:10,000 dilution, ab8245; Abcam) were used as an internal loading control. The procedures were described previously [29, 42, 43].
Luciferase reporter assays
The partial wild-type sequence of the SKA1 or SKA3 3′-UTR or that with deletion of the miR-455-5p and miR-455-3p target site was inserted between the SgfI-PmeI restriction sites in the 3′-UTR of the hRluc gene in the psiCHECK-2 vector (C8021; Promega, Madison, WI, USA). The procedures were described previously [29, 42, 43].
Immunohistochemistry
Tissue specimens were incubated overnight at 4°C with anti-SKA3 antibodies (1:50 dilution, ab175951; Abcam). The procedures were described previously [29, 42, 43].
TCGA database analysis of RCC
To investigate the clinical significance of miRNAs and candidate target genes, we used TCGA cohort data based on RNA sequencing. Gene expression and clinical data were obtained from cBioportal and OncoLnc datasets (downloaded on November 15th, 2017).
Statistical analysis methods
To analyze the relationships between two groups and the numerical values, we performed Mann-Whitney U-tests and paired t-tests. Spearman's rank test was performed to evaluate the correlation between the two groups. Relationships among more than three variables and numerical values were analyzed using Bonferroni-adjusted Mann-Whitney U-tests. Disease-free and overall survival were analyzed using the Kaplan–Meier method, and multivariable Cox hazard regression analyses with JMP software (version 13; SAS Institute Inc., Cary, NC, USA). Other analyses were performed using Expert StatView (version 5; SAS Institute Inc.).
ACKNOWLEDGMENTS
The present study was supported by KAKENHI grants 16K20125, 17K11160, 16H05462 and 15K10801.
CONFLICTS OF INTEREST
The authors declare no conflicts of interest.
REFERENCES
1. Ljungberg B, Bensalah K, Canfield S, Dabestani S, Hofmann F, Hora M, Kuczyk MA, Lam T, Marconi L, Merseburger AS, Mulders P, Powles T, Staehler M, et al. EAU guidelines on renal cell carcinoma: 2014 update. Eur Urol. 2015; 67: 913-24.
2. Capitanio U, Montorsi F. Renal cancer. Lancet. 2016; 387: 894-906.
3. Gupta K, Miller JD, Li JZ, Russell MW, Charbonneau C. Epidemiologic and socioeconomic burden of metastatic renal cell carcinoma (mRCC): a literature review. Cancer Treat Rev. 2008; 34: 193-205. https://doi.org/10.1016/j.ctrv.2007.12.001.
4. Tang PA, Heng DY. Programmed death 1 pathway inhibition in metastatic renal cell cancer and prostate cancer. Curr Oncol Rep. 2013; 15: 98-104. https://doi.org/10.1007/s11912-012-0284-2.
5. Goto Y, Kurozumi A, Enokida H, Ichikawa T, Seki N. Functional significance of aberrantly expressed microRNAs in prostate cancer. Int J Urol. 2015; 22: 242-52. https://doi.org/10.1111/iju.12700.
6. Friedman RC, Farh KK, Burge CB, Bartel DP. Most mammalian mRNAs are conserved targets of microRNAs. Genome Res. 2009; 19: 92-105. https://doi.org/10.1101/gr.082701.108.
7. Esquela-Kerscher A, Slack FJ. Oncomirs - microRNAs with a role in cancer. Nat Rev Cancer. 2006; 6: 259-69. https://doi.org/10.1038/nrc1840.
8. Mah SM, Buske C, Humphries RK, Kuchenbauer F. miRNA*: a passenger stranded in RNA-induced silencing complex? Crit Rev Eukaryot Gene Expr. 2010; 20: 141-8.
9. Liu WW, Meng J, Cui J, Luan YS. Characterization and Function of MicroRNA( *)s in Plants. Front Plant Sci. 2017; 8: 2200. https://doi.org/10.3389/fpls.2017.02200.
10. Matsushita R, Seki N, Chiyomaru T, Inoguchi S, Ishihara T, Goto Y, Nishikawa R, Mataki H, Tatarano S, Itesako T, Nakagawa M, Enokida H. Tumour-suppressive microRNA-144-5p directly targets CCNE1/2 as potential prognostic markers in bladder cancer. Br J Cancer. 2015; 113: 282-9. https://doi.org/10.1038/bjc.2015.195.
11. Yamada Y, Koshizuka K, Hanazawa T, Kikkawa N, Okato A, Idichi T, Arai T, Sugawara S, Katada K, Okamoto Y, Seki N. Passenger strand of miR-145-3p acts as a tumor-suppressor by targeting MYO1B in head and neck squamous cell carcinoma. Int J Oncol. 2018; 52: 166-78. https://doi.org/10.3892/ijo.2017.4190.
12. Goto Y, Kurozumi A, Arai T, Nohata N, Kojima S, Okato A, Kato M, Yamazaki K, Ishida Y, Naya Y, Ichikawa T, Seki N. Impact of novel miR-145-3p regulatory networks on survival in patients with castration-resistant prostate cancer. Br J Cancer. 2017; 117: 409-20. https://doi.org/10.1038/bjc.2017.191.
13. Okato A, Arai T, Yamada Y, Sugawara S, Koshizuka K, Fujimura L, Kurozumi A, Kato M, Kojima S, Naya Y, Ichikawa T, Seki N. Dual Strands of Pre-miR-149 Inhibit Cancer Cell Migration and Invasion through Targeting FOXM1 in Renal Cell Carcinoma. Int J Mol Sci. 2017; 18. https://doi.org/10.3390/ijms18091969.
14. Koshizuka K, Nohata N, Hanazawa T, Kikkawa N, Arai T, Okato A, Fukumoto I, Katada K, Okamoto Y, Seki N. Deep sequencing-based microRNA expression signatures in head and neck squamous cell carcinoma: dual strands of pre-miR-150 as antitumor miRNAs. Oncotarget. 2017; 8: 30288-30304. https://doi.org/10.18632/oncotarget.16327.
15. Okato A, Arai T, Kojima S, Koshizuka K, Osako Y, Idichi T, Kurozumi A, Goto Y, Kato M, Naya Y, Ichikawa T, Seki N. Dual strands of pre-miR150 (miR1505p and miR1503p) act as antitumor miRNAs targeting SPOCK1 in naive and castration-resistant prostate cancer. Int J Oncol. 2017; 51: 245-56. https://doi.org/10.3892/ijo.2017.4008.
16. Koshizuka K, Hanazawa T, Kikkawa N, Arai T, Okato A, Kurozumi A, Kato M, Katada K, Okamoto Y, Seki N. Regulation of ITGA3 by the anti-tumor miR-199 family inhibits cancer cell migration and invasion in head and neck cancer. Cancer Sci. 2017; 108: 1681-92. https://doi.org/10.1111/cas.13298.
17. Goto Y, Kurozumi A, Nohata N, Kojima S, Matsushita R, Yoshino H, Yamazaki K, Ishida Y, Ichikawa T, Naya Y, Seki N. The microRNA signature of patients with sunitinib failure: regulation of UHRF1 pathways by microRNA-101 in renal cell carcinoma. Oncotarget. 2016; 7: 59070-86. https://doi.org/10.18632/oncotarget.10887.
18. R2: Genomics Analysis and Visualization Platform (http://r2.amc.nl).
19. Figlin R, Sternberg C, Wood CG. Novel agents and approaches for advanced renal cell carcinoma. J Urol. 2012; 188: 707-15. https://doi.org/10.1016/j.juro.2012.04.108.
20. Kurozumi A, Kato M, Goto Y, Matsushita R, Nishikawa R, Okato A, Fukumoto I, Ichikawa T, Seki N. Regulation of the collagen cross-linking enzymes LOXL2 and PLOD2 by tumor-suppressive microRNA-26a/b in renal cell carcinoma. Int J Oncol. 2016; 48: 1837-46. https://doi.org/10.3892/ijo.2016.3440.
21. Nishikawa R, Chiyomaru T, Enokida H, Inoguchi S, Ishihara T, Matsushita R, Goto Y, Fukumoto I, Nakagawa M, Seki N. Tumour-suppressive microRNA-29s directly regulate LOXL2 expression and inhibit cancer cell migration and invasion in renal cell carcinoma. FEBS Lett. 2015; 589: 2136-45. https://doi.org/10.1016/j.febslet.2015.06.005.
22. Arai T, Okato A, Kojima S, Idichi T, Koshizuka K, Kurozumi A, Kato M, Yamazaki K, Ishida Y, Naya Y, Ichikawa T, Seki N. Regulation of spindle and kinetochoreassociated protein 1 by antitumor miR-10a-5p in renal cell carcinoma. Cancer Sci. 2017; 108: 2088-101. https://doi.org/10.1111/cas.13331.
23. Dong Y, Chang C, Liu J, Qiang J. Targeting of GIT1 by miR-149* in breast cancer suppresses cell proliferation and metastasis in vitro and tumor growth in vivo. Onco Targets Ther. 2017; 10: 5873-82. https://doi.org/10.2147/ott.s144280.
24. Lo TF, Tsai WC, Chen ST. MicroRNA-21-3p, a berberineinduced miRNA, directly down-regulates human methionine adenosyltransferases 2A and 2B and inhibits hepatoma cell growth. PLoS One. 2013; 8: e75628. https://doi.org/10.1371/journal.pone.0075628.
25. Ke X, Zeng X, Wei X, Shen Y, Gan J, Tang H, Hu Z. MiR-514a-3p inhibits cell proliferation and epithelialmesenchymal transition by targeting EGFR in clear cell renal cell carcinoma. Am J Transl Res. 2017; 9: 5332-46.
26. Fan S, Li X, Tie L, Pan Y, Li X. KIAA0101 is associated with human renal cell carcinoma proliferation and migration induced by erythropoietin. Oncotarget. 2016; 7: 13520-37. https://doi.org/10.18632/oncotarget.5876.
27. Mitsui Y, Shiina H, Kato T, Maekawa S, Hashimoto Y, Shiina M, Imai-Sumida M, Kulkarni P, Dasgupta P, Wong RK, Hiraki M, Arichi N, Fukuhara S, et al. Versican Promotes Tumor Progression, Metastasis and Predicts Poor Prognosis in Renal Carcinoma. Mol Cancer Res. 2017; 15: 884-95. https://doi.org/10.1158/1541-7786.mcr-16-0444.
28. Chen G, Wang Y, Wang L, Xu W. Identifying prognostic biomarkers based on aberrant DNA methylation in kidney renal clear cell carcinoma. Oncotarget. 2017; 8: 5268-80. https://doi.org/10.18632/oncotarget.14134.
29. Nishikawa R, Goto Y, Kurozumi A, Matsushita R, Enokida H, Kojima S, Naya Y, Nakagawa M, Ichikawa T, Seki N. MicroRNA-205 inhibits cancer cell migration and invasion via modulation of centromere protein F regulating pathways in prostate cancer. Int J Urol. 2015; 22: 867-77. https://doi.org/10.1111/iju.12829.
30. Jeyaprakash AA, Santamaria A, Jayachandran U, Chan YW, Benda C, Nigg EA, Conti E. Structural and functional organization of the Ska complex, a key component of the kinetochore-microtubule interface. Mol Cell. 2012; 46: 274-86. https://doi.org/10.1016/j.molcel.2012.03.005.
31. Abad MA, Medina B, Santamaria A, Zou J, Plasberg-Hill C, Madhumalar A, Jayachandran U, Redli PM, Rappsilber J, Nigg EA, Jeyaprakash AA. Structural basis for microtubule recognition by the human kinetochore Ska complex. Nat Commun. 2014; 5: 2964. https://doi.org/10.1038/ncomms3964.
32. Daum JR, Wren JD, Daniel JJ, Sivakumar S, McAvoy JN, Potapova TA, Gorbsky GJ. Ska3 is required for spindle checkpoint silencing and the maintenance of chromosome cohesion in mitosis. Curr Biol. 2009; 19: 1467-72. https://doi.org/10.1016/j.cub.2009.07.017.
33. Sivakumar S, Janczyk PL, Qu Q, Brautigam CA, Stukenberg PT, Yu H, Gorbsky GJ. The human SKA complex drives the metaphase-anaphase cell cycle transition by recruiting protein phosphatase 1 to kinetochores. Elife. 2016; 5. https://doi.org/10.7554/eLife.12902.
34. Collins K, Jacks T, Pavletich NP. The cell cycle and cancer. Proc Natl Acad Sci U S A. 1997; 94: 2776-8.
35. Shen L, Yang M, Lin Q, Zhang Z, Miao C, Zhu B. SKA1 regulates the metastasis and cisplatin resistance of nonsmall cell lung cancer. Oncol Rep. 2016; 35: 2561-8. https://doi.org/10.3892/or.2016.4670.
36. Wang K, Sun J, Teng J, Yu Y, Zhong D, Fan Y. Overexpression of spindle and kinetochore-associated protein 1 contributes to the progression of prostate cancer. Tumour Biol. 2017; 39: 1010428317701918. https://doi.org/10.1177/1010428317701918.
37. Tian F, Xing X, Xu F, Cheng W, Zhang Z, Gao J, Ge J, Xie H. Downregulation of SKA1 Gene Expression Inhibits Cell Growth in Human Bladder Cancer. Cancer Biother Radiopharm. 2015; 30: 271-7. https://doi.org/10.1089/cbr.2014.1715.
38. Sun W, Yao L, Jiang B, Guo L, Wang Q. Spindle and kinetochore-associated protein 1 is overexpressed in gastric cancer and modulates cell growth. Mol Cell Biochem. 2014; 391: 167-74. https://doi.org/10.1007/s11010-014-1999-1.
39. Zhao LJ, Yang HL, Li KY, Gao YH, Dong K, Liu ZH, Wang LX, Zhang B. Knockdown of SKA1 gene inhibits cell proliferation and metastasis in human adenoid cystic carcinoma. Biomed Pharmacother. 2017; 90: 8-14. https://doi.org/10.1016/j.biopha.2017.03.029.
40. Chuang TP, Wang JY, Jao SW, Wu CC, Chen JH, Hsiao KH, Lin CY, Chen SH, Su SY, Chen YJ, Chen YT, Wu DC, Li LH. Over-expression of AURKA, SKA3 and DSN1 contributes to colorectal adenoma to carcinoma progression. Oncotarget. 2016; 7: 45803-18. https://doi.org/10.18632/oncotarget.9960.
41. Rice L, Waters CE, Eccles J, Garside H, Sommer P, Kay P, Blackhall FH, Zeef L, Telfer B, Stratford I, Clarke R, Singh D, Stevens A, et al. Identification and functional analysis of SKA2 interaction with the glucocorticoid receptor. J Endocrinol. 2008; 198: 499-509. https://doi.org/10.1677/joe-08-0019.
42. Yamada Y, Nishikawa R, Kato M, Okato A, Arai T, Kojima S, Yamazaki K, Naya Y, Ichikawa T, Seki N. Regulation of HMGB3 by antitumor miR-205-5p inhibits cancer cell aggressiveness and is involved in prostate cancer pathogenesis. J Hum Genet. 2018; 63: 195-205. https://doi.org/10.1038/s10038-017-0371-1.
43. Kurozumi A, Goto Y, Matsushita R, Fukumoto I, Kato M, Nishikawa R, Sakamoto S, Enokida H, Nakagawa M, Ichikawa T, Seki N. Tumor-suppressive microRNA-223 inhibits cancer cell migration and invasion by targeting ITGA3/ITGB1 signaling in prostate cancer. Cancer Sci. 2016; 107: 84-94. https://doi.org/10.1111/cas.12842.
44. Anaya J. OncoLnc: linking TCGA survival data to mRNAs, miRNAs, and lncRNAs. PeerJ Computer Science. 2016; 2:e 67.
45. Cerami E, Gao J, Dogrusoz U, Gross BE, Sumer SO, Aksoy BA, Jacobsen A, Byrne CJ, Heuer ML, Larsson E, Antipin Y, Reva B, Goldberg AP, et al. The cBio cancer genomics portal: an open platform for exploring multidimensional cancer genomics data. Cancer Discov. 2012; 2: 401-4. https://doi.org/10.1158/2159-8290.cd-12-0095.
46. Gao J, Aksoy BA, Dogrusoz U, Dresdner G, Gross B, Sumer SO, Sun Y, Jacobsen A, Sinha R, Larsson E, Cerami E, Sander C, Schultz N. Integrative analysis of complex cancer genomics and clinical profiles using the cBioPortal. Sci Signal. 2013; 6: pl1. https://doi.org/10.1126/scisignal.2004088.