
INTRODUCTION
Head and neck squamous cell carcinomas (HNSCC) constitute an anatomically heterogeneous group of solid tumors arising from the nasopharynx, oral cavity, oropharynx, hypopharynx, and larynx [1]. Major risk factors for HNSCC include sex, tobacco smoking, alcohol consumption, and oncoviral infection [2]. At least 50% of patients with locally advanced HNSCC develop local lymph node failure or distant failure in the lung, which is usually detected within the first 2 years of treatment [3]. The present standard management strategies include constructive and multimodal treatments such as surgery, radiotherapy, and chemotherapy. Despite these aggressive treatments, the long-term survival rates are poor and remain between 40% and 50% [4]. Therefore, molecular classification of HNSCCs is required to provide prognostic as well as mechanistic information to improve patient care.
Aberrant promoter methylation, an important hallmark of cancer cells, is considered a major mechanism underlying the inactivation of tumor-related genes. Several studies have reported that the promoter methylation of tumor suppressor genes represents a common mechanism of transcriptional silencing in HNSCC [5]. DNA methyltransferases (DNMTs) play an important role in genomic integrity, the disruption of which may result in chromosomal instability and tumor progression [6]. DNMT levels, especially those of DNMT3A and DNMT3B, are often increased in various cancer tissues and cell lines, which may partly account for the hypermethylation of CpG-rich regions in tumor suppressor gene promoters [7]. In HNSCC, the increased methylation observed in HPV-positive tumors may be partially explained by the higher expression of DNMT3A, compared to that in HPV-negative cells [8].
The ten eleven translocation protein (TET) might function as a 5-methylcytosine (5mC) oxidase and potentially as a DNA demethylase [9]. TET belongs to a family of three proteins, namely TET1, TET2, and TET3, which catalyze the successive oxidation of 5mC to 5-hydroxymethylcytosine (5hmC), 5-formylcytosine (5fC), and 5-carboxylcytosine (5caC) [10–12]. Mutations of TET genes were found in 0.1–10% of major types of cancer [13]. TET gene inactivation may have broad implications for the formation of many solid tumors [14]. TET1 methylation appears to be an early event during colorectal cancer tumorigenesis and is associated with a global effect on the DNA CpG methylation status [15]. However, a systematic study of the epigenetic and transcriptional regulation of TET family genes in most human cancers is still needed. Simultaneous analyses of the methylation status of TET family genes are important for predicting tumorigenesis, biological behavior, and the development of future targeted therapies.
The aim of this study was to resolve the frequent promoter methylation of TET family genes in a large set of primary tumors. This appears to be the dominant mechanism for the inactivation of TET family genes in cancers. Furthermore, we determined the methylation status of TET family genes in HNSCC to evaluate their clinical significance as prognostic biomarkers for recurrence risk and survival. All three TET family genes were examined, as was the relationship between the methylation of TET family genes and various clinical characteristics. We attempted to determine whether HNSCC primary tumors originating from different anatomic sites (hypopharynx, larynx, oral cavity, and oropharynx) exhibited similar DNA methylation changes, or whether DNA methylation events were specific to the anatomic site.
RESULTS
Initial screening: expression and promoter methylation in TET family genes in HNSCC cell lines
Quantitative reverse transcription polymerase chain reaction (Q-RT-PCR) analysis of TET1 and TET3 transcripts from UM-SCC cell lines (UM-SCC-10A, -10B, -11A, -11B, -22B, and -54) revealed significantly lower expression of these genes in cancer cell lines than in normal cell lines (P = 0.041 and P < 0.001, respectively) (Figure 1A and 1C). Moreover, in the quantitative methylation-specific PCR (Q-MSP) analysis, the normalized methylation value (NMV) for the TET1 and TET3 gene promoters tended to be higher in cancer cells than in normal tonsil samples and normal cell lines (P < 0.001 and P = 0.002, respectively) (Figure 1D and 1F). There was no significant difference in TET2 expression and methylation between cancer cell lines and normal cell lines (Figure 1B and 1E). TET1, TET2 and TET3 promoter hypermethylation showed highly discriminative ROC curve profiles, which clearly distinguished HNSCC from normal mucosal tissues (AUROC = 0.6694, AUROC = 0.5968, and AUROC = 0.6559, respectively). A DNA sample was classified as positive when the NMV exceeded 0.0471, 0.1004 and 0.1337 for TET1, TET2 and TET3, respectively. The cutoff NMV was chosen from the ROC curve to maximize sensitivity and specificity (Supplementary Figure 1). In total, 233 primary HNSCC samples and 128 adjacent normal mucosal tissues were obtained from surgical specimens for methylation screening. (Supplementary Table 1).
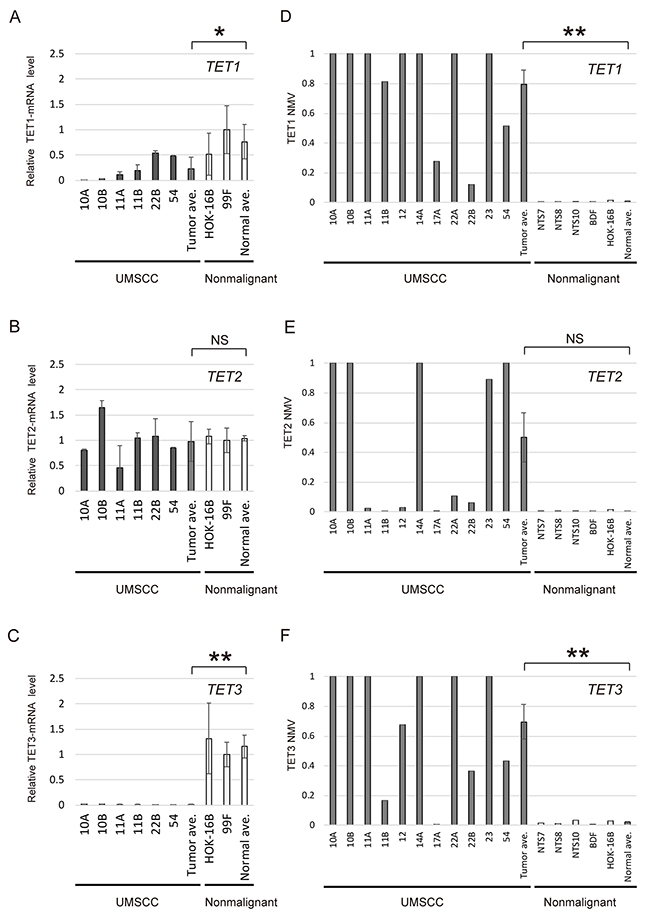
Figure 1: mRNA expression and promoter methylation of TET family genes in HNSCC cell lines. The relative mRNA levels for (A) TET1 and (C) TET3 were lower in cancer cell lines than in normal cell lines (P = 0.041 and P < 0.001, respectively). (B) Expression of TET2, showing no significant association with cancer or normal cell lines (P = 0.842). Mean NMVs for the (D) TET1, (E) TET2 and (F) TET3 promoters, showing higher levels in cancer cell lines than in normal tonsil samples (P < 0.001, P = 0.059 and P = 0.002, respectively). NTS: normal tonsil sample. *P < 0.05. **P < 0.01. The data are shown as the mean ± SE.
Analysis of the methylation status of TET family genes in primary samples
Q-MSP was used to assess the aberrant promoter methylation status of TET family genes in tumors from the hypopharynx (n = 57), larynx (n = 44), oropharynx (n = 63), or oral cavity (n = 69). TET1 was methylated in 34 (59.6%), TET2 in 5 (8.8%), and TET3 in 15 (26.3%) of the 57 hypopharyngeal cancers examined. In laryngeal cancers, the frequency of hypermethylation was 54.5% for TET1, 15.9% for TET2, and 31.8% for TET3. Moreover, the frequency of promoter methylation in oropharyngeal cancers was 61.9% for TET1, 6.3% for TET2, and 25.4% for TET3. Among 69 cases of oral cancer, the frequency of hypermethylation was 58.0% for TET1, 21.7% for TET2, and 29.0% for TET3 (Figure 2A). The distribution across all tumor types of promoter methylation in TET family genes is shown in Figure 2B. Methylation was observed in the promoters of all three TET genes (MMM), two of the three TET genes (UMM, MMU, MUM), only one TET gene (UUM, UMU, MUU) and none of the TET genes (UUU) in 9.0%, 17.2%, 38.6%, and 35.2% of the tumors, respectively (Figure 2B).
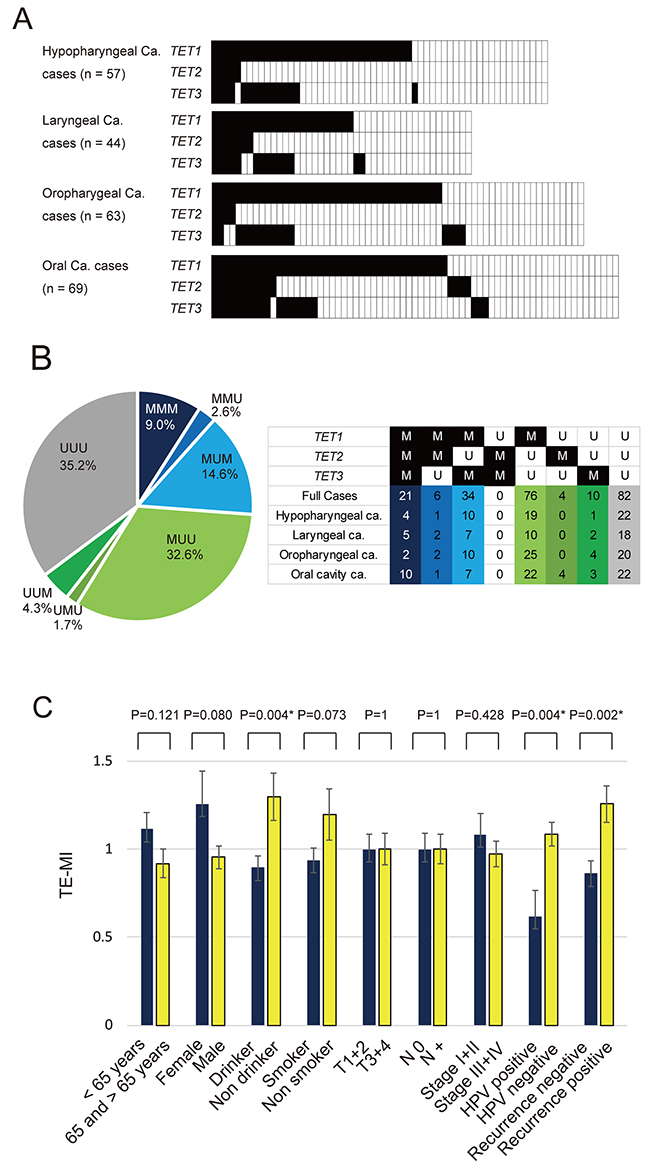
Figure 2: Summary of the promoter methylation status of TET family genes in 233 HNSCC samples. (A) Methylation rate comparisons of the promoters of three genes (TET1, TET2 and TET3) in patients with hypopharyngeal cancer, laryngeal cancer, oropharyngeal cancer, and oral cancer. Filled boxes indicate the presence of methylation, and open boxes indicate the absence of methylation. (B) Distribution of promoter methylation in TET family genes. Methylation was observed in the promoters of all three TET genes (MMM), two of three TET genes (UMM, MMU, MUM), only one TET gene (UUM, UMU, MUU) and none of the TET genes (UUU) in 9.0%, 17.2%, 38.6%, and 35.2% of the tumors, respectively. (C) The mean TE-MI for the different groups were compared using Student’s t test. *P < 0.05. M: methylated; U: unmethylated. The data are shown as the mean ± SE.
Association between methylation in TET family genes and clinicopathological characteristics
The characteristics and clinicopathological features of patients, including the age at diagnosis, sex, smoking habit, alcohol consumption, tumor staging, lymph node status, clinical stage, and HPV status are summarized in Table 1. TE-MI was defined as the number of methylated genes in each sample. The mean differences in TE-MI according to the age of onset, sex, smoking habit, alcohol consumption, tumor size, lymph node status, clinical stage, HPV status, and recurrence are illustrated in Figure 2C. TE-MI was significantly lower in drinkers (0.90 ± 0.88) than in non-drinkers (1.3 ± 1.05, P = 0.004), as well as in HPV-positive cases (0.62 ± 0.94) when compared to HPV-negative cases (1.08 ± 0.93, P = 0.004). Specifically, TE-MI was significantly higher in recurrent (1.26 ± 0.95) compared with nonrecurrent (0.86 ± 0.91) tumor cases (P = 0.002). No significant differences in methylation index (MI) were observed regarding the age of onset, sex, smoking status, tumor stage, lymph node status, or clinical stage (Figure 2C). For hypopharyngeal, laryngeal and oral cavity cancers, there was no significant association with clinicopathological characteristics (Supplementary Figure 2A, 2B, 2D). Among oropharyngeal cancers, TE-MI was significantly lower in female (0.40 ± 0.70) than in male (1.04 ± 0.78; P = 0.020) patients, as well as in non-drinkers (0.54 ± 0.66; P = 0.043) relative to drinkers (1.04 ± 0.81) (Supplementary Figure 2C).
Table 1: TET1, TET2 and TET3 gene methylation status in HNSCC primary samples
Patient and tumor characteristics |
Methylation status |
||||||||
|---|---|---|---|---|---|---|---|---|---|
TET1 |
TET2 |
TET3 |
|||||||
Present (137) |
Absent (96) |
P-valuea |
Present (31) |
Absent (202) |
P-valuea |
Present (65) |
Absent (168) |
P-valuea |
|
Age |
|||||||||
Under 65 (97) |
58 |
39 |
0.893 |
12 |
85 |
0.845 |
29 |
68 |
1 |
65 and older (136) |
79 |
57 |
19 |
117 |
36 |
100 |
|||
Gender |
|||||||||
Female (35) |
19 |
16 |
1 |
6 |
29 |
1 |
13 |
22 |
1 |
Male (198) |
118 |
80 |
25 |
173 |
52 |
146 |
|||
Smoking status |
|||||||||
Smoker (177) |
102 |
75 |
0.538 |
24 |
153 |
1 |
55 |
122 |
0.061 |
Non smoker (56) |
35 |
21 |
7 |
49 |
10 |
46 |
|||
Alcohol exposure |
|||||||||
Ever (173) |
103 |
70 |
1 |
23 |
150 |
1 |
53 |
120 |
0.134 |
Never (60) |
34 |
26 |
8 |
52 |
12 |
48 |
|||
Tumor size |
|||||||||
T1-2 (116) |
72 |
44 |
0.352 |
18 |
98 |
0.342 |
28 |
88 |
0.243 |
T3-4 (117) |
65 |
52 |
13 |
104 |
37 |
80 |
|||
Lympho-node status |
|||||||||
N0 (99) |
52 |
47 |
1 |
13 |
86 |
1 |
29 |
70 |
1 |
N+ (134) |
85 |
49 |
18 |
116 |
36 |
98 |
|||
Stage |
|||||||||
I, II (60) |
32 |
28 |
1 |
8 |
52 |
1 |
17 |
43 |
1 |
III, IV (173) |
105 |
68 |
23 |
150 |
48 |
125 |
|||
HPV status |
|||||||||
Positive (42) |
28 |
14 |
0.300 |
5 |
37 |
1 |
15 |
27 |
1 |
Negative (191) |
109 |
82 |
26 |
165 |
50 |
141 |
|||
aFisher’s exact probability test. *P < 0.05.
Methylation levels of 13 tumor suppressor genes and TET family genes in cancer tissues
The 13 tumor suppressor genes (TS-MI) was defined as the number of methylated genes in each sample (Figure 3A). The mean differences in TS-MI based on the methylation status of TET family genes are illustrated in Figure 3B. Specifically, the TS-MI was significantly higher in patients with TET1 methylation (6.55 ± 2.79) than in those with TET1 unmethylation (4.94 ± 2.56, P < 0.001), in patients with TET2 methylation (7.16 ± 2.81) than in those with TET2 unmethylation (5.69 ± 2.76, P = 0.006) and in those with TET3 methylation (6.95 ± 2.45) than in those with TET3 unmethylation (5.48 ± 2.83, P < 0.001) (Figure 3B). Joint analysis of the methylation status of TET1, TET2, and TET3 showed a significant trend toward higher TS-MI as the number of TET methylation events increased. This analysis revealed that TS-MI was significantly higher in patients with 3 (7.52 ± 2.29), 2 (7.15 ± 2.67), and 1 (5.84 ± 2.80) events than in patients with 0 events (4.90 ± 2.60, P < 0.001, P < 0.001, and P = 0.024, respectively) (Figure 3C).
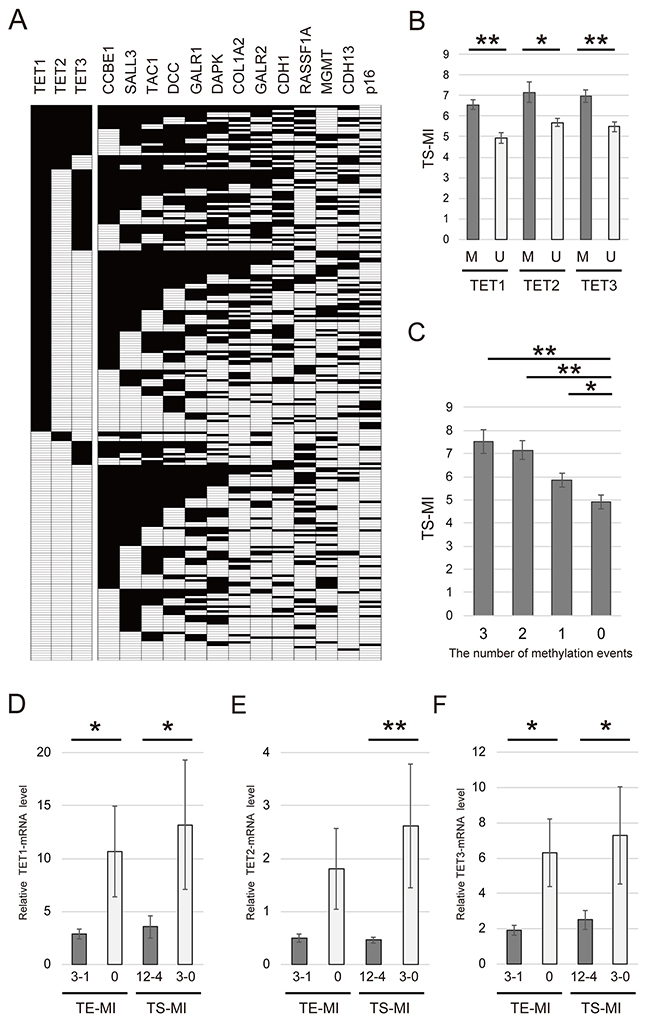
Figure 3: Comparison of methylation rates for 13 tumor suppressor genes and TET family genes in 233 primary HNSCC samples. (A) Distribution of promoter methylation in TET family genes and 13 tumor suppressor genes. Filled boxes indicate the presence of methylation, and open boxes indicate the absence of methylation. (B) Correlation between the methylation status of TS-MI and TETs in patients with HNSCC. M: methylated; U: unmethylated. (C) Combined analyses involving the methylation status of TS-MI and TET family genes. The number of methylation events was indicated for hypermethylated TET family genes. The mean TS-MI for the different groups was compared using Student’s t test. (D) TET1 mRNA levels were significantly higher in groups with lower TE-MI and TS-MI (P = 0.045 and P = 0.024, respectively). (E) TET2 mRNA levels were higher in groups with lower TE-MI compared to those with higher TE-MI (P = 0.055). TET2 mRNA levels were significantly higher in groups with lower TS-MI than in those with higher TS-MI (P = 0.004) (F) TET3 mRNA levels were significantly higher in groups with lower TE-MI and TS-MI (P = 0.012 and P = 0.014, respectively). *P < 0.05. **P < 0.001. The data are shown as the mean ± SE.
Expression and methylation index of TET family genes in HNSCC specimens
We next examined the mRNA levels of TET family genes in HNSCC specimens by Q-RT-PCR. TET1 expression was significantly higher in TE-MI and TS-MI groups exhibiting lower methylation levels (P = 0.044 and 0.024, respectively) (Figure 3D). The expression of TET2 was not associated with TE-MI (P = 0.055). However, TET2 expression was correlated with TS-MI (P = 0.004) (Figure 3E). TET3 expression was significantly correlated with both TE-MI and TS-MI (P = 0.012 and 0.014, respectively) (Figure 3F).
Kaplan-Meier estimates
Kaplan-Meier plots indicated that the methylation status of TET family genes was correlated with disease-free survival (DFS) (Figure 4A–4F). The Kaplan–Meier survival curves for the 233 patients with HNSCC according to the methylation status of the TET family gene promoters are shown in Figure 4A–4C. No correlation with DSF time was observed in patients with methylated (compared with unmethylated) TET1 and TET2 promoters (log-rank test; P = 0.401 and P = 0.944, respectively) (Figure 4A and 4B). A shorter DFS time was observed in patients with methylated TET3 promoters, compared with those with unmethylated TET3 promoters (log-rank test, P = 0.032) (Figure 4C). The DFS rate in the cases with 2–3 methylated genes was 32.1%, as compared with 56.2% in the 0–1 methylation group (log-rank test, P = 0.026) (Figure 4D). Among the 60 patients with stage I and II HNSCC, those with a methylated TET3 promoter had a shorter DFS time than those with an unmethylated TET3 promoter (log-rank test, P = 0.005) (Figure 4E). However, among 173 patients with stage III and IV HNSCC, the DFS rate in patients with TET3 methylation was 41.8%, as compared with 51.9% in the TET3 unmethylated group (log-rank test, P = 0.302) (Figure 4F). No increase in the risk of recurrence was observed according to the hypermethylation status of any of the TET genes studied or for any other combination of hypermethylated genes (Supplementary Figure 3).
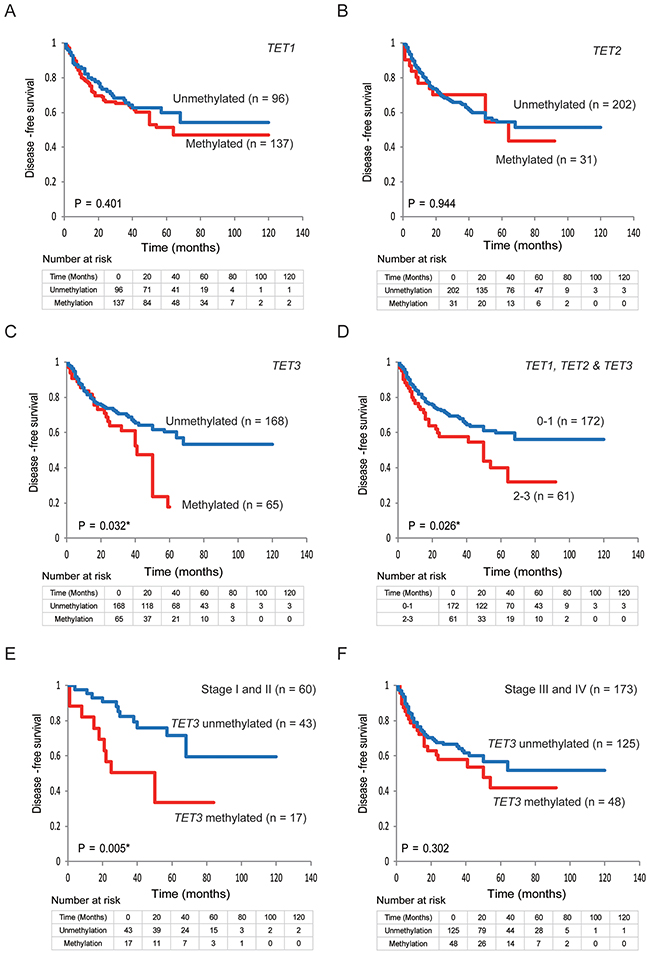
Figure 4: Kaplan-Meier survival curves for patients with HNSCC based on TET family gene methylation status. Kaplan-Meier survival curves based on TET promoter methylation status in patients with HNSCC. Disease-free survival according to (A) TET1 methylation status; (B) TET2 methylation status; (C) TET3 methylation status; (D) TET1, TET2, and TET3 methylation status; (E) TET3 methylation status in stage I and II patients; (F) and TET3 methylation status in patients with stage III and IV cancers.
Prognostic value of promoter hypermethylation in TET family genes
The association between methylation and the risk of recurrence was estimated via a multivariate analysis by using a Cox proportional hazards model adjusted for age, HPV status, smoking status, alcohol consumption, and clinical stage. In patients with a methylated TET3 promoter (65/233, 27.9%), the adjusted odds ratio (OR) for recurrence was 1.63 (95% confidence interval [CI]: 1.02–2.61, P = 0.040). In patients with T1 and T2 tumor stage, TET3 methylation showed a significant association with the OR for recurrence (OR = 2.64, 95% CI: 1.21–5.75, P = 0.014).
The ORs for recurrence were also determined based on the tumor origin for four sites in this study: the hypopharynx, larynx, oropharynx, and the oral cavity. For patients with oropharyngeal cancers with a methylated TET3 promoter, the OR was 3.55 (95% CI: 1.01–12.44; P = 0.047). In patients with oral cancer and a methylated TET3 promoter, the adjusted OR for recurrence was 2.63 (95% CI: 1.11–6.24, P = 0.027) (Figure 5).
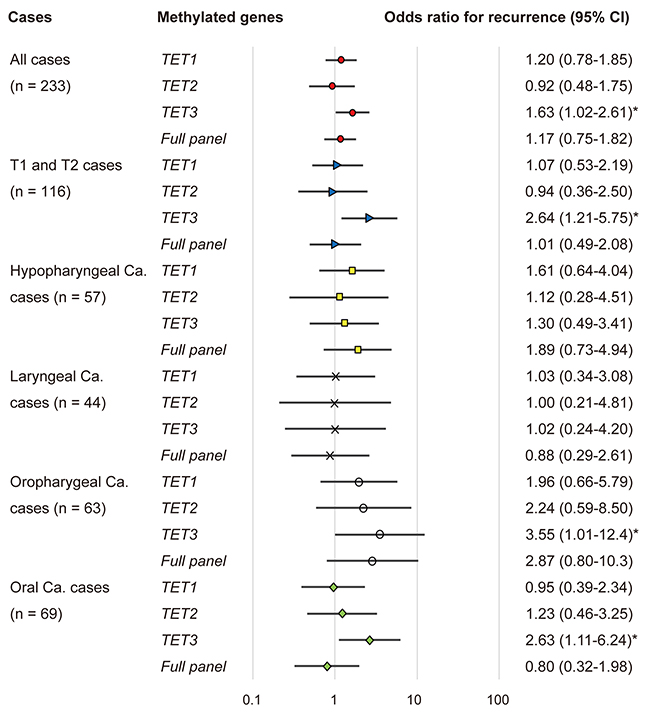
Figure 5: Odds ratios for recurrence based on the Cox proportional hazards model adjusted for age (65 years & older vs. < 65 years), HPV status, smoking status, alcohol exposure, and tumor stage (I, II or III, IV). Cox proportional hazards model, revealing the estimated odds of recurrence associated with TET1, TET2 and TET3 methylation; CI: confidence interval. *: P < 0.05.
External validation of results using the cancer genome atlas (TCGA) database
Aberrant promoter methylation in TET family genes was detected in 516 HNSCC samples compared with 50 normal samples (Supplementary Figure 4). The average β values for TET3 methylation were significantly higher in HNSCC samples than those in normal samples (P < 0.001), whereas those for TET1 and TET2 were not.
DISCUSSION
This is the first study addressing the promoter CpG methylation-mediated silencing of TET family genes in HNSCC, which in turn leads to an increase in global methylation in tumor tissues. Clarifying the epigenetic regulation of TET family genes can provide insights into the mechanisms of tumorigenesis and the risk of disease recurrence in HNSCC. Additionally, our site-specific analysis found that hypermethylation of CpG islands in the TET3 promoter was independently associated with aggressive tumor behavior in oropharyngeal and oral cancers.
We found that TET1 and TET3 expression was lower in HNSCC than in normal cells and was associated with the level of promoter methylation. When normal cells are exposed to environmental carcinogens (e.g., chemical carcinogens and oncogenic viruses), DNMTs catalyze higher levels of DNA CpG methylation (5mC) [16, 17]. Elevated levels of 5mC at tumor suppressor gene (TSG) promoters lead to TSG silencing and functional inactivation, ultimately contributing to tumor initiation or progression [18]. Growing evidence suggests that impairment of TET-mediated DNA demethylation may contribute to oncogenesis [19]. Loss of TET activation through promoter methylation occurs in tumor cells, successively increasing 5mC levels and promoting TSG inactivation [18, 19]. The current study has shown that a similar phenomenon occurs in HNSCC tissues. Thus, the epigenetic inactivation of TET family genes is likely to be common in cancers, and to play an important role in carcinogenesis. Simultaneous analysis of the TET methylation status will allow us to better predict tumor-related events, assess biological behavior, and design targeted therapies for HNSCCs.
Exposure to several carcinogens, such as HPV, Helicobacter pylori, tobacco, and alcohol, has been associated with epigenetic gene inactivation in human cancers, e.g., those of the head and neck, esophagus, stomach, and cervix [20, 21]. Recently, oncogenic viruses such as HPV and EBV have been shown to evoke cancerous changes in the DNA methylome of the cell by increasing the activity of DNMTs, which methylate the DNA of the host genome as part of the tumorigenic pathway [22, 23]. Additionally, this increase in DNMT activity may lead to global DNA hypermethylation upon the loss of TET activity [13].
The TET family contains three members, i.e., TET1, TET2, and TET3, all of which share a high degree of homology with their C-terminal catalytic domain, suggesting that this family of enzymes may participate in a potentially novel mechanism underlying the regulation of DNA methylation [11, 24, 25]. The TET family consists of key molecules closely connecting 5mC and 5hmC [26]. Wild-type TET2 showed strong 5mC oxidation activity, converting a large amount of 5mC into 5hmC and a significant amount of 5fC and 5caC. In contrast, mutation of TET2 significantly decreased the enzymatic activity with a very low amount of 5hmC generated [27]. Thus, each TET may play a specific role depending on the cell type and the different sites of tumor development. A study of this type involving human specimens and utilizing high-throughput profiling platforms may be susceptible to measurement biases from a variety of sources. Our study is the first to suggest that the increased DNA methylation of TET family genes correlates with tumor progression and may promote the accumulation of aberrant methylation in head and neck cancers. Our analyses revealed that high TET3 methylation in tumors predicts poorer survival. Our findings suggest that such methylation markers could be used in clinical practice to distinguish patients that may benefit from adjuvant therapy after the initial surgical treatment; however, additional prospective studies are required to validate these genes in other groups of patients with HNSCC.
Decreased TET family gene expression in malignant solid tumors is reportedly due to mutation or aberrant DNA methylation [15, 18, 28]. A study of hepatocellular carcinoma observed decreased expression of TET1, but not TET2 and TET3 [29]. Moreover, decreased TET1 expression correlates with tumor progression and may serve as a potential prognostic biomarker in endometrial cancer [30]. Similarly, loss of 5hmC in gastric cancer was mainly correlated with the downregulation of TET1 [31]. In addition, TET2 promoter methylation, but not TET2 mutations, may represent an alternative mechanism of pathogenesis in low-grade gliomas lacking IDH1/2 mutations [32]. TET2 expression was significantly lower in esophageal squamous cell carcinoma and associated with 5hmC levels [33]. Furthermore, CpG methylation-induced silencing of TET2 and TET3 induced EMT-like progression and metastasis in melanoma [34]. Moreover, TET3 functions as a potent tumor suppressor downstream of the TLX nuclear receptor to regulate growth and self-renewal in glioblastoma [35]. Missense and truncating mutations in TET genes are present in nearly all solid tumor types at a relatively low frequency [13]. In the TCGA cohort of HNSCC, TET1, TET2 and TET3 mutations were identified in 9 of 510 patients (1.8%), 8 patients (1.6%) and 8 patients (1.6%), respectively [36]. However, the role of TET family genes, especially TET3, in the tumorigenesis of HNSCC remains largely unknown. Our findings provide evidence that TET3 methylation may represent a good biomarker for prediction of recurrence in early-stage head and neck cancers. Because increased frequency of DNA methylation in certain genes can determine the behavior of these tumors, it may be possible that HNSCC with TET3 methylation exhibits unique clinicopathological features compared to that without TET3 methylation. This finding may facilitate HNSCC screening and the development of surveillance algorithms.
In conclusion, TET family genes were identified as aberrantly methylated in patients with HNSCC. We demonstrated for the first time that TET mRNA is downregulated in HNSCC owing to DNA methylation; this may be a critical event in HNSCC progression. Importantly, the methylation patterns of these three genes in primary tumors may be used to identify patients with oral and oropharyngeal cancers that are at a higher risk of recurrence. The differences in global methylation patterns observed between TET methylation-positive and TET methylation-negative tumors, and their effects on the onset and progression of HNSCC, provide several testable hypotheses for further research.
MATERIALS AND METHODS
Tumor samples and cell lines
In total, 233 primary HNSCC samples were obtained from patients during surgery at the Department of Otolaryngology, Hamamatsu University School of Medicine. All patients provided written informed consent and the study protocol was approved by the Institutional Review Board of the Hamamatsu University School of Medicine. Clinical information, including age, sex, tumor site, smoking habit, alcohol consumption, tumor size, lymph node status, and stage grouping were obtained from the patients’ clinical records. The male:female patient ratio was 198:35. The mean age was 65.5 years (range = 32–92). Primary tumors were in the hypopharynx (n = 57), larynx (n = 44), oral cavity (n = 69), or oropharynx (n = 63). DNA and complementary DNA (cDNA) from 11 University of Michigan squamous cell carcinoma (UM-SCC) cell lines, 99F fibroblast and BDF fibroblast cell lines, and HOK-16B cells were provided by Dr. Thomas E. Carey of the University of Michigan.
RNA extraction and Q-RT-PCR
Total RNA was isolated using an RNeasy Plus Mini Kit (Qiagen, Hilden, Germany), and cDNA was synthesized using a ReverTra Ace qPCR RT Kit (Toyobo, Tokyo, Japan). The mRNA levels of TET1, TET2, TET3 and glyceraldehyde 3-phosphate dehydrogenase (GAPDH) were measured via Q-RT-PCR using SYBR Premix Ex Taq (Takara, Tokyo, Japan), the Takara Thermal Cycler Dice Real Time System TP8000 (Takara) and the primer sets presented in Supplementary Table 2. The data were analyzed using the ΔΔCt method.
Bisulfite treatment and Q-MSP analysis
Extraction and bisulfite conversion of genomic DNA from 233 primary HNSCC and 36 noncancerous mucosal samples were performed using the MethylEasy Xceed Rapid DNA Bisulfite Modification Kit (Takara) per manufacturer instructions [37]. The CpG island methylation levels in the promoters of the TET1, TET2, and TET3 genes were determined via Q-MSP with the Takara Thermal Cycler Dice Real Time System TP800 (Takara); the primer sets are listed in Supplementary Table 2. A standard curve was constructed by plotting known concentrations of serially diluted EpiScope Methylated HeLa gDNA (Takara). The NMV was determined as follows: NMV = (target gene-S/target gene-FM)/(ACTB-S/ACTB-FM), where target gene-S and target gene-FM represent target gene methylation levels in the tumor sample and universal methylated DNA control, respectively, and ACTB-S and ACTB-FM represent ACTB (which encodes β-actin) methylation levels in the sample and control, respectively. The analysis was performed using Thermal Cycler Dice Real Time System TP800 software (version 1.03A), according to the manufacturer’s instructions [38]. To analyze the methylation status of CCBE1 [39], SALL3 [40], TAC1 [41], DCC [42], GALR1 [43], DAPK [44], COL1A2 [45], GALR2 [43], CDH1 [46], RASSF1A [46], MGMT [44], CDH13 [47], and p16 [46], primers and conditions were as previously described.
Analysis of HPV status
The HPV status was evaluated using the HPV Typing Set (Takara Bio., Tokyo, Japan), a PCR primer set specifically designed to identify HPV genotypes -16, -18, -31, -33, -35, -52 and -58 in genomic DNA. The PCR HPV Typing Set method was performed according to the manufacturer’s protocol. The PCR products were separated using 9% polyacrylamide gel electrophoresis and stained with ethidium bromide.
Collection of publicly available data from TCGA
Data on aberrant DNA methylation from the TCGA (available in November 2017) were collected from MethHC, a DNA methylation and gene expression database for human cancers (http://methhc.mbc.nctu.edu.tw/php/index.php) [48]. The DNA methylation data were collected using the Infinium HumanMethylation450 platform (Illumina, Inc., San Diego, CA, USA) and are presented as β values.
Data analysis and statistics
Q-MSP results and patient characteristics (age of onset, sex, alcohol consumption, smoking status, tumor size, tumor stage, clinical stage, lymph node status, and recurrence) were compared using Student’s t-test. Receiver-operator characteristic (ROC) curve analyses were performed using the NMVs for 36 HNSCC and 36 adjacent normal mucosal samples and the Stata/SE 13.0 system (Stata Corporation, TX, USA). The area under the ROC curve indicated the optimal sensitivity and specificity cutoff levels for distinguishing between the methylation levels in normal and HNSCC tissues; the NMV thresholds were calculated for each target gene (Supplementary Figure 1). The cutoff values were used to determine the methylation frequencies of the target genes. The overall methylation values in individual samples were determined by calculating the MI. TE-MI and the methylation index of TS-MI were defined as the ratio of the number of methylated genes to the number of tested genes in each sample [38].
DFS was measured from the date of the initial treatment to the date of diagnosis with locoregional recurrence or distant metastasis. The Kaplan-Meier test was used to calculate survival probabilities, and the log-rank test was used to compare survival rates. The prognostic value of the methylation status was assessed by performing a multivariate Cox proportional hazards analysis adjusted for age (≥ 65 versus < 65 years), HPV status, smoking status, alcohol intake, and tumor stage (I and II versus III and IV). The Schoenfeld residuals test used in assessing the proportional hazard assumption was used to determine the goodness of fit [49]. Differences with P < 0.05 were considered significant. Statistical analyses were performed using StatMate IV software (ATMS Co. Ltd., Tokyo, Japan) and the Stata/SE 13.0 system (Stata Corporation, TX, USA).
Abbreviations
TET: ten-eleven translocation; HNSCC: head and neck squamous cell cancer; TE-MI: TET methylation index; DNMTs: DNA methyltransferases; 5mC: 5-methylcytosine; 5hmC: 5-hydroxymethylcytosine; 5fC: 5-formylcytosine; 5caC: 5-carboxylcytosine; UM-SCC: University of Michigan squamous cell carcinoma; cDNA: complementary DNA; GAPDH: glyceraldehyde 3-phosphate dehydrogenase; NMV: normalized methylation value; ACTB: β-actin; HPV: human papilloma virus; TCGA: The Cancer Genome Atlas; ROC: Receiver operating characteristic; MI: methylation index; TS-MI: the methylation index of 13 tumor suppressor genes; DFS: disease-free survival; OR: odds ratio; CI: confidence interval.
Author contributions
Conceptualization: KM, Methodology: KM, Software: YM, TK, Validation: AI, Formal analysis: DM, Investigation: TK, SE, Resources: MM, Resources: HM, MM, Writing – original draft: KM, Writing – review and editing: TK, Visualization: KM, Supervision: HM, Project administration: KM, Funding acquisition: KM.
ACKNOWLEDGMENTS
We thank Ms. Yuko Mohri for technical assistance.
CONFLICTS OF INTEREST
No potential conflicts of interest are disclosed.
FUNDING
This work was supported by Grants-in-Aid for Scientific Research (nos. 16K11228, 16K20239, 17K11380, 17K16903 and 17K16904) from the Ministry of Education, Culture, Sports, Science, and Technology of Japan.
REFERENCES
1. Arantes LM, de Carvalho AC, Melendez ME, Carvalho AL, Goloni-Bertollo EM. Methylation as a biomarker for head and neck cancer. Oral Oncol. 2014; 50:587–92. https://doi.org/10.1016/j.oraloncology.2014.02.015.
2. Kumar B, Cordell KG, Lee JS, Worden FP, Prince ME, Tran HH, Wolf GT, Urba SG, Chepeha DB, Teknos TN, Eisbruch A, Tsien CI, Taylor JM, et al. EGFR, p16, HPV Titer, Bcl-xL and p53, sex, and smoking as indicators of response to therapy and survival in oropharyngeal cancer. J Clin Oncol. 2008; 26:3128–37. https://doi.org/10.1200/JCO.2007.12.7662.
3. Argiris A, Karamouzis MV, Raben D, Ferris RL. Head and neck cancer. Lancet. 2008; 371:1695–709. https://doi.org/10.1016/S0140-6736(08)60728-X.
4. Kanazawa T, Misawa K, Misawa Y, Uehara T, Fukushima H, Kusaka G, Maruta M, Carey TE. G-protein-coupled receptors: next generation therapeutic targets in head and neck cancer? Toxins (Basel). 2015; 7:2959–84. https://doi.org/10.3390/toxins7082959.
5. Marsit CJ, Posner MR, McClean MD, Kelsey KT. Hypermethylation of E-cadherin is an independent predictor of improved survival in head and neck squamous cell carcinoma. Cancer. 2008; 113:1566–71. https://doi.org/10.1002/cncr.23770.
6. Jin B, Robertson KD. DNA methyltransferases, DNA damage repair, and cancer. Adv Exp Med Biol. 2013; 754:3–29. https://doi.org/10.1007/978-1-4419-9967-2_1.
7. Subramaniam D, Thombre R, Dhar A, Anant S. DNA methyltransferases: a novel target for prevention and therapy. Front Oncol. 2014; 4:80. https://doi.org/10.3389/fonc.2014.00080.
8. Sartor MA, Dolinoy DC, Jones TR, Colacino JA, Prince ME, Carey TE, Rozek LS. Genome-wide methylation and expression differences in HPV(+) and HPV(-) squamous cell carcinoma cell lines are consistent with divergent mechanisms of carcinogenesis. Epigenetics. 2011; 6:777–87.
9. Tahiliani M, Koh KP, Shen Y, Pastor WA, Bandukwala H, Brudno Y, Agarwal S, Iyer LM, Liu DR, Aravind L, Rao A. Conversion of 5-methylcytosine to 5-hydroxymethylcytosine in mammalian DNA by MLL partner TET1. Science. 2009; 324:930–5. https://doi.org/10.1126/science.1170116.
10. Ito S, Shen L, Dai Q, Wu SC, Collins LB, Swenberg JA, He C, Zhang Y. Tet proteins can convert 5-methylcytosine to 5-formylcytosine and 5-carboxylcytosine. Science. 2011; 333:1300–3. https://doi.org/10.1126/science.1210597.
11. Ito S, D’Alessio AC, Taranova OV, Hong K, Sowers LC, Zhang Y. Role of Tet proteins in 5mC to 5hmC conversion, ES-cell self-renewal and inner cell mass specification. Nature. 2010; 466:1129–33. https://doi.org/10.1038/nature09303.
12. He YF, Li BZ, Li Z, Liu P, Wang Y, Tang Q, Ding J, Jia Y, Chen Z, Li L, Sun Y, Li X, Dai Q, et al. Tet-mediated formation of 5-carboxylcytosine and its excision by TDG in mammalian DNA. Science. 2011; 333:1303–7. https://doi.org/10.1126/science.1210944.
13. Rasmussen KD, Helin K. Role of TET enzymes in DNA methylation, development, and cancer. Genes Dev. 2016; 30:733–50. https://doi.org/10.1101/gad.276568.115.
14. Huang Y, Rao A. Connections between TET proteins and aberrant DNA modification in cancer. Trends Genet. 2014; 30:464–74. https://doi.org/10.1016/j.tig.2014.07.005.
15. Ichimura N, Shinjo K, An B, Shimizu Y, Yamao K, Ohka F, Katsushima K, Hatanaka A, Tojo M, Yamamoto E, Suzuki H, Ueda M, Kondo Y. Aberrant TET1 methylation closely associated with CpG island methylator phenotype in colorectal cancer. Cancer Prev Res (Phila). 2015; 8:702–11. https://doi.org/10.1158/1940-6207.CAPR-14-0306.
16. Ravegnini G, Sammarini G, Hrelia P, Angelini S. Key genetic and epigenetic mechanisms in chemical carcinogenesis. Toxicol Sci. 2015; 148:2–13. https://doi.org/10.1093/toxsci/kfv165.
17. Roy DM, Walsh LA, Chan TA. Driver mutations of cancer epigenomes. Protein Cell. 2014; 5:265–96. https://doi.org/10.1007/s13238-014-0031-6.
18. Li L, Li C, Mao H, Du Z, Chan WY, Murray P, Luo B, Chan AT, Mok TS, Chan FK, Ambinder RF, Tao Q. Epigenetic inactivation of the CpG demethylase TET1 as a DNA methylation feedback loop in human cancers. Sci Rep. 2016; 6:26591. https://doi.org/10.1038/srep26591.
19. Wu H, Zhang Y. Reversing DNA methylation: mechanisms, genomics, and biological functions. Cell. 2014; 156:45–68. https://doi.org/10.1016/j.cell.2013.12.019.
20. Smith EM, Rubenstein LM, Haugen TH, Pawlita M, Turek LP. Complex etiology underlies risk and survival in head and neck cancer human papillomavirus, tobacco, and alcohol: a case for multifactor disease. J Oncol. 2012; 2012: 571862. https://doi.org/10.1155/2012/571862.
21. Smith EM, Rubenstein LM, Haugen TH, Hamsikova E, Turek LP. Tobacco and alcohol use increases the risk of both HPV-associated and HPV-independent head and neck cancers. Cancer Causes Control. 2010; 21:1369–78. https://doi.org/10.1007/s10552-010-9564-z.
22. van Kempen PM, Noorlag R, Braunius WW, Stegeman I, Willems SM, Grolman W. Differences in methylation profiles between HPV-positive and HPV-negative oropharynx squamous cell carcinoma: a systematic review. Epigenetics. 2014; 9:194–203. https://doi.org/10.4161/epi.26881.
23. Kaneda A, Matsusaka K, Aburatani H, Fukayama M. Epstein-Barr virus infection as an epigenetic driver of tumorigenesis. Cancer Res. 2012; 72:3445–50. https://doi.org/10.1158/0008-5472.CAN-11-3919.
24. Iyer LM, Tahiliani M, Rao A, Aravind L. Prediction of novel families of enzymes involved in oxidative and other complex modifications of bases in nucleic acids. Cell Cycle. 2009; 8:1698–710. https://doi.org/10.4161/cc.8.11.8580.
25. Lu X, Zhao BS, He C. TET family proteins: oxidation activity, interacting molecules, and functions in diseases. Chem Rev. 2015; 115:2225–39. https://doi.org/10.1021/cr500470n.
26. Ye C, Li L. 5-hydroxymethylcytosine: a new insight into epigenetics in cancer. Cancer Biol Ther. 2014; 15:10–5. https://doi.org/10.4161/cbt.27144.
27. Hu L, Li Z, Cheng J, Rao Q, Gong W, Liu M, Shi YG, Zhu J, Wang P, Xu Y. Crystal structure of TET2-DNA complex: insight into TET-mediated 5mC oxidation. Cell. 2013; 155:1545–55. https://doi.org/10.1016/j.cell.2013.11.020.
28. Mohr F, Dohner K, Buske C, Rawat VP. TET genes: new players in DNA demethylation and important determinants for stemness. Exp Hematol. 2011; 39:272–81. https://doi.org/10.1016/j.exphem.2010.12.004.
29. Liu C, Liu L, Chen X, Shen J, Shan J, Xu Y, Yang Z, Wu L, Xia F, Bie P, Cui Y, Bian XW, Qian C. Decrease of 5-hydroxymethylcytosine is associated with progression of hepatocellular carcinoma through downregulation of TET1. PLoS One. 2013; 8: e62828. https://doi.org/10.1371/journal.pone.0062828.
30. Ciesielski P, Jozwiak P, Wojcik-Krowiranda K, Forma E, Cwonda L, Szczepaniec S, Bienkiewicz A, Brys M, Krzeslak A. Differential expression of ten-eleven translocation genes in endometrial cancers. Tumour Biol. 2017; 39:1010428317695017. https://doi.org/10.1177/1010428317695017.
31. Du C, Kurabe N, Matsushima Y, Suzuki M, Kahyo T, Ohnishi I, Tanioka F, Tajima S, Goto M, Yamada H, Tao H, Shinmura K, Konno H, et al. Robust quantitative assessments of cytosine modifications and changes in the expressions of related enzymes in gastric cancer. Gastric Cancer. 2015; 18:516–25. https://doi.org/10.1007/s10120-014-0409-4.
32. Kim YH, Pierscianek D, Mittelbronn M, Vital A, Mariani L, Hasselblatt M, Ohgaki H. TET2 promoter methylation in low-grade diffuse gliomas lacking IDH1/2 mutations. J Clin Pathol. 2011; 64:850–2. https://doi.org/10.1136/jclinpath-2011-200133.
33. Murata A, Baba Y, Ishimoto T, Miyake K, Kosumi K, Harada K, Kurashige J, Iwagami S, Sakamoto Y, Miyamoto Y, Yoshida N, Yamamoto M, Oda S, et al. TET family proteins and 5-hydroxymethylcytosine in esophageal squamous cell carcinoma. Oncotarget. 2015; 6:23372–82. https://doi.org/10.18632/oncotarget.4281.
34. Gong F, Guo Y, Niu Y, Jin J, Zhang X, Shi X, Zhang L, Li R, Chen L, Ma RZ. Epigenetic silencing of TET2 and TET3 induces an EMT-like process in melanoma. Oncotarget. 2017; 8:315–28. https://doi.org/10.18632/oncotarget.13324.
35. Cui Q, Yang S, Ye P, Tian E, Sun G, Zhou J, Liu X, Chen C, Murai K, Zhao C, Azizian KT, Yang L, Warden C, et al. Downregulation of TLX induces TET3 expression and inhibits glioblastoma stem cell self-renewal and tumorigenesis. Nat Commun. 2016; 7:10637. https://doi.org/10.1038/ncomms10637.
36. Cancer Genome Atlas Network. Comprehensive genomic characterization of head and neck squamous cell carcinomas. Nature. 2015; 517:576–82. https://doi.org/10.1038/nature14129.
37. Misawa K, Imai A, Mochizuki D, Misawa Y, Endo S, Hosokawa S, Ishikawa R, Mima M, Shinmura K, Kanazawa T, Mineta H. Genes encoding neuropeptide receptors are epigenetic markers in patients with head and neck cancer: a site-specific analysis. Oncotarget. 2017; 8:76318–28. https://doi.org/10.18632/oncotarget.19356.
38. Misawa K, Mochizuki D, Imai A, Endo S, Mima M, Misawa Y, Kanazawa T, Carey TE, Mineta H. Prognostic value of aberrant promoter hypermethylation of tumor-related genes in early-stage head and neck cancer. Oncotarget. 2016; 7:26087–98. https://doi.org/10.18632/oncotarget.8317.
39. Misawa K, Mochizuki D, Imai A, Mima M, Misawa Y, Mineta H. Analysis of site-specific methylation of tumor-related genes in head and neck cancer: potential utility as biomarkers for prognosis. Cancers (Basel). 2018; 10. https://doi.org/10.3390/cancers10010027.
40. Misawa K, Mochizuki D, Imai A, Misawa Y, Endo S, Mima M, Kawasaki H, Carey TE, Kanazawa T. Epigenetic silencing of SALL3 is an independent predictor of poor survival in head and neck cancer. Clin Epigenetics. 2017; 9:64. https://doi.org/10.1186/s13148-017-0363-1.
41. Misawa K, Kanazawa T, Misawa Y, Imai A, Uehara T, Mochizuki D, Endo S, Takahashi G, Mineta H. Frequent promoter hypermethylation of tachykinin-1 and tachykinin receptor type 1 is a potential biomarker for head and neck cancer. J Cancer Res Clin Oncol. 2013; 139:879–89. https://doi.org/10.1007/s00432-013-1393-5.
42. Lee EJ, Lee BB, Han J, Cho EY, Shim YM, Park J, Kim DH. CpG island hypermethylation of E-cadherin (CDH1) and integrin alpha4 is associated with recurrence of early stage esophageal squamous cell carcinoma. Int J Cancer. 2008; 123:2073–9. https://doi.org/10.1002/ijc.23598.
43. Misawa Y, Misawa K, Kanazawa T, Uehara T, Endo S, Mochizuki D, Yamatodani T, Carey TE, Mineta H. Tumor suppressor activity and inactivation of galanin receptor type 2 by aberrant promoter methylation in head and neck cancer. Cancer. 2014; 120:205–13. https://doi.org/10.1002/cncr.28411.
44. Martone T, Gillio-Tos A, De Marco L, Fiano V, Maule M, Cavalot A, Garzaro M, Merletti F, Cortesina G. Association between hypermethylated tumor and paired surgical margins in head and neck squamous cell carcinomas. Clin Cancer Res. 2007; 13:5089–94. https://doi.org/10.1158/1078-0432.CCR-07-0119.
45. Misawa K, Kanazawa T, Misawa Y, Imai A, Endo S, Hakamada K, Mineta H. Hypermethylation of collagen alpha2 (I) gene (COL1A2) is an independent predictor of survival in head and neck cancer. Cancer Biomark. 2011; 10:135–44. https://doi.org/10.3233/CBM-2012-0242.
46. Kristensen LS, Mikeska T, Krypuy M, Dobrovic A. Sensitive Melting Analysis after Real Time- Methylation Specific PCR (SMART-MSP): high-throughput and probe-free quantitative DNA methylation detection. Nucleic Acids Res. 2008; 36:e42. https://doi.org/10.1093/nar/gkn113.
47. Jin Z, Cheng Y, Olaru A, Kan T, Yang J, Paun B, Ito T, Hamilton JP, David S, Agarwal R, Selaru FM, Sato F, Abraham JM, et al. Promoter hypermethylation of CDH13 is a common, early event in human esophageal adenocarcinogenesis and correlates with clinical risk factors. Int J Cancer. 2008; 123:2331–6. https://doi.org/10.1002/ijc.23804.
48. Huang WY, Hsu SD, Huang HY, Sun YM, Chou CH, Weng SL, Huang HD. MethHC: a database of DNA methylation and gene expression in human cancer. Nucleic Acids Res. 2015; 43:D856–61. https://doi.org/10.1093/nar/gku1151.
49. Schoenfeld D. The asymptotic properties of nonparametric tests for comparing survival distributions. Biometrika. 1981; 68:316–9. https://doi.org/10.1093/biomet/68.1.316.