
INTRODUCTION
Prostate cancer (PCa) remains the most common cancer and a leading cause of cancer-related death in men, with the most new patients diagnosed with the disease last year [1]. Despite the majority of prostate cancer patients are diagnosed at a potentially curable stage and treated with radical prostatectomy or other first-line treatments, a subset of patients will experience a recurrence, typically detected by a rise in serum prostate-specific antigen (PSA) levels [2, 3]. Biochemical recurrence (BCR) is a well-established predictor of clinical recurrence and metastasis of PCa, which is widely used as an early end point to define the treatment success. The ability to predict the risk of BCR soon after surgery could allow for initiation of secondary therapy as necessary to improve long term treatment outcomes [4, 5]. However, current clinicopathological models, which incorporate parameters such as PSA concentration, Gleason score and positive lymph nodes, are insufficient to accurately define BCR across all treatment modalities [6, 7]. Therefore, the prediction of the likelihood of BCR is critical for surveillance strategy of PCa patients and the molecular underpinnings of aggressive and indolent cancers may be essential to improve patient management and prognosis [8].
Recent studies demonstrated the utility of gene expression-based signatures in the prognosis [9, 10]. Currently, the roles of the long non-coding RNAs (lncRNAs) in human cancers have received considerable attention [11, 12]. Accumulating evidences suggest that lncRNAs are frequently aberrantly expressed in cancers and typically exhibit tissue-specific expression patterns, which may be essential players in tumorigenesis [13–15]. Moreover, lncRNA expression may confer clinical information about disease outcomes and have utility as biomarkers in diagnosis and prognostication [16, 17]. In PCa, the lack of appropriate sensitive and specific biomarkers makes lncRNAs promising novel biomarkers as well as therapeutic targets for the disease [18–20]. Thus, exploring a lncRNA signature for diagnosis and risk stratification would be valuable to improve management of PCa patients.
Here, by using large independent patient cohorts, we identified an eight-lncRNA signature with the ability to predict the BCR of patients with PCa and demonstrated that the lncRNA signature could be used as an independent prognostic factor and improve risk stratification of current prognostic models.
RESULTS
Transcriptome analysis reveals consistently dysregulated lncRNAs in three PCa cohorts
Patients with pathologically confirmed PCa and corresponding clinical data from the Cancer Genome Atlas (TCGA) were included in our study. After removal of patients without recurrence status a total of 307 patients were recruited and randomly assigned into training (184 patients) and validation (123 patients) sets. Based on the transcriptome profiles of 50 paired PCa and matched adjacent normal tissues from the training set, we identified 2,906 lncRNAs that were differentially expressed (FDR < 0.05 and fold change > 1.2). To further extract a core lncRNA gene set related to clinical outcomes in patients with PCa, we performed an integrative transcriptome analysis using another two cohorts: (1) transcriptome sequencing of 14 primary tumors and adjacent normal pairs from Ren et al. [21] and (2) exon arrays of 47 primary and 48 normal tissues from Brase et al. [22]. We identified 1522 and 2410 differentially expressed genes between tumors and control for these two cohorts, respectively (FDR < 0.05 and fold change > 1.2, see Materials and methods). Across all three cohorts, 142 lncRNAs were found to be consistently altered, which were used in the following analysis (Supplementary Figure 1 and Supplementary Table 1).
Identification of an eight-lncRNA signature associated with BCR-free survival
By subjecting the expression levels of the consistently altered lncRNAs of the training cohort to univariate Cox regression analysis, we identified eight lncRNAs that were significantly related to BCR-free survival (Table 1, P < 0.05). Among the eight lncRNAs, the higher expression of one lncRNA (AC005632.2) was strongly associated with longer BCR-free survival, whereas for the others (PCAT7, SLC12A9-AS1, RGMB-AS1, PCAT1, AP002992.1, AC025265.1, LINC00593), the higher expression of them were associated with shorter BCR-free survival. Based on the risk score formula (see Methods), the eight-lncRNA signature risk score for each patient in the training cohort was computed. Patients were divided into a high-risk group (n = 92) and a low-risk group (n = 92) using the median of risk scores as the cutoff point.
Table 1: LncRNAs significantly associated with the BCR-free survival in the training cohort (n = 184)
Gene symbol |
Chromosomal position |
P value |
Hazard ratio (95% CI) |
Coefficient |
|---|---|---|---|---|
PCAT7 |
chr9:94555069–94568127 |
0.009 |
1.58 (1.12–2.22) |
0.45666 |
SLC12A9-AS1 |
chr7:100837314–100852616 |
0.025 |
1.30 (1.03–1.63) |
0.26201 |
RGMB-AS1 |
chr5:98769618–98773469 |
0.041 |
1.10 (1.004–1.22) |
0.09976 |
PCAT1 |
chr8:126847055–127021014 |
0.006 |
1.17 (1.05–1.32) |
0.16082 |
AP002992.1 |
chr11:68122053–68130518 |
0.0003 |
3.39 (1.74–6.58) |
1.22014 |
AC025265.1 |
chr12:103746315–103768858 |
0.016 |
1.58 (1.09–2.30) |
0.45910 |
LINC00593 |
chr15:69835234–69843120 |
0.028 |
5.10 (1.19–21.84) |
1.62870 |
AC005632.2 |
chr16:21626742–21627569 |
0.025 |
0.003 (0.000019–0.49) |
–5.80340 |
P-values are calculated from the univariable Cox regression analysis.
Prognostic value of the eight-lncRNA signature in the training, validation and combined sets
To evaluate the prognostic effect of the eight-lncRNA signature on BCR-free survival, we first used Kaplan-Meier analysis to examine the differences in BCR-free survival of the PCa patients in the high-risk and low-risk groups. In the training cohort, patients in the high-risk group had shorter BCR-free survival time than patients in the low-risk group (Figure 1A, log-rank test, P = 0.0007). By using the same risk formula, patients in the validation cohort (n = 123) and the entire TCGA PCa cohort (n = 307) were classified into high-risk or low-risk group and similar results were also found (validation cohort: Figure 1B, log-rank test, P = 0.041; entire TCGA PCa cohort: Figure 1C, log-rank test, P = 0.0001). In consistence with the findings described above, univariate Cox regression analysis also found that patients with a high eight-lncRNA risk score had significantly shorter BCR-free survival time than patients with a low score in all three cohorts (training cohort: HR = 2.19, 95% CI = 1.67–2.88, P < 0.0001; validation cohort: HR = 1.37, 95% CI = 1.09–1.71, P = 0.006; entire TCGA PCa cohort: HR = 1.51, 95% CI =1.32–1.72, P < 0.0001) (Table 2). By investigating the distribution of the eight-lncRNA risk score, patients’ survival status and the lncRNA expression, we showed that PCa patients with high prognostic scores tended to have BCR and express high levels of risky lncRNAs (PCAT7, SLC12A9-AS1, RGMB-AS1, PCAT1, AP002992.1, AC025265.1, LINC00593), whereas those with low scores tended to express the protective lncRNA (AC005632.2) (Figure 2).
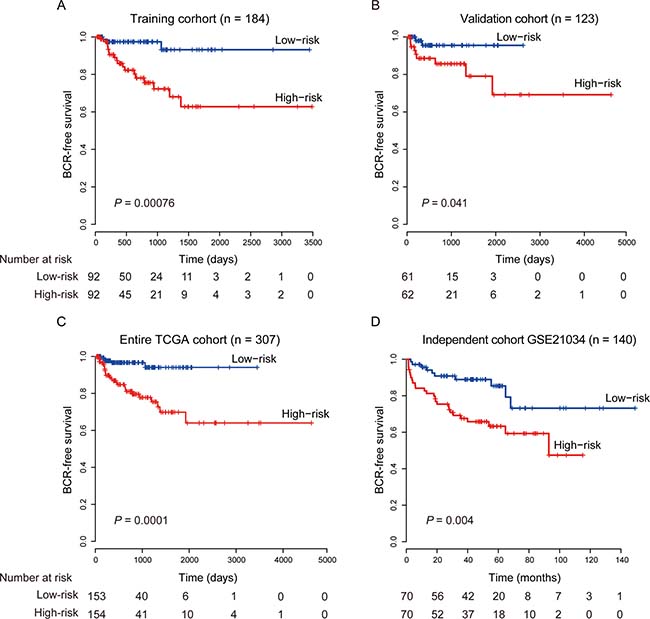
Figure 1: Kaplan–Meier estimates of the BCR-free survival of PCa patients using the eight-lncRNA signature. (A) Training cohort (n = 184). (B) Validation cohort (n = 123). (C) Entire TCGA cohort (n = 307). (D) Independent cohort GSE21034 (n = 140). The differences between the two curves were determined by the two-side log-rank test.
Table 2: Univariate and multivariate Cox regression analysis in the training, validation and entire cohorts
Predictors |
Univariate analysis |
Multivariate analysis |
||
|---|---|---|---|---|
HR (95% CI) |
p value |
HR (95% CI) |
p value |
|
Training cohort (N = 184) |
||||
Risk score |
2.19 (1.67–2.88) |
<0.0001 |
2.19 (1.49–3.22) |
<0.0001 |
Age, yr |
1.03 (0.96–1.10) |
0.48 |
1.08 (0.96–1.21) |
0.21 |
Gleason score |
0.02 |
0.06 |
||
≤7 |
1.00 (Ref.) |
1.00 (Ref.) |
||
≥8 |
2.82 (1.19–6.72) |
3.298 (0.94–11.596) |
||
T stage |
0.01 |
0.75 |
||
T2a-c |
1.00 (Ref.) |
1.00 (Ref.) |
||
T3a-c + T4 |
6.59 (1.53–28.36) |
1.33 (0.23–7.78) |
||
N stage |
0.03 |
0.57 |
||
N0 |
1.00 (Ref.) |
1.00 (Ref.) |
||
N1 |
3.00 (1.14–7.92) |
1.42 (0.43–4.70) |
||
Lymph Node(s) Examined Number |
1.05 (1.02–1.09) |
0.003 |
1.04 (0.997–1.09) |
0.068 |
Positive lymph node |
0.01 |
NA |
||
0 |
1.00 (Ref.) |
1.00 (Ref.) |
||
>0 |
3.60 (1.30–9.95) |
NA |
||
Surgical margin status |
0.67 |
0.588 |
||
Negative |
1.00 (Ref.) |
1.00 (Ref.) |
||
Positive |
1.23 (0.48–3.17) |
1.44 (0.386–5.366) |
||
AKT1 |
0.65 (0.195–2.14) |
0.47 |
2.19 (0.03–3.24) |
0.33 |
BCL2 |
0.857 (0.55–1.34) |
0.499 |
2.04 (1.01–4.098) |
0.046 |
CCL4 |
0.797 (0.577–1.099) |
0.166 |
0.84 (0.498–1.42) |
0.52 |
KLK2 |
1.65 (0.785–3.47) |
0.186 |
2.66 (0.82–8.69) |
0.105 |
Validation cohort (N = 123) |
||||
Risk score |
1.37 (1.09–1.71) |
0.006 |
1.67 (1.06–2.63) |
0.027 |
Age, yr |
1.01 (0.93–1.10) |
0.75 |
1.03 (0.93–1.14) |
0.61 |
Gleason score |
0.004 |
0.035 |
||
≤7 |
1.00 (Ref.) |
1.00 (Ref.) |
||
≥8 |
9.25 (2.00–42.87) |
7.076 (1.14–43.78) |
||
T stage |
0.09 |
0.67 |
||
T2a-c |
1.00 (Ref.) |
1.00 (Ref.) |
||
T3a-c + T4 |
3.79 (0.81–17.78) |
1.58 (0.19–13.34) |
||
N stage |
0.04 |
0.03 |
||
N0 |
1.00 (Ref.) |
1.00 (Ref.) |
||
N1 |
3.65 (1.06–12.57) |
6.91 (1.15–41.42) |
||
Lymph Node(s) Examined Number |
1.02 (0.97–1.06) |
0.37 |
0.987 (0.92–1.06) |
0.71 |
Positive lymph node |
0.047 |
NA |
||
0 |
1.00 (Ref.) |
1.00 (Ref.) |
||
>0 |
3.48 (1.01–11.98) |
NA |
||
Surgical margin status |
0.64 |
0.03 |
||
Negative |
1.00 (Ref.) |
1.00 (Ref.) |
||
Positive |
0.72 (0.19–2.75) |
0.096 (0.012–0.77) |
||
AKT1 |
0.84 (0.11–6.39) |
0.865 |
0.65 (0.051–8.29) |
0.74 |
BCL2 |
0.76 (0.41–1.41) |
0.38 |
0.61 (0.24–1.56) |
0.30 |
CCL4 |
0.82 (0.50–1.35) |
0.44 |
0.94 (0.47–1.91) |
0.87 |
KLK2 |
0.65 (0.28–1.45) |
0.29 |
0.21 (0.055–0.83) |
0.026 |
Entire cohort (N = 307) |
||||
Risk score |
1.51 (1.32–1.72) |
<0.0001 |
1.61 (1.24–2.07) |
0.0003 |
Age, yr |
1.02 (0.97–1.08) |
0.48 |
1.04 (0.98–1.11) |
0.17 |
Gleason score |
0.0002 |
0.07 |
||
≤7 |
1.00 (Ref.) |
1.00 (Ref.) |
||
≥8 |
4.10 (1.97–8.50) |
2.25 (0.93–5.47) |
||
T stage |
0.002 |
0.28 |
||
T2a-c |
1.00 (Ref.) |
1.00 (Ref.) |
||
T3a-c + T4 |
5.27 (1.84–15.08) |
1.97 (0.58–6.77) |
||
N stage |
0.003 |
0.03 |
||
N0 |
1.00 (Ref.) |
1.00 (Ref.) |
||
N1 |
3.18 (1.49–6.81) |
2.78 (1.10–7.07) |
||
Lymph Node(s) Examined Number |
1.03 (1.01–1.06) |
0.008 |
0.994 (0.96–1.03) |
0.75 |
Positive lymph node |
0.002 |
NA |
||
0 |
1.00 (Ref.) |
1.00 (Ref.) |
||
>0 |
3.50 (1.60–7.65) |
NA |
||
Surgical margin status |
0.90 |
0.03 |
||
Negative |
1.00 (Ref.) |
1.00 (Ref.) |
||
Positive |
0.95 (0.44–2.06) |
0.35 (0.13–0.92) |
||
AKT1 |
0.69 (0.24–1.9995) |
0.50 |
0.899 (0.24–3.30) |
0.87 |
BCL2 |
0.82 (0.57–1.186) |
0.297 |
1.03 (0.64–1.68) |
0.89 |
CCL4 |
0.78 (0.597–1.03) |
0.082 |
0.90 (0.63–1.30) |
0.59 |
KLK2 |
1.09 (0.66–1.81) |
0.73 |
1.04 (0.59–1.86) |
0.88 |
HR, hazard ratio; CI, confidence interval.
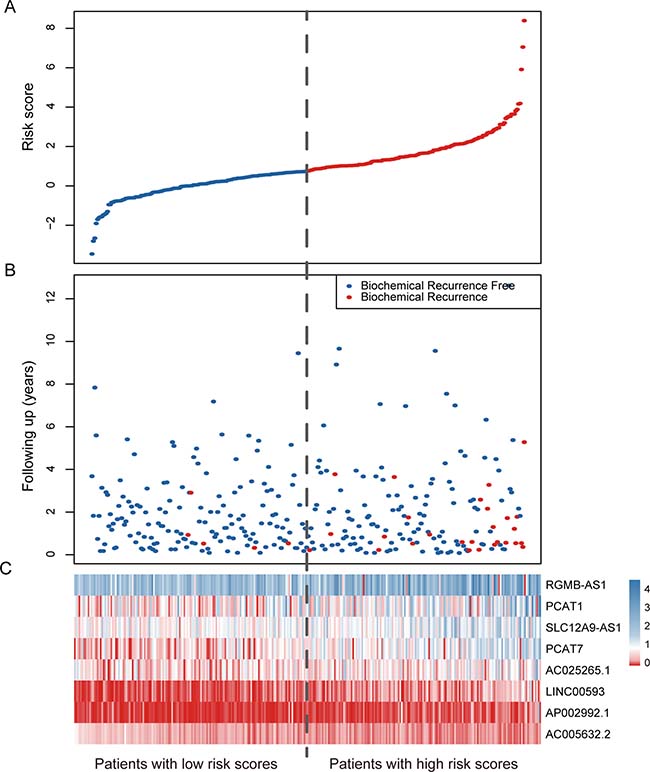
Figure 2: LncRNA risk score analysis of the entire TCGA cohort. (A) The distribution of the eight-lncRNA risk score. (B) Patients’ BCR status and time. (C) Heatmap of the eight lncRNA expression profiles. The dotted line represents the median lncRNA risk score cutoff dividing patient into low-risk and high-risk groups.
Further validation of the eight-lncRNA signature in another independent PCa cohort
We further validated the prognostic power of the eight-lncRNA signature in another independent PCa cohort from GEO accession GSE21034 (n = 140) [23]. According to our risk formula, the patients were classified as high-risk (n = 70) or low-risk (n = 70) groups. Consistent with the findings in the TCGA cohorts, patients in the high-risk group suffered significantly poor BCR-free survival than those in the low-risk group (Figure 1D, log-rank test, P = 0.004). The results in the univariate Cox regression model also showed that the eight-lncRNA signature was significantly associated with BCR-free survival in this independent cohort (Table 2, HR = 1.16, 95% CI = 1.07–1.27, P = 0.0005).
Prognostic value of the eight-lncRNA signature is independent of clinical and pathological factors
To investigate whether the eight-lncRNA signature is an independent predictor of prognosis, additional clinicopathological factors in the TCGA cohort, such as age, Gleason score, T stage, positive lymph node (LN) and four known biomarkers [24–27], were analyzed in a multivariate Cox regression model. The results showed that the eight-lncRNA signature remained to be significantly associated with BCR-free survival in both training and validation cohort, while other factors in the model were not (Table 2, HR = 2.19, 95% CI = 1.49–3.22, P < 0.0001 and HR = 1.67, 95% CI = 1.06–2.63, P = 0.027, respectively). And the results from the entire cohort showed that the eight-lncRNA signature (HR = 1.61, 95% CI = 1.24–2.07, P = 0.0003), as well as N stage (HR = 2.78, 95% CI = 1.10–7.07, P = 0.03) and Surgical margin status (HR = 0.35, 95% CI = 0.13–0.92, P = 0.03) were independent prognostic factors (Table 2). In the multivariate Cox regression model on the independent cohort, the eight-lncRNA signature, age, T stage, positive LN and CAPRA score, etc., were defined as covariates. We also found that the prognostic power of the eight-lncRNA signature was indeed independent of these clinical features (Table 3, HR =1.20, 95% CI = 1.08–1.33, P = 0.00095).
Table 3: Univariate and multivariate Cox regression analyses in GSE21034 cohort
Predictors |
Univariate analysis |
Multivariate analysis |
||
|---|---|---|---|---|
HR (95% CI) |
P value |
HR (95% CI) |
P value |
|
Risk score |
1.16 (1.07–1.27) |
0.0005 |
1.20 (1.08–1.33) |
0.00095 |
Age, yr |
1.02 (0.97–1.07) |
0.43 |
0.92 (0.86–0.99) |
0.026 |
T stage |
||||
T1a-c |
1.00 (Ref.) |
1.00 (Ref.) |
||
T2a-c |
0.75 (0.36–1.59) |
0.46 |
0.30 (0.12–0.74) |
0.0095 |
T3a-c |
5.05 (1.86–13.73) |
0.015 |
1.96 (0.49–7.80) |
0.34 |
Pathologic tumor stage |
<0.0001 |
0.38 |
||
T2a-c |
1.00 (Ref.) |
1.00 (Ref.) |
||
T3a-c + T4 |
5.23 (2.57–10.68) |
1.61 (0.55–4.68) |
||
Lymph nodes examined |
0.995 (0.94–1.05) |
0.87 |
0.98 (0.93–1.03) |
0.40 |
Positive lymph nodes |
<0.0001 |
<0.0001 |
||
0 |
1.00 (Ref.) |
1.00 (Ref.) |
||
>0 |
9.21 (4.44–19.08) |
9.40 (3.13–28.19) |
||
CAPRA-S |
||||
low |
1.00 (Ref.) |
1.00 (Ref.) |
||
Intermediate |
5.56 (1.84–16.79) |
0.002 |
5.96 (1.71–20.68) |
0.005 |
High |
13.03 (4.27–39.75) |
<0.0001 |
7.06 (1.69–29.47) |
0.007 |
Comparison of the eight-lncRNA signature with Gleason score and positive lymph node
The Gleason score is a powerful predictor to help evaluate the prognosis of patients with prostate cancer. Patients with a higher Gleason score tend to have more aggressive prostate cancers and have a worse prognosis [28]. Although it is important, Gleason score alone is not sufficiently accurate to predict pathologic stage. So, patients with low-grade (Gleason score 2–7) tumors are still at risk of recurrence, and not all patients with high-grade (Gleason score ≥ 8) prostate cancer will progress to invasive carcinoma [29, 30]. In multivariate survival analysis, we found that the eight-lncRNA signature retained significant prognostic value in all tested cohorts independent of Gleason score. To test weather our lncRNA signature could predict prognosis of patients within the same Gleason grade, a stratified analysis was performed in low- and high-grade Gleason score patients. The stratification analysis showed that the signature could further classify patients into different prognoses. For patients with low-grade (Gleason score 2–7, n = 207) tumors, the signature subdivided them into those likely to have longer versus shorter BCR-free survival times (log-rank test, P = 0.028, Figure 3A). Similarly, among patients with high-grade (Gleason score ≥ 8, n = 100), the signature could also subdivide them into two groups with significantly disparate survival (log-rank test, P < 0.01, Figure 3B).
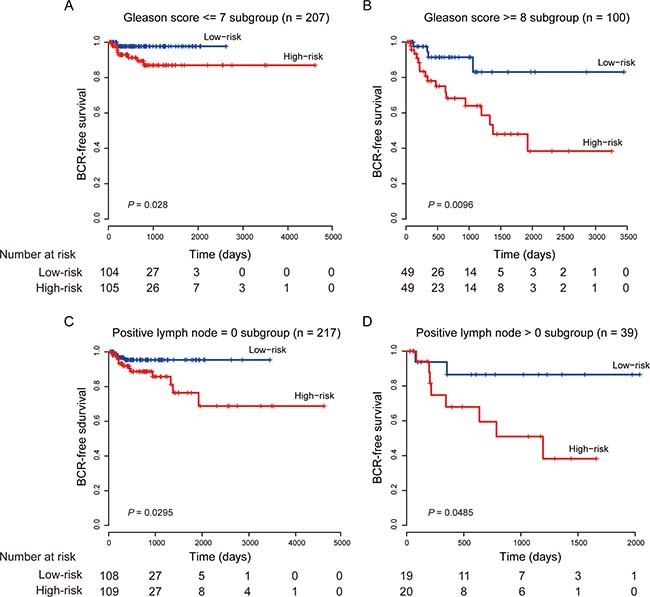
Figure 3: Kaplan–Meier estimates of the BCR-free survival of the entire TCGA cohort stratified by Gleason score and positive lymph node. (A) Patients with Gleason score ≤ 7. (B) Patients with Gleason score ≥ 8. (C) Patients with positive LNs = 0. (D) Patients with positive LNs > 0.
Several studies have shown that patients with lymph node positive prostate cancer indicate an aggressive disease progression and have long BCR-free survival [31–33]. In our study, we also found that our eight-lncRNA signature was independent of positive LN and could effectively stratify patients with different prognoses in conjunction with number of nodes involved (Figure 3C and 3D).
The eight-lncRNA signature displayed superior prognostic accuracy when tested against Gleason score and positive LN. By ROC analysis, the eight-lncRNA signature had a better prognostic ability than both Gleason score and positive LN. And the combinations of the eight-lncRNA signature with Gleason score or positively LN can significantly elevate the prognostic ability of Gleason score or positive LN alone (the area under the curve (AUC), 0.84 vs. 0.69, P = 0.00017 and 0.80 vs. 0.62, P = 0.00022, respectively) (Figure 4).
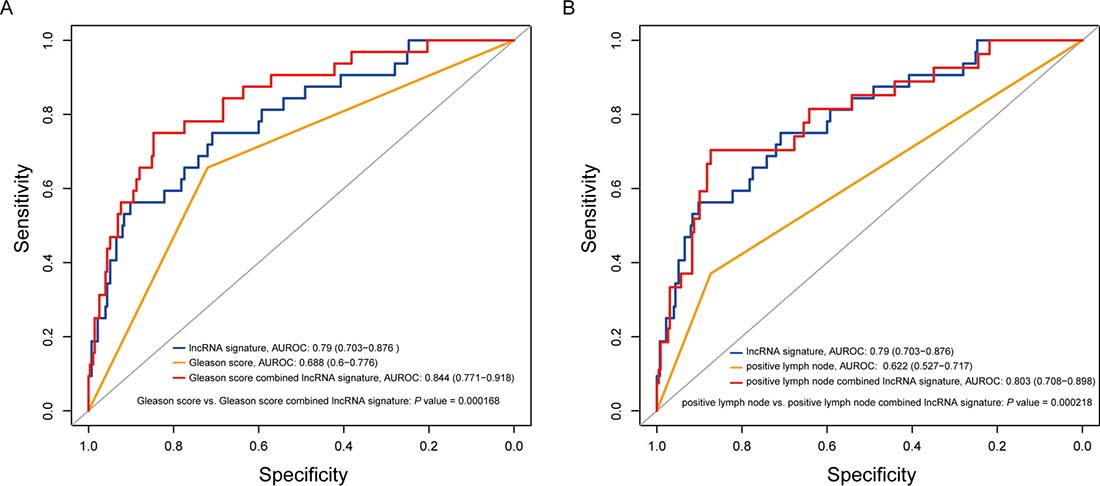
Figure 4: Comparison of sensitivity and specificity for survival prediction by the eight-lncRNA signature, Gleason score and positive lymph node. (A) ROC curves of the eight-lncRNA signature, Gleason score and the combination of the two factors. (B) ROC curves of the eight-lncRNA signature, positive LN and their combination. P values showed the AUC of Gleason score versus the AUC of the combination of signature and Gleason score and the AUC of positive LN versus the AUC of the combination of signature and positive LN.
The lncRNA signature can significantly improve the predictive value of the CAPRA-S score and is associated with metastatic progression
The cancer of the prostate risk assessment post-surgical (CAPRA-S) score which includes six clinico-pathological variables has been used to predict prostate cancer recurrence [34]. Studies including large, multi-institutional trials have proved that the CAPRA-S score is an effective prognostic tool to predict BCR after radical prostatectomy [35, 36]. To further investigate the role of the eight-lncRNA signature in clinical decision, the signature risk score was evaluated together with the CAPRA-S score. Multivariable Cox regression was used to assess the utility of the eight-lncRNA signature after adjustment for clinical and pathologic variables in GSE21034 cohort. Using the CAPRA-S score as well as its component variables as covariates, we found that the eight-lncRNA signature and the CAPRA-S score were both independent prognostic factors (Table 3). Then, a new score combining CAPRA-S and the eight-lncRNA signature was generated. Addition of the eight-lncRNA signature to CAPRA-S significantly increased its prognostic power: the AUC was 0.77 (95 % CI 0.69–0.86) for CAPRA-S alone compared with 0.82 (95% CI 0.74–0.9) with the addition of our signature (P =0.036, Figure 5). Additionally, we also found that the eight-lncRNA signature could stratify men with BCR into those who would or would not develop metastasis (10% of patients with low (only 1) versus 30.7% with high scores developed metastasis).
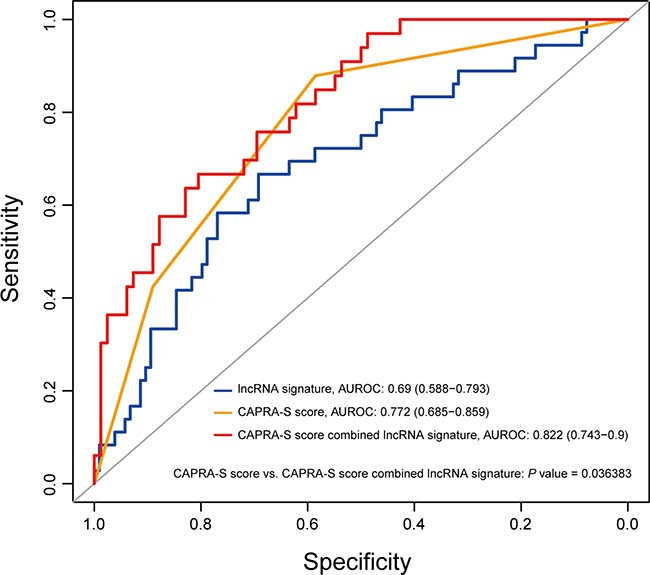
Figure 5: The eight-lncRNA signature significantly improved the prediction value of the CAPRA-S score. The prediction capability of the eight-lncRNA risk score, CAPRA-S score and combination of the two factors is evaluated by the ROC curve in GSE21034 cohort. P value showed the AUC of CAPRA-S score versus the AUC of the combination of signature and CAPRA-S score.
Functional characterization of the eight prognostic lncRNAs
Among the eight lncRNAs, two of them (PCAT1 and PCAT7) have been previously revealed to be implicated in PCa [14, 37]. Using the gene set enrichment analysis (GSEA), we identified biological processes associated with the eight-lncRNA signature on the basis of the risk score (FDR < 0.01). As displayed in Figure 6A, our lncRNAs were significantly enriched in cancer-related functions, such as DNA replication, tumor necrosis production and vessel development. We also found that six of the seven risky lncRNAs were specifically highly expressed in prostate cancer across twelve different cancers (Student’s t-test, FDR < 0.05, Figure 6B), suggesting a cancer-specific pattern of the lncRNA signature. Furthermore, by calculating the Pearson correlations between our prognostic lncRNAs and PCa associated transcriptional factors (TFs), we found that PCAT7, SLC12A9-AS1, RGMB-AS1 and AC005632.2 were significantly correlated with the androgen receptor (AR, P value < 0.05), which could regulate the transcription of target genes involved in prostate cell growth, differentiation and apoptosis [38, 39]. Additionally, binding events of AR were found at RGMB-AS1 and the promoter of AC005632.2 by ChIP-sequencing data from the ENCODE project, further suggesting the regulatory relations between these lncRNAs and AR.
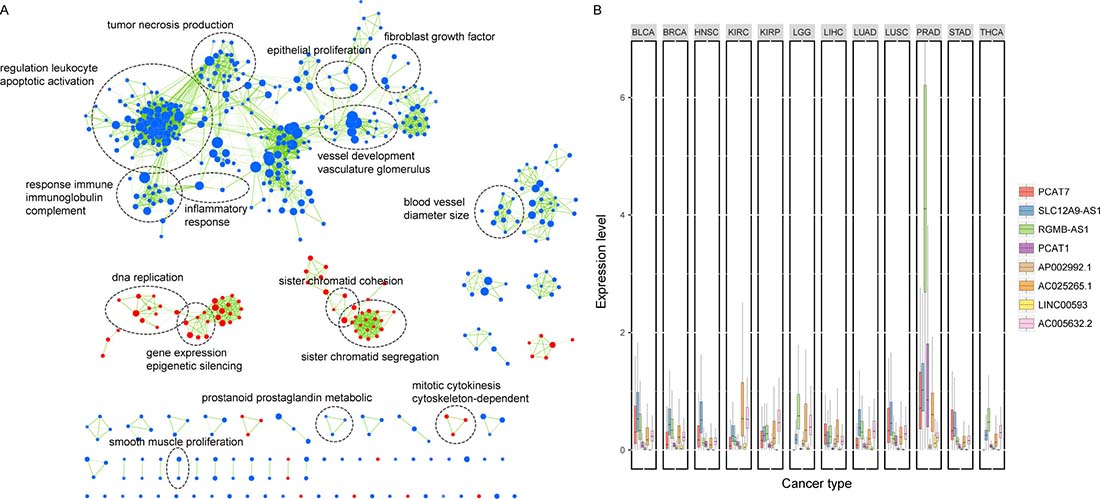
Figure 6: Functional characterization of the lncRNAs in the signature. (A) Gene set enrichment analysis (GSEA) delineates biological processes correlated with the lncRNA signature. Nodes represent enriched GO terms and an edge represents existing genes shared between connecting GO terms. Nodes are grouped and annotated by their similarity according to related gene sets. (B) Box plot comparing the expression of the eight lncRNAs across 12 cancer types. PCAT7, SLC12A9-AS1, RGMB-AS1, PCAT1, AC025265.1 and LINC00593 were highly expressed in prostate cancer across twelve cancers. BLCA, Bladder Urothelial Carcinoma; BRCA, Breast Invasive Carcinoma; HNSC, Head and Neck Squamous Cell Carcinoma; KIRC, Kidney Renal Clear Cell Carcinoma; KIRP, Kidney Renal Papillary Cell Carcinoma; LGG, Brain Lower Grade Glioma; LIHC, Liver Hepatocellular Carcinoma; LUAD, Lung Adenocarcinoma; LUSC, Lung Squamous Cell Carcinoma; PRAD, Prostate Adenocarcinoma; STAD, Stomach Adenocarcinoma; THCA, Thyroid Carcinoma.
DISCUSSION
During the past years, the discovery of thousands of lncRNAs has provided a new avenue for both diagnosis and prognosis of cancers and other diseases [11, 40]. Evidence from growing publications have demonstrated that the aberrant expressions of lncRNAs can mark the spectrum of disease progression and may serve as independent biomarkers for prognosis in many cancer types [18, 41, 42]. In this study, we comprehensively examined the lncRNA profiles of PCa tissues and paired normal tissues across three independent cohorts from different gene expression measurement platforms and identified an eight-lncRNA signature which was significantly associated with the BCR-free survival. Our use of RNA sequencing and high-density microarrays enabled broad surveillance of lncRNAs. The association between the eight-lncRNA signature and prognosis was robust across all four cohorts in both pooled and individual univariate and multivariate analyses incorporating various clinicopathologic risk factors. More broadly, we found that the eight-lncRNA signature may aid the subclassification of patients based on Gleason score or lymphonodus status and was able to improve on the established clinical algorithm for the risk stratification as well as to reflect the metastatic potential of PCa.
For the eight lncRNAs identified in the signature, PCAT1 has been previously reported to have a potential role in cancer [43, 44]. In agreement with our data, PCAT1 is highly prostate-specific and is upregulated in a subset of high-grade localized and metastatic PCa [45]. PCAT1 induces cell proliferation in vitro and functions as a transcriptional repressor by regulating a broad range of genes, including known tumor suppressor genes such as BRCA2 [43]. PCAT1 has been shown to be a target of the Polycomb Repressive Complex 2 (PRC2). The expression of PCAT1 was significantly correlated with that of EZH2 in our PCa patients and knockdown of EZH2 in VCaP caused a dramatic upregulation in PCAT1 expression levels [44]. Another lncRNA, PCAT7, has been shown to be highly expressed in primary and metastatic PCa, and knockdown of it reduces cell growth and soft agar colony formation in LNCaP cells [14]. As for the characteristics of the eight lncRNAs, the functional enrichment analysis showed that they may be involved in the DNA replication, development and proliferation processes. We also pointed that several lncRNAs were significantly correlated with PCa-related TFs. For instance, AC005632.2 was shown to be expression correlated with AR in PCa patients and the binding sites of AR were also localized in the promoter region of AC005632.2. As AR is an important transcription factor in the development and progression of PCa, the association between AR and the lncRNAs may suggest a potential molecular mechanism of these lncRNAs in the development of PCa. Interestingly, we showed that the expression patterns of 87.5% of the lncRNAs in the signature were significantly specific to PCa, with minimal expression in all other tumor types for risky lncRNAs. The tumor specificity of these lncRNAs makes them ideal molecular signatures for clinical utilization and excellent candidates for biomarkers.
By performing multivariable Cox regression analysis, we showed that the prognostic value of the eight-lncRNA signature was independent of traditional clinical and pathological risk factors, including Gleason score and positive LN. Gleason score, or grade of the tumor, has been the single most powerful predictor of PCa prognosis [46]. In the stratified analysis, the eight-lncRNA signature showed prognostic value both in low-grade (Gleason score 2–7) and high-grade (Gleason score≥ 8) patients. Importantly, the eight-lncRNA signature can not only classify patients of the same Gleason grade into high- and low-risk groups but also significantly enhance the prognostic ability of Gleason score, indicating that the signature can improve the accuracy of the prediction of recurrence. As high Gleason score was able to be adopted as one of the criteria for adjuvant radiotherapy or other treatments, our molecular signature should be considered as a factor in selecting patients for adjuvant therapy.
LN-positive prostate cancer indicates an aggressive disease progression. Previous studies reported that the number of positive LNs related to poor BCR-free survival [47, 48]. Identifying prognostic factors for LN-positive PCa is important because patients with a poor prognosis must immediately commence androgen deprivation treatment (ADT) that provides a survival benefit [49]. In our study, we demonstrated that the eight-lncRNA signature was an independent factor to elevate the prognostic power of the number of positive LNs and patients with similar lymphonodus status could be subdivided into high- or low- risk group, indicating that the lncRNA signature may be considered to better stratify patients and facilitate the identification of higher-risk patients who need to be followed up more closely.
We also found that the eight-lncRNA signature was able to improve the accuracy of prediction of BCR on an established clinical algorithm CAPRA-S score [34]. The CAPRA-S score is one of the most accurate clinicopathological models to predict PCa recurrence, and the integration of the lncRNA signature into this model suggesting that assessment of lncRNA signature will be effective in conjunction with the existed prognostic instruments to provide a more accurate prognosis for patients with PCa.
In conclusion, our study presented a powerful lncRNA signature for recurrence of PCa by employing large independent patient cohorts across different gene expression measurement platforms. The eight-lncRNA signature was an independent risk factor of other prognostic factors, supporting the use of it as a potential clinical predictor that could be used alongside standard clinical parameters, such as Gleason score and positive LN. Our results demonstrated that the eight-lncRNA signature may be used to refine the current prognostic models and facilitate further stratification of the PCa patients. Further validation studies in prospective cohorts are required to test the prognostic power and the clinical implications of the signature.
MATERIALS AND METHODS
PCa datasets preparation
The transcriptome profiles of 357 samples, including 307 PCa patients and 50 paired adjacent normal tissues were retrieved from the Cancer Genome Atlas (TCGA) prostate adenocarcinoma dataset through the Atlas of Noncoding RNAs in Cancer (TANRIC) [50, 51]. Clinical outcome was evaluated by BCR and patients without recurrence and without the time of recurrence were censored at their respective last day of follow-up. Then, patients without clinical endpoints were removed. Data used for integrative transcriptome analysis were obtained from the ArrayExpress: ERP000550 (RNA-seq) and the Gene Expression Omnibus: GSE29079 (microarray). An external validation data were also included in our study: GSE21034. For microarray data, the Affymetrix Human Exon 1.0 ST Array was used considering its comprehensive coverage of the annotated human lncRNAs. The PCa patients in TCGA were randomly split into a training set (n = 184) and an internal validation set (n = 123).
Data processing
The lncRNA annotations were retrieved from GENCODE (v16). We annotated 12,727 and 10,092 lncRNAs in microarray and RNA-seq, respectively. For exon array data, we designed a custom pipeline to re-annotate lncRNAs according to previous studies [14, 52]. The probe sequences were downloaded and uniquely mapped to the human genome (hg19), and probes completely falling into exons of lncRNAs were retained to compute the expression levels of lncRNAs. The raw intensities of the probes were normalized using the RMA normalization method and the expression alterations between tumors and control were calculated by Student’s t-test analysis. For sequencing data, sequencing reads were aligned to the human genome (GRCh37/hg19) and read counts for each gene were calculated. Normalized gene expression levels were estimated by FPKM and raw read counts were used to identify differentially expressed lncRNAs by DESeq2 [53]. False discovery rate (FDR) significance level of 5% and fold change of 1.2 were chosen for all differential analyses.
Identification of lncRNAs associated with PCa recurrence
The association between the lncRNA expression and patient’s BCR-free survival was assessed by univariable Cox regression analysis in the training cohort. A risk score formula was then established using the follow formula: Risk score = (0.45666 × expression level of PCAT7) + (0.26201 × expression level of SLC12A9-AS1) + (0.09976 × expression level of RGMB-AS1) + (0.16082 × expression level of PCAT1) + (1.22014 × expression level of AP002992.1) + (0.4591 × expression level of AC025265.1) + (1.6287 × expression level of LINC00593) + (–5.8034 × expression level of AC005632.2), which is a linear combination of the expression levels of the significant lncRNAs weighted by their respective regression coefficients in the univariable Cox regression analysis. With this risk score formula, patients in each cohort were then assigned a risk score and classified into high-risk or low-risk group by the corresponding median risk score.
Statistical analysis
The survival time of each cohort was estimated by the Kaplan-Meier method, and the survival difference between the high-risk and low-risk groups was compared using the log-rank test. The univariate and multivariate Cox regression models were used to ascertain whether the eight-lncRNA signature was an independent predictor of PCa patient’s BCR-free survival. In the models, the normalized expression levels on a log2 scale were used for the four known biomarkers. ROC analysis was performed to compare the sensitivity and specificity of the BCR-free survival prediction based on the eight-lncRNA risk score, Gleason score, positive LN and CAPRA-S score. The combination of two variables was firstly included both as predictors in a logistic regression model and then we used the predictions from the model to plot ROC curves by pROC [54]. Areas under the curve (AUC) were calculated and compared. All statistical analyses were conducted using R program. The significance was defined as P values being less than 0.05.
Functional analyses
We performed functional enrichment analysis for the co-expression relations between protein coding genes and the lncRNA signature on the TCGA cohort using GSEA. FDR q value of 1% was used as criteria for significantly enriched gene sets. Cytoscape and the Enrichment Map software were used to visualize the GSEA results [55]. We analyzed the expression profiles of 12 cancers to determine the specificity of the lncRNAs in the signature in prostate cancer. By comparing their expression levels in prostate cancer to those in other cancers, the Student’s t-test was used to determine statistical significance and the P-values were adjusted by FDR. The expression correlations between the prostate cancer-associated transcription factors (TFs) and the eight lncRNAs were computed by Pearson’s correlation analysis. TF binding sites were retrieved from ENCODE TFBS ChIP-seq data [56] and the promoter region of lncRNA was defined as 2 kb upstream and 0.5 kb downstream of transcription start site.
Abbreviations
PCa: prostate cancer; lncRNA: long non-coding RNA; BCR, biochemical recurrence; PSA, prostate-specific antigen; LN: lymph node; HR: hazard ratio; CI: confidence interval; ROC: receiver operating characteristic; AUC: area under the curve; GEO: Gene Expression Omnibus; TCGA: the Cancer Genome Atlas; TANRIC: the Atlas of Noncoding RNAs in Cancer; CAPRA-S: the prostate risk assessment post-surgical; TFs: transcription factors; GSEA: the gene set enrichment analysis; AR: androgen receptor.
Author contributions
SJC, YX and XL conceived and designed the project. JYX and YJL acquired the data. FLY and SWZ performed the statistical analysis. JYX, YJL, FLY and SWZ analyzed and interpreted all the data. JRR and JLZ prepared the figures and tables. YX and JYX wrote the paper. HYZ and LLL reviewed and revised the manuscript. All authors approved the final manuscript.
ACKNOWLEDGMENTS
This work was supported in part by the National High Technology Research and Development Program of China [863 Program, Grant Nos. 2014AA021102], the National Program on Key Basic Research Project [973 Program, Grant Nos. 2014CB910504], the National Natural Science Foundation of China [Grant Nos. 91439117, 61473106, 61573122], the China Postdoctoral Science Foundation (2016M600260), Wu lien-teh youth science fund project of Harbin medical university [Grant Nos. WLD-QN1407], Special funds for the construction of higher education in Heilongjiang Province [Grant Nos. UNPYSCT-2016049], the Heilongjiang Postdoctoral Foundation (LBH-Z16098) and the Funds for the Graduate Innovation Fund of Heilongjiang Province [YJSCX2015-5HYD].
CONFLICTS OF INTEREST
The authors declare no potential conflicts of interest.
REFERENCES
1. Siegel RL, Miller KD, Jemal A. Cancer statistics, 2016. CA Cancer J Clin. 2016; 66:7–30. https://doi.org/10.3322/caac.21332.
2. Rosenbaum E, Partin A, Eisenberger MA. Biochemical relapse after primary treatment for prostate cancer: studies on natural history and therapeutic considerations. J Natl Compr Canc Netw. 2004; 2:249–56.
3. Cooperberg MR, Broering JM, Carroll PR. Time trends and local variation in primary treatment of localized prostate cancer. J Clin Oncol. 2010; 28:1117–23. https://doi.org/10.1200/JCO.2009.26.0133.
4. Stephenson AJ, Kattan MW, Eastham JA, Dotan ZA, Bianco FJ Jr, Lilja H, Scardino PT. Defining biochemical recurrence of prostate cancer after radical prostatectomy: a proposal for a standardized definition. J Clin Oncol. 2006; 24:3973–8. https://doi.org/10.1200/JCO.2005.04.0756.
5. Lee G, Sparks R, Ali S, Shih NN, Feldman MD, Spangler E, Rebbeck T, Tomaszewski JE, Madabhushi A. Co-occurring gland angularity in localized subgraphs: predicting biochemical recurrence in intermediate-risk prostate cancer patients. PLoS One. 2014; 9:e97954. https://doi.org/10.1371/journal.pone.0097954.
6. Punnen S, Cooperberg MR, D'Amico AV, Karakiewicz PI, Moul JW, Scher HI, Schlomm T, Freedland SJ. Management of biochemical recurrence after primary treatment of prostate cancer: a systematic review of the literature. Eur Urol. 2013; 64:905–15. https://doi.org/10.1016/j.eururo.2013.05.025.
7. Hayes JH, Barry MJ. Screening for prostate cancer with the prostate-specific antigen test: a review of current evidence. JAMA. 2014; 311:1143–9. https://doi.org/10.1001/jama.2014.2085.
8. Fraser M, Berlin A, Bristow RG, van der Kwast T. Genomic, pathological, and clinical heterogeneity as drivers of personalized medicine in prostate cancer. Urol Oncol. 2015; 33:85–94. https://doi.org/10.1016/j.urolonc.2013.10.020.
9. Wu CL, Schroeder BE, Ma XJ, Cutie CJ, Wu S, Salunga R, Zhang Y, Kattan MW, Schnabel CA, Erlander MG, McDougal WS. Development and validation of a 32-gene prognostic index for prostate cancer progression. Proc Natl Acad Sci U S A. 2013; 110:6121–6. https://doi.org/10.1073/pnas.1215870110.
10. Olmos D, Brewer D, Clark J, Danila DC, Parker C, Attard G, Fleisher M, Reid AH, Castro E, Sandhu SK, Barwell L, Oommen NB, Carreira S, et al. Prognostic value of blood mRNA expression signatures in castration-resistant prostate cancer: a prospective, two-stage study. Lancet Oncol. 2012; 13:1114–24. https://doi.org/10.1016/S1470-2045(12)70372-8.
11. Prensner JR, Chinnaiyan AM. The emergence of lncRNAs in cancer biology. Cancer Discov. 2011; 1:391–407. https://doi.org/10.1158/2159-8290.CD-11-0209.
12. Huarte M. The emerging role of lncRNAs in cancer. Nat Med. 2015; 21:1253–61. https://doi.org/10.1038/nm.3981.
13. Cabili MN, Trapnell C, Goff L, Koziol M, Tazon-Vega B, Regev A, Rinn JL. Integrative annotation of human large intergenic noncoding RNAs reveals global properties and specific subclasses. Genes Dev. 2011; 25:1915–27. https://doi.org/10.1101/gad.17446611.
14. Du Z, Fei T, Verhaak RG, Su Z, Zhang Y, Brown M, Chen Y, Liu XS. Integrative genomic analyses reveal clinically relevant long noncoding RNAs in human cancer. Nat Struct Mol Biol. 2013; 20:908–13. https://doi.org/10.1038/nsmb.2591.
15. Spizzo R, Almeida MI, Colombatti A, Calin GA. Long non-coding RNAs and cancer: a new frontier of translational research? Oncogene. 2012; 31:4577–87. https://doi.org/10.1038/onc.2011.621.
16. Gupta RA, Shah N, Wang KC, Kim J, Horlings HM, Wong DJ, Tsai MC, Hung T, Argani P, Rinn JL, Wang Y, Brzoska P, Kong B, et al. Long non-coding RNA HOTAIR reprograms chromatin state to promote cancer metastasis. Nature. 2010; 464:1071–6. https://doi.org/10.1038/nature08975.
17. Qi P, Du X. The long non-coding RNAs, a new cancer diagnostic and therapeutic gold mine. Mod Pathol. 2013; 26:155–65. https://doi.org/10.1038/modpathol.2012.160.
18. Prensner JR, Zhao S, Erho N, Schipper M, Iyer MK, Dhanasekaran SM, Magi-Galluzzi C, Mehra R, Sahu A, Siddiqui J, Davicioni E, Den RB, Dicker AP, et al. RNA biomarkers associated with metastatic progression in prostate cancer: a multi-institutional high-throughput analysis of SChLAP1. Lancet Oncol. 2014; 15:1469–80. https://doi.org/10.1016/S1470-2045(14)71113-1.
19. Misawa A, Takayama KI, Inoue S. Long non-coding RNAs and prostate cancer. Cancer Sci. 2017. https://doi.org/10.1111/cas.13352.
20. Mehra R, Udager AM, Ahearn TU, Cao X, Feng FY, Loda M, Petimar JS, Kantoff P, Mucci LA, Chinnaiyan AM. Overexpression of the Long Non-coding RNA SChLAP1 Independently Predicts Lethal Prostate Cancer. Eur Urol. 2016; 70:549–52. https://doi.org/10.1016/j.eururo.2015.12.003.
21. Ren S, Peng Z, Mao JH, Yu Y, Yin C, Gao X, Cui Z, Zhang J, Yi K, Xu W, Chen C, Wang F, Guo X, et al. RNA-seq analysis of prostate cancer in the Chinese population identifies recurrent gene fusions, cancer-associated long noncoding RNAs and aberrant alternative splicings. Cell Res. 2012; 22:806–21. https://doi.org/10.1038/cr.2012.30.
22. Brase JC, Johannes M, Mannsperger H, Falth M, Metzger J, Kacprzyk LA, Andrasiuk T, Gade S, Meister M, Sirma H, Sauter G, Simon R, Schlomm T, et al. TMPRSS2-ERG -specific transcriptional modulation is associated with prostate cancer biomarkers and TGF-beta signaling. BMC Cancer. 2011; 11:507. https://doi.org/10.1186/1471-2407-11-507.
23. Taylor BS, Schultz N, Hieronymus H, Gopalan A, Xiao Y, Carver BS, Arora VK, Kaushik P, Cerami E, Reva B, Antipin Y, Mitsiades N, Landers T, et al. Integrative genomic profiling of human prostate cancer. Cancer Cell. 2010; 18:11–22. https://doi.org/10.1016/j.ccr.2010.05.026.
24. Ayala G, Thompson T, Yang G, Frolov A, Li R, Scardino P, Ohori M, Wheeler T, Harper W. High levels of phosphorylated form of Akt-1 in prostate cancer and non-neoplastic prostate tissues are strong predictors of biochemical recurrence. Clin Cancer Res. 2004; 10:6572–8. https://doi.org/10.1158/1078-0432.CCR-04-0477.
25. Bauer JJ, Sesterhenn IA, Mostofi FK, McLeod DG, Srivastava S, Moul JW. Elevated levels of apoptosis regulator proteins p53 and bcl-2 are independent prognostic biomarkers in surgically treated clinically localized prostate cancer. J Urol. 1996; 156:1511–6.
26. Blum DL, Koyama T, M'Koma AE, Iturregui JM, Martinez-Ferrer M, Uwamariya C, Smith JA Jr, Clark PE, Bhowmick NA. Chemokine markers predict biochemical recurrence of prostate cancer following prostatectomy. Clin Cancer Res. 2008; 14:7790–7. https://doi.org/10.1158/1078-0432.CCR-08-1716.
27. Steuber T, Vickers AJ, Haese A, Becker C, Pettersson K, Chun FK, Kattan MW, Eastham JA, Scardino PT, Huland H, Lilja H. Risk assessment for biochemical recurrence prior to radical prostatectomy: significant enhancement contributed by human glandular kallikrein 2 (hK2) and free prostate specific antigen (PSA) in men with moderate PSA-elevation in serum. Int J Cancer. 2006; 118:1234–40. https://doi.org/10.1002/ijc.21474.
28. Egevad L, Granfors T, Karlberg L, Bergh A, Stattin P. Prognostic value of the Gleason score in prostate cancer. BJU Int. 2002; 89:538–42.
29. Humphrey PA. Gleason grading and prognostic factors in carcinoma of the prostate. Mod Pathol. 2004; 17:292–306. https://doi.org/10.1038/modpathol.3800054.
30. Pannek J, Subong EN, Jones KA, Marschke PL, Epstein JI, Chan DW, Carter HB, Luderer AA, Partin AW. The role of free/total prostate-specific antigen ratio in the prediction of final pathologic stage for men with clinically localized prostate cancer. Urology. 1996; 48:51–4.
31. Eggener SE, Scardino PT, Walsh PC, Han M, Partin AW, Trock BJ, Feng Z, Wood DP, Eastham JA, Yossepowitch O, Rabah DM, Kattan MW, Yu C, et al. Predicting 15-year prostate cancer specific mortality after radical prostatectomy. J Urol. 2011; 185:869–75. https://doi.org/10.1016/j.juro.2010.10.057.
32. Boorjian SA, Thompson RH, Siddiqui S, Bagniewski S, Bergstralh EJ, Karnes RJ, Frank I, Blute ML. Long-term outcome after radical prostatectomy for patients with lymph node positive prostate cancer in the prostate specific antigen era. J Urol. 2007; 178:864–70; discussion 70-1. https://doi.org/10.1016/j.juro.2007.05.048.
33. Daneshmand S, Quek ML, Stein JP, Lieskovsky G, Cai J, Pinski J, Skinner EC, Skinner DG. Prognosis of patients with lymph node positive prostate cancer following radical prostatectomy: long-term results. J Urol. 2004; 172:2252–5.
34. Cooperberg MR, Hilton JF, Carroll PR. The CAPRA-S score: A straightforward tool for improved prediction of outcomes after radical prostatectomy. Cancer. 2011; 117:5039–46. https://doi.org/10.1002/cncr.26169.
35. Punnen S, Freedland SJ, Presti JC Jr, Aronson WJ, Terris MK, Kane CJ, Amling CL, Carroll PR, Cooperberg MR. Multi-institutional validation of the CAPRA-S score to predict disease recurrence and mortality after radical prostatectomy. Eur Urol. 2014; 65:1171–7. https://doi.org/10.1016/j.eururo.2013.03.058.
36. Tilki D, Mandel P, Schlomm T, Chun FK, Tennstedt P, Pehrke D, Haese A, Huland H, Graefen M, Salomon G. External validation of the CAPRA-S score to predict biochemical recurrence, metastasis and mortality after radical prostatectomy in a European cohort. J Urol. 2015; 193:1970–5. https://doi.org/10.1016/j.juro.2014.12.020.
37. Prensner JR, Chen W, Han S, Iyer MK, Cao Q, Kothari V, Evans JR, Knudsen KE, Paulsen MT, Ljungman M, Lawrence TS, Chinnaiyan AM, Feng FY. The long non-coding RNA PCAT-1 promotes prostate cancer cell proliferation through cMyc. Neoplasia. 2014; 16:900–8. https://doi.org/10.1016/j.neo.2014.09.001.
38. Cude KJ, Dixon SC, Guo Y, Lisella J, Figg WD. The androgen receptor: genetic considerations in the development and treatment of prostate cancer. J Mol Med (Berl). 1999; 77:419–26.
39. Heinlein CA, Chang C. Androgen receptor in prostate cancer. Endocr Rev. 2004; 25:276–308. https://doi.org/10.1210/er.2002-0032.
40. Kogo R, Shimamura T, Mimori K, Kawahara K, Imoto S, Sudo T, Tanaka F, Shibata K, Suzuki A, Komune S, Miyano S, Mori M. Long noncoding RNA HOTAIR regulates polycomb-dependent chromatin modification and is associated with poor prognosis in colorectal cancers. Cancer Res. 2011; 71:6320–6. https://doi.org/10.1158/0008-5472.CAN-11-1021.
41. Li J, Chen Z, Tian L, Zhou C, He MY, Gao Y, Wang S, Zhou F, Shi S, Feng X, Sun N, Liu Z, Skogerboe G, et al. LncRNA profile study reveals a three-lncRNA signature associated with the survival of patients with oesophageal squamous cell carcinoma. Gut. 2014; 63:1700–10. https://doi.org/10.1136/gutjnl-2013-305806.
42. Zhang XQ, Sun S, Lam KF, Kiang KM, Pu JK, Ho AS, Lui WM, Fung CF, Wong TS, Leung GK. A long non-coding RNA signature in glioblastoma multiforme predicts survival. Neurobiol Dis. 2013; 58:123–31. https://doi.org/10.1016/j.nbd.2013.05.011.
43. Prensner JR, Chen W, Iyer MK, Cao Q, Ma T, Han S, Sahu A, Malik R, Wilder-Romans K, Navone N, Logothetis CJ, Araujo JC, Pisters LL, et al. PCAT-1, a long noncoding RNA, regulates BRCA2 and controls homologous recombination in cancer. Cancer Res. 2014; 74:1651–60. https://doi.org/10.1158/0008-5472.CAN-13-3159.
44. Prensner JR, Iyer MK, Balbin OA, Dhanasekaran SM, Cao Q, Brenner JC, Laxman B, Asangani IA, Grasso CS, Kominsky HD, Cao X, Jing X, Wang X, et al. Transcriptome sequencing across a prostate cancer cohort identifies PCAT-1, an unannotated lincRNA implicated in disease progression. Nat Biotechnol. 2011; 29:742–9. https://doi.org/10.1038/nbt.1914.
45. Walsh AL, Tuzova AV, Bolton EM, Lynch TH, Perry AS. Long noncoding RNAs and prostate carcinogenesis: the missing 'linc'? Trends Mol Med. 2014; 20:428–36. https://doi.org/10.1016/j.molmed.2014.03.005.
46. Epstein JI, Zelefsky MJ, Sjoberg DD, Nelson JB, Egevad L, Magi-Galluzzi C, Vickers AJ, Parwani AV, Reuter VE, Fine SW, Eastham JA, Wiklund P, Han M, et al. A Contemporary Prostate Cancer Grading System: A Validated Alternative to the Gleason Score. Eur Urol. 2016; 69:428–35. https://doi.org/10.1016/j.eururo.2015.06.046.
47. Masterson TA, Bianco FJ Jr, Vickers AJ, DiBlasio CJ, Fearn PA, Rabbani F, Eastham JA, Scardino PT. The association between total and positive lymph node counts, and disease progression in clinically localized prostate cancer. J Urol. 2006; 175:1320–4; discussion 4-5. https://doi.org/10.1016/S0022-5347(05)00685-3.
48. Schumacher MC, Burkhard FC, Thalmann GN, Fleischmann A, Studer UE. Good outcome for patients with few lymph node metastases after radical retropubic prostatectomy. Eur Urol. 2008; 54:344–52. https://doi.org/10.1016/j.eururo.2008.05.023.
49. Ko K, Jeong IG, Choi WS, Lim JH, Suh JH, Ku JH, Park Y, Moon KC, Kim HH, Kim CS, Kwak C. Effect of Gleason scores of lymph node metastases on prognosis of patients with prostate cancer. Int J Clin Exp Pathol. 2014; 7:6141–8.
50. Cancer Genome Atlas Research Network. The Molecular Taxonomy of Primary Prostate Cancer. Cell. 2015; 163:1011–25. https://doi.org/10.1016/j.cell.2015.10.025.
51. Li J, Han L, Roebuck P, Diao L, Liu L, Yuan Y, Weinstein JN, Liang H. TANRIC: An Interactive Open Platform to Explore the Function of lncRNAs in Cancer. Cancer Res. 2015; 75:3728–37. https://doi.org/10.1158/0008-5472.CAN-15-0273.
52. Zhao T, Xu J, Liu L, Bai J, Xu C, Xiao Y, Li X, Zhang L. Identification of cancer-related lncRNAs through integrating genome, regulome and transcriptome features. Mol Biosyst. 2015; 11:126–36. https://doi.org/10.1039/c4mb00478g.
53. Love MI, Huber W, Anders S. Moderated estimation of fold change and dispersion for RNA-seq data with DESeq2. Genome Biol. 2014; 15:550. https://doi.org/10.1186/s13059-014-0550-8.
54. Robin X, Turck N, Hainard A, Tiberti N, Lisacek F, Sanchez JC, Muller M. pROC: an open-source package for R and S+ to analyze and compare ROC curves. BMC Bioinformatics. 2011; 12:77. https://doi.org/10.1186/1471-2105-12-77.
55. Merico D, Isserlin R, Stueker O, Emili A, Bader GD. Enrichment map: a network-based method for gene-set enrichment visualization and interpretation. PLoS One. 2010; 5:e13984. https://doi.org/10.1371/journal.pone.0013984.
56. Euskirchen GM, Rozowsky JS, Wei CL, Lee WH, Zhang ZD, Hartman S, Emanuelsson O, Stolc V, Weissman S, Gerstein MB, Ruan Y, Snyder M. Mapping of transcription factor binding regions in mammalian cells by ChIP: comparison of array- and sequencing-based technologies. Genome Res. 2007; 17:898–909. https://doi.org/10.1101/gr.5583007.