
INTRODUCTION
Small-cell lung cancer (SCLC) accounts for 15% of all lung cancers and is a highly aggressive tumor that is marked by early metastases and poor prognosis. Approximately 60–75% of patients with SCLC are diagnosed at later stages of disease progression [1–3]. While SCLC patients appear initially responsive to chemotherapy, most patients show cancer progression within months. Thus, research is urgently needed to identify predictive factors associated with improved prognosis. Previously, a meta-analysis study conducted by Wang et al. (2017) [4] revealed the association between body mass index (BMI) and mortality in non-small cell lung cancer (NSCLC) patients.
More than 50% of patients with advanced cancer have been diagnosed as having malnutrition despite having to meet a high nutritional demand due to an altered metabolic rate [5, 6]. Nearly 20% of cancer patients die of malnutrition induced by their tumors or from side effects from their treatments [7], and malnourished patients are at higher risk of poor prognosis and outcomes [8, 9]. Thus, the utility of a patient’s nutritional status—such as the rate of anemia [10] and BMI before treatment [11]—as a prognostic marker has been previously studied [12–14]. In addition, inflammation has been shown to play a prominent role in tumor progression and metastasis [15]. Inflammation factors, such as C-reactive protein, neutrophil-to-lymphocyte ratio (NLR) and platelet-to-lymphocyte ratio have extensively been characterized poor prognostic factor in various types of tumors [16–20].
Epidemiological studies have observed a significant inverse relationship between BMI and lung cancer incidence [21, 22]. Yun (2016) (N = 809) found BMI > 23 compared with BMI < 23 had significant lower risk of all-caused mortality (HR: 0.57, 95%CI: 0.38–0.86) in lung cancer patients [23]. In addition, a recent meta-analysis showed that being underweight was a risk factor for lung cancer, while excess weight provided a potential protective effect [24]. However, this meta-analysis did not assess the relationship specifically between BMI and mortality in SCLC patients. While many observational studies examined the relationship between BMI and mortality in patients with NSCLC, to the best, of our knowledge, such associations have not been extensively studied for SCLC, only reviewed in Inomata et al. (2016) [25]. In the present study, we evaluated nutritional status, inflammation markers, eastern cooperative oncology group performance status (ECOG PS), and basic patient data for their potential use as a available prognostic marker SCLC. Thus, the aim of our study was to retrospectively investigate the association between BMI and overall survival (OS) of SCLC patients, using data collected solely at Tri-Service General Hospital/National Defense Medical Center (TSGH/NDMC).
RESULTS
Baseline characteristics
A total of 30 (17.3%) males and 143 (82.7%) females with SCLC were included in the present study. The clinical/pathological characteristics of the 173 patients are summarized in Table 1. There were 8 patients still alive at the end of follow-up. The median follow-up time was 34.62 months. Among these patients, 2 (1.1%) were diagnosed as stage 1; 2 (1.1%) were stage 2; 39 (22.5%) were stage 3; and 130 (75.1%) were stage 4 SCLC. The baseline demographic, clinical, and laboratory characteristics of the patients’, including their BMI: < 23 (n = 110) or ≥ 23 (n = 63), are summarized in Table 1. The mean age of our participants was 69.25 and 67.05 years for males and females, respectively. More than half of the patients (n = 103; 59.5%) had PS of 0–2. Totally 126 patients received intravenous chemotherapy at least 1 cycle; among them, 63 patients received cisplatin plus etoposide, 33 patients carboplatin plus etoposide and 30 patients received chemo-radiotherapy. 1 patient received local radiotherapy and 1 patient received surgery. BMI > 23BMI < 23Patient with PS 3 and PS 4 received best supportive care accounted for 51.5% and 87.5% respectively Significant differences were observed in clinical stage, Charlson comorbidity index (CCI), ECOG PS, and levels of platelet (PLT), albumin, and alkaline phosphatase (ALP) (p < 0.05). The OS and Progression-Free Survival (PFS) were also significantly longer in patients with BMI ≥ 23 (OS, p < 0.001; PFS, p = 0.001).
Table 1: Basic characteristic
Variable |
BMI > 23 |
BMI < 23 |
p–value |
|---|---|---|---|
Stage |
0.005* |
||
Stage : 1 |
2 (3.2%) |
0 (0.0%) |
|
Stage : 2 |
0 (0.0%) |
2 (1.8%) |
|
Stage : 3 |
21 (33.3%) |
18 (16.4%) |
|
Stage : 4 |
40 (63.5%) |
90 (81.8%) |
|
Age (year) |
67.05 ± 12.17 |
69.25 ± 11.51 |
0.238 |
Gender |
0.199 |
||
Female |
49 (77.8%) |
94 (85.5%) |
|
Male |
14 (22.2%) |
16 (14.5%) |
|
Body Mass Index (BMI) |
27.18 ± 3.19 |
20.59 ± 2.45 |
<0.001* |
Metastases |
0.055 |
||
No Metastases |
25 (39.7%) |
26 (23.6%) |
|
Organ Metastases : 1 |
23 (36.5%) |
43 (39.1%) |
|
Organs Metastases > 1 |
15 (23.8%) |
41 (37.3%) |
|
Charlson Comorbidity Index (CCI) |
7.71 ± 2.43 |
8.63 ± 2.22 |
0.013* |
Chief Complain (CC) |
0.072 |
||
Respiratory system |
57 (90.5%) |
88 (80.0%) |
|
Other |
6 (9.5%) |
22 (20.0%) |
|
ECOG PS |
0.001* |
||
PS : 0 |
9 (14.5%) |
5 (4.7%) |
|
PS : 1 |
28 (45.2%) |
31 (29.2%) |
|
PS : 2 |
13 (21.0%) |
17 (16.0%) |
|
PS : 3 |
7 (11.3%) |
26 (24.5%) |
|
PS : 4 |
5 (8.1%) |
27 (25.5%) |
|
WBC (UL) |
8705.71 ± 3713.11 |
9113.73 ± 4415.66 |
0.537 |
Neutrophil (%) |
69.77 ± 10.80 |
72.17 ± 11.27 |
0.174 |
Absolute Neutrophil Count |
6240.78 ± 3433.25 |
6849.91 ± 4202.10 |
0.329 |
Lymphocyte (%) |
19.76 ± 9.64 |
18.51 ± 8.96 |
0.395 |
Absolute Lymphocyte Count |
1607.14 ± 859.81 |
1490.71 ± 779.07 |
0.364 |
Neutrophil/Lymphocyte Ratio |
7.18 ± 19.81 |
9.51 ± 9.34 |
0.456 |
Hemoglobin (Hgb, g/Dl) |
12.57 ± 2.15 |
12.48 ± 2.10 |
0.784 |
Platelet (PLT, 10^3/uL) |
228.30 ± 72.86 |
261.55 ± 113.84 |
0.039* |
C-Reactive Protein (mg/L) |
7.63 ± 9.67 |
12.50 ± 39.42 |
0.366 |
Lactic Dehydrogenase (LDH, IU/L) |
399.53 ± 217.44 |
799.42 ± 2039.28 |
0.232 |
Albumin (g/Dl) |
3.68 ± 0.55 |
3.46 ± 0.58 |
0.016* |
Alkaine Phosphatase (ALP, U/L) |
81.50 ± 34.88 |
128.59 ± 163.97 |
0.039 |
Numbers of patients received intravenous chemotherapy (at least 1 cycle) |
49 (77.8%) |
77 (70.0%) |
0.077 |
Cycles of first-line chemotherapy |
4.67 ± 2.22 |
4.38 ± 2.14 |
0.479 |
Pericardia Effusion$ |
0.499 |
||
Large |
2 (25.0%) |
2 (14.3%) |
|
Small |
3 (37.5%) |
3 (21.4%) |
|
Minimal |
3 (37.5%) |
9 (64.3%) |
|
Non-Smoking Patients |
14 (22.2%) |
31 (28.9%) |
0.346 |
Smoking (Pack per year) |
468.3 ± 231.9 |
446.6 ± 230.3 |
0.809 |
Progression Free Survival (day) |
218 (192–264) |
176.5 (133–216) |
0.001* |
The numbers of survivors at the end of data cut-off |
6 (9.5%) |
2 (1.8%) |
0.005* |
Overall Survival (day) |
341 (281–468) |
226 (157–301) |
<0.001* |
Abbreviation: ECOG PS: Eastern cooperative oncology group performance status; WBC: white blood count.
$The pericardia effusion was measured by cardiac echography. We defined pericardial effusion as small if a circumferential echo-free space is smaller than 0,5 cm (<100 ml), moderate effusion if echo-free space is about 1 cm (100–500 ml), and large if echo free space is more than 1 cm (>500 ml).
*P-value < 0.05.
Analysis of factors related to OS
Correlations between OS and candidate prognosis factors were analyzed by univariate analyses (Table 2). We observed significant associations between OS and clinical stage, mean age, overweight, PS, white blood count (WBC), NLR, albumin, and ALP levels. The OS was higher in the BMI ≥ 23 group compared to the BMI < 23 group (620.0 vs. 311.7 days, p < 0.001, Figure 1A). Furthermore, patients who were overweight exhibited longer PFS (421.3 vs. 200.9 days, p = 0.001, Figure 1B).
Table 2: Univariate factor
Independent variable |
HR (95% CI) |
p-value |
|---|---|---|
Stage |
0.049* |
|
Stage : 1–3 |
1.00 |
|
Stage : 4 |
1.40 (1.00–1.95) |
0.049 |
Age |
0.001* |
|
Age < 70 years |
1.00 |
|
Age ≥ 70 years |
1.63 (1.22–2.19) |
0.001* |
Gender |
0.208 |
|
Female |
1.00 |
|
Male |
0.78 (0.53–1.15) |
0.208 |
Body Mass Index |
<0.001* |
|
BMI < 23 |
1.00 |
|
BMI ≥ 23 |
0.56 (0.40–0.77) |
<0.001* |
Metastases |
0.992 |
|
No Metastases |
1.00 |
|
Organ metastasis : 1 |
1.02 (0.72–1.46) |
0.902 |
Organs metastases > 1 |
1.01 (0.70–1.47) |
0.951 |
Complication |
0.445 |
|
No complication |
1.00 |
|
Complication |
1.16 (0.79–1.71) |
0.445 |
Charlson Comorbidity Index (CCI) |
1.03 (0.97–1.10) |
0.328 |
Chief Complain (CC) |
0.135 |
|
Respiratory system |
1.00 |
|
Other |
1.36 (0.91–2.02) |
0.135 |
ECOG PS |
<0.001* |
|
PS : 0–2 |
1.00 |
|
PS : > 2 |
2.06 (1.51–2.83) |
<0.001* |
WBC (UL) |
0.007* |
|
WBC < 4500 |
1.00 |
|
WBC within normal |
1.72 (0.84–3.51) |
0.140 |
WBC ≥ 11000 |
2.71 (1.27–5.79) |
0.010* |
NLR |
0.004* |
|
NLR < 3.04 |
1.00 |
|
NLR ≥ 3.04 |
1.54 (1.14–2.06) |
|
PLT (10^3/uL) |
1.00 (1.00–1.00) |
0.132 |
Albumin (g/dL) |
0.024* |
|
Albumin > 3.5 |
1.00 |
|
Albumin ≤ 3.5 |
1.42 (1.05–1.93) |
|
ALP (U/L) |
0.001* |
|
ALP < 104 |
1.00 |
|
ALP ≥ 104 |
1.90 (1.30–2.76) |
|
Chemotherapy cycles |
1.01 (0.94–1.09) |
0.743 |
Smoking (pack per year) |
0.786 |
|
Smoking < 182.5 |
1.00 |
|
Smoking ≥182.5 |
0.94 (0.58–1.52) |
Abbreviation: BMI: Body Mass Index; Charlson comorbidity index; CC: Chief Complain; ECOG PS: Eastern cooperative oncology group performance status; WBC: white blood count; NLR: Neutrophil/Lymphocyte Ratio; PLT: levels of platelet; ALP: alkaline phosphatase.
*P-value < 0.05.
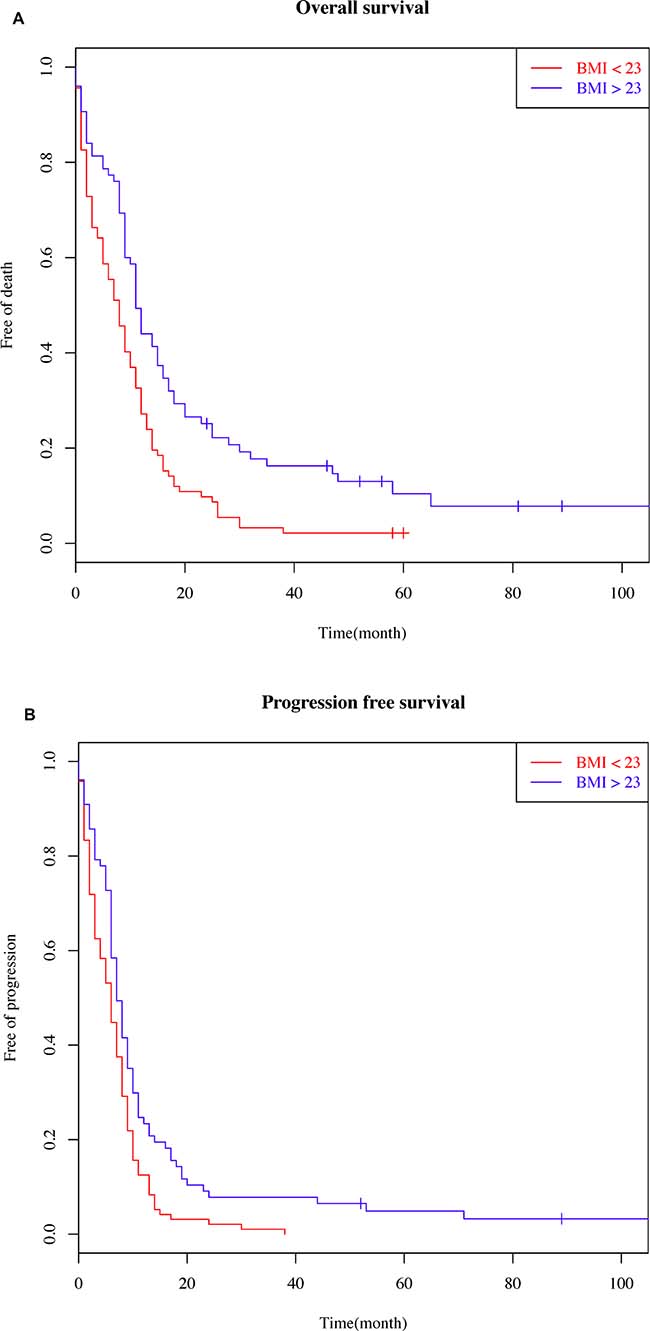
Figure 1: Patient Survival Curves (Kaplan–Meier survival plots). (A) with respect to body mass index (BMI) on overall survival (BMI cut-off value of 23) and (B) with respect to BMI on disease-free survival (BMI cut-off value of 23).
Cox proportional hazards models for multiple factors associated with OS
The prognostic effect of clinicopathologic variables associated with OS is summarized in Table 3. In model 1, we adjusted for the basic characteristic variables that were significantly different between the BMI ≥ 23 and BMI < 23 groups. In model 2, we adjusted for the variables that were significantly different as indicated in Tables 1 and Table 2 (i.e., disease stage, age, gender, BMI, metastases, CCI, WBC, PS, NLR, albumin, PLT, ALP levels, complication, and smoking). Model 3 is the final result of a further multivariate analysis, and demonstrated that, BMI ≥ 23 (Hazard Ratio (HR) = 0.45, 95% Confidence Interval (CI) = 0.31–0.79, p = 0.004); age ≥ 70 years (HR = 2.90, 95 % CI = 1.69–4.98, p < 0.001), CCI < 8 (HR = 0.45, 95% CI = 0.26–0.79; p = 0.005); WBC ≥ 11000/μL (HR = 3.70, 95% CI=1.05–13.03, p = 0.042); ECOG PS > 2 (HR = 1.93, 95% CI=1.15–3.24, p = 0.013); and smoking ≥182.5 pack per year (HR = 2.32, 95% CI = 1.13–4.76, p = 0.019) independently predicted OS (Table 3), after adjusting for stage, age, gender, BMI, CCI, WBC, PS, NLR, albumin, PLT, and ALP levels and we furthermore adjusted additional four variables (respiratory chief complain, metastasis to organs, complications, and smoking), that were deemed not statistically significant in the univariate analyses but were still clinically meaningful risk factors.
Table 3: Multivariate factors
Model 1 |
Model 2 |
Model 3 |
||||
|---|---|---|---|---|---|---|
Independent variable |
HR (95% CI) |
p-value |
HR (95% CI) |
p-value |
HR (95% CI) |
p-value |
Stage : 4 |
1.40 (1.00–1.95) |
0.049 |
1.55 (0.91–2.66) |
0.106 |
1.53 (0.82–2.83) |
0.180 |
Age ≥ 70 years |
1.66 (1.07–2.57) |
0.024 |
2.90 (1.69–4.98) |
<0.001* |
||
Female |
0.59 (0.33–1.07) |
0.082 |
||||
BMI ≥ 23 |
0.56 (0.40–0.77) |
<0.001 |
0.69 (0.46–0.91) |
0.041 |
0.45 (0.31–0.79) |
0.004* |
Metastases > 1 organs |
1.20 (0.74–1.96) |
0.456 |
||||
CCI < 8 |
0.97 (0.72–1.30) |
0.850 |
0.58 (0.36–0.93) |
0.025 |
0.45 (0.26–0.79) |
0.005* |
WBC ≥ 11000(UL) |
1.88 (0.64–5.52) |
0.251 |
3.70 (1.05–13.03) |
0.042* |
||
CC of Respiratory system |
1.74 (0.92–3.30) |
0.090 |
||||
ECOG PS > 2 |
2.06 (1.51–2.83) |
<0.001 |
1.80 (1.14–2.83) |
0.011 |
1.93 (1.15–3.24) |
0.013* |
NLR ≥ 3.04 |
1.00 (0.65–1.53) |
0.995 |
0.88 (0.53–1.46) |
0.625 |
||
Albumin ≤ 3.5 (g/dL) |
1.42 (1.05–1.93) |
0.024 |
0.77 (0.48–1.21) |
0.254 |
0.75 (0.44–1.25) |
0.269 |
PLT ≤ 150 or ≥ 450 (10^3/uL) |
1.14 (0.76–1.70) |
0.532 |
1.21 (0.69–2.12) |
0.515 |
1.68 (0.77–3.71) |
0.195 |
Complication$ |
1.68 (0.91–3.08) |
0.096 |
||||
ALP ≥ 104 (U/L) |
1.90 (1.30–2.76) |
0.001 |
1.34 (0.80–2.26) |
0.263 |
1.19 (0.65–2.19) |
0.577 |
Smoking ≥ 182.5 |
2.32 (1.13–4.76) |
0.022* |
Abbreviation: BMI: Body Mass Index; CCI: Charlson comorbidity index; WBC: white blood count; CC: chief complaint; ECOG PS: Eastern cooperative oncology group performance status; NLR: Neutrophil/Lymphocyte Ratio; PLT: levels of platelet; ALP: alkaline phosphatase.
$Superior vena cava syndrome, syndrome of inappropriate antidiuretic hormone secretion, Cushing’s syndrome.
*P-value < 0.05.
We evaluated the interaction between BMI and PS with regards to OS; for this analysis, all patients were divided into 4 groups according to the 2 prognostic factors: group A (BMI < 23 and PS ≤ 2), group B (BMI < 23 and PS > 2), group C (BMI ≥ 23 and PS ≤ 2), and group D (BMI ≥ 23 and PS > 2). Survival curves for each group are shown in Figure 2. The median OS of group A, group B, group C, and group D were 12.1 months, 6.2 months, 17.3 months, and 9.1 months, respectively. When PS ≤ 2 (group A and group B), the survival of patients with BMI ≥ 23 was significantly higher than that of patients with BMI < 23 (log-rank P <0.001). No survival difference was observed between patients with BMI < 23 or BMI ≥ 23 when PS > 2 (group C vs. group D, log-rank P = 0.062). BMI ≥ 23 and PS ≤ 2 (group C) had the best OS (HR = 0.31, 95% CI = 0.16–0.61, P < 0.05). The above results imply that there was a marginal quantitative interaction between PS and BMI, although this interaction was not significant in the final Cox-regression model (p = 0.068) (Table 4).
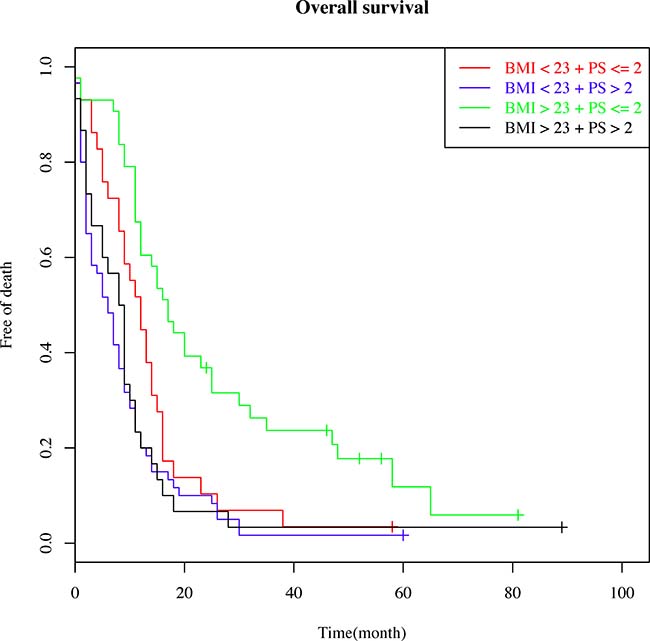
Figure 2: Patient survival curves showing the interaction between overall survival and two prognostic factors: the body mass index (BMI) and performance status (PS). Patients were divided into 4 groups according to the 2 prognostic factors: a) BMI < 23 and PS ≤ 2; b) BMI < 23 and PS > 2; c) BMI > 23 and PS ≤ 2; and d) BMI > 23 and PS > 2.
Table 4: Adjusted Interaction of BMI and PS
Stratified variable |
ECOGPS |
Adj-HR (95% CI) |
P-value |
P-value |
|---|---|---|---|---|
BMI |
0.068 |
|||
BMI < 23 |
PS > 2 |
1.00 |
||
PS ≤ 2 |
0.58 (0.29–1.15) |
0.120 |
||
BMI > 23 |
PS > 2 |
1.00 |
||
PS ≤ 2 |
0.31 (0.16–0.61) |
0.001* |
Abbreviation: BMI: Body Mass Index; ECOG PS: Eastern cooperative oncology group performance status;
*P-value < 0.05.
DISCUSSION
To the best of our knowledge, only Inmate et al. 2016 reported the lactate dehydrogenase (LDH) level and BMI maybe useful prognostic factors in SCLC patient [25]. Our present study provides more evidence to explore the association of overweight BMI with clinicopathological variables and survival outcome in SCLC patients of Asia population.
Lung cancer remains the top cause of cancer-related death worldwide [26]. Compared to NSCLC, SCLC is more aggressive and relapses early, and despite its higher initial sensitivity to chemotherapy, the prognosis remains poor for patients with this disease [27]. Over the past few decades, some potential surrogate markers for SCLC have been studied and reported; however, prognosis has been challenging to predict [28–31], underscoring the urgent need for useful factors that can differentiate the prognosis of various patient populations.
Our study found that SCLC patients who were overweight prior to treatment had better OS than their normal and underweight counterparts (p < 0.001). A deeper multivariate analysis also identified that being overweight was an independent prognostic factor for SCLC patients. Excess weight was associated with an increased risk of mortality in patients with several other cancer types, including breast, colorectal, pancreatic, endometrial, and prostate cancer [32–34]. However, with respect to lung and upper aero-digestive cancer, low BMI may actually increase the risk of mortality [24, 35].
Wang et al. (2017) [4] conducted a meta-analysis to explore the association between BMI and OS in all kinds of lung cancer. When patients were stratified by ethnicity, Asians with elevated BMI had higher OS than Westerners. Compared with normal-weight patients, underweight patients had reduced lung cancer-specific survival as well as lower OS. However, among the 51 cohorts studied, 50 were of NSCLC and only one of SCLC [25].
Consistent with studies of NSCLC patients [9], we found that OS and PFS were higher in SCLC patients whose BMI was ≥ 23 compared to those whose BMI was < 23 (OS: 620.0 vs. 311.7 days, p < 0.001; PFS: 421.3 vs. 200.9 days, p = 0.001, Figure 1A and 1B). In contrast, there was no statistically significant relationship between the BMI and age, gender, stage, CCI, WBC, NLR, albumin, PLT, and ALP. Multivariate Cox analysis indicated that being overweight prior to treatment was an independent prognostic factor for long-term outcome (HR = 0.58, 95% CI = 0.39–0.87, p = 0.008) (Table 3).
These data indicate that pending future validation, increased BMI has the potential to be an easily measurable prognostic indicator. A marginal interaction between PS and BMI was also noted (p = 0.068). Patients with PS ≤ 2 and overweight (BMI ≥ 23) had the longest OS (p < 0.05). This result needs to be validated due to the small sample size available for our study.
The mechanisms underlying the relationship between BMI and mortality in patients with lung cancer is still not clearly understood. Patients with respiratory diseases can exhibit weight loss over many years, contributing to their mortality; perhaps alluding to the negative impact of reduced weight on lung cancer patient survival [36]. In addition, weight gain may imply better PS among lung cancer patients [37]. Yet another possibility is that the inverse association between BMI and mortality risk may reflect differences between tobacco smokers and non-smokers. Nicotine activates the melanocortin axis in the brain, suppressing the appetite and reducing food intake [35].
The present study had the following limitations: the single institutional, retrospective design, small population size and population heterogeneity. We are also worried about that selection bias may make it difficult to generalize the results of our analysis and the relative small population failed to detect any significant difference between groups and influential factors.
These clinical trials should investigate the association of pretreatment body weight of SCLC patients with OS, while controlling for important potential confounding factors, such as sex, age, treatment, lifestyle, and disease duration. Also, as a retrospective study, we were not able to assess pretreatment overweight in a prospective cohort to fully assess its role as a prognostic factor in SCLC. Where possible, the effect of weight change over the course of treatment on SCLC patient survival of patients should be evaluated.
In conclusion, being overweight prior to diagnosis is associated with improved survival and in combination of well performance status are superior prognostic factors of patients with SCLC based on our single institute experience. However, the selection biases maybe existed due to retrospective design, further studies are eagerly needed. The pretreatment BMI and PS can be more easily measured than clinical cancer stage, serum biomarker, gene mutation, suggesting that BMI may provide an additional simple and convenient prognostic factor for OS in SCLC patients. Furthermore, this may help inform decision making in the clinic. Finally, the maintenance of adequate body weight is likely to increase a lung cancer patient’s life-span.
MATERIALS AND METHODS
Population selection
A total of 260 patients who had histologically-confirmed SCLC from January 2000 to March 2012, and treated at the Tri-Service General Hospital/National Defense Medical Center (TSGH/NDMC) were evaluated for eligibility. Patients with pretreatment laboratory values and physical measurement information were included, while patients with incomplete follow-up data or body weight data were excluded. Follow-up information was collected from hospitalization records or from family contact. A total of 173 eligible patients were enrolled for the evaluation.
Data collection
The detailed clinical characteristics including BMI, smoking history, age, gender, PS, disease stage, therapeutic strategies, and survival were obtained for medical records. Serum laboratory data were retrospectively collected based on pretreatment evaluation from the medical records. The time to measure body weight is within 10 days before diagnosis. Besides, if there were any body weight changes in 10 days, we took the average body weight as premorbid data. The cut-off value for the BMI was set at 23, which was adjusted to the Asia-Pacific population according to the World Health Organization Expert consultation [38]. We used the tumor-node-metastasis cancer staging system by the American Joint Committee on Cancer to classify the cancer. The OS was defined as time from the date of diagnosis to the date of death. The PFS was defined as a period from the first day of diagnosis until documented objective tumor progression or death. The date of follow up cut-off was March 25, 2017.
Statistical analysis
Continuous variables were described using mean ± SD and the categorical variables were analyzed by a Chi-squared test. The optimal cut-off values were determined using time-dependent receiver operating curve (ROC) analysis. Time-dependent ROC analysis was performed using R software, version 3.2.3 and the ‘time ROC’ package [39]. The Kaplan–Meier method and log-rank tests were employed to compare the survival curves. Multivariate analyses were conducted to identify significant independent prognostic factors for the prognosis. Hazard ratio (HR) for each factor was calculated using a Cox-regression proportional hazards model, and median OS was calculated using Kaplan–Meier analysis. Multivariate analysis was performed using factors satisfying p-values less than 0.05 from the univariate analysis. A p-value less than 0.05 was used as the cut-off value for statistical significance. Software “R” version 3.2.3 was used for the statistical analysis.
ACKNOWLEDGMENTS
None.
CONFLICTS OF INTEREST
The authors report no conflicts of interest.
FUNDING
This study was performed without outside funding.
REFERENCES
1. Hann CL, Rudin CM. Management of small-cell lung cancer: incremental changes but hope for the future. Oncology (Williston Park). 2008; 22:1486–1492.
2. Kuo YH, Lin ZZ, Yang YY, Shao YY, Shau WY, Kuo RN, Yang JC, Lai MS. Survival of patients with small cell lung carcinoma in Taiwan. Oncology. 2012; 82:19–24.
3. Zarogoulidis K, Boutsikou E, Zarogoulidis P, Darwiche K, Freitag L, Porpodis K, Latsios D, Kontakiotis T, Huang H, Li Q, Hohenforst-Schmidt W, Kipourou M, Turner JF, et al. The role of second-line chemotherapy in small cell lung cancer: a retrospective analysis. Onco Targets Ther. 2013; 6:1493–1500.
4. Wang J, Xu H, Zhou S, Wang D, Zhu L, Hou J, Tang J, Zhao J, Zhong S. Body mass index and mortality in lung cancer patients: a systematic review and meta-analysis. Eur J Clin Nutr. 2018. 72:4–17.
5. Lieffers JR, Mourtzakis M, Hall KD, McCargar LJ, Prado CM, Baracos VE. A viscerally driven cachexia syndrome in patients with advanced colorectal cancer: contributions of organ and tumor mass to whole-body energy demands. Am J Clin Nutr. 2009; 89:1173–1179.
6. Argiles JM, Busquets S, Stemmler B, Lopez-Soriano FJ. Cancer cachexia: understanding the molecular basis. Nat Rev Cancer. 2014; 14:754–762.
7. Ottery FD. Cancer cachexia: prevention, early diagnosis, and management. Cancer Pract. 1994; 2:123–131.
8. Correia MI, Waitzberg DL. The impact of malnutrition on morbidity, mortality, length of hospital stay and costs evaluated through a multivariate model analysis. Clin Nutr. 2003; 22:235–239.
9. Paccagnella A, Morassutti I, Rosti G. Nutritional intervention for improving treatment tolerance in cancer patients. Curr Opin Oncol. 2011; 23:322–330.
10. Mitrache C, Passweg JR, Libura J, Petrikkos L, Seiler WO, Gratwohl A, Stahelin HB, Tichelli A. Anemia: an indicator for malnutrition in the elderly. Ann Hematol. 2001; 80:295–298.
11. Bailey KV, Ferro-Luzzi A. Use of body mass index of adults in assessing individual and community nutritional status. Bull World Health Organ. 1995; 73:673–680.
12. Brookes GB. Nutritional status--a prognostic indicator in head and neck cancer. Otolaryngol Head Neck Surg. 1985; 93:69–74.
13. Fearon K, Strasser F, Anker SD, Bosaeus I, Bruera E, Fainsinger RL, Jatoi A, Loprinzi C, MacDonald N, Mantovani G, Davis M, Muscaritoli M, Ottery F, et al. Definition and classification of cancer cachexia: an international consensus. Lancet Oncol. 2011; 12:489–495.
14. Martin L, Birdsell L, Macdonald N, Reiman T, Clandinin MT, McCargar LJ, Murphy R, Ghosh S, Sawyer MB, Baracos VE. Cancer cachexia in the age of obesity: skeletal muscle depletion is a powerful prognostic factor, independent of body mass index. J Clin Oncol. 2013; 31:1539–1547.
15. Mantovani A. Cancer: Inflaming metastasis. Nature. 2009; 457:36–37.
16. Crumley AB, McMillan DC, McKernan M, McDonald AC, Stuart RC. Evaluation of an inflammation-based prognostic score in patients with inoperable gastro-oesophageal cancer. Br J Cancer. 2006; 94:637–641.
17. Kalantar-Zadeh K, Horwich TB, Oreopoulos A, Kovesdy CP, Younessi H, Anker SD, Morley JE. Risk factor paradox in wasting diseases. Curr Opin Clin Nutr Metab Care. 2007; 10:433–442.
18. Kim DK, Oh SY, Kwon HC, Lee S, Kwon KA, Kim BG, Kim SG, Kim SH, Jang JS, Kim MC, Kim KH, Han JY, Kim HJ. Clinical significances of preoperative serum interleukin-6 and C-reactive protein level in operable gastric cancer. BMC Cancer. 2009; 9:155.
19. Li J, Jiang R, Liu WS, Liu Q, Xu M, Feng QS, Chen LZ, Bei JX, Chen MY, Zeng YX. A large cohort study reveals the association of elevated peripheral blood lymphocyte-to-monocyte ratio with favorable prognosis in nasopharyngeal carcinoma. PLoS One. 2013; 8:e83069.
20. Shao N, Cai Q. High pretreatment neutrophil-lymphocyte ratio predicts recurrence and poor prognosis for combined small cell lung cancer. Clin Transl Oncol. 2015; 17:772–778.
21. Bethea TN, Rosenberg L, Charlot M, O’Connor GT, Adams-Campbell LL, Palmer JR. Obesity in relation to lung cancer incidence in African American women. Cancer Causes Control. 2013; 24:1695–1703.
22. Everatt R, Virviciute D, Kuzmickiene I, Tamosiunas A. Body mass index, cholesterol level and risk of lung cancer in Lithuanian men. Lung Cancer. 2014; 85:361–365.
23. Yun YH, Kim YA, Sim JA, Shin AS, Chang YJ, Lee J, Kim MS, Shim YM, Zo JL. Prognostic value of quality of life score in disease-free survivors of surgically-treated lung cancer. BMC Cancer. 2016; 16:505.
24. Duan P, Hu C, Quan C, Yi X, Zhou W, Yuan M, Yu T, Kourouma A, Yang K. Body mass index and risk of lung cancer: Systematic review and dose-response meta-analysis. Sci Rep. 2015; 5:16938.
25. Inomata M, Hayashi R, Tokui K, Taka C, Okazawa S, Kambara K, Ichikawa T, Yamada T, Miwa T, Kashii T, Matsui S, Tobe K. Lactate dehydrogenase and body mass index are prognostic factors in patients with recurrent small cell lung cancer receiving amrubicin. Tumori. 2016; 102:606–609.
26. Hage R, Elbers JR, Brutel de la Riviere A, van den Bosch JM. Surgery for combined type small cell lung carcinoma. Thorax. 1998; 53:450–453.
27. Kang MH, Go SI, Song HN, Lee A, Kim SH, Kang JH, Jeong BK, Kang KM, Ling H, Lee GW. The prognostic impact of the neutrophil-to-lymphocyte ratio in patients with small-cell lung cancer. Br J Cancer. 2014; 111:452–460.
28. Therasse P, Arbuck SG, Eisenhauer EA, Wanders J, Kaplan RS, Rubinstein L, Verweij J, Van Glabbeke M, van Oosterom AT, Christian MC, Gwyther SG. New guidelines to evaluate the response to treatment in solid tumors. European Organization for Research and Treatment of Cancer, National Cancer Institute of the United States, National Cancer Institute of Canada. J Natl Cancer Inst. 2000; 92:205–216.
29. Azab B, Shah N, Radbel J, Tan P, Bhatt V, Vonfrolio S, Habeshy A, Picon A, Bloom S. Pretreatment neutrophil/lymphocyte ratio is superior to platelet/lymphocyte ratio as a predictor of long-term mortality in breast cancer patients. Med Oncol. 2013; 30:432.
30. Feng JF, Huang Y, Chen QX. Preoperative platelet lymphocyte ratio (PLR) is superior to neutrophil lymphocyte ratio (NLR) as a predictive factor in patients with esophageal squamous cell carcinoma. World J Surg Oncol. 2014; 12:58.
31. Wang X, Jiang R, Li K. Prognostic significance of pretreatment laboratory parameters in combined small-cell lung cancer. Cell Biochem Biophys. 2014; 69:633–640.
32. Arnold M, Leitzmann M, Freisling H, Bray F, Romieu I, Renehan A, Soerjomataram I. Obesity and cancer: An update of the global impact. Cancer Epidemiol. 2016; 41:8–15.
33. Secord AA, Hasselblad V, Von Gruenigen VE, Gehrig PA, Modesitt SC, Bae-Jump V, Havrilesky LJ. Body mass index and mortality in endometrial cancer: A systematic review and meta-analysis. Gynecol Oncol. 2016; 140:184–190.
34. Zhong S, Yan X, Wu Y, Zhang X, Chen L, Tang J, Zhao J. Body mass index and mortality in prostate cancer patients: a dose-response meta-analysis. Prostate Cancer Prostatic Dis. 2016; 19:122–131.
35. Tarleton HP, Park SL, Zhu WM, Lee YC, Hashibe M, Morgenstern H, Tashkin DP, Mao JT, Cozen W, Mack TM, Zhang ZF. Body mass index change in adulthood and lung and upper aerodigestive tract cancers. Int J Cancer. 2012; 131:1407–1416.
36. Nakagawa T, Toyazaki T, Chiba N, Ueda Y, Gotoh M. Prognostic value of body mass index and change in body weight in postoperative outcomes of lung cancer surgery. Interact Cardiovasc Thorac Surg. 2016; 23:560–566.
37. Patel JD, Pereira JR, Chen J, Liu J, Guba SC, John WJ, Orlando M, Scagliotti G, Bonomi PD. Relationship between efficacy outcomes and weight gain during treatment of advanced, non-squamous, non-small-cell lung cancer patients. Ann Oncol. 2016; 27:1612–1619.
38. WHO Expert Consultation. Appropriate body-mass index for Asian populations and its implications for policy and intervention strategies. Lancet. 2004; 363:157–163.
39. Robin XN, Hainard A, Tiberti N, Lisacek F, Sanchez JC, Müller M. pROC: an open-source package for R, S+ to analyze and compare ROC curves. BMC Bioinformatics. 2011; 12:77.