
INTRODUCTION
The diagnosis of the borderline lesions are challenging in clinical practice [1–3]. The identification of highly indolent noninvasive follicular thyroid neoplasms with papillary-like nuclear features (NIFTP) from the invasive malignant encapsulated follicular variant of papillary thyroid carcinoma (EFVPTC) can prevent overdiagnosis and overtreatment of NIFTP patients [4]. There is increasing recognition to utilize biomarker analysis to complement histopathological diagnosis and prognosis management decisions. Our laboratory has been investigating protein biomarkers for thyroid carcinomas [5–10] and showed that programmed death-ligand 1 (PD-L1) overexpression, predominantly localized in cytoplasm and occasionally in plasma membrane of tumor cells, is a useful prognostic marker for aggressive papillary thyroid cancer and its variants [11]. Shi et al. independently confirmed the positive correlation of increased PD-L1 expression with PTC recurrence [12]. Fu et al. in our lab recently demonstrated PD-L1 immunohistochemistry (IHC) staining as an ancillary technique in distinguishing invasive EFVPTC from NIFTP and supported the reclassification of NIFTP [13, 14] even if the tumor size is more than 4 cm or the patients are older than 45 years of age [15]. However, all reports to date have relied on manual scoring that is time consuming and can be subject to individual bias. As pathology evolves into a more digital discipline, the need for the development of a digital image analysis (DIA) tool that could provide an efficient, reproducible, and accurate quantitation of protein biomarker expression came into focus.
Conventional DIA IHC stain quantitation requires defining an area surrounding each nucleus as cytoplasm from the nucleus border [16–21]. With this bottom-up approach wherein there is a sequential progression from the initial segmentation of the target cell nucleus to the derivation of the cytoplasmic space, correct identification and proper delineation of viable follicular cell nuclei are prerequisite to the quality of the extracted data. Tumor cell phenotyping is challenging without a definitive cell marker. The difficulties are twofold: (i) differentiating target nuclei in a multicellular tissue where different cells have overlapping morphometric characteristics requires a panel of criteria (i.e. size, perimeter, texture, and immunohistochemistry biomarker [22–26]) and fine tuning techniques (i.e. pattern recognition that utilizes correlation to neighbor nuclei features [27]); and (ii) there is a large variation in nuclear morphometry among cancer variants of the same tissue and the progression of disease [28–32]. An alternative top-down DIA approach may circumvent the above mentioned challenges. The protocol starts by first exploiting tissue components and structures. The tissue histomorphology outlined then breaks down into smaller segments, where the region of interest (ROI) for IHC quantitation is specified. The latter approach more closely mimics the pathologists’ practice in assessing tissue staining. Prior knowledge of histomorphology and staining pattern is activated to define tissue components, following which the target cells and area of interest for IHC quantification are derived.
High efficiency DIA can be achieved through strategically sampling a tumor. For pixel-precision in feature extraction, DIA quantification is usually conducted at high resolution (20X). Analyzing the whole lesion at high resolution is time consuming, whereas analyzing at low resolution reduces accuracy. One approach to circumvent this problem is to screen the tumor at low resolution to extract a sampling subset and then within these subROIs to perform DIA quantitation at high resolution. In the initial semi-manual DIA, the user defines subROIs in the tumor where the DIA protocol package (ThyApp), a systematic image processing operation algorithm developed in our lab using the Visiopharm platform, is applied. Moving towards minimizing inter- and intra-observer variability, automatic subROI selection methods are applied. We evaluated tumor sampling methods including uniform systematic random sampling (SURS) and a combination of nuclear density and 3,3′-Diaminobenzidine (DAB) intensity hotspots. The aim of this study was to develop a fully automatic DIA algorithm that provides an efficient, objective, and accurate quantitation of PD-L1 expression. A standardized technical and interpretational method can be used as a useful aid to histopathological diagnosis to effectively distinguish NIFTP from invasive EFVPTC and avoid overdiagnosis and overtreatment of NIFTP.
RESULTS
Clinical and pathological characteristics of the patient cohort
The clinicopathological characteristics of the study cohort are summarized in Table 1. Among the 153 cases meeting the inclusion criteria, 26 cases were classified as benign nodules, 48 as NIFTP, 44 as EFVPTC and 35 cases with predominant coexisting lymphocytic and Hashimoto’s thyroiditis (LT).
Table 1: Demographics and clinicopathologic features of patient cohort
Characteristics |
Total cases (n = 153) |
|---|---|
Age, mean (range) |
50.6 (15–79) |
Gender |
n (%) |
Male |
|
<45 years |
10 (7) |
≥45 years |
22 (14) |
Female |
|
<45 years |
47 (31) |
≥45 years |
74 (48) |
Pathological diagnosis |
n (%) |
Benign |
|
Multiple hyperplastic nodules |
23 (15) |
Cyst |
1 (0.7) |
Follicular adenoma |
2 (1.3) |
Neoplasm |
|
NIFTP |
48 (31) |
EFVPTC |
44 (29) |
Lymphocytic Thyroiditis (LT)* |
35 (23) |
*Lymphocytic thyroiditis (LT) was separated from other categories because of coexisting advanced Lymphocytic or Hashimoto’s thyroiditis.
Noninvasive follicular thyroid neoplasms with papillary-like nuclear features (NIFTP); encapsulated follicular variant of papillary thyroid carcinoma (EFVPTC).
DIA of PD-L1 expression distinguished between NIFTP and invasive EFVPTC
With the reclassification of NIFTP and the emergence of PD-L1 as a protein biomarker to differentiate NIFTP from invasive EFVPTC, we examined whether the DIA application protocol developed, ThyApp, could be used to assess PD-L1 expression and to distinguish the subgroups. Representative images for each subgroup are shown in Figure 1. From the original bright field images, it was observed DAB intensities were elevated in invasive EFVPTC and lymphocytic thyroiditis (LT) in contrast to NIFTP and benign nodules (Figure 1B, 1D versus 1A, 1C). The ThyApp segmented the tissue into its components and specified the follicular cells accordingly (Figure 1E–1H). Stain mean intensity and percent positivity were quantitated (shown in yellow or light blue as PD-L1+ or PD-L1- area respectively, Figure 1E–1H insets). Controls for immunohistochemistry including oral cancer and anaplastic thyroid cancer for positive tissue controls, and encapsulated FVPTC for negative and positive controls are shown in Supplementary Figure 1A–1D, respectively. One-way ANOVA of DIA quantitated parameters including percent positivity and DAB mean intensity in Table 2 revealed PD-L1 expression significantly increased in invasive EFVPTC as compared to NIFTP (p < 0.001), and to benign nodules (p < 0.001); but none was observed between NIFTP and benign nodules (p = 0.113). The coexisting predominant lymphocytic/Hashimoto’s thyroiditis (LT) enhanced PD-L1 expression in tumor cells and follicular cells within the inflammatory infiltrated area. Therefore, the PD-L1 staining in the presence of increased lymphocytic infiltration needs to be interpreted with caution. Using a similar but not identical patient cohort from a previously published paper [13], DIA PD-L1 expression effectively differentiated NIFTP from invasive EFVPTC. In Figure 2 comparing manual scores and DIA quantitation of individual cases (each open circle represents one case), high correlation and substantial concordance coefficient, 0.80 and 0.78, respectively, were observed.
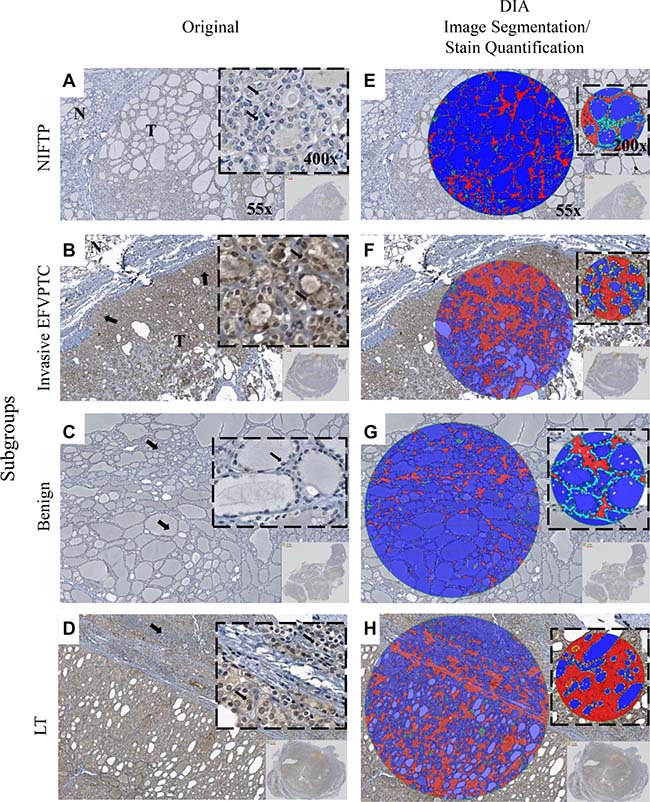
Figure 1: Immunohistochemistry staining and digital image analysis of PD-L1 expression in NIFTP, invasive EFVPTC, Benign and LT. Original bright field photomicrographs are shown in the first column. Tissue sections of: (A) NIFTP showed follicular architecture. Inset: PTC cytological features including nuclear enlargement, grooves, micronuclei, pale to clear chromatin and crowding (thin black arrows). Faint PD-L1 expression was detected in NIFTP; (B) invasive EFVPTC showed the focal capsular invasion (thick black arrows) and the follicular growth pattern of the tumor (T) as compared to normal thyroid (N). Inset: typical PTC features including enlarged nuclei with central clearing, grooves and crowding (thin black arrows). Moderate to strong PD-L1 expression was observed in EFVPTC with invasion; (C) benign hyperplastic nodules showed follicular of various sizes (thick black arrows). Inset: uniform round nuclei (thin black arrows). Minimal detectable PD-L1 expression was observed in benign nodules; and (D) LT showed severe lymphoplasmacytic infiltration with germinal center formation and follicles (thick black arrows). Inset: extensive lymphocytic and plasmacytic infiltrate with oxyphilic metaplasia of follicular cells (thin black arrows). Mild to moderate PD-L1 expression was observed. (E–H) Layer images showed DIA segmentation including parafollicular space (red) and colloid (blue). Zoomed in images shown in the insets, DIA quantified DAB and pseudocolored PD-L1+ (yellow) and PD-L1- (light blue) in the follicular cell. Image magnification are ×55 for (A–H), ×400 for (A–D) insets and ×200 for (E–H) insets, respectively. Capsule tissue in Figure 1 was not considered for DIA stain quantitation. Programmed-death ligand 1 (PD-L1); noninvasive follicular thyroid neoplasms with papillary-like nuclear features (NIFTP); encapsulated follicular variant of papillary thyroid carcinoma (EFVPTC); encapsulated follicular lesions/neoplasms with lymphocytic or Hashimoto’s thyroiditis (LT); papillary thyroid cancer (PTC); digital image analysis (DIA); 3,3′-Diaminobenzidine (DAB)
Table 2: Multiple comparisons of DIA analyzed PD-L1 expression
DIA Parameter |
Group (I) |
Group (J) |
Mean Difference (I–J) |
Std.Error |
Sig. (p) |
95% CI |
|
|---|---|---|---|---|---|---|---|
Lower Bound |
Upper Bound |
||||||
Percent |
NIFTP |
EFVPTC |
–23* |
4.9 |
<0.001 |
–36 |
–11 |
Benign |
13 |
5.7 |
0.1 |
–2 |
28 |
||
LT |
–14* |
5.2 |
0.04 |
–28 |
–0.6 |
||
Mean Intensity |
NIFTP |
EFVPTC |
30* |
6.2 |
<0.001 |
14 |
46 |
Benign |
–16 |
7.3 |
0.1 |
–35 |
2 |
||
LT |
19* |
6.6 |
0.02 |
2 |
37 |
||
*The mean difference is considered significant when p < 0.05.
>1000 viable tumor cells per case were evaluated.
Digital image analysis (DIA); programmed death-ligand 1 (PD-L1); noninvasive follicular thyroid neoplasms with papillary-like nuclear features (NIFTP); encapsulated follicular variant of papillary thyroid carcinoma (EFVPTC); encapsulated follicular lesions/neoplasms with lymphocytic or Hashimoto’s thyroiditis (LT).
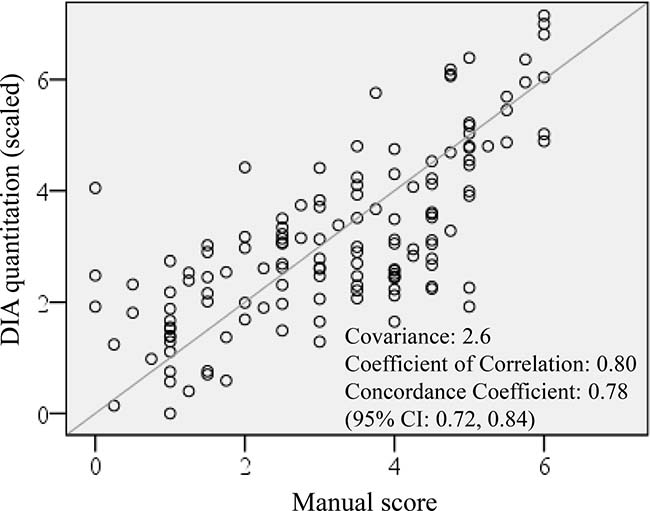
Figure 2: DIA PD-L1 expression quantitation concordance with manual scoring. DIA quantitation showed high correlation and substantial correlation coefficient with manual scoring, R = 0.80 and Rc = 0.78, respectively. Digital image analysis (DIA); Programmed death-ligand 1 (PD-L1); correlation (R); Concordance correlation coefficient (Rc).
Thyroid application protocol package development
Thyroid App was developed to quantify PD-L1 expression in follicular cells. Outlined in Figure 3 illustrated the series of computer-assisted operations performed on scanned IHC stained histology slides. Median-filter was used to remove background noise in the image, and color deconvolution and thresholding were applied to differentiate tissue components. The software subsequently pseudocolor labelled each segmented object. Post-processing further fine-tuned the labelling by morphometry. Activating prior knowledge of the geometrical relationship between the stroma and colloid, a morphological operator selected the interface composed of follicular cells. Nuclei were identified by Hematoxylin filter and excluded from the stain quantitation (Figure 3A and 3B). Features including DAB mean intensity and percent positivity were extracted as DIA output parameters for statistical analysis (Figure 3C).
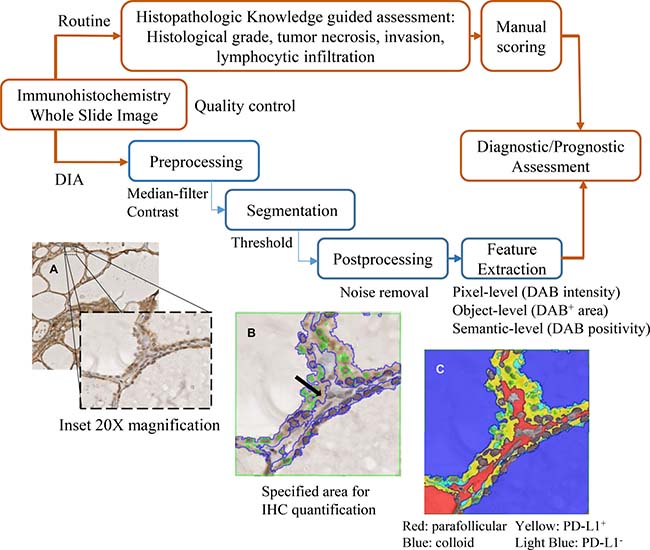
Figure 3: Overview of the DIA pipeline and histomorphological approach. The DIA developed in this study (blue/bottom panel) is compared with the histopathology-based assessment (red/top panel). In DIA, the whole slide image was imported to software system and then processed by serial operations (pre-processing, segmentation, and post-processing) in the App. (A) In the bright field photomicrographs, higher resolution (×200 magnification) was shown for the DIA close-up view. (B) Follicular cell (area delineated by DIA pseudocolor blue lines), excluding the nuclei (area delineated by green lines) were accurately specified (black arrow). (C) IHC was quantified in this region and threshold gated into DAB+ (yellow) or DAB- (light blue), representing PD-L1+ or PD-L1- areas respectively. The Visiopharm integrator system output parameters included DAB intensity and DAB percent positivity. Digital image analysis (DIA); application protocol package (App); Immunohistochemistry (IHC); 3,3′-Diaminobenzidine (DAB); Programmed death-ligand 1 (PD-L1)
Thyroid App verification – robustness to histomorphology variance
The robustness of ThyApp’s histomorphological approach to segment thyroid tissue components was examined. DIA was applied to thyroid neoplasms, with a variety of distinctive histomorphologies ranging from adenoma to follicular thyroid carcinoma (FTC), and to typical papillary thyroid carcinoma (PTC), representing the complexity of the surgical specimens analyzed in the clinics. Shown in Figure 4, ThyApp delineated the follicular cells for DIA IHC quantitation in adenomatous nodule, FTC, and two PTCs, demonstrating the algorithm’s versatility to quantitate thyroid tissues.
Thyroid App verification – reflectance of stain variance
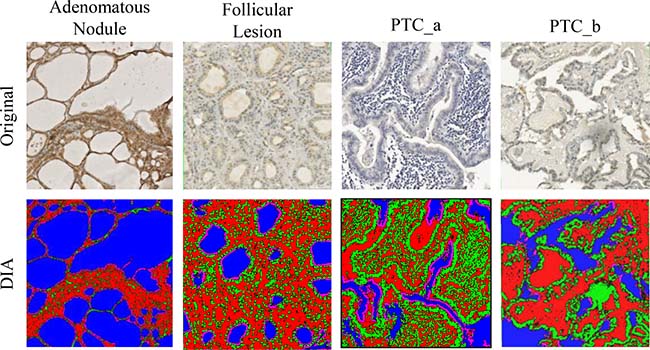
Figure 4: Application of ThyApp to PD-L1 expression analysis in thyroid tissues. The developed algorithm using histomorphological approach was used for quantitation of PD-L1 expression on Nanozoomer scanned images representing distinctive diseased thyroid histomorphology shown in the top panel. The robustness of the App was examined based on segmented results shown in the bottom panel with corresponding layer images with color labels; all pixels were sub-classified into colloid (blue), parenchyma (pink), stroma (red), and nucleus (green). Thyroid application protocol package (ThyApp); programmed death-ligand 1 (PD-L1).
To examine whether the DIA quantitation accurately assessed the IHC staining, photomicrographs of visually apparent low to high DAB intensity were analyzed by ThyApp (Figure 5). The exported DIA parameters, percent positivity and mean intensity, reflected PD-L1 expression level in the images. In the ordinal order of low to high DAB stain intensity, the DAB positive areas increased from 0.8 to 91 %, and DAB mean intensity with color values decreased from 231 to 98 (light to dark DAB from 255 to 0). In a larger DIA quantitated sample size with 113 images each categorized into low, mild, moderate and high PD-L1 expression subgroups according to their manual scores from 0–2, 2.1–4, 4.1–5.9 and 6–7, respectively, ANOVA revealed the average DAB mean intensity in each subgroup significantly differentiated from each other (p < 0.001 for all groups, Table 3).
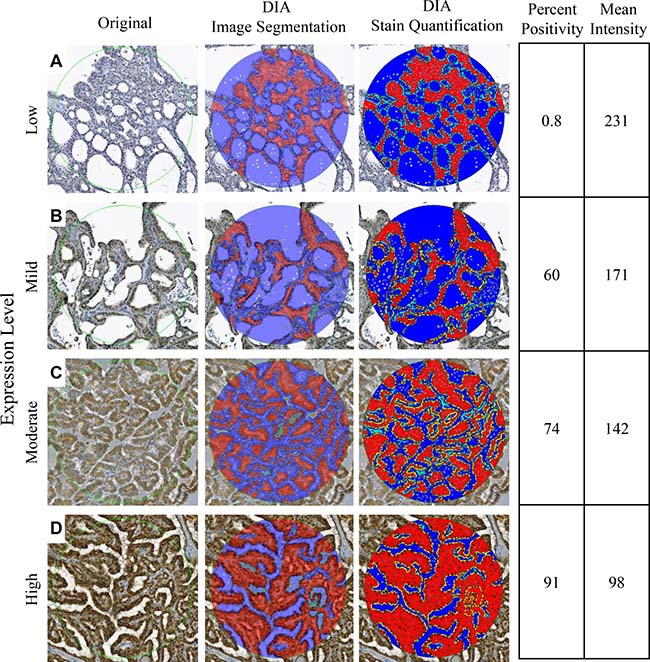
Figure 5: Reflectance of IHC staining. Representative digital images of low (A), mild (B), moderate (C), and high (D) PD-L1 expressions were digitally analyzed by ThyApp. The segmented results shown by the layer images (middle column, at 50% transparency) accurately labeled thyroid tissues subcomponents. Immunohistochemistry stain positivity and mean intensity was subsequently quantified. With an increase in protein expression level, percent positivity increased from 0.8 to 91%, and mean intensity color values decreased from 231 to 98. Magnification ×200. Immunohistochemistry (IHC); programmed death-ligand 1 (PD-L1); Thyroid application protocol package (ThyApp).
Table 3: DIA verification of stain variance
Group (I) |
Group (J) |
Mean Difference (I–J) |
Std.Error |
Sig. (p) |
95% CI |
|
|---|---|---|---|---|---|---|
Lower Bound |
Upper Bound |
|||||
Low expression |
Mild |
25* |
5.4 |
p < 0.001 |
11 |
39 |
Moderate |
42* |
5.4 |
p < 0.001 |
28 |
56 |
|
High |
83* |
5.8 |
p < 0.001 |
68 |
98 |
|
*The mean difference is considered significant when p < 0.05.
>1000 viable tumor cells per case were evaluated.
DIA outperformed manual scoring
In addition to ANOVA analysis that revealed the relationship between PD-L1 expression score mean averages in the subgroups, distribution of the expression scores in each of the subgroups was examined. The scores were from either manual scoring or DIA. With a large sample size, normal distribution of the frequency histogram for individual subgroup could be an indicator for objective assessment and evidence supporting true differentiation of the groups. Normal distribution was observed in all fully automatic DIAed subgroups (except LT), shown by the Shapiro-Wilk normality test with significance above 0.05; whereas, in manual scoring and manual subROI, NIFTP scores failed the normality test (Table 4). Digitally analyzed LT parameter values skewed towards low scores suggesting ThyApp could potentially mitigate the confounding factor from infiltrated lymphocytes through its histomorphological approach. Interobserver (two independent scorers) concordance correlation coefficient (Rc) was only satisfactory at 0.72 (95% CI: 0.65, 0.79) in manual scoring versus 1 in DIA. Moreover, manual scoring of 100 tumor cells took ~3 min. in contrast to DIA > 1000 follicular cells in less than one minute. In this study, ThyApp outperformed manual scoring providing an objective and reproducible quantitation of PD-L1 expression at higher efficiency.
Table 4: Shapiro-Wilk normality test in DIA quantitation versus manual scoring
Shapiro-Wilk Significance |
|||||
|---|---|---|---|---|---|
Manual Score |
Digital Image Analysis |
||||
Manual subROI |
SURS 3% |
Hotspot Nucleus |
Hotspot NuDAB |
||
NIFTP |
0.005 |
0.006 |
0.1 |
0.1 |
0.6 |
EFVPTC |
0.1 |
0.8 |
0.1 |
0.1 |
0.1 |
Benign |
0.1 |
0.2 |
0.5 |
0.4 |
0.1 |
LT |
0.3 |
0.2 |
0.1 |
0.03 |
0.3 |
*significant when p < 0.05.
Digital image analysis (DIA); programmed death-ligand 1 (PD-L1); noninvasive follicular thyroid neoplasms with papillary-like nuclear features (NIFTP); encapsulated follicular variant of papillary thyroid carcinoma (EFVPTC); encapsulated follicular lesions/neoplasms with lymphocytic or Hashimoto’s thyroiditis (LT).
SubROI method evaluation
Moving towards DIA full-automation, upon user-defined tumor ROI, four tumour sampling methods (manual, SURS, Hotspot Nucleus, and Hotspot Nucleus and DAB) in Figure 6 were individually implemented and evaluated. To determine the optimal area fraction required for SURS to represent the whole tumor cross section, a sample fraction study of five PD-L1 stained thyroid tissues was conducted. Three percent tumor area was found to be ideal considering measurement variance and time to process (~5 min.). Scoring smaller areas induced higher variance and scoring larger areas increased processing time: scoring 5 % took ~8 min and scoring 10 % took ~18 min per slide. Hotspot Nucleus and Hotspot Nucleus and DAB analyzing a fixed and relatively small area (1 × 10⁶ um2, > 1000 cells analyzed) took ~2 min each. The sample fraction study was also carried out on the complete set of cases to assess its ability to differentiate NIFTP from invasive EFVPTC. It was observed through sensitivity and specificity study that increasing the sample fraction from 3 to 5 or 10 % did not increase the area under curve (AUC), shown in Supplementary Table 1A. ANOVA test revealed significant differences in both DIA parameters between NIFTP and invasive EFVPTC in all three sample fraction percentages tested (Supplementary Table 1B), again confirming 3% SURS of the tumor was sufficient to effectively differentiate NIFTP from invasive EFVPTC.
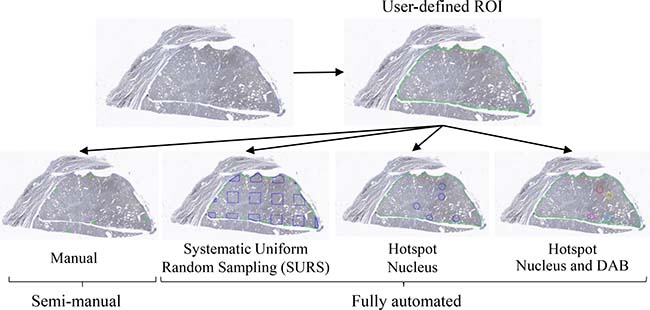
Figure 6: Tumor sampling methods. Upon receiving digital whole slide images, an operator delineated the tumor tissue (ROI). Next, areas within the ROI, subROIs, were selected by one semi-manual and three fully automatic subROI methods. In semi-manual, subROIs for DIA were manually selected by a histopathologist. Three fully automatic subROI tumor sampling methods: Systematic Uniform Random Sampling (SURS) (a specified fraction of tumor sampled); hotspot nucleus (Heatmap algorithm selecting subROIs at highest tumor cell nuclei density); hotspot nucleus and DAB (Heatmap algorithm selecting subROIs at highest tumor cell nuclei density and DAB positivity) were implemented and performance evaluated. Region of interest (ROI); digital image analysis (DIA); 3,3′-Diaminobenzidine (DAB).
DAB mean intensity at tumor sampled by hotspot nucleus best distinguished NIFTP from invasive EFVPTC
The PD-L1 expression parameters extracted from each subROI method were examined for its effectiveness to differentiate NIFTP from invasive EFVPTC. Mean intensity (continuous scale, average of pixel values from 255 to 0, light to dark) was superior to percent positivity (binary with each pixel coded as 1 or 0 for color intensity above or below a threshold) with lower p-values, larger AUC and smaller proportion of misclassified cases for all the subROI methods examined (Table 5). Under the criteria of low variance, high efficiency (less DIA processing time), and effectiveness in differentiating NIFTP from invasive EFVPTC (smaller p-value), the best performing fully-automated tumor sampling method was found to be Hotspot Nucleus (comparable p-value; however with ~2–3 min. per slide in contrast to ~4–5 min. for 3% SURS or Hotspot Nucleus and DAB), Table 6A. Comparing manual scores and DIA quantitation from each subROI method, it was observed Hotspot Nucleus had the highest concordance correlation coefficient value (0.66, 95% CI: 0.57, 0.73) (Table 6B).
Table 5: Clinical utility of tumor sampling methods
Sens. |
Spec. |
PPV |
NPV |
AUC |
Proportion Misclassified |
|
|---|---|---|---|---|---|---|
NIFTP vs. EFVPTC |
||||||
Manual subROI |
||||||
DAB Mean Intensity |
75% |
65% |
66% |
74% |
0.77 |
30% |
DAB Percent Positivity |
71% |
65% |
65% |
71% |
0.75 |
33% |
SURS 3% |
||||||
DAB Mean Intensity |
67% |
58% |
58% |
67% |
0.71 |
38% |
DAB Percent Positivity |
67% |
62% |
60% |
69% |
0.70 |
36% |
Hotspot – Nucleus |
||||||
DAB Mean Intensity |
67% |
66% |
63% |
70% |
0.73 |
33% |
DAB Percent Positivity |
67% |
62% |
60% |
69% |
0.73 |
36% |
Hotspot – Nucleus and DAB |
||||||
DAB Mean Intensity |
67% |
60% |
59% |
68% |
0.70 |
37% |
DAB Percent Positivity |
67% |
56% |
57% |
67% |
0.67 |
39% |
Manual Scoring |
77% |
64% |
65% |
76% |
0.73 |
30% |
Noninvasive follicular thyroid neoplasms with papillary-like nuclear features (NIFTP); encapsulated follicular variant of papillary thyroid carcinoma (EFVPTC); 3,3′-Diaminobenzidine (DAB); systematic uniform random sampling (SURS).
Table 6: subROI tumor sampling method evaluation
A
ANOVA Group Comparison |
||||||||
|---|---|---|---|---|---|---|---|---|
DIA Parameter |
Group (I) |
Group (J) |
Comparison Groups |
Mean Difference (I-J) |
Std.Error |
Sig. (p) |
95% CI |
|
Lower Bound |
Upper Bound |
|||||||
Percent Positivity |
NIFTP |
EFVPTC |
Manual subROI |
–24* |
5.0 |
<0.001 |
–37 |
–11 |
SURS 3% |
–20* |
5.6 |
0.002 |
–35 |
–6 |
|||
HotSpot-Nu |
–22* |
5.3 |
<0.001 |
–36 |
–8 |
|||
HotSpot-NuDAB |
–15* |
4.8 |
0.009 |
–28 |
–3 |
|||
Mean Intensity |
NIFTP |
EFVPTC |
Manual subROI |
31* |
6.3 |
<0.001 |
14 |
47 |
SURS 3% |
28* |
7.1 |
0.001 |
10 |
47 |
|||
HotSpot-Nu |
29* |
6.7 |
<0.001 |
12 |
47 |
|||
HotSpot-NuDAB |
23* |
5.9 |
0.001 |
8 |
38 |
|||
B
Concordance Measurement |
|||||
|---|---|---|---|---|---|
Tumor Sampling Method |
Covariance |
Correlation Coefficient |
Concordance Correlation Coefficient (Rc) |
Rc 95% CI |
|
Lower Bound |
Upper Bound |
||||
Manual subROI |
2.6 |
0.80 |
0.69 |
0.61 |
0.76 |
SURS 3% |
2.4 |
0.71 |
0.64 |
0.55 |
0.72 |
HotSpot - Nu |
2.5 |
0.75 |
0.66 |
0.57 |
0.73 |
HotSpot - NuDAB |
2.2 |
0.75 |
0.65 |
0.56 |
0.72 |
*The mean difference is considered significant when p < 0.05.
>1000 viable tumor cells per case were evaluated.
Region of interest (ROI); Digital image analysis (DIA); programmed death-ligand 1 (PD-L1); noninvasive follicular thyroid neoplasms with papillary-like nuclear features (NIFTP); encapsulated follicular variant of papillary thyroid carcinoma (EFVPTC); systematic uniform random sampling (SURS); 3,3′-Diaminobenzidine (DAB)
DISCUSSION
Distinguishing between invasive EFVPTC and NIFTP is clinically important and has gained increasing recognition. Given the wealth of insights that can be drawn from sectioned tissues, precise assessment of the protein biomarker expression could yield crucial ancillary diagnostic or prognostic information that have implications for personalized medicine and guiding treatment decisions [33].
Variability between expert assessments of IHC-stained tissue was reported to be high, reflecting the unevenness in histopathologists availability, difference in the level of training, and human factors (interobserver variability) [34–36]. Intratumor heterogeneity further negatively impacts pathologist concordance rates [37]. Nevertheless, surgeons, ENT specialists, pathologists and endocrinologists benefit from more precise diagnostic and prognostic evaluation of their patients’ thyroid tumors when protein biomarkers are assessed accurately [38]. Digital image analysis eliminates interobserver variability. A standardized and reproducible digital IHC protein biomarker assessment tool could offer means to efficiently and objectively quantitate the stain signal.
In this study, we developed and implemented a DIA protein biomarker IHC staining assessment algorithm in thyroid tissue using a histomorphological approach for PD-L1 expression. The ThyApp first processed the image as geometrical tissue components (colloid and stroma), and then applied operators to specifically select a spatially relevant element (the follicular cell). The software then performed quantitation and thresholding in this specified region. It consistently segmented thyroid variants with diverse histomorphology, extracted parameters reflecting stain variability, and effectively differentiated invasive EFVPTC from NIFTP and benign nodules by accurately quantitating PD-L1 expression in the follicular cells. The PD-L1 expression was significantly increased in EFVPTC with invasion comparing to NIFTP subgroup. Furthermore, the low PD-L1 expression in NIFTP comparable to benign nodules supports the concept that NIFTP are low risk thyroid cancers. However, we observed NIFTP PD-L1 expression spectrum distribution was positively skewed with a long tail and noted a few NIFTP cases with high PD-L1 expression scores. The close oncogenetic similarity and expression distribution overlap between the two encapsulated subgroups could contribute to the low sensitivity and specificity reported. Cho et al. indicated in a retrospective study that 3% of NIFTP had lymph node metastasis [39] and Parente et al. reported 6% of NIFTP showed evidence of malignant behavior [40]. These reinforcing the importance of detecting among NIFTP cases that could justify a possible concern for a carcinoma in situ risk or undetected lymphocytic infiltration and the need for cautious follow-up monitoring. We are cognizant that the limited follow up period (1.5–5 years) did not permit a clear statement regarding the relationship of the observed high PD-L1 expression in some NIFTP and their aggressiveness and/or recurrence. Nevertheless, the differential expression of PD-L1 in the different subgroups was significant and with further studies may support its future use in clinical management as an ancillary aid to a histopathologist report [14]. With continuing observations on the DIA test and its long term follow up on clinical outcomes, it will be possible using machine learning methods to improve the sensitivity and specificity of this test in the future. Cases of encapsulated follicular lesions/neoplasms without evidence of invasion and with coexisting lymphocytic infiltration were classified as a separate LT subgroup since the presence of mononuclear cell could elevate PD-L1 expression. This LT subgroup showed significant overexpression of PD-L1 suggesting high PD-L1 expression in thyroid tumors with coexisting chronic lymphocytic or Hashimoto’s thyroiditis need to be interpreted with caution to avoid overdiagnosis and overtreatment of benign thyroiditis lesions [41, 42].
The ThyApp was performed in five circular subROI regions distributed pentatonically, sampling the tumor tissue. Each subROI (2 × 10⁵ um2) analyzed a minimum of 1000 viable tumor cells. The circular subROI was chosen (over square) for best conformability to the irregular tumor tissue delineated. The size of the subROI has shown in literature to impact DIA parameter output [43]. It was optimized not to be smaller as it reduced the sensitivity from small sampling (e.g. intratumor heterogeneous), yet not to be larger as it claimed more DIA processing time and decreased specificity of feature studied.
From the preliminary results of this patient cohort, both DIA parameters extracted for PD-L1 expression, DAB percent positivity and mean intensity, showed capability to differentiate invasive EFVPTC from NIFTP and benign nodules. In addition, higher significance was observed with mean intensity suggesting a quantitative parameter that harbors information about stain intensity variation in a continuous scale may be more precise than one that contains only semi-quantitative information (stain intensity transformed into binary code above or below a threshold). In extension to the ThyApp developed, here we also report the first tumor sampling methods evaluation study for DIA thyroid tissue. Upon user delineation of the tumor tissue, ThyApp was conducted in subROIs selected based on: expert guided manual subROI selection that relied heavily on the individual’s knowledge and experience and three fully-automatic tumor sampling methods (SURS, Hotspot Nucleus, and Hotspot Nucleus and DAB). Based on the effectiveness, reproducibly, and efficiently to distinguish invasive EFVPTC from NIFTP, in this patient cohort, Hotspot Nucleus outperformed SURS and Hotspot Nucleus and DAB. In addition, it showed the highest concordance correlation coefficient to manual scoring suggesting the Hotspot Nucleus offered a simulated pathologist approach to focus on target areas where tumor cells were evaluated. Though Hotspot Nucleus and manual scoring showed similar AUC and proportion of misclassified cases, DIA is advantageous in providing reproducible data. The successful implementation of an objective and fully automatic DIA algorithm that reliably quantitates thyroid protein biomarker expression could be added to the pathologist’s report.
No training set is required for the ThyApp used in this study. Global thresholding values used for segmentation were selected gearing the App to be less sensitive to background staining variation across image. Consistent preservation and staining processes applied to tissue provides reliable information. The assumption holds relatively true in patient cohort where specimens were processed and stained in the same institution and facility; however, as specimen preparation becomes dynamic (i.e. when unstained slides are obtained from different regions [44, 45]; sectioned tissues are stained at different facilities [46–48]; stained slides are scanned using different scanners [49]), the degree of stain variation due to processing on the obtained whole slide images increase [50]. An App with pre-specified thresholding values has a preset tolerance to variability. To meet clinical demands, evolving and equipping ThyApp to be more robust and resistant to IHC staining and scanning variations could be favorable. Unsupervised segmentation and automatic thresholding techniques utilizing advanced mathematical modeling (i.e. K-means clustering [51]) have the potential to mitigate the risks associated with the slide-to-slide IHC stain variation. To fully validate ThyApp’s clinical utility, multicenter cohorts with subgroups classified by independent pathologists will be the subject of future studies. In addition, extracted feature reporting modalities could be investigated, including ordinal categorical scores and weighted score (i.e. H-score, assessing the immunoreactivity by a formula placing higher weight in strongly stained population and lesser weight to moderately and weakly stained nuclei). Considering lightly stained areas have higher potential to be noise, unspecific staining, or baseline protein expression, a smaller weight designated to this group of cells may be appropriate for assessing protein biomarker for tumor aggressiveness or malignant potential.
On the basis of this preliminary study and evaluation on the efficacy of DIA for IHC assessment in thyroid tissue, we report here a DIA method to quantitate protein expression using a histomorphological approach. The fully automatic DIA algorithm developed objectively quantitated PD-L1 expression in encapsulated thyroid neoplasms, distinguished invasive EFVPTC from NIFTP and benign nodules, and outperformed manual scoring in reproducibility and higher efficiency. The addition of digitalization of the glass slides and later computer assisted analysis could strengthen the argument supporting the justified cost required to perform DIA and further assist pathologists in diagnostic accuracy and subsequent personalized clinical management. Furthermore, the DIA method developed here specifying ROI for IHC quantitation by isolating the epithelium could also have potential applications for similar DIA in other glandular tissues, be it endocrine or exocrine, normal reactive or neoplastic types.
MATERIALS AND METHODS
Patients, specimens and immunohistochemistry
The retrospective study was approved by Research Ethics Board (REB #07-0212-E) of Sinai Heath System, Mount Sinai Hospital (MSH) in Toronto, Canada. From a total of 1859 cases of surgically removed thyroid nodules at MSH from Jan 2010 to May 2015, 153 cases were selected based on analysis of clinical charts, surgical pathology reports and histologic slides. Inclusion criteria for the study include: the presence of a recorded chart with the gender and age of the patient at the time of diagnosis, clinical history such as recurrence episodes, size of the nodule (more than 1 cm), focality (mono), and surgical pathology diagnosis of adenomatous nodules or EFVPTC as well as the existence of enough biological material in the paraffin blocks. It has been shown in the literature that NIFTP and EFVPTC share the same types of mutation [52] and NIFTP represents an indolent counterpart of EFVPTC. This study was performed using the similar patient cohorts with minor variation and inclusion/exclusion criteria for each subgroup studied as previously described in detail in our previous reports [13]. Archived formalin-fixed paraffin-embedded (FFPE) tissue blocks from the selected 153 thyroid nodules were retrieved from the MSH pathology tumor bank. Hematoxylin and eosin stained tissue sections were reviewed by two pathologists (CM, OP) and classified into four specific diagnostic subgroups: NIFTP (48 cases) and EFVPTC (44 cases), benign nodules (26 cases) and encapsulated follicular lesions/neoplasms with coexisting advanced lymphocytic or Hashimoto’s type lymphocytic thyroiditis (LT) (35 cases) [33, 53–55]. Briefly, the benign cases included adenomatous hyperplastic nodules and adenomas and were identified based on the presence of clear demarcation and/or encapsulation, follicular architecture and nuclei without PTC features [56]. The NIFTP subgroup included cases with well-demarcated and/or encapsulated lesions with follicular architecture, PTC-type nuclei and absence of capsular or vascular invasion. EFVPTC were diagnosed based on PTC nuclear features, an almost totally follicular architecture [56] and tumor invasion into capsule or extension into adjacent thyroid tissue and/or presence of lymphovascular invasion [55]. The cases with lymphocytic thyroiditis were separated out to remove the potential influence of lymphocytic inflammation on PD-L1 expression in these types of tumors. Previously such influence had been reported [11]. Lymphocytic thyroiditis was diagnosed based on lymphocytic infiltration with formation germinal centers and patchy disruption and collapse of thyroid follicles. For cases with Hashimoto’s thyroiditis increased interstitial connective tissue was additionally observed with foci of Hurthle cell metaplasia [56]. The cases with coexistence of advanced lymphocytic or Hashimoto’s thyroiditis were encapsulated follicular lesions/neoplasms which did not satisfy inclusion criteria for NIFTP and had no evidence of capsular or vascular invasion.
Immunohistochemistry staining procedures were performed and described in detail by Fu et al. [13]. Briefly, 4 μm FFPE tissue sections were deparaffinized and rehydrated. Antigen retrieval was performed followed by the application of background punisher. The sections were incubated overnight at 4° C with the monoclonal rabbit anti-PD-L1 antibody at 1:100 dilution (E1L3N, Cell Signaling Technology, Inc. Danvers, MA). The VECTASTAIN rapid protocol (Vector Labs, Burlington, ON, Canada) with Diaminobenzidine (DAB) as the chromogen was performed. Hematoxylin was used as counterstain. Typical examples of PTC and histiocytes were used as positive control and internal controls, respectively. Isotype specific IgG in place of primary antibody was used as a negative control.
Manual scoring of immunostaining
Immunostaining scores were based on the percentage positivity and staining intensity as described previously [11]. Percentage positive scores were assigned according to the following scale: 0 = < 10%; 1 = > 10–30%; 2 = > 31– 50%; 3 = > 51–70%; and 4 = > 71%. Staining intensity was scored semi-quantitatively as follows: 0 (none); 1 (mild); 2 (moderate) and 3 (intense) [5]. A total score for each cytoplasmic and membranous staining was then obtained (ranging from 0 to 7) by adding the percentage positivity scores and intensity scores for each section. The IHC scoring was blinded from the histopathology report and was performed by two evaluators independently and used for subsequent analyses. The final score was given by averaging the two total scores from the two evaluators with equal weights. The final score was given using following formula [13]: [(percentage score 1 + intensity score 1) + (percentage score 2 + intensity score 2)]/2.
Whole slide image capture
Nano Zoomer 2.0 RS (Hamamatsu Photonics K.K., Hamamatsu, Japan), whole slide images were captured with a 20X objective (Achroplan 40X/0.65 ∞/0.17) with a Coolsnap digital camera (Coolsnap, RS Photometrics, Tucson, AZ). Digitalized images have a resolution of 1392 × 1040 pixels with RGB 24 True Color format and were saved in NDP format. The same range of illumination values was used to ensure the greatest reproducibility.
Digital image analysis
ThyApp, a systematic image processing operation algorithm was developed in our lab using the Visiopharm integrator system for Windows 7, version 5.0.1.1122 (Visiopharm A/S, Denmark). DIA analysis were carried out on a standard off-the-shelf desktop computer.
The Visiopharm integrator system software runs on an image processing pipeline. Specific add-on modules implemented are listed below. In preprocessing, median filter were applied to perform background subtraction and noise reduction. Color deconvolution filters (Hematoxylin and DAB) were applied to separate the color space. Next image pixels were segmented, defining different tissue subcomponents (colloid and non-colloid). The elementary image is no longer individual pixels but connected sets of pixels belonging to the same group. In the post processing step, the segmented layer labels were refined based on the morphological and contextual of the surrounding elements. The cell to cell spatial relationship that drives the structural organization of the thyroid tissue was explored. Interface between parafollicular space and colloid was specified as the follicular cells for IHC staining quantitation. Nuclei of these cells were excluded for the subcellular staining assessment. Second thresholding on the pixel intensity in the IHC quantitation area was performed. Lastly, features were extracted and exported as DIA parameter values including percentage of positively IHC labelled cells (area of DAB intensity color value below a threshold gate to total area IHC quantified, 0–100%) and digital immunostaining intensity in the subROIs quantified (color value 0–255, dark to light brown). Both are continuous numerical values given equal weight to every pixel analyzed.
Tumor sampling methods
The WSI was DIA analyzed using a multi-scale feature extraction approach that mimics the human eye when examining a slide. First, an operator delineated the tumor tissue exclusion of CIS, ink artifacts, tumor satellites and all tumor areas with intense inflammation, fibrosis, necrosis or poor fixation and termed it ROI. Next, areas within the ROI, termed subROIs, where the software performs the quantitation at high resolution were selected. One semi-manual and three fully automatic subROI selection methods were evaluated. In semi-manual, subROIs for DIA were manually selected by a histopathologist. Three fully automatic subROI selection methods: Systematic Uniform Random Sampling (SURS) (a specified sample fraction of tumor); hotspot nucleus (Heatmap algorithm selects subROIs at highest tumor cell nuclei density); hotspot nucleus and DAB (Heatmap algorithm selects subROIs at highest tumor cell nuclei density and DAB positivity) were individually implemented.
Statistical analysis
The data collected in a database designed for this study were analyzed using the SPSS version 20 (SPSS Inc., Chicago, IL, USA) program. A descriptive analysis of the population was performed. The qualitative variables were described with frequencies, and the quantitative variables were described with central tendency measures: means, standard error and dispersion standard deviation, range to 95%. A bivariate analysis was performed using independent samples t-test for quantitative variables. PD-L1 scores were compared among the different diagnostic groups using one-way ANOVA test. The results were considered significant when the obtained values were p < 0.05. Hypothesis tests were 2-sided. For measurement of linear relationship between manual and DIA scoring of PD-L1 expression, Pearson covariance and correlation coefficient were computed. In addition, for measurement of concordance, Lin’s correlation coefficient was computed. Shapiro-Wilk test was performed to determine normality of the scores in each subgroup.
Author contributions
RR and PGW conceptualized the study. PGW contributed to the study design. AH developed the DIA algorithm and conducted the statistical analysis. GF stained the slides, OP and RC provided the clinical and pathological parameters and CM performed the histopathology reporting of all the patients’ tissues analyzed. IJW provided the infrastructural support for this study. The manuscript was drafted by AH and PGW, and submitted for comments to all the authors. All authors approved the final version of the manuscript. PGW is the senior and corresponding authors of this manuscript.
ACKNOWLEDGMENTS
This study was supported by The Mount Sinai Hospital Foundation of Toronto Da Vinci Gala Fundraiser, Mount Sinai Hospital Department of Medicine Research Fund, Alex and Simona Shnaider Chair in Thyroid Cancer (PGW) and Canadian Institutes of Health Research (CIHR) for CIHR Chair in Advanced Cancer Diagnostics (RR). The funding sources had no role in the study design or its execution.
CONFLICTS OF INTEREST
PGW, IJW, and RR are shareholders in Proteocyte Diagnostics Inc. All the other authors (AH, OP, GF, RC and CM) have nothing to disclose.
REFERENCES
1. Ghossein R. Encapsulated malignant follicular cell-derived thyroid tumors. Endocr Pathol. 2010; 21:212–18. https://doi.org/10.1007/s12022-010-9141-8.
2. Ganly I, Wang L, Tuttle RM, Katabi N, Ceballos GA, Harach HR, Ghossein R. Invasion rather than nuclear features correlates with outcome in encapsulated follicular tumors: further evidence for the reclassification of the encapsulated papillary thyroid carcinoma follicular variant. Hum Pathol. 2015; 46:657–64. https://doi.org/10.1016/j.humpath.2015.01.010.
3. Scharpf J, Kamani D, Sadow PM, Randolph GW. The follicular variant of papillary thyroid cancer and noninvasive follicular thyroid neoplasm with papillary-like nuclear features. Curr Opin Oncol. 2017; 29:20–24. https://doi.org/10.1097/CCO.0000000000000341.
4. Nikiforov YE, Seethala RR, Tallini G, Baloch ZW, Basolo F, Thompson LD, Barletta JA, Wenig BM, Al Ghuzlan A, Kakudo K, Giordano TJ, Alves VA, Khanafshar E, et al. Nomenclature revision for encapsulated follicular variant of papillary thyroid carcinoma: a paradigm shift to reduce overtreatment of indolent tumors. JAMA Oncol. 2016; 2:1023–29. https://doi.org/10.1001/jamaoncol.2016.0386.
5. Ralhan R, Veyhl J, Chaker S, Assi J, Alyass A, Jeganathan A, Somasundaram RT, MacMillan C, Freeman J, Vescan AD, Witterick IJ, Walfish PG. Immunohistochemical subcellular localization of protein biomarkers distinguishes benign from malignant thyroid nodules: potential for fine-needle aspiration biopsy clinical application. Thyroid. 2015; 25:1224–34. https://doi.org/10.1089/thy.2015.0114.
6. Chaker S, Kashat L, Voisin S, Kaur J, Kak I, MacMillan C, Ozcelik H, Siu KW, Ralhan R, Walfish PG. Secretome proteins as candidate biomarkers for aggressive thyroid carcinomas. Proteomics. 2013; 13:771–87. https://doi.org/10.1002/pmic.201200356.
7. Kunavisarut T, Kak I, Macmillan C, Ralhan R, Walfish PG. Immunohistochemical analysis based Ep-ICD subcellular localization index (ESLI) is a novel marker for metastatic papillary thyroid microcarcinoma. BMC Cancer. 2012; 12:523. https://doi.org/10.1186/1471-2407-12-523.
8. Chaker S, Kak I, MacMillan C, Ralhan R, Walfish PG. Activated leukocyte cell adhesion molecule is a marker for thyroid carcinoma aggressiveness and disease-free survival. Thyroid. 2013; 23:201–08. https://doi.org/10.1089/thy.2012.0405.
9. He HC, Kashat L, Kak I, Kunavisarut T, Gundelach R, Kim D, So AK, MacMillan C, Freeman JL, Ralhan R, Walfish PG. An Ep-ICD based index is a marker of aggressiveness and poor prognosis in thyroid carcinoma. PLoS One. 2012; 7:e42893. https://doi.org/10.1371/journal.pone.0042893.
10. So AK, Kaur J, Kak I, Assi J, MacMillan C, Ralhan R, Walfish PG. Biotinidase is a novel marker for papillary thyroid cancer aggressiveness. PLoS One. 2012; 7:e40956. https://doi.org/10.1371/journal.pone.0040956.
11. Chowdhury S, Veyhl J, Jessa F, Polyakova O, Alenzi A, MacMillan C, Ralhan R, Walfish PG. Programmed death-ligand 1 overexpression is a prognostic marker for aggressive papillary thyroid cancer and its variants. Oncotarget. 2016; 7:32318–28. https://doi.org/10.18632/oncotarget.8698.
12. Shi RL, Qu N, Luo TX, Xiang J, Liao T, Sun GH, Wang Y, Wang YL, Huang CP, Ji QH. Programmed death-ligand 1 expression in papillary thyroid cancer and its correlation with clinicopathologic factors and recurrence. Thyroid. 2017; 27:537–45. https://doi.org/10.1089/thy.2016.0228.
13. Fu G, Polyakova O, MacMillan C, Ralhan R, Walfish PG. Programmed Death-Ligand 1 expression distinguishes invasive encapsualted follicular variant of papillary thyroid carcinoma from noninvasive follicular thyroid neoplasm with papillary-like nuclear features. EBioMedicine. 2017; 18:50–55. https://doi.org/10.1016/j.ebiom.2017.03.031.
14. Rossi ED, Martini M. New Insight in a new entity: NIFTPS and valuable role of ancillary techniques. The role of PD-L1. EBioMedicine. 2017; 18:11–12. https://doi.org/10.1016/j.ebiom.2017.03.035.
15. Xu B, Tallini G, Ghossein RA. Noninvasive follicular thyroid neoplasm with papillary-like nuclear features: historical context, diagnosis, and future challenges. Endocr Pathol. 2017; 28:128–38. https://doi.org/10.1007/s12022-017-9478-3.
16. Manaios L, Tsiambas E, Alevizaki M, Karameris A, Alexopoulou D, Lambropoulou S, Moreas H, Kravvaritis C, Fotiades PP, Goula K, Patsouris E, Athanassiou AE, Koutras D, Katsilambros N. Comparative topoisomerase IIa and ki 67 protein expression in papillary thyroid carcinoma based on tissue microarrays and image analysis. J BUON. 2008; 13:537–41.
17. Lamba Saini M, Weynand B, Rahier J, Mourad M, Hamoir M, Marbaix E. Cyclin D1 in well differentiated thyroid tumour of uncertain malignant potential. Diagn Pathol. 2015; 10:32. https://doi.org/10.1186/s13000-015-0262-8.
18. Lamba Saini M, Bouzin C, Weynand B, Marbaix E. An appraisal of proliferation and apoptotic markers in papillary thyroid carcinoma: an automated analysis. PLoS One. 2016; 11:e0148656. https://doi.org/10.1371/journal.pone.0148656.
19. Ahern TP, Beck AH, Rosner BA, Glass B, Frieling G, Collins LC, Tamimi RM. Continuous measurement of breast tumour hormone receptor expression: a comparison of two computational pathology platforms. J Clin Pathol. 2017; 70:428–34. https://doi.org/10.1136/jclinpath-2016-204107.
20. Ali HR, Dariush A, Provenzano E, Bardwell H, Abraham JE, Iddawela M, Vallier AL, Hiller L, Dunn JA, Bowden SJ, Hickish T, McAdam K, Houston S, et al. Computational pathology of pre-treatment biopsies identifies lymphocyte density as a predictor of response to neoadjuvant chemotherapy in breast cancer. Breast Cancer Res. 2016; 18:21. https://doi.org/10.1186/s13058-016-0682-8.
21. Laurinavicius A, Plancoulaine B, Rasmusson A, Besusparis J, Augulis R, Meskauskas R, Herlin P, Laurinaviciene A, Abdelhadi Muftah AA, Miligy I, Aleskandarany M, Rakha EA, Green AR, Ellis IO. Bimodality of intratumor Ki67 expression is an independent prognostic factor of overall survival in patients with invasive breast carcinoma. Virchows Arch. 2016; 468:493–502. https://doi.org/10.1007/s00428-016-1907-z.
22. Nagashima T, Suzuki M, Oshida M, Hashimoto H, Yagata H, Shishikura T, Koda K, Nakajima N. Morphometry in the cytologic evaluation of thyroid follicular lesions. Cancer. 1998; 84:115–18. https://doi.org/10.1002/(SICI)1097-0142(19980425)84:2<115::AID-CNCR8>3.0.CO;2-O.
23. Eldar S, Sabo E, Cohen A, Misselevich I, Abrahamson J, Cohen O, Kelner J, Boss JH. The value of histomorphometric nuclear parameters in the diagnosis of well differentiated follicular carcinomas and follicular adenomas of the thyroid gland. Histopathology. 1999; 34:453–61. https://doi.org/10.1046/j.1365-2559.1999.00641.x.
24. Gupta N, Sarkar C, Singh R, Karak AK. Evaluation of diagnostic efficiency of computerized image analysis based quantitative nuclear parameters in papillary and follicular thyroid tumors using paraffin-embedded tissue sections. Pathol Oncol Res. 2001; 7:46–55. https://doi.org/10.1007/BF03032605.
25. Wang SL, Wu MT, Yang SF, Chan HM, Chai CY. Computerized nuclear morphometry in thyroid follicular neoplasms. Pathol Int. 2005; 55:703–06. https://doi.org/10.1111/j.1440-1827.2005.01895.x.
26. Aiad H, Abdou A, Bashandy M, Said A, Ezz-Elarab S, Zahran A. Computerized nuclear morphometry in the diagnosis of thyroid lesions with predominant follicular pattern. Ecancermedicalscience. 2009; 3:146. https://doi.org/10.3332/ecancer.2009.146.
27. Huang H, Tosun AB, Guo J, Chen C, Wang W, Ozolek JA, Rohde GK. Cancer diagnosis by nuclear morphometry using spatial information. Pattern Recognit Lett. 2014; 42:115–21. https://doi.org/10.1016/j.patrec.2014.02.008.
28. Pienta KJ, Coffey DS. Correlation of nuclear morphometry with progression of breast cancer. Cancer. 1991; 68:2012–16. https://doi.org/10.1002/1097-0142(19911101)68:9<2012::AID-CNCR2820680928>3.0.CO;2-C.
29. Dobroś W, Gil K, Chłap Z, Olszewski E. The use of nuclear morphometry for the prediction of survival in patients with advanced cancer of the larynx. Eur Arch Otorhinolaryngol. 1999; 256:257–61. https://doi.org/10.1007/s004050050153.
30. Veltri RW, Christudass CS, Isharwal S. Nuclear morphometry, nucleomics and prostate cancer progression. Asian J Androl. 2012; 14:375–84. https://doi.org/10.1038/aja.2011.148.
31. Natarajan S, Mahajan S, Boaz K, George T. Morphometric analysis of nuclear features and volume-corrected mitotic index in the prognosis of oral squamous cell carcinoma. Oral Sci Int. 2009; 6:85–94. https://doi.org/10.1016/S1348-8643(09)80003-7.
32. Kadadavar SS, Gundalli S, Basavaraj V, Prakashini, Manjunath GV. Role of computer assisted nuclear morphometric analysis in grading of infiltrating ductal carcinoma of breast (Nos type) and correlation with established prognostic markers. Indian Journal of Pathology and Oncology. 2015; 2:295–302. https://doi.org/10.5958/2394-6792.2015.00031.9.
33. Navin NE. Tumor evolution in response to chemotherapy: phenotype versus genotype. Cell Reports. 2014; 6:417–19. https://doi.org/10.1016/j.celrep.2014.01.035.
34. Tsegaye B, Ergete W. Histopathologic pattern of thyroid disease. East Afr Med J. 2003; 80:525–28.
35. Scopa CD. Histopathology of thyroid tumors. An overview. Hormones (Athens). 2004; 3:100–10. https://doi.org/10.14310/horm.2002.11118.
36. LiVolsi VA. Papillary thyroid carcinoma: an update. Mod Pathol. 2011 (Suppl 2); 24:S1–9. https://doi.org/10.1038/modpathol.2010.129.
37. Potts SJ, Krueger JS, Landis ND, Eberhard DA, Young GD, Schmechel SC, Lange H. Evaluating tumor heterogeneity in immunohistochemistry-stained breast cancer tissue. Lab Invest. 2012; 92:1342–57. https://doi.org/10.1038/labinvest.2012.91.
38. Ghossein R. Problems and controversies in the histopathology of thyroid carcinomas of follicular cell origin. Arch Pathol Lab Med. 2009; 133:683–91. https://doi.org/10.1043/1543-2165-133.5.683.
39. Cho U, Mete O, Kim MH, Bae JS, Jung CK. Molecular correlates and rate of lymph node metastasis of non-invasive follicular thyroid neoplasm with papillary-like nuclear features and invasive follicular variant papillary thyroid carcinoma: the impact of rigid criteria to distinguish non-invasive follicular thyroid neoplasm with papillary-like nuclear features. Mod Pathol. 2017; 30:810–25. https://doi.org/10.1038/modpathol.2017.9.
40. Parente DN, Kluijfhout WP, Bongers PJ, Verzijl R, Devon KM, Rotstein LE, Goldstein DP, Asa SL, Mete O, Pasternak JD. Clinical safety of renaming encapsulated follicular variant of papillary thyroid carcinoma: is NIFTP truly benign? World J Surg. 2018; 42:321–26. https://doi.org/10.1007/s00268-017-4182-5.
41. Taube JM, Anders RA, Young GD, Xu H, Sharma R, McMiller TL, Chen S, Klein AP, Pardoll DM, Topalian SL, Chen L. Colocalization of inflammatory response with B7-h1 expression in human melanocytic lesions supports an adaptive resistance mechanism of immune escape. Sci Transl Med. 2012; 4:127ra37. https://doi.org/10.1126/scitranslmed.3003689.
42. Cunha LL, Marcello MA, Morari EC, Nonogaki S, Conte FF, Gerhard R, Soares FA, Vassallo J, Ward LS. Differentiated thyroid carcinomas may elude the immune system by B7H1 upregulation. Endocr Relat Cancer. 2013; 20:103–10. https://doi.org/10.1530/ERC-12-0313.
43. Christgen M, von Ahsen S, Christgen H, Länger F, Kreipe H. The region-of-interest size impacts on Ki67 quantification by computer-assisted image analysis in breast cancer. Hum Pathol. 2015; 46:1341–49. https://doi.org/10.1016/j.humpath.2015.05.016.
44. Navarro Silvera SA, Miller AB, Rohan TE. Risk factors for thyroid cancer: a prospective cohort study. Int J Cancer. 2005; 116:433–38. https://doi.org/10.1002/ijc.21079.
45. Kumar M, Srivastava G, Kaur J, Assi J, Alyass A, Leong I, MacMillan C, Witterick I, Shukla NK, Thakar A, Duggal R, Roychoudhury A, Sharma MC, et al. Prognostic significance of cytoplasmic S100A2 overexpression in oral cancer patients. J Transl Med. 2015; 13:8. https://doi.org/10.1186/s12967-014-0369-9.
46. Lin F, Chen Z. Standardization of diagnostic immunohistochemistry: literature review and geisinger experience. Arch Pathol Lab Med. 2014; 138:1564–77. https://doi.org/10.5858/arpa.2014-0074-RA.
47. Fitzgibbons PL, Bradley LA, Fatheree LA, Alsabeh R, Fulton RS, Goldsmith JD, Haas TS, Karabakhtsian RG, Loykasek PA, Marolt MJ, Shen SS, Smith AT, Swanson PE, and College of American Pathologists Pathology and Laboratory Quality Center. Principles of analytic validation of immunohistochemical assays: guideline from the College of American Pathologists Pathology and Laboratory Quality Center. Arch Pathol Lab Med. 2014; 138:1432–43. https://doi.org/10.5858/arpa.2013-0610-CP.
48. Goldsmith JD, Fitzgibbons PL, Swanson PE. Principles of analytic validation of clinical immunohistochemistry assays. Adv Anat Pathol. 2015; 22:384–87. https://doi.org/10.1097/PAP.0000000000000094.
49. Rojo MG, Bueno G, Slodkowska J. Review of imaging solutions for integrated quantitative immunohistochemistry in the Pathology daily practice. Folia Histochem Cytobiol. 2009; 47:349–54. https://doi.org/10.2478/v10042-008-0114-4.
50. Dunstan RW, Wharton KA Jr, Quigley C, Lowe A. The use of immunohistochemistry for biomarker assessment—can it compete with other technologies? Toxicol Pathol. 2011; 39:988–1002. https://doi.org/10.1177/0192623311419163.
51. Laurinaviciene A, Plancoulaine B, Baltrusaityte I, Meskauskas R, Besusparis J, Lesciute-Krilaviciene D, Raudeliunas D, Iqbal Y, Herlin P, Laurinavicius A. Digital immunohistochemistry platform for the staining variation monitoring based on integration of image and statistical analyses with laboratory information system. Diagn Pathol. 2014 (Suppl 1); 9:S10. https://doi.org/10.1186/1746-1596-9-S1-S10.
52. NIFTP. Mutations in Various Thyroid Tumours. http://niftp.org/Mutations_in_Various_Thyroid_Tumours.html.
53. van Heerden JA, Hay ID, Goellner JR, Salomao D, Ebersold JR, Bergstralh EJ, Grant CS. Follicular thryoid carcinoma with capsular invasion alone: a nonthreatening malignancy. Surgery. 1992; 112:1130–36.
54. Nikiforov YE, Biddinger PW, Thomapson LD. Diagnostic pathology and molecular genetics of the Thyroid: a comprehensive guide for practicing thyroid pathology. 2nd ed. Lippincott Williams & Wilkins; 2012; 152–82.
55. Seethala RR, Asa SL, Bullock MJ, Carty SE, Hodak SP, McHugh JB, Nikiforov YE, Pettus J, Richardson MS, Shah J, Thompson LD. Protocol for the Examination of Specimens from patients with carcinomas of the thyroid gland. Northfield (IL): College of American Pathologists; 2017. http://www.cap.org/ShowProperty?nodePath=/UCMCon/Contribution%20Folders/WebContent/pdf/cp-thyroid-17protocol-4000.pdf.
56. Kumar V, Abbas A, Aster J. Robbins and Cotran Pathologic Basis of Disease. 9th ed. 2015. Elsevier.