
INTRODUCTION
Imiquimod (R-837), an imidazoquinoline analogue of guanosine, is a potent immune modifier [1]. Primarily known as an agonist of the viral single stranded RNA sensor toll-like receptor 7 (TLR7), imiquimod has attracted interest in clinical immunotherapy trials for its anti-viral and anti-tumor properties [1–3]. Currently, it is approved by the FDA as a topical immunotherapy against external genital and perianal warts, actinic keratosis and superficial basal cell carcinoma [2]. Successful imiquimod immunotherapy against these and other lesions leads to extensive immune infiltration and subsequent regression via TLR7-dependent cytotoxic mechanisms [4, 5]. TLR7 is expressed at high levels by plasmacytoid dendritic cells (pDCs), which play key roles in the recruitment and activation of cytotoxic immune cells via cytokine and chemokine production [6]. Imiquimod-stimulated pDCs in mouse models can also directly suppress tumor growth and stimulate apoptosis through TLR7-dependent TNF-related apoptosis-inducing ligand (TRAIL) and granzyme B release [7, 8]. Imiquimod may also inhibit immune-regulatory pathways via antagonism of adenosine receptor signalling [9], and activate NLRP3-mediated inflammasome signalling via stimulation of ROS production [10]. This ability of imiquimod to act on the immune response at multiple levels could account for its success as an anti-cancer drug.
It has previously been found that imiquimod has direct effects on tumor cell function in vitro and in vivo. Studies in vitro revealed direct activation of intrinsic apoptosis in cell lines from a range of cancers including malignant melanoma, basal cell carcinoma, squamous cell carcinoma, gastric cancer and endometrial cancer [11–15]. These apoptotic pathways were activated via mechanisms involving oxidative and endoplasmic reticulum (ER) stress, and regulation of the BCL2 family of proteins [14–19]. Autophagic pathways have also been implicated in this process and may contribute to imiquimod-induced death [12, 13, 20]. In vivo, tumor growth was directly arrested by topical imiquimod treatment in an immune-compromised mouse model of endometrial cancer [11]. In another study, imiquimod synergized with radiotherapy to enhance tumor regression via mechanisms dependent on the activation of autophagic pathways [21]. Together these results suggest that anti-tumor effects of imiquimod could play roles in tumor regression in cancer patients receiving imiquimod therapy. This is the case for many other anti-cancer drugs, which deregulate oncogenic pathways and alter the expression of silenced and overexpressed genes, allowing for enhanced targeting by the immune system [22]. Further investigation of the molecular changes that occur in imiquimod-treated tumor cells is required to understand pathway regulation in response to this therapeutic molecule.
Devil facial tumor disease (DFTD) refers to two genetically distinct transmissible cancers (DFT1 and DFT2) threatening the survival of the world’s largest carnivorous marsupial, the Tasmanian devil (Sarcophilus harrisii). DFTD cells are transferred between devils in a contact dependent manner, where they successfully evade both allogeneic and anti-cancer immune defences to grow and survive in new hosts [23, 24]. Although the development of a prophylactic vaccine against DFTD is being investigated [25, 26], there are currently no prophylactic or therapeutic options for the protection of wild Tasmanian devils from the disease. Our previous studies have found that cell lines established from DFTD tumors are sensitive to cell death induced by imiquimod [27]. Furthermore, TLR7 signalling is functional in the immune system of the Tasmanian devil, suggesting that imiquimod could be an effective DFTD immunotherapy [28, 29]. Thorough investigation of imiquimod treated DFTD cells is required to identify direct imiquimod-induced effects of potential detriment or benefit to tumour clearance in the Tasmanian devil. As these analyses are challenged by a lack of Tasmanian devil specific reagents, the effects of imiquimod in DFTD have been explored in this study at the whole mRNA and protein level using RNA sequencing (RNA-seq) and proteomic mass spectrometry (MS). The DFT1 cell line C5065 was selected as a model line for this analysis, as previous investigations have demonstrated that the response of these cells to imiquimod treatment is representative of other DFTD cell lines [27]. This study will improve the current understanding of DFTD tumorigenesis and survival, and could reveal new targets for DFTD therapy. As a naturally occurring tumor with established mechanisms of immune evasion and survival, DFTD also provides an ideal model for studying the mechanisms of imiquimod action for human application.
RESULTS AND DISCUSSION
Molecular changes to imiquimod-treated DFT1 cells
Imiquimod modulates tumor cell function by mechanisms that are thought to be independent of TLR7 signalling [17], but remain poorly understood in mammalian species including the Tasmanian devil. To understand the molecular pathways regulated by imiquimod in DFT1, we analysed the transcriptome and proteome of untreated and imiquimod-treated cells using RNA-seq and nanoHPLC-MS, respectively. As we previously determined that the percentage of early apoptotic DFT1 cells increases after 48 h of imiquimod treatment, this time point was chosen for promeomics analysis [27]. The transcriptome of imiquimod-treated cells was generated at an earlier time point of 24 h to minimise the extent of RNA degradation for sequencing analysis. After application of quality control filters described in the methods, 13,559 gene transcripts were detected by RNA-seq and 1057 proteins were detected by nanoHPLC-MS in DFT1 cells (Figure 1A and 1B). The molecular landscape of imiquimod-treated and untreated DFTD cells was vastly different, with 2655 (19.58 %) mRNA transcripts significantly up regulated and 4188 (30.89 %) mRNA transcripts significantly down regulated when low stringency cut-offs were used (FDR < 0.05, FC > ±2.0). A more stringent FDR cut-off of 10-7 was chosen for down-stream application, reducing the number of differentially expressed genes for functional analysis to 2786 (20.55 %). Statistical analysis of the label-free quantitative proteomics data identified 136 (12.87 %) significantly up regulated proteins and 163 (15.42 %) significantly down regulated proteins after 48 h of imiquimod treatment (FDR < 0.05, FC > ±1.5). Comparison of the measured fold-changes of genes that were detected at both the mRNA and proteome level demonstrated a low but significant correlation of expression trends between the two datasets (R2 = 0.10, p < 0.0001) (Figure 1C). This low correlation may be a consequence of the different sampling time points for the mRNA and protein analysis, although different mechanisms for regulating mRNA and protein levels can also contribute to low overall correlation in large datasets [30, 31].
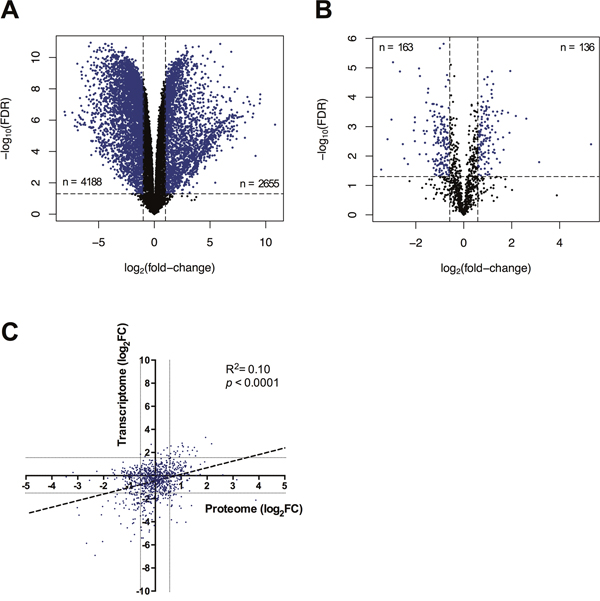
Figure 1: Molecular changes to the transcriptome and proteome of imiquimod treated DFT1 cells. C5065 DFT1 cells were treated with imiquimod at 60 μg/ml for 24 or 48 h and analysed by RNA-seq and proteomic MS, respectively. (A) Differential mRNA levels and (B) differential protein levels between untreated and treated cells were measured and plotted against FDR. Genes with an expression fold-change of greater than ±2 (FDR < 0.05) and proteins with an expression fold-change of greater than ±1.5 (FDR < 0.05) are coloured blue. (C) Genes detected at both the mRNA and protein level were compared by log2(fold-change) and a linear regression was performed (dotted line). Grey lines represent an mRNA fold-change of ±2 and a protein fold-change of ±1.5.
To identify functions associated with differentially expressed genes in imiquimod-treated DFT1 cells, gene ontology (GO) analysis was performed. The most significant GO_BP (biological process) terms associated with up regulated genes revealed deregulation of protein folding and activation of the unfolded protein response (UPR) in the endoplasmic reticulum (ER) in response to imiquimod treatment (Table 1A). Other functions associated with ER stress such as apoptosis, autophagy and cholesterol biosynthesis were also positively regulated. Terms associated with genes down regulated by imiquimod indicated that DNA replication and cell cycle were arrested (Table 1B). Many down regulated terms were also associated with the Schwann cell origin of DFT1 cells, suggesting attenuation of normal DFT1 function. Analysis of differentially expressed proteins using DAVID [32, 33] revealed up regulation of protein folding and down regulation of proteins associated with translation, confirming involvement of protein biosynthesis in the ER in response to imiquimod (Table 2A-2B). Proteins associated with the mitochondria and spliceosomes were also positively regulated, and a role for disruption of redox homeostasis in the response to imiquimod was revealed. Together these findings suggest that functional changes that occur in imiquimod-treated DFT1 cells are related to the onset of stress responses and manifest at both the transcriptional and translational level. The principal functions regulated by imiquimod in DFT1 cells are described in detail below.
Table 1: Most significant biological process GO terms associated with genes regulated greater than 2-fold in imiquimod-treated DFT1 cells
GO ID |
GO term |
Term size |
Regulated |
p-value |
|---|---|---|---|---|
A. Up regulated genes |
||||
GO:0035966 |
response to topologically incorrect protein |
181 |
36 |
3.00 x 10⁻¹⁵ |
GO:0006986 |
response to unfolded protein |
166 |
33 |
4.41 x 10⁻¹⁴ |
GO:0070059 |
intrinsic apoptotic signaling pathway in response to endoplasmic reticulum stress |
56 |
16 |
5.64 x 10⁻¹⁰ |
GO:0006984 |
ER-nucleus signaling pathway |
43 |
13 |
1.10 x 10-08 |
GO:0035967 |
cellular response to topologically incorrect protein |
141 |
23 |
1.73 x 10-08 |
GO:0030968 |
endoplasmic reticulum unfolded protein response |
125 |
21 |
4.25 x 10-08 |
GO:0034620 |
cellular response to unfolded protein |
128 |
21 |
6.50 x 10-08 |
GO:1902235 |
regulation of endoplasmic reticulum stress-induced intrinsic apoptotic signaling pathway |
29 |
10 |
1.37 x 10-07 |
GO:0042594 |
response to starvation |
150 |
22 |
2.46 x 10-07 |
GO:0000407 |
pre-autophagosomal structure |
31 |
10 |
2.81 x 10-07 |
GO:0050821 |
protein stabilization |
128 |
20 |
3.03 x 10-07 |
GO:0009267 |
cellular response to starvation |
113 |
18 |
8.79 x 10-07 |
GO:1990440 |
positive regulation of transcription from RNA polymerase II promoter in response to endoplasmic reticulum stress |
11 |
6 |
1.91 x 10-06 |
GO:0036003 |
positive regulation of transcription from RNA polymerase II promoter in response to stress |
23 |
8 |
2.35 x 10-06 |
GO:0016126 |
sterol biosynthetic process |
56 |
12 |
2.43 x 10-06 |
GO:0016241 |
regulation of macroautophagy |
123 |
18 |
3.10 x 10-06 |
GO:0006695 |
cholesterol biosynthetic process |
50 |
11 |
4.86 x 10-06 |
GO:1902653 |
secondary alcohol biosynthetic process |
51 |
11 |
5.97 x 10-06 |
GO:0046685 |
response to arsenic-containing substance |
26 |
8 |
6.70 x 10-06 |
GO:0043618 |
regulation of transcription from RNA polymerase II promoter in response to stress |
62 |
12 |
7.48 x 10-06 |
GO ID |
GO term |
Term size |
Regulated |
p-value |
B. Down regulated genes |
||||
GO:0006261 |
DNA-dependent DNA replication |
135 |
45 |
4.53 x 10⁻¹⁶ |
GO:0007062 |
sister chromatid cohesion |
124 |
38 |
1.70 x 10⁻¹² |
GO:0006270 |
DNA replication initiation |
39 |
20 |
6.21 x 10⁻¹² |
GO:0010001 |
glial cell differentiation |
175 |
44 |
5.34 x 10⁻¹¹ |
GO:0007422 |
peripheral nervous system development |
69 |
24 |
1.19 x 10-09 |
GO:0061647 |
histone H3-K9 modification |
38 |
16 |
3.01 x 10-08 |
GO:0000070 |
mitotic sister chromatid segregation |
132 |
32 |
5.59 x 10-08 |
GO:0034329 |
cell junction assembly |
192 |
40 |
1.19 x 10-07 |
GO:0007266 |
Rho protein signal transduction |
151 |
34 |
1.50 x 10-07 |
GO:0031570 |
DNA integrity checkpoint |
159 |
35 |
1.79 x 10-07 |
GO:0032392 |
DNA geometric change |
81 |
23 |
1.94 x 10-07 |
GO:0032508 |
DNA duplex unwinding |
76 |
22 |
2.46 x 10-07 |
GO:0007160 |
cell-matrix adhesion |
193 |
39 |
3.94 x 10-07 |
GO:0042552 |
myelination |
103 |
26 |
4.14 x 10-07 |
GO:0007272 |
ensheathment of neurons |
106 |
26 |
7.54 x 10-07 |
GO:0008366 |
axon ensheathment |
106 |
26 |
7.54 x 10-07 |
GO:0007088 |
regulation of mitotic nuclear division |
133 |
30 |
7.64 x 10-07 |
GO:0006271 |
DNA strand elongation involved in DNA replication |
23 |
11 |
9.49 x 10-07 |
GO:1901988 |
negative regulation of cell cycle phase transition |
156 |
33 |
1.03 x 10-06 |
GO:0090329 |
regulation of DNA-dependent DNA replication |
42 |
15 |
1.04 x 10-06 |
Table 2: Representative enriched ontological terms associated with proteins regulated greater than 1.5-fold in imiquimod-treated DFT1 cells
Category |
Term |
No. proteins |
Enrichment Score |
p-Value |
FDR |
|---|---|---|---|---|---|
(A) Up-regulated proteins |
|||||
GOTERM_MF_DIRECT |
poly(A) RNA binding |
60 |
18.53 |
3.69E-31 |
5.08E-28 |
GOTERM_BP_DIRECT |
mRNA spicing, via spliceosome |
29 |
16.71 |
7.28E-25 |
1.13E-21 |
GOTERM_CC_DIRECT |
nucleoplasm |
58 |
12.71 |
8.30E-12 |
1.09E-08 |
GOTERM_CC_DIRECT |
spliceosomal complex |
10 |
9.54 |
7.99E-08 |
1.05E-04 |
GOTERM_BP_DIRECT |
protein folding |
19 |
9.18 |
4.72E-06 |
2.95E-11 |
GOTERM_CC_DIRECT |
intracellular ribonucleoprotein complex |
15 |
6.26 |
6.37E-12 |
8.36E-09 |
UP_KEYWORDS |
mitochondrion |
29 |
6.18 |
8.83E-09 |
1.14E-05 |
GOTERM_CC_DIRECT |
endoplasmic reticulum lumen |
17 |
4.74 |
4.90E-12 |
6.43E-09 |
GOTERM_BP_DIRECT |
cell redox homeostasis |
8 |
4.35 |
4.49E-06 |
6.98E-03 |
GOTERM_BP_DIRECT |
negative regulation of mRNA splicing, via spliceosome |
6 |
3.71 |
8.16E-07 |
1.27E-03 |
(B) Down-regulated proteins |
|||||
GOTERM_BP_DIRECT |
translational initiation |
51 |
45.75 |
1.62E-67 |
2.58E-64 |
GOTERM_CC_DIRECT |
cell-cell adherens junction |
30 |
18.55 |
4.01E-21 |
5.31E-18 |
GOTERM_BP_DIRECT |
tRNA aminoacylation for protein translation |
7 |
3.91 |
2.15E-06 |
3.43E-03 |
INTERPRO |
actin/actin-like conserved site |
5 |
3.81 |
3.13E-05 |
4.51E-02 |
INTERPRO |
armadillo-type fold |
16 |
3.57 |
5.43E-07 |
7.83E-04 |
GOTERM_BP_DIRECT |
regulation of translational initiation |
7 |
3.34 |
1.13E-06 |
1.79E-03 |
GOTERM_MF_DIRECT |
translation initiation factor activity |
7 |
3.23 |
2.83E-05 |
3.81E-02 |
UP_KEYWORDS |
Neurodegeneration |
11 |
3.08 |
1.32E-04 |
1.68E-01 |
GOTERM_BP_DIRECT |
vesicle mediated transport |
8 |
2.27 |
6.85E-04 |
1.09E+0 |
UP_KEYWORDS |
ATP binding |
24 |
2.63 |
7.46E-04 |
9.47E-01 |
ER stress responses
Investigations in tumor cell lines have determined that imiquimod is a strong inducer of oxidative and ER stress responses [16, 17, 19]. GO analysis of the DFT1 transcriptome and proteome confirmed that these responses were also activated in imiquimod-treated DFT1 cells. To further understand these responses, we examined proteins up regulated by imiquimod for protein-protein interactions using the STRING database [34] (Figure 2). In support of previous findings, a network of ER proteins was up regulated in response to imiquimod treatment (green network). These proteins play key roles in ER stress-related functions such as protein re-folding and degradation, protein transport and calcium homeostasis. Binding immunoglobulin protein (BiP; HSPA5; FC = 2.7, p = 6.48x10⁻⁴), a master regulator of ER stress responses in other species [35], was included in this protein network.
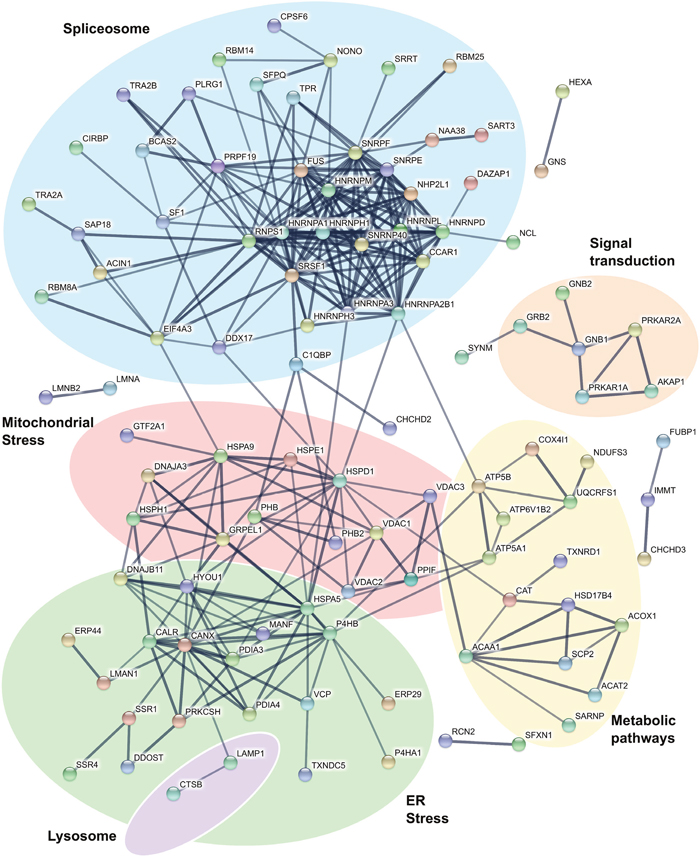
Figure 2: Interactions of proteins up regulated by imiquimod in DFT1 cells. C5065 DFT1 cells were treated with imiquimod at 60 μg/ml for 48 h. The proteome of treated and untreated cells was analysed by proteomic MS. Proteins significantly up regulated greater than 1.5-fold (FDR < 0.05) were analysed for protein-protein interactions using the STRING database. Only interactions predicted with high confidence were included in the analyses, and proteins with no predicted interactions were removed. Functional groups were assigned based on scientific literature.
BiP regulates the UPR, an adaptive response of three key signalling networks, to restore ER homeostasis and promote cell survival during cellular stress (the IRE1-XBP1, ATF6 and PERK-EIF2α-ATF4 pathways). These pathways reduce protein damage and overload within the ER through increased capacity for protein folding (IRE1-XBP1 and ATF6 pathways), removal of terminally misfolded proteins via ER-associated degradation (ERAD) (IRE1-XBP1 and ATF6 pathways) and attenuation of protein translation to mitigate ER protein overload (PERK-EIF2α-ATF4 pathway) [36–38]. To determine whether UPR pathways were activated by imiquimod, we analysed differentially expressed genes that were detected by RNA-seq analysis in more detail using Ingenuity Pathway Analysis (IPA). Analysis of predicted canonical pathways revealed that ‘Unfolded protein response’ (p = 4.x10-09) and ‘Endoplasmic reticulum stress pathway’ (p = 1x10-06) were two of the most over-represented and significantly modulated pathways associated with imiquimod treatment in DFT1 cells (Supplementary Table 3). Further examination of the pathway ‘Unfolded protein response’ demonstrated that components of all three UPR pathways were positively regulated at the gene level, suggesting that imiquimod induces significant ER stress in DFT1 cells (Figure 3). This finding was confirmed through quantitative RT-PCR gene expression analysis of the key UPR markers HSPA5 (CHOP), XBP1 and DDIT3 (CHOP) across four imiquimod treated DFT1 cell lines (C5065, 1426, 4906 and half-pea; Supplementary Figure 1). Significant increases in the expression of UPR markers were measured across 72 h of imiquimod treatment in all four lines, confirming that UPR pathways are stimulated by imiquimod in DFT1 cells.
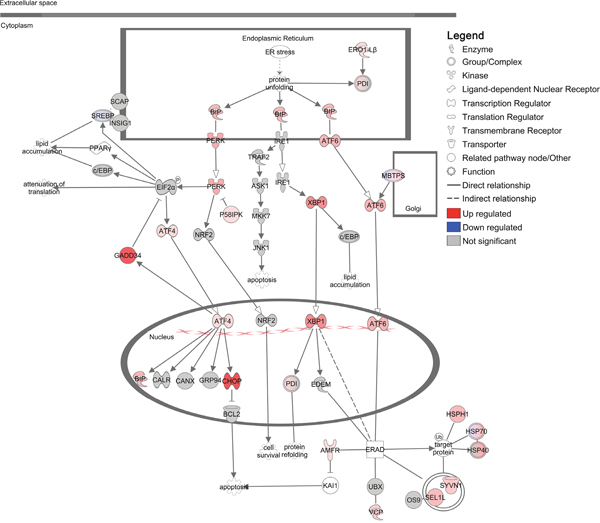
Figure 3: Regulation of the unfolded protein response in DFT1 cells by imiquimod. C5065 DFT1 cells were treated with imiquimod at 60 μg/ml for 24 h. The transcriptome of treated and untreated cells was analysed by RNA-seq and IPA was used to predict canonical pathways regulated by imiquimod treatment. The significantly regulated canonical pathway ‘Unfolded protein response’ is shown. Up-regulated genes are coloured red and down-regulated genes are coloured blue.
The UPR plays a key role in determination of cell fate during ER stress, and can activate expression of pro-apoptotic CHOP (DDIT3) and JNK1 (MAPK8) when cell stress and damage cannot be resolved. Specifically, the PERK-ATF4 axis, which regulates pro-apoptotic CHOP (DDIT3; FC = 42.6, FDR = 1.91x10⁻¹⁰) and pro-survival GADD34 (PPP1R15A; FC = 34.0, FDR = 4.13x10⁻¹¹), was positively regulated at the mRNA level in our study and provides the first evidence for ER-stress mediated cell death in imiquimod treated DFT1 cells. Our findings are consistent with activation of both CHOP and GADD34 gene expression, suggesting that ER stress pathways play roles in determining cell fate during imiquimod treatment.
Mitochondrial stress responses
The UPR is also known to modulate protein expression within the mitochondria, where protein damage can have deleterious effects on metabolic processes [39]. Consistent with a role of the mitochondria in imiquimod-induced cell stress, STRING analysis of proteins up-regulated by imiquimod revealed a network containing mitochondrial VDAC channels (VDAC1, FC = 2.5, p = 1.56x10⁻³; VDAC2, FC = 2.1, p = 1.76x10⁻²; VDAC3, FC = 1.8, p = 5.91x10⁻²) and numerous stress inducible mitochondrial chaperone proteins (HSP10 (HSPE1; FC = 1.7, p = 3.74x10⁻³), HSP60 (HSPD1; FC = 2.0, p = 3.74x10⁻⁵), HSP70 (HSPA9; FC = 1.8, p = 2.45x10⁻⁵) and HSP105 (HSPH1; FC = 2.1, p = 2.19x10⁻⁴)) (red network) (Figure 2). Mitochondrial chaperones can be activated by disruptions to oxidative phosphorylation that produce an excess of unassembled respiratory chain components in the mitochondria [40]. Key protein subunits of respiratory chain complexes III (UQCRFS1; FC = 8.8, p = 1.61x10⁻²), IV (COX4I1; FC = 1.7, p = 8.78x10⁻³) and V (ATP5A1, FC = 1.5, p = 9.40x10⁻⁴; ATP5B, FC = 2.5, p = 1.62x10⁻³) were up regulated in DFT1 cells (yellow network), demonstrating involvement of oxidative phosphorylation in the response to imiquimod treatment.
Disruptions to oxidative phosphorylation could explain a shift in redox balance in imiquimod treated DFT1 cells. Proteins associated with cellular responses to oxidative stress such as catalase (CAT; FC = 2.2, p = 7.76x10⁻⁵) and thioredoxin reductase 1 (TXNRD1; FC = 2.1, p = 4.02x10⁻⁴) were up regulated, suggesting that elevated levels of reactive oxygen species (ROS) are present after imiquimod treatment (Figure 2). ROS could shuttle between the ER and mitochondria to alter protein homeostasis and further exacerbate the ER stress response [41]. Calcium released from the ER during stress is also taken up by mitochondrial ion channels such as VDACs, and can further stimulate ROS production [42]. Such a mechanism of action is supported by previous observations of heightened levels of intracellular ROS and depletion of ER calcium in imiquimod-treated tumor cells [17, 43]. The involvement of ROS in the stress response to imiquimod likely explains the susceptibility of tumor cells to imiquimod-induced apoptosis. ROS accumulates at a faster rate in highly metabolic tumor cells, leading to detrimental conditions that promote apoptotic pathways [44]. Pro-survival mechanisms such as the UPR are also constitutively active in tumors to cope with high metabolic demands, and additional production of ROS is more likely to overwhelm these mechanisms to promote a pro-apoptotic state [45].
Tumorigenesis
The UPR modulates translation to prevent protein overload within the ER and to promote pro-survival responses during cellular stress [38, 46]. This attenuation of translation is controlled by PERK (EIF2AK3), which phosphorylates the translational regulator EIF2A leading to preferential biosynthesis of stress-related proteins and suppression of overall protein translation [38, 46]. To determine how these translational changes alter the DFT1 landscape, we further analysed canonical pathways that were predicted by IPA to be regulated by imiquimod treatment. Investigation of these pathways revealed an overall suppression of tumorigenesis in imiquimod-treated DFT1 cells, with down regulation of numerous pathways involved in tumorigenic processes such as proliferation, resistance to apoptosis, angiogenesis, immune evasion, migration and invasion (Supplementary Table 3) [47–50]. Examples of these included ‘Integrin Signalling’ (p = 3x10⁻¹⁰), ‘STAT3 Pathway’ (p = 1x10-08) and ‘Protein Kinase A Signalling’ (p = 2x10-08). The canonical pathway most significantly associated with the RNA-seq dataset was ‘Molecular Mechanisms of Cancer’ (p = 6x10-13) (Figure 4). Analysis of this pathway in detail revealed additional networks by which imiquimod influenced tumor growth, with deregulation of cyclin signalling and strong up-regulation of p21CIP1 (CDKN1A; FC = 12.1, FDR = 2.69x10⁻¹⁰), an inducer of replicative senescence, at the mRNA level. Genes encoding pathways that promote cell cycle, DNA repair and proliferation were also negatively regulated, including Ras, p53, BRCA1, integrin, phospholipase C and Hedgehog signalling pathways. Other pathways, such as NFκB, p38 MAPK and NOTCH1 signalling pathways were positively regulated at the mRNA level, and may play roles in the response to imiquimod treatment.
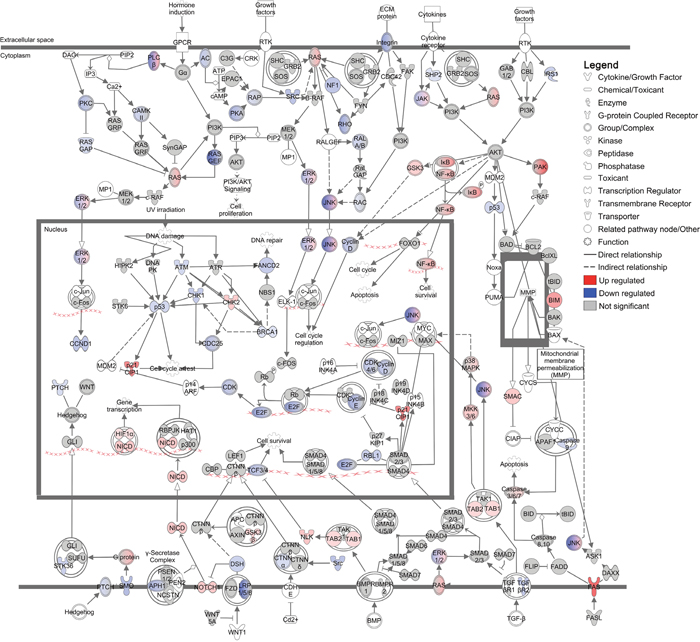
Figure 4: Regulation of ‘Molecular mechanisms of cancer’ canonical pathway in DFT1 cells by imiquimod. C5065 DFT1 cells were treated with imiquimod at 60 μg/ml for 24 h. The transcriptome of treated and untreated cells was analysed by RNA-seq and IPA was used to predict canonical pathways regulated by imiquimod treatment. The canonical pathway most significantly associated with genes regulated by imiquimod treatment is shown. Up-regulated genes are coloured red and down-regulated genes are coloured blue.
With such potent effects on tumorigenesis, imiquimod may increase the ability of immune cells to mount anti-tumor cytotoxic responses in vivo. In support of this, the death receptor FAS was present at only low mRNA levels in the transcriptome of untreated DFT1 cells and was up regulated by imiquimod treatment (FC = 23.7, FDR = 1.12x10⁻⁹; Figure 4). FAS expression is frequently suppressed in tumor cells to evade immune-mediated cytotoxicity and is functionally up regulated in an immune-independent manner in response to other anti-cancer drugs such as cisplatin and doxorubicin [51]. Up regulation of FAS expression in imiquimod-treated DFT1 cells could increase their susceptibility to immune-mediated cytotoxicity. In addition, the anti-phagocytic gene CD200 (FC = 0.1, FDR = 1.08x10⁻⁹), the angiogenic gene VEGFA (FC = 0.5, FDR = 8.24x10⁻⁷) and the checkpoint inhibitor CD276 (FC = 0.2, FDR = 2.20x10⁻⁸) were down regulated at the mRNA level in DFT1 cells by imiquimod treatment (Supplementary Table 1). As these molecules suppress immune responses, their down regulation provides further evidence for increased immunogenicity of imiquimod-treated DFT1 cells. Other regulatory molecules such as PDL1 (CD274) exhibited low or no expression at baseline in DFT1 cells and were not up regulated at the mRNA level by imiquimod.
Cell cycle arrest
Previous studies in animal models have demonstrated immune-independent suppression of tumor growth in response to imiquimod treatment in vivo [11]. This suppression of tumor growth is likely the result of UPR-induced cell cycle arrest, which allows time for cell damage to be repaired prior to cell division. In support of this, genes found to be positively regulated in DFT1 cells at the mRNA level by imiquimod included the cyclin/cyclin dependent kinase (CDK) inhibitor p21CIP1 (CDKN1A; FC = 12.1, FDR = 2.69x10⁻¹⁰), an inducer of replicative senescence at the G1/S phase (Figure 4). Consistent with these findings, network analysis of the DFT1 transcriptome using IPA revealed that the canonical pathway ‘Cell cycle control of chromosomal replication’ was the second most significant pathway associated with imiquimod treatment (p = 3x10-11; Figure 5). Analysis of this pathway revealed strong suppression of mRNA encoding necessary components of chromosomal replication machinery, including MCM (including MCM6; FC = 0.2, FDR = 4.07x10⁻¹¹), RPA (RPA1; FC = 0.2, FDR = 5.92x10⁻¹⁰), CDT1 (CDT1; FC = 0.2, FDR = 1.53x10⁻⁹) and DNA polymerase (including POLA1; FC = 0.2, FDR = 3.44x10⁻¹⁰). CDKs, which are required for cell cycle progression, were also highly suppressed at the mRNA level. CHK2 (CHEK2), an upstream negative regulator of CDK activity at the G1/S phase, was up regulated (FC = 2.9, FDR = 3.43x10⁻⁸). In comparison, genes encoding the G2/M cyclin/CDK inhibitor CHK1 (CHEK1) were down regulated at the mRNA level after 24 h of imiquimod treatment (FC = 0.3, FDR = 3.72x10⁻⁹). Together these results indicate that imiquimod suppresses DFT1 cell cycle at the G1/S phase after 24 h of treatment. This finding supports previous analysis of imiquimod action in DFT1 cell lines, which demonstrated significant inhibition of cell proliferation after treatment [27].
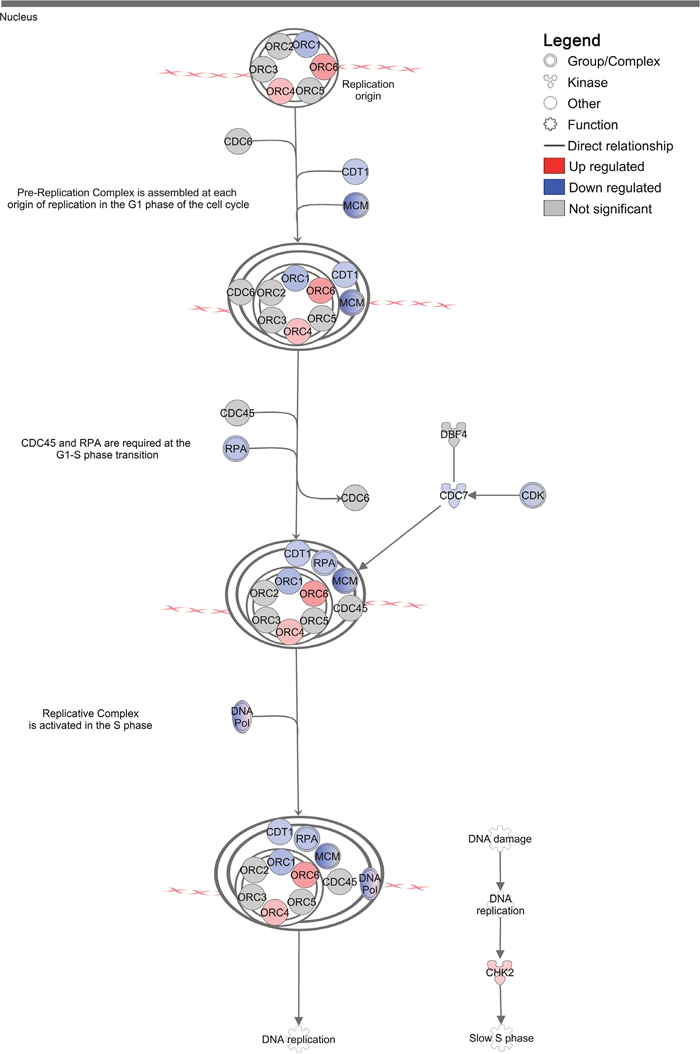
Figure 5: Regulation of ‘Cell cycle control of chromosomal replication’ canonical pathway in DFT1 cells by imiquimod. C5065 DFT1 cells were treated with imiquimod at 60 μg/ml for 24 h. The transcriptome of treated and untreated cells was analysed by RNA-seq and IPA was used to predict canonical pathways regulated by imiquimod treatment. The highly regulated pathway ‘Cell cycle control of chromosomal replication’ is shown. Up-regulated genes are coloured red and down-regulated genes are coloured blue.
G1/S cell cycle arrest during ER stress is controlled through PERK-dependent preferential translation of p53 (TP53) [52]. Unexpectedly, p53 was down regulated in imiquimod-treated DFT1 cells at the mRNA level (FC = 0.3, FDR = 3.77x10⁻⁹; Supplementary Table 1), opposing its role in imiquimod-induced G1/S arrest. In studies by Huang and colleagues, expression of p53 was up regulated by imiquimod in tumor cells at 24 h and was required for more rapid onset of apoptosis when compared to p53 knockdown cells [18]. Although p53 was down regulated in DFT1 cells by imiquimod treatment, targets of p53 such as MDM2, PTEN and FAS were up regulated in the transcriptome, suggesting that p53 function was not lost. As such, the apparent down regulation of p53 in imiquimod-treated DFT1 cells could be time-dependent, and may represent a negative feedback mechanism to promote cell survival during the early stages of treatment. Alternatively, p53-independent activation of p21CIP1 (CDKN1A), via mechanisms involving CHK2 (CHEK2), has been reported in other models and could play a role in G1/S cell cycle arrest in DFT1 cells [53].
Autophagy
It is well established that tumor cells treated in vitro with imiquimod undergo cell death [14, 16]. In addition to apoptosis, autophagy has been implicated in cell death pathways [12, 16, 19]. In support of a role for autophagy in the response of DFT1 cells to imiquimod treatment, our proteomic analysis revealed up regulation of the lysosomal proteins CTSB (FC = 1.8, p = 1.05x10⁻²) and LAMP1 (FC = 1.6, p = 1.50x10⁻³) (Figure 2). To further investigate the involvement of autophagy in these treated cells, mRNA expression of genes with known roles in the regulation and execution of autophagy was analysed by hierarchical clustering and represented using a heat map. Many autophagic genes, including class III PI3K (PIK3C3), an activator of autophagy, were expressed in both untreated and imiquimod-treated DFT1 cells at the mRNA level (Figure 6A). Furthermore, mRNA encoding P150 (PIK3R4), which is required for stabilisation and correct function of the class III PI3K complex, was positively regulated in response to imiquimod treatment (FC = 2.3, FDR = 5.67x10⁻⁹). Other critical genes required for formation of the autophagosome (BECN1, ATG9A and ATG2A), autophagosome and lysosome fusion (RAB7A) and lysosomal protein degradation (LAMP1, LAMP2 and CTSA) were either highly expressed in both untreated and treated cells, or were up regulated in response to imiquimod treatment, suggesting that autophagic pathways were active.
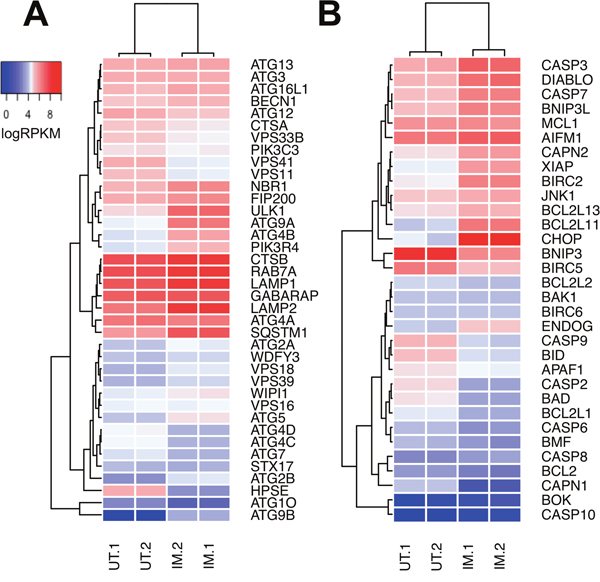
Figure 6: Relative expression of genes associated with autophagy and apoptosis in DFT1 cells after imiquimod treatment. C5065 DFT1 cells were treated with imiquimod at 60 μg/ml for 24 h. The transcriptome of treated and untreated cells was analysed by RNA-seq. Relative expression of genes associated with (A) autophagic pathways and (B) apoptotic pathways in untreated (UT) and imiquimod-treated (IM) cells was visualized on heat maps generated by Euclidean clustering. High gene expression is represented in red and low gene expression is represented in blue.
During ER stress, autophagic gene expression is stimulated by PERK-ATF4-mediated transcriptional activity [54]. Autophagy is then activated via the IRE1-JNK axis, which mediates phosphorylation of anti-apoptotic BCL2 and induces its dissociation from the autophagy inducer beclin-1 [55, 56]. Although autophagic pathways have the potential to induce cell death, they are initially activated as a protective anti-apoptotic mechanism by which damaged proteins and organelles are degraded and recycled to minimize cellular stress [55]. In support of this, genes encoding key inhibitors of apoptosis including MCL1, XIAP (ENSSHAG00000016328) and BIRC2 (ENSSHAG00000011782) were highly expressed at the mRNA level in tandem with autophagic genes after 24 h of imiquimod treatment (Figure 6B). These results suggest that autophagic pathways may play a role in promoting and prolonging DFT1 survival after imiquimod treatment.
Apoptosis
Unresolved cellular stress and prolonged activation of the UPR leads to stimulation of apoptotic pathways. This can occur via direct UPR stimulation of CHOP (PERK-EIF2a-ATF4 pathway) and JNK1 (IRE1-ASK1 pathway), which regulate pro and anti-apoptotic proteins such as BIM, BCL2 and XIAP to stimulate apoptosis [57–59]. An additional mechanism of stress-mediated apoptosis is activated through the calcium-dependent pro-apoptotic protein calpain after ER calcium depletion [60, 61]. Previous analyses have shown that DFT1 cell lines undergo apoptosis after sustained treatment with imiquimod [27]. Direct measurement of pro- and anti-apoptotic factors in this previous study revealed down regulation of anti-apoptotic genes and up regulation of the pro-apoptotic gene BIM (BCL2L11) at the mRNA level in response to imiquimod treatment. To further understand these apoptotic pathways, genes associated with apoptosis were also analysed by hierarchical clustering and visualized using a heat map (Figure 6B). As demonstrated in Figure 3, CHOP (DDIT3; FC = 42.6, FDR = 1.91x10⁻¹⁰) was highly up regulated at the gene level in imiquimod-treated DFT1 cells, while JNK1 exhibited high constitutive expression that was unchanged after treatment. Isoforms of calpain were differentially regulated, with strong suppression of the μ-isoform CAPN1 (FC = 0.04, FDR = 2.62x10⁻⁹) and up regulation of the m-isoform CAPN2 (FC = 2.5, FDR = 4.74x10⁻⁹) at the mRNA level. M-calpain can directly activate apoptosis via cleavage of caspase 12, and also interacts with the IRE1-ASK1 pathway during ER stress to promote JNK1-mediated apoptosis [61]. In a previous study, individual inhibition of JNK1, CHOP and calpain pathways slowed but did not prevent imiquimod-induced cell death [16]. This finding suggests that cooperation of these pathways is required for activation of apoptosis after imiquimod treatment.
Mitochondrial pro-apoptotic genes such as BCL2L11 (FC = 7.7, FDR = 9.56x10⁻¹⁰), DIABLO (FC = 3.1, FDR = 2.59x10⁻⁸) and ENDOG (FC = 1.8, FDR = 8.85x10⁻⁴) were also positively regulated at the gene level by imiquimod in DFT1 cells and likely play roles in the activation of apoptotic pathways (Figure 6B). Specifically, ENDOG encodes a key inducer of caspase-independent apoptosis and DNA fragmentation during sustained endogenous oxidative stress, and could be stimulated by imiquimod-induced ROS [62, 63]. Activation of apoptotic pathways also requires the spliceosome, which alternatively splices numerous apoptotic regulators to modulate their pro- and anti-apoptotic functions [64]. This regulation is evident after imiquimod treatment, with a large network of proteins involved in mRNA splicing and processing identified by STRING interaction analysis (blue network) (Figure 2). These include all three members of the apoptosis and splicing associated protein (ASAP) complex (ACIN1, FC = 2.5, p = 4.20x10⁻⁴; SAP18, FC = 3.0, p = 3.63x10⁻⁴; RNPS1, FC = 2.3, p = 9.58x10⁻⁴), which is involved in the alternative splicing of regulators of apoptosis including caspases and the members of the BCL2 protein family [64].
Mechanism of action
Although pathways by which imiquimod modulates cell death have been identified, little is understood as to how these mechanisms are activated. As a potent agonist of TLR7, it is tempting to hypothesize that imiquimod induces ER stress and apoptosis in tumor cells via TLR7 signalling. However, studies have shown that tumor cell lines lacking TLR7 are also sensitive to imiquimod-induced autophagy and apoptosis [17, 19, 43]. We previously reported that DFTD cells also do not express TLR7 at any stage of imiquimod treatment, suggesting that imiquimod acts via a TLR7-independent mechanism in DFT1 cells [27]. Myeloid cells treated with imiquimod undergo a ROS burst that is activated via direct inhibition of NAD(P)H quinone dehydrogenase 2 (NQO2) and complex I of the respiratory chain [10]. Similar direct inhibition of complex I in highly metabolic tumor cells would shift oxidative homeostasis, leading to the activation of mitochondrial and ER stress responses. This is the case for other known inhibitors of complex I, which demonstrate anti-cancer effects involving substantial ROS production and ER stress [65, 66]. Decreased oxidative respiration and ATP depletion have been measured in imiquimod-treated tumor cells, providing evidence for respiratory chain inhibition [19, 43]. In contrast, key subunits of complexes III, IV and V were up regulated at the mRNA level in imiquimod-treated DFT1 cells (Figure 2). These complexes may have been up regulated as a compensatory mechanism for ATP depletion, and could add to oxidative stress at the mitochondria in a vicious stress cycle. Studies targeting specific key elements are required to further investigate the mechanism of imiquimod action in tumor cells.
Implications for imiquimod therapy
The potent anti-tumor effects of imiquimod in DFT1 cells have highlighted the potential of stress responses as targets for deregulation of DFTD tumor cell survival. Indeed, our results showed that pro-survival pathways including autophagy, the UPR and antioxidant signalling were overwhelmed by imiquimod-induced cell stress in DFT1 cells, demonstrating the potential of stress-inducing drugs as therapeutic agents in DFTD. Imiquimod has also been found to be an effective immune adjuvant in the Tasmanian devil [28, 29], supporting its use as a DFTD immunotherapy. Although imiquimod would be difficult to distribute among a wild devil population, the drug could be available for opportunistic treatment of captured devils affected by the disease. As DFTD tumors are allografts [24], it is possible that only a short period of imiquimod treatment would be required to break immune tolerance and induce allogeneic immunity. Captive trials are required to determine whether imiquimod is an effective immunotherapy in the Tasmanian devil.
Studies of imiquimod action in DFTD also provide valuable insights into the response of human tumor cells to direct imiquimod treatment. While previous studies have elucidated a role for imiquimod in the activation of stress responses in human cancer cell lines [16, 17], our analyses have used DFTD as a tumor model to highlight the key molecules and pathways regulated at a global scale. In human cancer therapy, combinatorial immunotherapies have demonstrated promise for their ability to target multiple pathways and overcome immune resistance [67]. Through an improved understanding of pathways regulated by imiquimod, the approach used in our analysis will allow for mechanistic identification of potential therapeutic targets and drug combinations involving imiquimod treatment. Our analysis also provides evidence that imiquimod exerts suppressive effects against pathways involved in the normal functioning of tumor cells, including those involved in invasion, cell migration and immune evasion. These suppressive effects could improve the ability of the immune system to target tumor cells, perhaps aiding tumor rejection in vivo. This study provides a basis for further exploration of imiquimod as a therapy in cancer.
MATERIALS AND METHODS
Cell lines and imiquimod treatment
The DFT1 cell lines C5065, 1426, 4906 and half-pea were provided by A.-M. Pearse and K. Swift of the Tasmanian Department of Primary Industries, Parks, Water and Environment (DPIPWE). A total of 1 x 10⁶ cells were plated per well of a 12-well cell culture plate (Corning, New York, USA) in 1 ml of RPMI culture medium (Thermo Fisher Scientific, Waltham, USA)/10% foetal calf serum (FCS). Cells were treated with imiquimod (Sigma-Aldrich, St Louis, USA) prepared as previously described [27], at 60 μg/ml in a 35 °C, 5% CO2 humidified incubator. As it was previously determined that DFT1 cells undergo imiquimod-mediated cell death after 24-96 h incubation with the drug [27], cells were treated for 24 h for RNA-seq to ensure mRNA integrity. A longer treatment of 48 h was used for proteomics analysis in order to understand the changes occurring as the cells enter apoptotic pathways. For confirmation of findings by quantitative PCR, cells were treated for 0, 8, 16, 24, 48 or 72 h, and PCR was performed according to previously described methods [27]. Untreated controls were included in all analyses.
Next generation mRNA sequencing
RNA was extracted from untreated and imiquimod-treated C5065 DFT1 samples using the RNeasy® Mini Kit (QIAGEN Bioinformatics, Hilden, Germany), according to the manufacturer’s instructions. RNA integrity was assessed using a Eukaryotic RNA 6000 Nano Kit and 2100 Bioanalyzer (Agilent, Santa Clara, USA). 100 base-pair single-read mRNA sequencing was performed on the Illumina Hiseq-2000 platform (Illumina, San Diego, USA). The RNA-seq data have been deposited to the NCBI Sequence Read Archive (BioSample accessions SAMN07998608, SAMN07998609, SAMN07998610, SAMN07998611) with links to BioProject accession number PRJNA416378 in the NCBI BioProject database (https://www.ncbi.nlm.nih.gov/bioproject/). Sequence quality was assessed using fastqc (http://www.bioinformatics.babraham.ac.uk/projects/fastqc). Sequencing reads were aligned to the Tasmanian devil reference genome (7.0.82) using subread [68], and counts were summarized into genes using featureCounts [69]. Differential expression analysis of gene counts was performed using R version 3.3.2. For this analysis, technical replicates were combined and genes with less than 20 aligned reads across all samples were removed. Expression levels were normalized by upper quartile normalisation using EDAseq [70, 71]. Differential expression was calculated using limma/voom [72] (Supplementary Table 1). Volcano plots of differential gene expression data were created using the R plot function, and heat maps were produced using heatmap.2/gplots (https://CRAN.R-project.org/package=gplots) using hierarchical clustering by Euclidean distance. Gene ontology (GO) analysis of genes up and down regulated greater than 2-fold was performed using limma/goana [73, 74] (Supplementary Table 2A-2B). A stringent FDR cut-off of 10-7 was applied to this analysis to include only the most significantly altered genes. To remove general and repetitive GO terms, those with a gene size of greater than 200 were filtered from the analysis. Differential gene expression data was further analysed using Ingenuity Pathway Analysis (IPA; QIAGEN) [75]. Canonical pathways associated with differentially expressed genes were generated using the FDR cut-off of 10-7 (Supplementary Table 3).
Nano-liquid chromatography and LTQ-Orbitrap tandem mass spectrometry
Triplicate cultures of untreated and imiquimod-treated C5065 DFT1 cells were lysed in 700 μl of protein extraction buffer (7M urea/2M thiourea in 40 mM Tris with protease inhibitor, pH 8.0) for 2 h at 4 °C. Proteins were precipitated from the lysate with 9 x the volume of 100 % ethanol overnight at -20 °C. Proteins were reconstitutes in protein extraction buffer and concentration was determined using the EZQ® Protein Quantification Kit (Thermo Fisher Scientific, Waltham, USA), according to the manufacturer’s instructions. Precipitated proteins were sequentially reduced, alkylated and digested with proteomics-grade trypsin from porcine pancreas (Sigma-Aldrich, St Louis, USA) as previously described [76]. Tryptic peptides equivalent to ~ 1 μg of digested protein were separated using an Ultimate 3000 nano RSLC system (Thermo Fisher Scientific, Waltham, USA). Peptides were first concentrated on a 20 mm x 75 μm PepMap 100 trapping column (3 μm C18) at a flow rate of 5 μl/min, using 98 % water, 2 % acetonitrile and 0.05% TFA. Peptides were then separated on a 250 mm x 75 μm PepMap 100 RSLC column (2μm C18) at a flow rate of 300 nL/min. A 180 minute gradient from 98% mobile phase A (0.1% formic acid in water) to 50% mobile phase B (0.08% formic acid in 80% acetonitrile and 20 % water) comprised the following steps: 2-10% B over 10 min, 10-40% B over 120 min, 40-50% B over 10 min, holding at 95% B for 10 min then re-equilibration in 2% B for 15 min. The nanoHPLC system was coupled to an LTQ-Orbitrap mass spectrometer equipped with nanopray Flex ion source (Thermo Fisher Scientific, Waltham, USA) and controlled using Xcalibur 2.1 software. MS scans were acquired from 460-2000 m/z at a resolution of 30,000 and MS/MS spectra were acquired in data-dependent mode using a Top8 method and 30-second dynamic exclusion of fragmented peptides, as described [77]. The mass spectrometry proteomics data have been deposited to the ProteomeXchange Consortium via the PRIDE [78] partner repository with the dataset identifier PXD007135.
Protein identification and analysis
Data files were imported into MaxQuant version 1.5.1.2 (http://maxquant.org/) and MS/MS spectra were searched using the Andromeda search engine against the complete Sarcophilus harrisii UniProt reference proteome (ID 0000007648; updated on 11/02/2016) comprising 22,388 protein entries. Default settings for protein identification by LTQ-Orbitrap MS/MS and label-free quantitation (LFQ) included a maximum of two missed cleavages, mass error tolerances of 20 ppm then 4.5 ppm for initial and main peptide searches, respectively, 0.5 Da tolerance for fragment ions, variable methionine oxidation and fixed carbamidomethylation. A default false discovery rate (FDR) of 0.01 was used for peptide-spectrum matches and protein identification. The MaxQuant algorithm MaxLFQ was used for peptide intensity determination and normalization [79], using pair-wise comparison of unique and razor peptide intensities and a minimum ratio count of 2. The proteinGroups output file generated by MaxQuant analysis was processed as follows: The normalized label-free quantification (LFQ) intensity values, MS/MS counts and the numbers of razor and unique peptides for each of the identified proteins were imported into Perseus software version 1.5.031 (http://perseus-framework.org/). Protein groups identified either as potential contaminants (prefixed with CON_), identified by modified site only, by reverse database matching or on the basis of a single matching peptide were removed. LFQ intensity values were then log2–transformed and then a filter applied to include only proteins detected in a minimum of the three untreated or imiquimod treated replicates. Missing values were replaced with random intensity values for low-abundance proteins based on a normal distribution of protein abundances using default MaxQuant parameters. To determine proteins that were significantly altered in abundance between treatments a two-sided t-test with a permutation-based FDR of 0.05 was applied, using 250 randomizations and a minimum fold-change cut-off of 1.5 (Supplementary Table 4). Volcano plots of protein expression data were created using the plot function in R. Gene set testing of significantly up and down regulated proteins was performed using the Functional Annotation Clustering tool of DAVID version 6.8 [32, 33] (Supplementary Table 5A-5B). As there is a paucity of functional information is available for the Tasmanian devil, protein lists were analysed using the Homo sapiens species database, with medium stringency. Protein-protein interactions between up regulated proteins were identified using the STRING Database version 10.5 [34]. Only interactions predicted with high confidence (interaction score ≥ 0.700) were included in the analysis.
CONCLUSIONS
In this study, we have analysed the response of DFT1 cells to imiquimod at the transcriptome and proteome level in order to improve the current understanding of the direct anti-tumor effects of this small molecule in cancer. This analysis has demonstrated that imiquimod disrupts cellular homeostasis, leading to a myriad of molecular changes that are consistent with activation of oxidative and ER stress responses (Figure 7). These changes included positive regulation of PERK, an attenuator of translation at the ER, which likely altered protein production to favour other regulated pro-survival mechanisms such as cell cycle arrest and autophagy. Attenuation of normal protein translation by PERK could have also lead to the negative regulation of tumourigenic pathways, perhaps rendering the cells more susceptible to apoptosis. Lastly, a range of pro- and anti-apoptotic genes involved in ER and oxidative stress responses were also positively regulated in our study, suggesting that the interaction of stress pathways controls the onset of apoptosis in the treated cells. As genes associated with ER stress responses were positively regulated across multiple DFT1 cell lines in our study, and within human cell lines in previous studies, the stress-mediated pathways that were regulated in our study may pose as potential drug targets for enhancement of the direct effects of imiquimod during cancer therapy. This study is the first comprehensive transcriptome and proteome analysis of any imiquimod-treated tumor cell, and is the first proteomic analysis of any cell type of Tasmanian devil origin. Findings from this analysis will allow for improved mechanistic use of imiquimod as a cancer immunotherapy in both human and Tasmanian devil cancer trials.
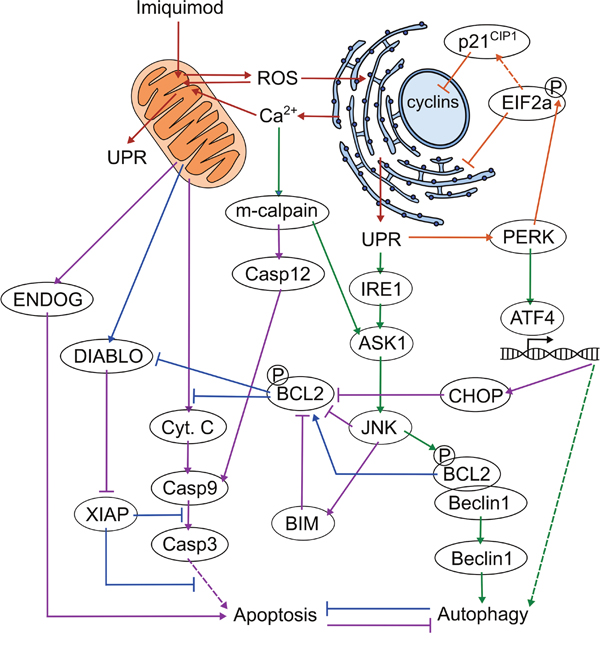
Figure 7: Proposed mechanism of imiquimod action in DFTD cells. 1. Induction of cell stress (red arrows): Imiquimod enters the cell and disrupts oxidative phosphorylation at the mitochondria via a TLR7-independent mechanism. ROS is produced and shuttles between the ER and mitochondria to disrupt cellular homeostasis and activate the UPR. Ca2+ is depleted from the ER upon activation of ER stress, and is taken up by the mitochondria where it further disrupts oxidative phosphorylation in a stress-induced cycle. 2. Attenuation of protein translation and cell cycle arrest (orange arrows): PERK is activated by the UPR and phosphorylates EIF2a, resulting in attenuation of regular protein translation and suppression of oncogenic pathways. EIF2a induces cell cycle arrest through preferential translation of cyclin inhibitors such as p21CIP1. 3. Activation of autophagy (green arrows): PERK stimulates the expression of genes required for stress responses via ATF4, including autophagic genes. IRE1 is activated via the UPR and stimulates JNK via ASK1. Increased cytoplasmic Ca2+ activates m-calpain, which further stimulates JNK activity via ASK1. JNK phosphorylates BCL2, resulting in its dissociation from beclin-1, and allowing beclin-1 to induce autophagy. 4. Inhibition of apoptosis (blue arrows): Activation of autophagy inhibits apoptosis, in part through the release of BCL2. BCL2 inhibits the XIAP inhibitor DIABLO and cytochrome C release. DFTD cells survive in this state for up to 72 h. 5. Activation of apoptosis (purple arrows): Prolonged cell stress induces the expression of pro-apoptotic CHOP via the PERK-ATF4 axis. JNK activates pro-apoptotic members of the BCL2 family such as BIM. CHOP, JNK and BIM cooperated to inhibit anti-apoptotic molecules including BCL2. Inhibition of BCL2 activates DIABLO, which inhibits anti-apoptotic XIAP. Cytochrome C is released from the mitochondria, and stimulates the caspase cascade. M-calpain supports the activation of this pathway through cleavage of caspase 12. ENDOG is also released from the mitochondria in response to prolonged oxidative stress and promotes DNA degradation in a caspase-independent manner. DFTD cells undergo apoptosis.
Abbreviations
DFTD, devil facial tumor disease; ER, endoplasmic reticulum; TLR, toll-like receptor; pDC, plasmacytoid dendritic cell; ROS, reactive oxygen species; RNA-seq, RNA sequencing; MS, mass spectrometry; GO, gene ontology; UPR, unfolded protein response; IPA, Ingenuity Pathway Analysis.
Author contributions
ALP, ABL, GW and CT conceptualized and planned the experiments. ALP and LMC prepared the biological samples for analysis. ATP performed the RNA-sequencing analysis. RW performed the high-throughput proteomic mass spectrometry analysis. ALP and JC conducted functional analyses. ALP compiled the data and drafted the manuscript. ALP, RW, JC, LMC, ATP, ABL, GW and CT revised the manuscript.
ACKNOWLEDGMENTS
The authors wish to thank Anne-Maree Pearse and Kate Swift of DPIPWE for the provision of the C5065 DFT1 cell line used in this manuscript.
CONFLICTS OF INTEREST
The authors declare no potential conflicts of interest.
FUNDING
This work was supported by the Australian Research Council (LP130100218), and the University of Tasmania Foundation through funds raised by the Save the Tasmanian Devil Program Appeal and Wildcare Saffire Devil Fund.
REFERENCES
1. Lee J, Chuang TH, Redecke V, She L, Pitha PM, Carson DA, Raz E, Cottam HB. Molecular basis for the immunostimulatory activity of guanine nucleoside analogs: activation of Toll-like receptor 7. Proc Natl Acad Sci U S A. 2003; 100:6646-51.
2. Vacchelli E, Galluzzi L, Eggermont A, Fridman WH, Galon J, Sautes-Fridman C, Tartour E, Zitvogel L, Kroemer G. Trial watch: FDA-approved Toll-like receptor agonists for cancer therapy. Oncoimmunology. 2012; 1:894-907.
3. Hemmi H, Kaisho T, Takeuchi O, Sato S, Sanjo H, Hoshino K, Horiuchi T, Tomizawa H, Takeda K, Akira S. Small anti-viral compounds activate immune cells via the TLR7 MyD88-dependent signaling pathway. Nat Immunol. 2002; 3:196-200.
4. Huang SJ, Hijnen D, Murphy GF, Kupper TS, Calarese AW, Mollet IG, Schanbacher CF, Miller DM, Schmults CD, Clark RA. Imiquimod enhances IFN-gamma production and effector function of T cells infiltrating human squamous cell carcinomas of the skin. J Invest Dermatol. 2009; 129:2676-85.
5. Barnetson RS, Satchell A, Zhuang L, Slade HB, Halliday GM. Imiquimod induced regression of clinically diagnosed superficial basal cell carcinoma is associated with early infiltration by CD4 T cells and dendritic cells. Clin Exp Dermatol. 2004; 29:639-43.
6. Liu C, Lou Y, Lizee G, Qin H, Liu S, Rabinovich B, Kim GJ, Wang YH, Ye Y, Sikora AG, Overwijk WW, Liu YJ, Wang G, et al. Plasmacytoid dendritic cells induce NK cell-dependent, tumor antigen-specific T cell cross-priming and tumor regression in mice. J Clin Invest. 2008; 118:1165-75.
7. Wu J, Li S, Yang Y, Zhu S, Zhang M, Qiao Y, Liu YJ, Chen J. TLR-activated plasmacytoid dendritic cells inhibit breast cancer cell growth in vitro and in vivo. Oncotarget. 2017; 8:11708-18. https://doi.org/10.18632/oncotarget.14315.
8. Drobits B, Holcmann M, Amberg N, Swiecki M, Grundtner R, Hammer M, Colonna M, Sibilia M. Imiquimod clears tumors in mice independent of adaptive immunity by converting pDCs into tumor-killing effector cells. J Clin Invest. 2012; 122:575-85.
9. Schon MP, Schon M, Klotz KN. The small antitumoral immune response modifier imiquimod interacts with adenosine receptor signaling in a TLR7- and TLR8-independent fashion. J Invest Dermatol. 2006; 126:1338-47.
10. Gross CJ, Mishra R, Schneider KS, Medard G, Wettmarshausen J, Dittlein DC, Shi H, Gorka O, Koenig PA, Fromm S, Magnani G, Cikovic T, Hartjes L, et al. K+ Efflux-Independent NLRP3 Inflammasome Activation by Small Molecules Targeting Mitochondria. Immunity. 2016; 45:761-73.
11. Almomen A, Jarboe EA, Dodson MK, Peterson CM, Owen SC, Janat-Amsbury MM. Imiquimod Induces Apoptosis in Human Endometrial Cancer Cells in vitro and Prevents Tumor Progression in vivo. Pharm Res. 2016; 33:2209-17.
12. Huang SW, Liu KT, Chang CC, Chen YJ, Wu CY, Tsai JJ, Lu WC, Wang YT, Liu CM, Shieh JJ. Imiquimod simultaneously induces autophagy and apoptosis in human basal cell carcinoma cells. Br J Dermatol. 2010; 163:310-20.
13. Jiang J, Dong L, Shi HT, Guo XY, Qin B, Wang Y, Li H. Imiquimod inhibits the growth of SGC7901 cells in vitro through induction of autophagy and apoptosis. Mol Med Rep. 2016; 13:393-7.
14. Schon M, Bong AB, Drewniok C, Herz J, Geilen CC, Reifenberger J, Benninghoff B, Slade HB, Gollnick H, Schon MP. Tumor-selective induction of apoptosis and the small-molecule immune response modifier imiquimod. J Natl Cancer Inst. 2003; 95:1138-49.
15. Schon MP, Wienrich BG, Drewniok C, Bong AB, Eberle J, Geilen CC, Gollnick H, Schon M. Death receptor-independent apoptosis in malignant melanoma induced by the small-molecule immune response modifier imiquimod. J Invest Dermatol. 2004; 122:1266-76.
16. El-Khattouti A, Selimovic D, Hannig M, Taylor EB, Abd Elmageed ZY, Hassan SY, Haikel Y, Kandil E, Leverkus M, Brodell RT, Megahed M, Hassan M. Imiquimod-induced apoptosis of melanoma cells is mediated by ER stress-dependent Noxa induction and enhanced by NF-kappaB inhibition. J Cell Mol Med. 2015; 20:266-86.
17. Nyberg WA, Espinosa A. Imiquimod induces ER stress and Ca influx independently of TLR7 and TLR8. Biochem Biophys Res Commun. 2016; 473:789-94.
18. Huang SW, Chang SH, Mu SW, Jiang HY, Wang ST, Kao JK, Huang JL, Wu CY, Chen YJ, Shieh JJ. Imiquimod activates p53-dependent apoptosis in a human basal cell carcinoma cell line. J Dermatol Sci. 2016; 81:182-91.
19. Wang ST, Huang SW, Kao JK, Liang SM, Chen YJ, Chen YY, Wu CY, Shieh JJ. Imiquimod-induced AMPK activation causes translation attenuation and apoptosis but not autophagy. J Dermatol Sci. 2015; 78:108-16.
20. Yi JY, Jung YJ, Choi SS, Hwang J, Chung E. Autophagy-mediated anti-tumoral activity of imiquimod in Caco-2 cells. Biochem Biophys Res Commun. 2009; 386:455-8.
21. Cho JH, Lee HJ, Ko HJ, Yoon BI, Choe J, Kim KC, Hahn TW, Han JA, Choi SS, Jung YM, Lee KH, Lee YS, Jung YJ. The TLR7 agonist imiquimod induces anti-cancer effects via autophagic cell death and enhances anti-tumoral and systemic immunity during radiotherapy for melanoma. Oncotarget. 2017; 8:24932-48. https://doi.org/10.18632/oncotarget.15326.
22. Bracci L, Schiavoni G, Sistigu A, Belardelli F. Immune-based mechanisms of cytotoxic chemotherapy: implications for the design of novel and rationale-based combined treatments against cancer. Cell Death Differ. 2014; 21:15-25.
23. Pye RJ, Pemberton D, Tovar C, Tubio JM, Dun KA, Fox S, Darby J, Hayes D, Knowles GW, Kreiss A, Siddle HV, Swift K, Lyons AB, et al. A second transmissible cancer in Tasmanian devils. Proc Natl Acad Sci U S A. 2016; 113:374-9.
24. Pearse AM, Swift K. Allograft theory: transmission of devil facial-tumour disease. Nature. 2006; 439:549.
25. Tovar C, Pye RJ, Kreiss A, Cheng Y, Brown GK, Darby J, Malley RC, Siddle HVT, Skjødt K, Kaufman J, Silva A, Baz Morelli A, Papenfuss AT, et al. Regression of devil facial tumour disease following immunotherapy in immunised Tasmanian devils. Sci Rep. 2017; 7:43827.
26. Kreiss A, Brown GK, Tovar C, Lyons AB, Woods GM. Evidence for induction of humoral and cytotoxic immune responses against devil facial tumor disease cells in Tasmanian devils (Sarcophilus harrisii) immunized with killed cell preparations. Vaccine. 2015; 33:3016-25.
27. Patchett AL, Darby JM, Tovar C, Lyons AB, Woods GM. The Immunomodulatory Small Molecule Imiquimod Induces Apoptosis in Devil Facial Tumour Cell Lines. PLoS One. 2016; 11:e0168068.
28. Patchett AL, Latham R, Brettingham-Moore KH, Tovar C, Lyons AB, Woods GM. Toll-like receptor signaling is functional in immune cells of the endangered Tasmanian devil. Dev Comp Immunol. 2015; 53:123-33.
29. Patchett AL, Tovar C, Corcoran LM, Lyons AB, Woods GM. The toll-like receptor ligands Hiltonol(R) (polyICLC) and imiquimod effectively activate antigen-specific immune responses in Tasmanian devils (Sarcophilus harrisii). Dev Comp Immunol. 2017; 76:352-60.
30. Vogel C, Marcotte EM. Insights into the regulation of protein abundance from proteomic and transcriptomic analyses. Nat Rev Genet. 2012; 13:227-32.
31. Cheng Z, Teo G, Krueger S, Rock TM, Koh HW, Choi H, Vogel C. Differential dynamics of the mammalian mRNA and protein expression response to misfolding stress. Mol Syst Biol. 2016; 12:855.
32. Huang da W, Sherman BT, Lempicki RA. Systematic and integrative analysis of large gene lists using DAVID bioinformatics resources. Nat Protoc. 2009; 4:44-57.
33. Huang da W, Sherman BT, Lempicki RA. Bioinformatics enrichment tools: paths toward the comprehensive functional analysis of large gene lists. Nucleic Acids Res. 2009; 37:1-13.
34. Szklarczyk D, Morris JH, Cook H, Kuhn M, Wyder S, Simonovic M, Santos A, Doncheva NT, Roth A, Bork P, Jensen LJ, von Mering C. The STRING database in 2017: quality-controlled protein-protein association networks, made broadly accessible. Nucleic Acids Res. 2017; 45:D362-d8.
35. Hetz C. The unfolded protein response: controlling cell fate decisions under ER stress and beyond. Nat Rev Mol Cell Biol. 2012; 13:89-102.
36. Wu J, Rutkowski DT, Dubois M, Swathirajan J, Saunders T, Wang J, Song B, Yau GD, Kaufman RJ. ATF6alpha optimizes long-term endoplasmic reticulum function to protect cells from chronic stress. Dev Cell. 2007; 13:351-64.
37. Lee AH, Iwakoshi NN, Glimcher LH. XBP-1 regulates a subset of endoplasmic reticulum resident chaperone genes in the unfolded protein response. Mol Cell Biol. 2003; 23:7448-59.
38. Harding HP, Zhang Y, Bertolotti A, Zeng H, Ron D. Perk is essential for translational regulation and cell survival during the unfolded protein response. Mol Cell. 2000; 5:897-904.
39. Zhao Q, Wang J, Levichkin IV, Stasinopoulos S, Ryan MT, Hoogenraad NJ. A mitochondrial specific stress response in mammalian cells. EMBO J. 2002; 21:4411-9.
40. Jovaisaite V, Mouchiroud L, Auwerx J. The mitochondrial unfolded protein response, a conserved stress response pathway with implications in health and disease. J Exp Biol. 2014; 217:137-43.
41. Malhotra JD, Kaufman RJ. Endoplasmic reticulum stress and oxidative stress: a vicious cycle or a double-edged sword? Antioxid Redox Signal. 2007; 9:2277-93.
42. Cao SS, Kaufman RJ. Endoplasmic reticulum stress and oxidative stress in cell fate decision and human disease. Antioxid Redox Signal. 2014; 21:396-413.
43. Huang SW, Kao JK, Wu CY, Wang ST, Lee HC, Liang SM, Chen YJ, Shieh JJ. Targeting aerobic glycolysis and HIF-1alpha expression enhance imiquimod-induced apoptosis in cancer cells. Oncotarget. 2014; 5:1363-81. https://doi.org/10.18632/oncotarget.1734.
44. Schumacker PT. Reactive oxygen species in cancer cells: live by the sword, die by the sword. Cancer Cell. 2006; 10:175-6.
45. Feldman DE, Chauhan V, Koong AC. The unfolded protein response: a novel component of the hypoxic stress response in tumors. Mol Cancer Res. 2005; 3:597-605.
46. Harding HP, Novoa I, Zhang Y, Zeng H, Wek R, Schapira M, Ron D. Regulated translation initiation controls stress-induced gene expression in mammalian cells. Mol Cell. 2000; 6:1099-108.
47. Wu F, Zhang Y, Sun B, McMahon AP, Wang Y. Hedgehog Signaling: From Basic Biology to Cancer Therapy. Cell Chem Biol. 2017; 24:252-80.
48. Li H, Peyrollier K, Kilic G, Brakebusch C. Rho GTPases and cancer. Biofactors. 2014; 40:226-35.
49. Bianconi D, Unseld M, Prager GW. Integrins in the Spotlight of Cancer. Int J Mol Sci. 2016; 17:E2037.
50. Yu H, Lee H, Herrmann A, Buettner R, Jove R. Revisiting STAT3 signalling in cancer: new and unexpected biological functions. Nat Rev Cancer. 2014; 14:736-46.
51. Micheau O, Solary E, Hammann A, Martin F, Dimanche-Boitrel MT. Sensitization of cancer cells treated with cytotoxic drugs to fas-mediated cytotoxicity. J Natl Cancer Inst. 1997; 89:783-9.
52. Thomas SE, Malzer E, Ordonez A, Dalton LE, van ’t Wout EF, Liniker E, Crowther DC, Lomas DA, Marciniak SJ. p53 and translation attenuation regulate distinct cell cycle checkpoints during endoplasmic reticulum (ER) stress. J Biol Chem. 2013; 288:7606-17.
53. Aliouat-Denis CM, Dendouga N, Van den Wyngaert I, Goehlmann H, Steller U, van de Weyer I, Van Slycken N, Andries L, Kass S, Luyten W, Janicot M, Vialard JE. p53-independent regulation of p21Waf1/Cip1 expression and senescence by Chk2. Mol Cancer Res. 2005; 3:627-34.
54. B’Chir W, Maurin AC, Carraro V, Averous J, Jousse C, Muranishi Y, Parry L, Stepien G, Fafournoux P, Bruhat A. The eIF2alpha/ATF4 pathway is essential for stress-induced autophagy gene expression. Nucleic Acids Res. 2013; 41:7683-99.
55. Ogata M, Hino S, Saito A, Morikawa K, Kondo S, Kanemoto S, Murakami T, Taniguchi M, Tanii I, Yoshinaga K, Shiosaka S, Hammarback JA, Urano F, et al. Autophagy is activated for cell survival after endoplasmic reticulum stress. Mol Cell Biol. 2006; 26:9220-31.
56. Wei Y, Pattingre S, Sinha S, Bassik M, Levine B. JNK1-mediated phosphorylation of Bcl-2 regulates starvation-induced autophagy. Mol Cell. 2008; 30:678-88.
57. Puthalakath H, O’Reilly LA, Gunn P, Lee L, Kelly PN, Huntington ND, Hughes PD, Michalak EM, McKimm-Breschkin J, Motoyama N, Gotoh T, Akira S, Bouillet P, et al. ER stress triggers apoptosis by activating BH3-only protein Bim. Cell. 2007; 129:1337-49.
58. Lei K, Davis RJ. JNK phosphorylation of Bim-related members of the Bcl2 family induces Bax-dependent apoptosis. Proc Natl Acad Sci U S A. 2003; 100:2432-7.
59. Hiramatsu N, Messah C, Han J, LaVail MM, Kaufman RJ, Lin JH. Translational and posttranslational regulation of XIAP by eIF2alpha and ATF4 promotes ER stress-induced cell death during the unfolded protein response. Mol Biol Cell. 2014; 25:1411-20.
60. Sano R, Reed JC. ER stress-induced cell death mechanisms. Biochim Biophys Acta. 2013; 1833:3460-70.
61. Tan Y, Dourdin N, Wu C, De Veyra T, Elce JS, Greer PA. Ubiquitous calpains promote caspase-12 and JNK activation during endoplasmic reticulum stress-induced apoptosis. J Biol Chem. 2006; 281:16016-24.
62. van Loo G, Schotte P, van Gurp M, Demol H, Hoorelbeke B, Gevaert K, Rodriguez I, Ruiz-Carrillo A, Vandekerckhove J, Declercq W, Beyaert R, Vandenabeele P. Endonuclease G: a mitochondrial protein released in apoptosis and involved in caspase-independent DNA degradation. Cell Death Differ. 2001; 8:1136-42.
63. Li LY, Luo X, Wang X. Endonuclease G is an apoptotic DNase when released from mitochondria. Nature. 2001; 412:95-9.
64. Schwerk C, Prasad J, Degenhardt K, Erdjument-Bromage H, White E, Tempst P, Kidd VJ, Manley JL, Lahti JM, Reinberg D. ASAP, a novel protein complex involved in RNA processing and apoptosis. Mol Cell Biol. 2003; 23:2981-90.
65. Fato R, Bergamini C, Bortolus M, Maniero AL, Leoni S, Ohnishi T, Lenaz G. Differential effects of mitochondrial Complex I inhibitors on production of reactive oxygen species. Biochim Biophys Acta. 2009; 1787:384-92.
66. Goswami P, Gupta S, Biswas J, Joshi N, Swarnkar S, Nath C, Singh S. Endoplasmic Reticulum Stress Plays a Key Role in Rotenone-Induced Apoptotic Death of Neurons. Mol Neurobiol. 2016; 53:285-98.
67. Al-Lazikani B, Banerji U, Workman P. Combinatorial drug therapy for cancer in the post-genomic era. Nat Biotechnol. 2012; 30:679-92.
68. Liao Y, Smyth GK, Shi W. The Subread aligner: fast, accurate and scalable read mapping by seed-and-vote. Nucleic Acids Res. 2013; 41:e108.
69. Liao Y, Smyth GK, Shi W. featureCounts: an efficient general purpose program for assigning sequence reads to genomic features. Bioinformatics. 2014; 30:923-30.
70. Bullard JH, Purdom E, Hansen KD, Dudoit S. Evaluation of statistical methods for normalization and differential expression in mRNA-Seq experiments. BMC Bioinformatics. 2010; 11:94.
71. Risso D, Schwartz K, Sherlock G, Dudoit S. GC-content normalization for RNA-Seq data. BMC Bioinformatics. 2011; 12:480.
72. Law CW, Chen Y, Shi W, Smyth GK. voom: Precision weights unlock linear model analysis tools for RNA-seq read counts. Genome Biol. 2014; 15:R29.
73. Ritchie ME, Phipson B, Wu D, Hu Y, Law CW, Shi W, Smyth GK. limma powers differential expression analyses for RNA-sequencing and microarray studies. Nucleic Acids Res. 2015; 43:e47.
74. Young MD, Wakefield MJ, Smyth GK, Oshlack A. Gene ontology analysis for RNA-seq: accounting for selection bias. Genome Biol. 2010; 11:R14.
75. Kramer A, Green J, Pollard J Jr, Tugendreich S. Causal analysis approaches in Ingenuity Pathway Analysis. Bioinformatics. 2014; 30:523-30.
76. Wilson R, Diseberg AF, Gordon L, Zivkovic S, Tatarczuch L, Mackie EJ, Gorman JJ, Bateman JF. Comprehensive profiling of cartilage extracellular matrix formation and maturation using sequential extraction and label-free quantitative proteomics. Mol Cell Proteomics. 2010; 9:1296-313.
77. Wilson R, Golub SB, Rowley L, Angelucci C, Karpievitch YV, Bateman JF, Fosang AJ. Novel Elements of the Chondrocyte Stress Response Identified Using an in vitro Model of Mouse Cartilage Degradation. J Proteome Res. 2016; 15:1033-50.
78. Vizcaino JA, Csordas A, Del-Toro N, Dianes JA, Griss J, Lavidas I, Mayer G, Perez-Riverol Y, Reisinger F, Ternent T, Xu QW, Wang R, Hermjakob H. 2016 update of the PRIDE database and its related tools. Nucleic Acids Res. 2016; 44:11033.
79. Cox J, Hein MY, Luber CA, Paron I, Nagaraj N, Mann M. Accurate proteome-wide label-free quantification by delayed normalization and maximal peptide ratio extraction, termed MaxLFQ. Mol Cell Proteomics. 2014; 13:2513-26.