
INTRODUCTION
Traditional staging of human colorectal cancer is not sufficiently informative to predict the formation of distant metastases in patients with localized disease. The histopathological features that are currently used as indicators of potentially aggressive disease include lymphovascular invasion, a poor differentiation grade, and—in T1 colorectal carcinomas—deep submucosal invasion (≥1,000 μm) and ‘tumor budding’, i.e. the presence of small clusters of tumor cells in the stroma at the invasive front [1, 2]. Large scale DNA analysis has so far failed to identify (patterns of) mutations in specific genes that are associated with metastasis or with histopathological features.
Gene expression profiling and RNA sequence analysis shows that recurrent patterns of gene expression can be used to define a limited number of ‘molecular subtypes’ in CRC [3–8]. These subtypes show marked differences in biological characteristics as well as in a patient’s prognosis. Currently, four consensus molecular subtypes (CMS1-4) are recognized: CMS1 (MSI, Microsatellite Instability, 14% of CRC cases), hypermutated, strong immune activation; CMS2 (Canonical, 37%), epithelial, chromosomally unstable, marked WNT and MYC signaling activation; CMS3 (Metabolic, 13%), epithelial, evident metabolic dysregulation; and CMS4 (Mesenchymal, 23%), prominent transforming growth factor β activation, stromal invasion, and angiogenesis [3–9]. The most aggressive subtype (CMS4) has the worst prognosis of all the subtypes as it shows greater tendency to form distant metastases as well as an association with chemotherapy-resistance. CMS4 is named the mesenchymal subtype as it shows atypical expression of mesenchymal genes [9], which is largely due to a high stromal content in these tumors [10, 11]. Stromal fibroblasts play a causative role in the metastatic process [12], but the potential contribution of other non-cancer cells to the aggressive behavior of stroma-rich CMS4 tumors is unknown. The tumor microenvironment contains many different cell types, including immune cells. In general, systemic and regional inflammatory responses can play an important role in the pathogenesis of cancer and metastatic tumor progression [13, 14]. Indeed, the CMS4 subtype also shows signs of infiltration by immune cells [15], but how and whether this is related to the aggressive behavior of these tumors is not clear. Tumor-infiltrating immune cells can have anti- or pro-tumorigenic effects. For instance, tumors with high levels of infiltrating T cells (i.e. a high ‘immunoscore’) have a lower chance of distant metastasis [12]. On the other hand, different types of immune cells have also been shown to release various proinflammatory, proangiogenic and prometastatic mediators [16–18]. One type of immune cell showing this type of dichotomy of function is the tumor-associated macrophages (TAMs), which are also a major component of the immune-infiltrate of most tumors [19, 20]. Depending on signals from the tumor microenvironment, TAMs can polarize towards a tumor-suppressing M1 phenotype (fostering a TH1 response and the generation of anti-tumor immunity) or towards a tumor-promoting M2 phenotype [21]. The literature on the role of TAMs in CRC is ambivalent, with studies showing a tumor promoting function [22] and studies showing a tumor suppressive function [23].
The presence of immune cells in human tumor tissue is traditionally analyzed by immunohistochemistry using specific immune cell markers. In addition, RNA profiles of unsegregated tumor tissue can also be used to infer the presence of immune cell types in tumors. Highly restricted gene expression signatures in specific immune cell types form the basis for such analyses. A collection of such signatures, the ‘immunome compendium’, can be used to interrogate the immune landscape of human CRC and other cancers [24].
Aside from the CMS classification, another important adverse prognostic factor that has been well-established recently is the migration of single tumor cells or clusters at the invasive front of the tumor bulk [25–28]. This is also known as tumor budding. While tumor budding has been described in other gastrointestinal cancers such as pancreatic and esophageal carcinoma, it is most extensively studies in CRC. Tumor budding is regarded as an independent predictor of lymph node and distant metastases, recurrence and survival. While the underlying mechanisms for this phenomenon remain unclear, the migration of tumor cells is thought to represent a form of epithelial-to-mesenchymal transition (EMT) [25–29].
In the present manuscript, we have used the immunome compendium to show that macrophage signatures are highly expressed in aggressive subtypes of primary CRC and liver metastases (LM). Moreover, co-culture experiments reveal that macrophages at the tumor-stroma interface appear to trigger a ‘tumor budding-type’ invasion pathway. The underlying mechanism involved matrix metalloproteases (MMP)-mediated degradation of tight junctions. We demonstrate the existence of a macrophage- and MMP-dependent budding-type invasion pathway that operates independently of classical EMT in aggressive colorectal cancer, and describe an in vitro system to study this phenomenon.
RESULTS
High expression of macrophage signatures in aggressive subtypes of primary CRC and liver metastases
A high content of cancer-associated fibroblasts (CAF) contributes extensively to the mesenchymal phenotype of aggressive colon cancer [10, 11, 30]. The co-expression of mesenchymal signatures with signatures reflecting inflammation [15] suggests that certain immune cells may be enriched in stroma-high colon tumors and that, if this is indeed the case, they may contribute to their aggressive behavior. To test this hypothesis, we made use of the ‘immunome compendium’, a collection of gene sets reflecting the presence of specific immune cells that can be used to investigate the immune landscape of (colon) tumors [24]. We first tested the correlation of each specific immune cell signature with a signature reflecting high CAF content [31] in two large primary colon cancer cohorts and a liver metastasis cohort. In all three cohorts the signature reflecting the presence of macrophages was most strongly correlated with the CAF signature (Table 1).
Table 1: Immune cell signature expression in relation to stroma and consensus molecular subtypes
Table 1 |
PRIMARY |
LM |
PRIMARY |
LM |
PRIMARY |
LM |
PRIMARY |
LM |
PRIMARY |
LM |
|||||
|---|---|---|---|---|---|---|---|---|---|---|---|---|---|---|---|
CIT-566 |
MVRM-345 |
LM-119 |
CIT-566 |
MVRM-345 |
LM-119 |
CIT-566 |
MVRM-345 |
LM-119 |
CIT-566 |
MVRM-345 |
LM-119 |
CIT-566 |
MVRM-345 |
LM-119 |
|
Macrophages |
0,88 |
0,862 |
0,88 |
0,533 |
0,448 |
n/a |
-0,461 |
-0,4 |
-0,405 |
-0,205 |
-0,163 |
0,076 |
0,775 |
0,767 |
0,793 |
T-helper 1 |
0,63 |
0,511 |
0,75 |
0,491 |
0,383 |
n/a |
-0,453 |
-0,33 |
-0,199 |
-0,23 |
-0,191 |
0,327 |
0,469 |
0,341 |
0,74 |
Neutrophils |
0,63 |
0,604 |
0,58 |
0,349 |
0,293 |
n/a |
-0,42 |
-0,43 |
-0,412 |
-0,15 |
-0,108 |
0,056 |
0,483 |
0,417 |
0,379 |
Dendritic cells, Immature |
0,62 |
0,506 |
0,82 |
0,212 |
-0,021 |
n/a |
-0,351 |
-0,26 |
-0,328 |
0,158 |
0,104 |
0,098 |
0,492 |
0,427 |
0,682 |
T-effector memory |
0,56 |
0,435 |
0,53 |
0,254 |
-0,047 |
n/a |
-0,147 |
0,02 |
0,233 |
-0,349 |
-0,194 |
0,079 |
0,526 |
0,441 |
0,576 |
Dendritic cells |
0,54 |
0,584 |
0,71 |
0,122 |
0,072 |
n/a |
-0,29 |
-0,26 |
-0,504 |
-0,003 |
-0,042 |
-0,02 |
0,383 |
0,425 |
0,55 |
Mast cells |
0,53 |
0,465 |
0,68 |
0,019 |
-0,1 |
n/a |
-0,304 |
-0,35 |
-0,255 |
0,186 |
0,074 |
0,164 |
0,504 |
0,472 |
0,588 |
T-follicular helper |
0,4 |
0,249 |
0,44 |
0,184 |
0,002 |
n/a |
-0,125 |
-0,06 |
0,127 |
0,123 |
0,279 |
0,214 |
0,301 |
0,135 |
0,457 |
B cells |
0,39 |
0,267 |
0,61 |
0,073 |
0,014 |
n/a |
-0,153 |
-0,16 |
-0,244 |
0,098 |
0,282 |
-0,007 |
0,251 |
0,154 |
0,469 |
T-CD8 |
0,38 |
0,295 |
0,4 |
0,426 |
0,44 |
n/a |
-0,286 |
-0,14 |
0,171 |
-0,003 |
0,092 |
0,082 |
0,27 |
0,151 |
0,447 |
Eosinophils |
0,26 |
0,39 |
0,26 |
0,028 |
-0,135 |
n/a |
-0,087 |
-0,03 |
0,24 |
0,132 |
0,074 |
0,31 |
0,255 |
0,367 |
0,246 |
T gamma delta |
0,25 |
0,469 |
0,6 |
-0,052 |
-0,093 |
n/a |
-0,207 |
-0,34 |
-0,609 |
0,111 |
0,055 |
-0,181 |
0,316 |
0,294 |
0,421 |
Natural Killer cells |
0,22 |
0,147 |
0,53 |
-0,148 |
0,051 |
n/a |
-0,169 |
-0,07 |
0,03 |
-0,084 |
-0,043 |
0,262 |
0,216 |
0,233 |
0,551 |
T central memory |
0,19 |
0,172 |
0,19 |
0,248 |
0,095 |
n/a |
0,101 |
0,14 |
0,424 |
-0,1 |
-0,051 |
0,162 |
0,149 |
0,155 |
0,229 |
Dendritic cells, activated |
0,18 |
0,11 |
0,43 |
0,391 |
0,446 |
n/a |
-0,294 |
-0,31 |
-0,031 |
-0,038 |
-0,049 |
0,172 |
0 |
-0,09 |
0,352 |
T-helper 2 |
-0,08 |
-0,161 |
0,13 |
0,658 |
0,673 |
n/a |
-0,158 |
-0,21 |
0,245 |
0,09 |
0,234 |
0,54 |
-0,16 |
-0,227 |
0,247 |
STROMA |
CMS1 |
CMS2 |
CMS3 |
CMS4 |
|||||||||||
Expression of the indicated immune compendium signatures was analyzed in large cohorts of primary colorectal tumors (CIT-566, MVRM-345) and liver metastases (LM-119). For each of the signatures used meta-gene values were generated in R2 (http://r2.amc.nl). For each signature the meta-gene expression values for all tumors in the cohort were stored as a separate track. These tracks were subsequently compared 1 by 1 in exactly the same manner as one would compare the expression of two genes in a tumor cohort. One way analysis of variance (ANOVA) was then used to assess significance of the correlation and xy plots were generated for all track-track correlations. Table 1 shows the correlation R-values belonging to each xy-plot. Two examples of such xy plots are shown in Supplementary Figure 1. The accompanying p-values (–LOG10-transforemd) are also provided in Supplementary Figure 1. The strength of the correlation is color coded from negative (blue, -1) to positive (red, +1).
Efforts to classify human primary colon tumors into ‘molecular subtypes’ have resulted in a classification system comprising 4 Consensus Molecular Subtypes (CMS1-4) [9]. Of these subtypes, CMS4 is characterized by a high stromal content and a poor prognosis. We found that the macrophage signature was most strongly correlated with the classifier genes that positively identify CMS4 (Table 1). In line with this, the macrophage signature identified a poor-prognosis subgroup of primary human colorectal tumors (Figure 1A). The major contributor in this macrophage signature poor-prognosis subgroup is the CMS4 subtype (Figure 1B). The classification studies have so far been limited to primary CRC. To investigate the existence of molecular subtypes in colorectal liver metastases we analyzed gene expression data of a cohort of 119 liver metastases [32] by unsupervised clustering. This generated three independent subgroups (LM1-3) of which one (LM3) had a poorer prognosis when compared to the two other subgroups (p<0.001; Figure 2A). The difference in overall survival was even more pronounced when restricting the analysis to chemotherapy naïve patients (p<0.001; Figure 2B). Interestingly, the signature genes identifying CAFs, macrophages and CMS4 were significantly enriched in LM3 indicating that LM3 resembles CMS4 (Figure 2C). Moreover, analysis of the immunome compendium in relation to the LM subtypes revealed that macrophages were highly enriched in LM3, as they are in CMS4, while their presence was negatively correlated with LM1 and LM2 (Figure 2D).
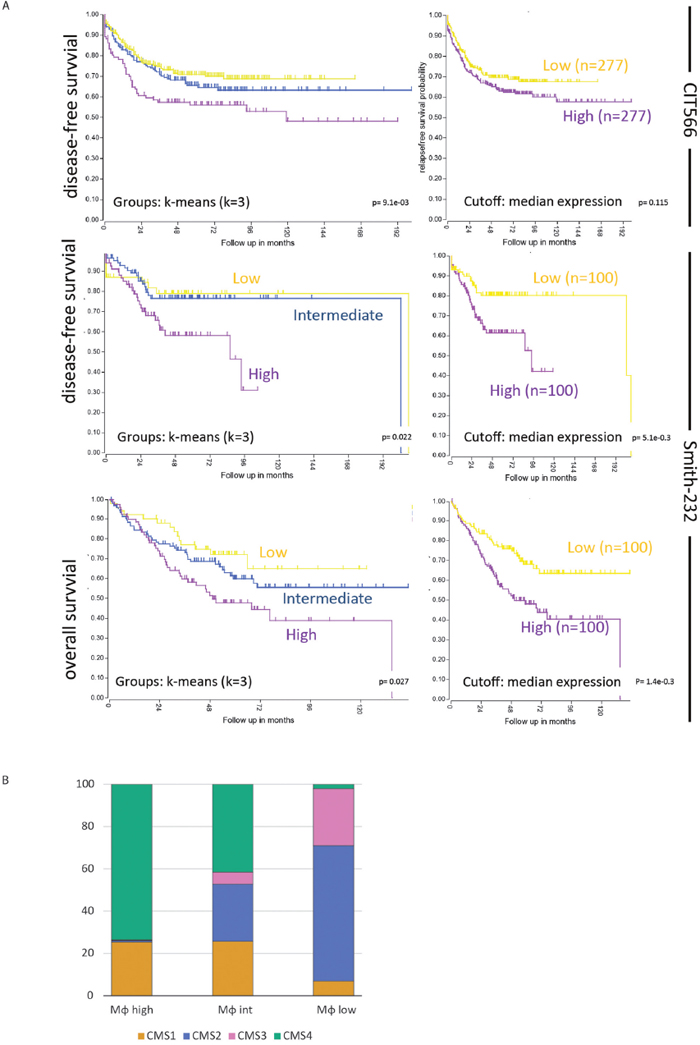
Figure 1: A macrophage signature identifies a poor prognosis subgroup of primary human colorectal tumors. (A) The macrophage signature of the immune compendium was used to cluster the tumors of the CIT566 cohort into three groups by k-means clustering (http://r2.amc.nl): Macrophage high (n=142), intermediate (n=264) and low (n=396). The Kaplan Meier curve shows the differences in disease-free survival of the three subgroups. The inset shows the signature expression levels in the three subgroups. Moreover, by generating single meta-gene values of the multi-gene macrophage signature and taking the median expression of those meta-gene values as a cutoff, two equally sized groups of tumors were created in both the CIT566 and Smith cohorts. These tumors showed significant differences in disease-free and overall survival, similar to the k-means clustering. Characteristics of these cohorts shown in Supplementary Figure 1C. (B) Bar graphs showing the contribution of the four CMS subtypes to macrophage-high, -intermediate and -low subgroups in the CMS-3232 cohort. The CMS classification was derived from Guinney et al. [9].
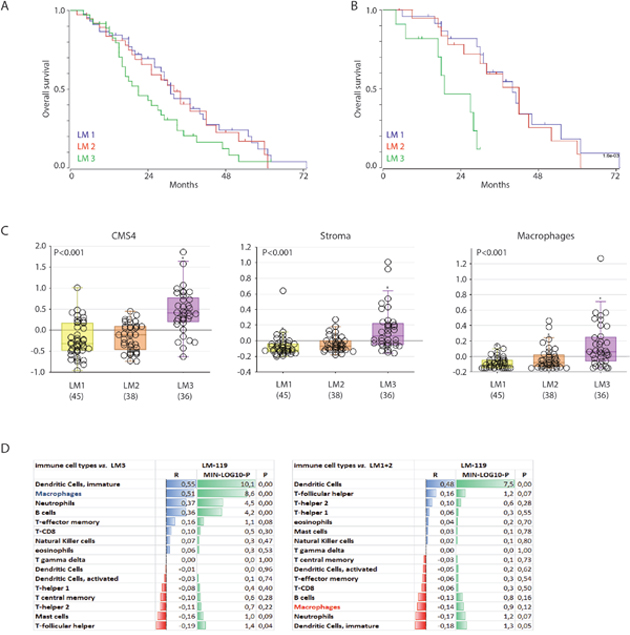
Figure 2: A poor prognosis subgroup of colorectal liver metastases is characterized by high expression of a macrophage signature. (A) Gene expression profiles of 119 colorectal liver metastases were used for unsupervised clustering, yielding three ‘molecular subtypes’ (LM1-3). The figure shows Kaplan Meier curves of LM1-3 (log rank test p<0.001). (B) Survival curve of the chemo-naive patients (n=55), log rank test p<0.001. (C) Box-whisker plots showing the gene signature expression of cms4, stroma and macrophage signatures in the LM subgroups (all tested with one-way ANOVA, p<0.001). (D) Correlation of gene signatures corresponding with cell types in the tumor microenvironment and LM3, p-values are depicted as a – log 10 scale per R-value.
M2-macrophages cause tumor cell budding from the colonosphere bulk
To study the influence of macrophages on colorectal tumor cells, we set up a co-culture system for macrophages and patient-derived colonospheres (L145 and L169; derived as described before by Emmink et al [33]). Monocytes from healthy donors were isolated and differentiated into M2-macrophages via IL-10 stimulation (Supplementary Figure 2). Co-culturing M2 macrophages with colonospheres in suspension for 48 hours caused adherence of the tumor cells to the dish and induced tumor cell spreading. Moreover, small tumor cell clusters detached from the colonosphere bulk. This tumor cell behavior was not observed when co-culturing the colonospheres with anti-tumor M1 macrophages (Figure 3A). To quantify this tumor cell phenotype, we performed adhesion assays showing a 3.2-fold macrophage-induced increase in the adherence of small tumor clusters (≤ 5 cells) after 48 hours co-culturing respectively (p<0.0001). This effect was not reproduced by M2-conditioned media, suggesting the requirement for direct cell-cell interaction. To examine whether the macrophage-induced increase in ‘budding’ was due to a change in proliferation, we performed proliferation assays which showed no significant difference in proliferation between the spheroid cultures and the co-cultures (Figure 3C). To further study a potential association of macrophages with tumor budding, we analyzed T1 colorectal carcinomas with immunohistochemistry, as the invasive front and tumor core can be studied on the same tissue sections (n=8 different tumors). The invasive front in these tumors can be easily identified with a pancytokeratin staining. High numbers of budding cells at the invasive front have been associated with poor prognosis and a tendency to metastasize [1, 2]. The invasive front, especially regions where budding cells were identified, showed a strong enrichment in CD68- and CD163-positive macrophages when compared to the tumor core (5,5-fold (p<0.001) and 3,5-fold (p= 0,0052 respectively; Figure 3D).
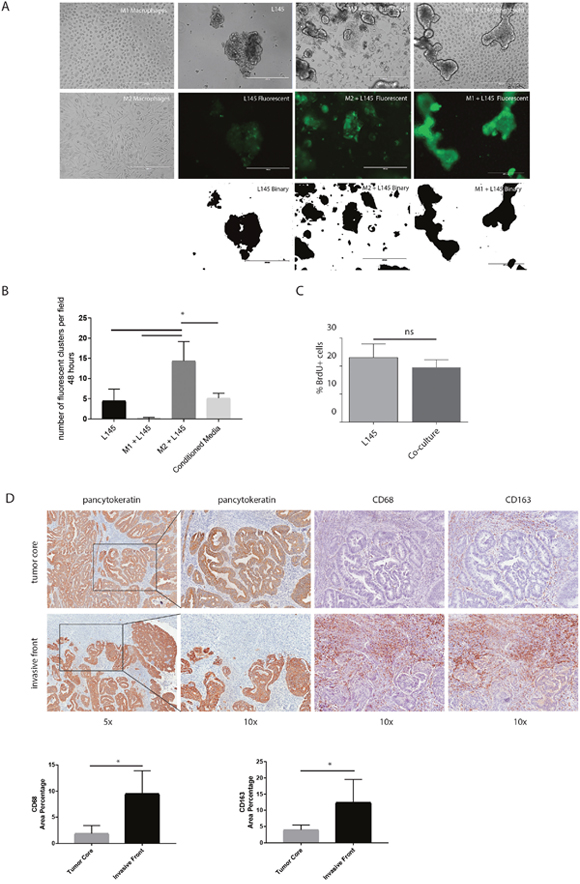
Figure 3: M2 macrophages cause tumor cell budding from the colonosphere bulk. (A) Representative images of bright field microscopy of the mono-cultures and co-cultures are shown in the upper panel. Green fluorescent images to identify tumor cells are shown in the middle panel, binarized images of the fluorescence are shown in the lower panel, 10x magnification on EVOS microscope; scale bars indicate 400 μm. (B) Adherence assay showing the number of small cell clusters (≤5 cells) per condition; one-way ANOVA, p=<0.0001. (C) Proliferation of colonospheres measured on FACS Caliber after a BrdU pulse chase experiment. (D) Representative bright field microscopy images of the invasive front and the tumor core of T1-tumors using the immunohistochemical stainings Pan-cytokeratin (tumor cells), CD68 and CD163 (macrophages). Quantification of immunohistochemical stainings, depicted as percentage of area on the left CD68 and on the right CD163; n=8 different tumors, one image field per tumor for the invasive field and one field for the tumor core; bar graphs show mean and SD, paired t-test, p=0.0006 and p=0,0052 respectively.
Macrophages increase tumor “mesenchymal nature”
An increase in stem cell capacity has been linked to colon cancer aggressiveness [12, 34]. Therefore, we tested whether macrophages can influence parameters of cancer differentiation. We found that macrophages induced increased expression of the stem cell markers OCT4 and OLFM4, and decreased expression of the differentiation marker CK-20 (Figure 4A). Furthermore, macrophages induced translocation of β-catenin from cell-cell junctions to the nucleus (Figure 4B). Finally, co-culturing with macrophages caused a significant increase in the regenerative, clone-forming, capacity of tumor cells (L145 p=0.002 & L169 p<0.001; Figure 4C). Macrophages alone did not form colonies. In addition, as several studies have found an accumulation of nuclear β-catenin at the invasive tumor front, while it remained membrane-bound at the non-invasive regions [35, 36], nuclear β-catenin was assessed by immunohistochemistry. When analyzing the expression of β-catenin in T1 colorectal carcinomas, immunohistochemistry showed increased nuclear β-catenin staining (almost 2-fold, p=0.003) in budding cells at the invasive front compared to the tumor core (Figure 4D). Together the results suggest that macrophages promote a more mesenchymal-like phenotype in nearby tumor cells.
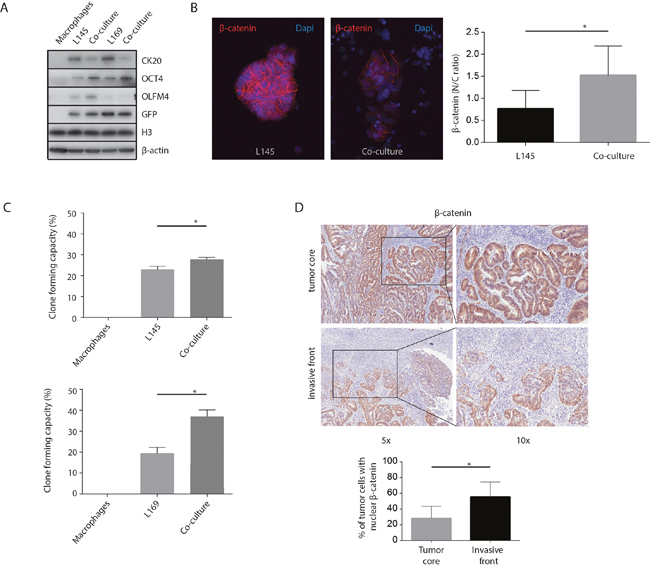
Figure 4: M2 macrophages increase tumor “mesenchymal nature”. (A) Western Blots of whole cell lysates showing CK-20, OLFM4 and OCT4 expression, with GFP, H3 and β-actin as loading controls. (B) Representative confocal microscopy images of β-catenin, 20x magnification. The graph shows the quantification of the nuclear versus cytoplasmic β-catenin ratio measured in pancytokeratin positive cells. (C) Clone forming capacity assays for mono- and co-cultures. (D) Representative bright field microscopy images and quantification of immunohistochemical nuclear β-catenin staining in T1 carcinoma invasive front and tumor core, n=8 different tumors, one image field per tumor for the invasive field and one field for the tumor core; bar graphs show mean and SD, paired t-test, p=0.003.
Macrophages induce loss of tight junction proteins at tumor cell-cell contacts
As tumor cell budding would necessitate cells separating from the bulk, this could indicate an effect on cell–cell junctions. Therefore, we examined whether tight junctions were affected during tumor cell budding. Western Blot analysis of total lysates showed a macrophage-induced decrease in the tight junction protein occludin (Figure 5A). Furthermore, immunofluorescence analysis confirmed an overall strongly reduced intensity of occludin and JAM-A levels between cancer cells (Figure 5B, 5C), suggesting reduced tight-junction mediated cell-cell adhesion. RT-qPCR analysis showed that macrophages did not affect occludin or JAM-A RNA levels (Figure 5D), possibly suggesting regulation at the (post-) translational level.
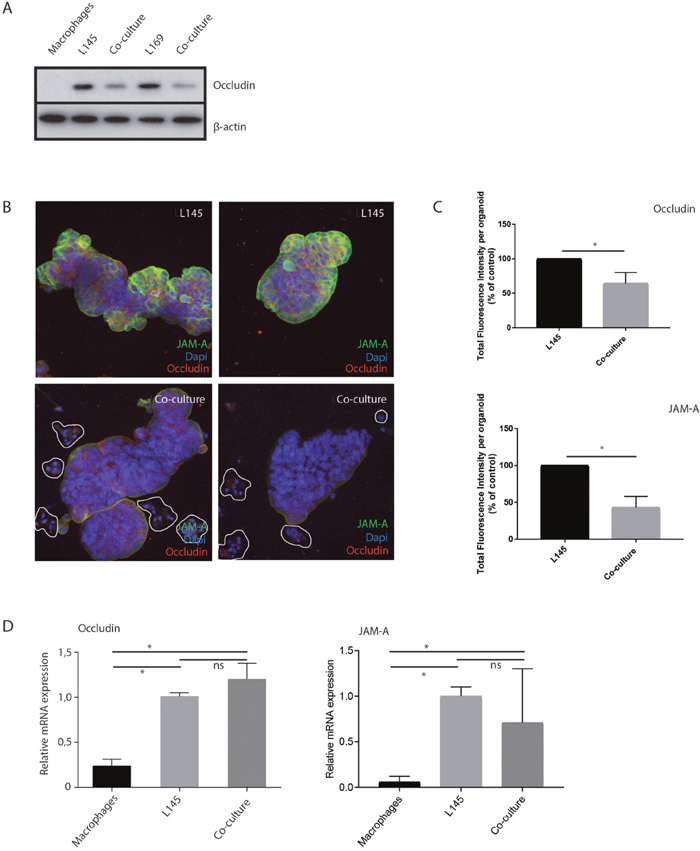
Figure 5: M2 macrophages induce loss of tight junction proteins at tumor cell-cell contacts. (A) Western blot of whole cell lysates showing occludin expression in mono- and co-cultures with M2 macrophages. (B) Representative confocal microscopy pictures of immunofluorescence experiments for Occludin and JAM-A, 20 x magnification, n=7. Clusters of budding tumor cells are marked in the co-culture, (C) For each organoid, all the z-slides from the z-stack were added to allow quantification of fluorescence in all planes of the organoid, namely total fluorescence intensity per organoid. n=6 organoids for L145 and 8 organoids for the co-culture. Control L145 is set as 100 percent. (D) Relative mRNA expression of Occludin and JAM-A in mono- and co-cultures.
MMPs control macrophage-induced loss of tight junction proteins and budding
MMPs are involved in extracellular matrix remodeling in physiological and pathological processes. Increased MMP activity can also contribute to the disassembly of intercellular junctions [37]. Western blot analysis of MMP-7 and MMP-9 expression showed that macrophages express MMP-9 but not MMP-7. Co-culturing macrophages with tumor cells caused increased expression of MMP-7 and MMP-9 in the tumor cells (Figure 6A-6B). Furthermore, an increase in MMP-9 expression was also seen around the budding cells at the invasive front of T1 colorectal carcinomas (Figure 6C). The percentage of area of MMP-9 staining was increased 5-fold (p=0.012) at the invasive front compared to the tumor core. These data show that the macrophage-MMP axis is likely to operate particularly in the invasive front of colorectal carcinomas. Next, we used Batimastat, an inhibitor of MMP activity, which binds the zinc ion in the active site of MMPs [38], to investigate a potential role for MMP activity in mediating the loss of tight junction proteins induced by macrophages. We found that Batimastat completely prevented macrophage-induced loss of occludin protein levels (Figure 6D). Strikingly, Batimastat also prevented macrophage-induced tumor cell budding and clone formation (Figure 6E, 6F).
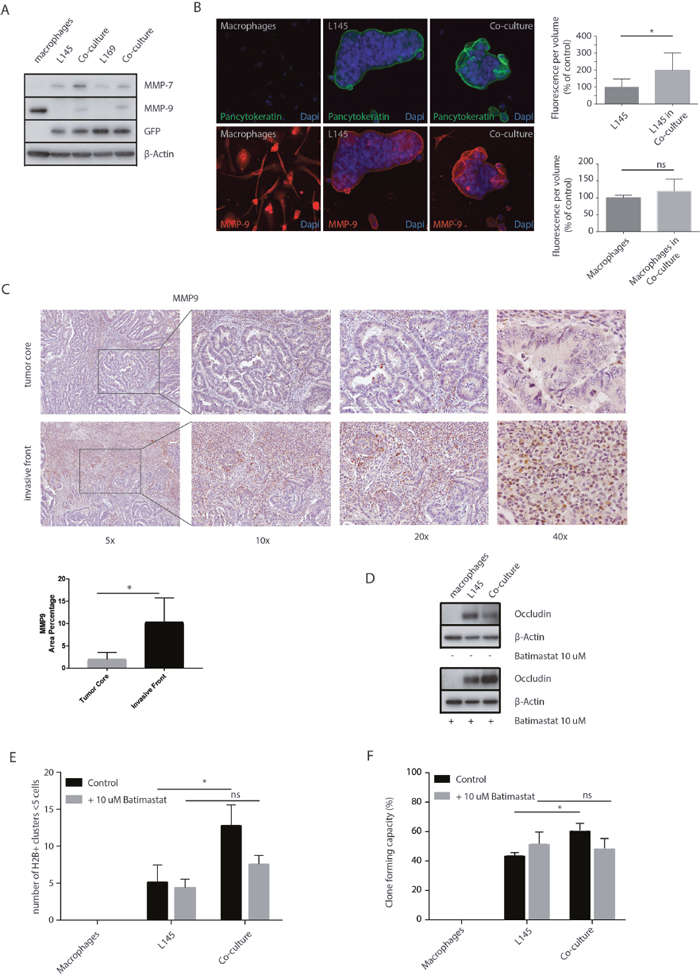
Figure 6: MMP inhibition prevents loss of tight junction protein expression and tumor cell budding. (A) Western Blots of whole cell lysates showing MMP-7 and MMP-9 expression in mono- and co-cultures, with GFP and β-actin as loading controls. (B) Representative confocal microscopy images of MMP-9, 20 x magnification. The upper graph shows the quantification of MMP-9 measured in pancytokeratin positive cells, the tumor cells. The lower graph shows the quantification of MMP-9 measured in pancytokeratin negative cells, the macrophages. (C) Representative bright field microscopy images (5x, 10x, 20x and 40x) of immunohistochemical staining of MMP-9 expression at the invasive front and tumor core of T1 carcinomas, n=8 different tumors, one image field per tumor for the invasive field and one field for the tumor core; bar graphs show mean and SD, paired t-test, p=0.0116. (D) Western blots of whole cell lysates showing occludin expression in mono- and co-cultures with or without Batimastat 10 μM treatment for 48 hours. (E) Adherence assay showing the number of small cell clusters (≤5 cells) per condition with or without Batimastat 10 μM treatment for 48 hours, multiple t-tests, p<0.01. (F) Clone forming assay with or without Batimastat 10 μM treatment for 48 hours, two-way ANOVA, p<0.001.
A potential role for NFκB in macrophage-induced tumor cell budding
To further analyze the mechanism of macrophage-induced tumor cell budding we used the immune compendium macrophage signature to cluster several large tumor cohorts into subgroups (macrophage low-intermediate-high). We next identified the genes that were differentially expressed between macrophage-high and macrophage-low tumors. The promoters of these genes were subsequently analyzed for enrichment of specific transcription factor binding sites. This analysis revealed that NFκB-controlled genes were strongly enriched in macrophage-high tumors in all cohorts analyzed (Table 2). Moreover, a published NFκB target gene signature [39] was significantly higher expressed in the mesenchymal-like tumor subgroups LM3 and CMS4 (Figure 7A) and, as expected, in CMS1. Western blot analysis showed that NFκB p65 expression in tumor cells increased following co-culture with macrophages (Figure 7B). NFκB signaling facilitates malignant transformation of differentiated cells [40] and is high in the invasive front of human colorectal tumors [41]. Therefore, we hypothesized that NFκB signaling could play a role in the budding process induced by macrophages. To test this, we co-cultured tumor cells and macrophages in the presence or absence of the NFκB-inhibitor Sanguinarine [42]. Similar to the MMP inhibitor Batimastat, we found that Sanguinarine interfered with the decrease of occluding protein expression in the co-cultures as well as with tumor budding (Figure 7D). While the protein level of NFκB is not effected by either Sanguinarine or Batimastat (Supplementary Figure 5), the inhibition of NFκB by Sanguinarine resulted in a decrease in MMP7 in the co-culture (Figure 7F), suggesting a role for NFκB in the MMP-dependent decrease of Occludin. Surprisingly, batimastat also appeared to reduce the protein level of MMP7 (Figure 7F).
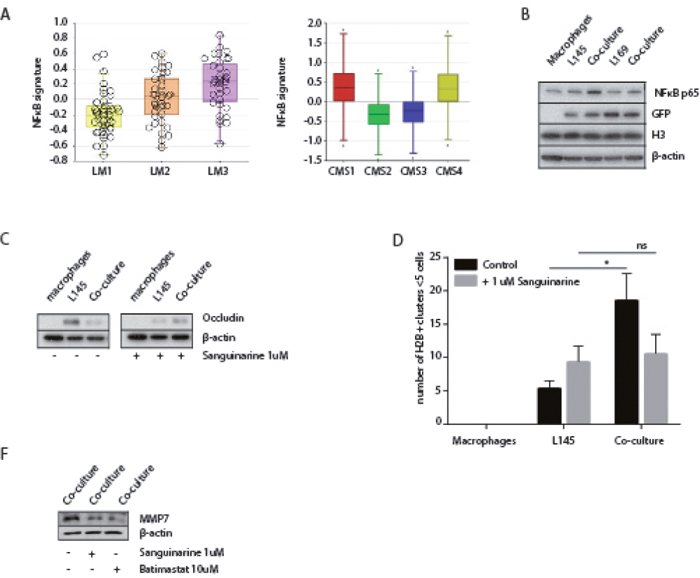
Figure 7: A potential role for NFκB in macrophage-induced tumor cell budding. (A) Left box-whisker plot showing the gene signature expression of NFκB in the LM subgroups. Right box-whisker plot showing the gene signature expression of NFκB in primary CRC classified via the CMS-classification. (B) Western Blots of whole cell lysates showing NFκB p65 expression, with GFP, H3 and β-actin as loading controls. (C) Western blots of whole cell lysates showing occludin expression in mono- and co-cultures with or without Sanguinarine 1 μM treatment for 48 hours. (D) Adherence assay showing the number of small cell clusters (≤5 cells) per condition with or without Sanguinarine 1 μM treatment for 48 hours, multiple t-tests, p<0.01. (F) Western blots of whole cell lysates showing decreased MMP7 expression with Sanguinarine 1 μM treatment and Batimastat 10 μM, for 48 hours.
Table 2: NFκB target gene enrichment in Macrophage-high tumor subgroups
Differentially expressed genes |
NFκB rank |
NFκB target genes |
||||||
|---|---|---|---|---|---|---|---|---|
Cohort |
Groups |
MΦ HIGH vs LOW |
Total |
Relative |
UP in MΦ HIGH |
UP in MΦ LOW |
Fold |
P (2x2 contingency) |
AMC-90 |
3 |
1425 |
7/270 |
0.96 |
383 |
165 |
2,321212 |
3,00E-05 |
CIT-566 |
3 |
4515 |
8/355 |
0.98 |
524 |
257 |
2,038911 |
4,90E-07 |
LM-199 |
2 |
2348 |
1/128 |
1.0 |
266 |
112 |
2,375 |
2,30E-05 |
TCGA-286 |
3 |
4391 |
11/562 |
0.98 |
656 |
102 |
6,431373 |
1,70E-11 |
The tumors of the indicated cohorts were clustered into 2 or 3 groups using the macrophage signature of the immune compendium. Differentially expressed genes between MF-HIGH and MF-LOW subgroups were then identified in R2. Transcription factor binding site analysis of the differentially expressed genes in all cohorts revealed a strong enrichment for NFκB target genes in all MF-HIGH groups.
DISCUSSION
In the present study we provide evidence that macrophages promote tumor cell budding in aggressive colon tumors through MMP-mediated degradation of tight junction proteins. The loss of tight junction integrity is commonly observed during oncogenic transformation. For instance, tight junction protein levels are decreased in colon cancer tissue when compared to normal intestinal tissue [43] and are inversely correlated with tumor grade [44]. The maintenance of tight junctions could play a pivotal role in the prevention of metastasis. Indeed, the budding phenomenon that we have observed in macrophage-tumor cell co-cultures reflects histological tumor budding, which is strongly correlated with poor prognosis [45]. Apart from destabilizing cell-cell interactions the loss of tight junctions also results in disturbed epithelial polarity which facilitates multidimensional tumor cell extrusion from the epithelial layer and promotes both tumor mass formation and invasion [46, 47].
Previous work has shown that paracrine chemokine signaling between tumor cells and macrophages can promote tumor cell migration in colon cancer [48, 49]. In T1-tumors there was a strong association between MMP-7 and nodal metastases in colon cancer [50]. The macrophage-MMP-tight junction-axis described in the present report adds a novel dimension to the functional interplay between both cell types in the tumor microenvironment. Occludin degradation has previously been implicated in the disruption of endothelial and epithelial barriers: High ROS levels in the endothelium of cerebral micro-capillaries resulted in occludin cleavage in the presence of high levels of MMPs [51]. Likewise, proteolytic cleavage of occludin by MMP-9 in the corneal epithelium disrupted barrier function through loss of tight junctions [52]. MMP-7 degrades laminin and type IV collagen to facilitate tumor invasion [53, 54]. However, MMPs play important roles in many different processes and their substrates are not limited to ECM components [55]. Although the relevant substrates for MMP-7 and MMP-9 in colorectal cancer progression are currently not known, meta-analyses have shown that high expression of either protease strongly predicts poor overall survival [56, 57]. Our work further connects high MMP-7 and MMP-9 expression to occludin degradation, loss of tight junctions and tumor cell budding in colon cancer. MMP inhibitors have been developed for anti-cancer therapy but have largely failed in the clinic due to unacceptable toxicity and lack of specificity and activity [58]. The design and pre-clinical testing of more specific MMP inhibitors [59] may re-open the way to targeting metastasis through MMP inhibition.
MMP-7 and MMP-9 are targets of the NFκB transcription factor [60–62]. We found a strong association of NFκB target gene expression with poor prognosis and with an aggressive macrophage-rich tumor phenotype. This is in line with studies showing that the activation of NFκB by prostaglandin E2 promotes [63] the formation of liver metastases and an increase in cancer stem cells [63]. NFκB also promotes tumor cell survival [64, 65] which may be especially relevant following detachment from neighboring cells. Factors that activate NFκB are over-expressed in tumor-macrophage co-cultures [66] Vice versa, inhibition of NFκB can prevent metastasis formation, either alone or in combination with 5-FU [64, 66, 67]. Together the studies point towards NFκB inhibition as a potentially effective strategy to suppress the budding phenotype and metastasis. The clinical development of NFκB inhibitors has been hampered by the central role that this transcription factor plays in innate and adaptive immunity, precluding long-term inhibition of NFκB for therapeutic purposes.
Most targeted therapies have been developed against tumor cell-intrinsic pathways. However, stroma-targeting therapies have also been developed, including anti-angiogenic therapy. The VEGF-targeting antibody bevacizumab is now part of the standard treatment of metastatic colorectal cancer. More recently, the TAM has received attention as a bona fide target in the tumor microenvironment. Pre-clinical work in glioblastoma multiforme models has shown that macrophage ‘re-education’ through CSF1R inhibition caused re-polarization of TAMs towards an M1 phenotype, which dramatically increased survival, and regressed established tumors [68]. Unfortunately, in our experiments the CSF1R inhibitor BLZ-945 did not prevent macrophage-induced tumor cell budding, nor did it induce tumor cell killing (KT, unpublished results). Nevertheless, targeting TAMs through alternative pathways remains an attractive option for developing new treatment strategies against aggressive colon cancer.
So far, the molecular classification of human colon cancer has been limited to primary tumors [3–9]. We provide evidence for the existence of a CMS4-like liver metastasis subtype (LM3). Both CMS4 and LM3 show high expression of mesenchymal genes indicating a high stromal content [11, 17] and/or a more mesenchymal nature of the neoplastic cells [30]. In addition, both subtypes show high expression of the macrophage signature and both subtypes are associated with a reduced survival probability. A further understanding of the pro-tumorigenic influence of macrophages on tumor progression may therefore be relevant for both early, local disease, and for metastatic cancer.
In conclusion, our study has identified a novel macrophage-initiated NFκB-MMP pathway that causes loss of tight junction integrity and tumor budding. The co-culture system described here may serve as a new model system to investigate tumor budding in more detail, including for instance the influence of various cytokine/chemokine pathways, matrix components and additional stromal cell types. Such work should lead to the identification of potentially targetable pathways in the treatment of aggressive colon cancer subtypes.
MATERIALS AND METHODS
Cell culture
Monocyte-derived macrophages (MDMs) were prepared as previously described [69]. In brief, PBMC were isolated from venous blood obtained from adult healthy donors by gradient centrifugation using Ficoll-Paque Plus (GE Healthcare, Uppsala, Sweden). Monocytes were isolated from the PBMC suspension by gradient centrifugation using Percoll® (GE Healthcare, Uppsala, Sweden). The cells were taken up in RPMI 1640 medium containing 1% FCS, 1% Ultraglutamine and 1% PenStrep with a density of 0.35x10⁶cells/ml. After 1 hour of adhering, the non-adherent cells were washed away and the remaining monocytes were cultured in RPMI 1640 medium containing 10% FCS, 1% Ultraglutamine and 1% PenStrep and stimulated with M-CSF (R&D Systems, Minneapolis, USA) 25 ng/ml for 8 days. For further polarization of the macrophages to a M2 phenotype, stimulation with IL-10 (Peprotech, Rocky Hill, USA) 10 ng/ml 48 hours followed. For generating M1 macrophages, monocytes were isolated as mentioned above and stimulated with GM-CSF (R&D Systems, Minneapolis, USA) 25 ng/ml for 10 days.
Patient-derived colonosphere lines were established as described before [33]. The colonospheres are cultured in non-adherent 10 cm dishes in Stem Cell Medium with 10 ng/mL b-FGF (Abcam), which is refreshed twice a week. All cell culture was carried out at 37° C in a 5% CO2 humidified incubator.
In Figure 3A, fluorescent coculture images were binarized by using the Thresholding automatic setting ‘Huang’ by Huang & Wang (1995) [70] in Fiji/ImageJ for all three images.
Bioinformatics analyses
We used our previously generated dataset containing gene expression profiles of 119 liver metastases deposited at Array Access E-TABM-1112 and we used a dataset containing gene expression profiles of 3232 primary CRC described before [9]. These datasets were uploaded into the R2 Genomics analysis and visualization platform (http://r2.amc.nl) for the various types of analyses described in the text and figure legends.
Western blot
Lysates were prepared either in RAS lysis buffer (20 mmol/L HEPES pH 7.4, 1% Nonidet P-40, 150 mmol/L NaCl, 5 mmol/L MgCl2, and 10% glycerol) or in Leamli buffer (10% glycerol, 2% SDS, 63 mM Tris-HCl pH 6.8). Nuclear proteins were extracted with nuclear extraction buffer (25mM HEPES pH 7.4, 500mM NaCl, 5mM MgCl2, 1mM DTT, 0.2% NP-40, 10% Glycerol, Protease/Phosphatase inhibitors). Equal amounts of protein were loaded on NuPAGE Novex Bis-Tris Mini Gel (Invitrogen) and were analyzed by Western blotting.
Immunofluorescence
Cells were harvested and fixed in PBS containing 4% of formaldehyde and permeabilized with ice-cold (−20°C) methanol. Cells were blocked in PBS containing 0.1% Tween and 5% BSA; cells were incubated with primary antibodies Pancytokeratin (MA5-13156, Pierce Antibodies, 1:100 dilution), β-catenin (9582, Cell Signaling, 1:100 dilution), Occludin (33-1500, Life Technologies, 1:100 dilution), JAM-A (sc-25629, Santa Cruz, 1:100 dilution), MMP-9 (ab38898, Abcam, 1:100 dilution) overnight at 4°C. Cells were subsequently washed and incubated with secondary antibodies (goat anti-rabbit Alexa Fluor568, 1:500 dilution, and goat anti-mouse Alexa Fluor647, 1:500 dilution; Invitrogen) for 1 hour at room temperature. DAPI (0.5 μg/mL) was used to stain the nuclei. Prolong gold was added to preserve the fluorescent signal and to fix the slides. Pictures were analyzed with Imaris software.
Immunohistochemistry
Slides were created by transverse sectioning (4μm). The paraffin-embedded slides were deparaffinated with xylene and rehydrated through a series of ethanol concentrations. Endogenous peroxidase activity was blocked by incubating in 0.3% H2O2 in methanol at room temperature for half an hour, after which antigen retrieval was achieved by heating the slides in a citrate buffer, pH 6.0, for 20 minutes; followed by cooling in the same buffer for 20 minutes. The slides were incubated with a diluted primary antibody overnight at 4°C or for 1 hour at room temperature. Incubation with an undiluted secondary antibody (Brightvision Poly-HRP®) for 30 minutes followed. Rinsing between steps was performed with PBS. The slides were developed with diaminobenzidine and counterstained with Mayers’ hematoxylin. Hereafter, the slides were dehydrated and mounted with cover slips. The following primary antibodies were used: CD68 (333801, Biolegend,1:800 dilution, 1hr incubation), CD163 (321101, Biolegend, 1:400 dilution, 1hr incubation), Pancytokeratin (MA5-13156, Pierce Antibodies, 1:500 dilution, 1hr incubation), β-catenin (9582, Cell Signaling, 1:75 dilution, 1hr incubation), MMP-9 (ab38898, Abcam, 1:50 dilution, overnight at 4°C incubation). Positive and negative controls of these stainings are shown in Supplementary Figure 3.
Slides were digitized and analyzed via Aperio ImageScope or ImageJ/Fiji when appropriate. For the immunohistochemical stainings of CD68, CD163 and MMP9, ImageJ/Fiji was used to separate out the DAB staining using the Color Deconvolution application (Vector: H DAB was used; Examples of this are shown in Supplementary Figure 4. Then, the Auto Threshold plugin was applied to binarize all images. The Auto Threshold setting used was “Yen” from Yen et al. (1995) [71] and was applied to all images to keep the thresholding identical. The area percentage of these binarized areas was calculated by ImageJ/Fiji and used to quantify these stainings. The immunohistochemical staining of β-catenin was done by manually counting the total number of nuclei and the β-catenin positive nuclei.
FACS
The expression of a panel of cell surface markers was analyzed using a FACS Calibur (BD Biosciences, San Diego, USA). After harvesting the cells, antibody incubation steps were carried out at 4°C for 30 min in PBS + 1% BSA + 0.1% sodium azide + 1% rabbit serum. Dead cells were excluded using viability marker SYTOX (ThermoFisher). Antibodies used were CD68-FITC (EBM11, DAKO, Denmark), CD86-PE (Clone IT2.2, BD Biosciences), CD163-PERCP-CY5.5 (clone GHI/61, Biolegend, San Diego, USA), CD14 APC-AF750 (clone RMO52, Beckman Coulter, Brea, USA), CD206-PC-7 (clone 3.29B1.10, Beckman Coulter) and CD16-APC (clone 3G8, Life technologies, Frederick, USA).
For FACS-based cell cycle analysis, cells were incubated for 30 minutes with 1μM BrdU at 37°C. BrdU-positive cells were detected with an anti-BrdU-FITC antibody (BD Bioscience) according to the manufacturer’s protocol. For determination of DNA content 10μg/ml propidium iodide (PI) was added in the presence of 250 μg/ml RNase.
Colony forming assay
Harvested cells were made single cell via trypsinization, washed with PBS and were filtered through a 40-μm cell strainer. Cells were plated in Matrigel in a concentration of 100 GFP+ cells/well, Medium was refreshed twice a week. Two weeks after plating, GFP+-colonospheres were counted.
RT-qPCR
Total RNA was isolated according to the manufacturer's protocol (RNeasy Mini Kit, Qiagen) from colonosphere cell lines. cDNA was synthesized from 500 ng of total RNA using iScript cDNA Synthesis Kit (Bio-Rad Laboratories). Next, cDNA was diluted 20-fold and 5 μl was used for cDNA amplification. The amplification was performed in an iCyclerthermocycler (Bio-Rad Laboratories) using iQ SYBR Green Supermix (Bio-Rad Laboratories). Occludin primer sequence: Forward, 5′-AAGAAGCCTA-3′ and Reverse, 5′-TTGGAGCCATCC-3′. JAM-A Primer sequence: Forward, 5′-ACACCACCAGACTCGTTTGC-3′ and Reverse, 5′-GACCTTGACCTCCCCATAGC-3′, Housekeeping gene B2M: Forward, 5′-GAGGCTATCCAGCGTACTCCA-3′ and Reverse, 5′-CGGCAGGCATACTCATCTTTT-3′ mRNA expression levels were quantified using iCycler software (Bio-Rad Laboratories) and were normalized to B2M.
Statistical analysis
All statistical analyses were performed using SPSS 23.0 software (IBM SPSS, Chicago, IL, USA) or GraphPad Prism version 6.00 for Windows (GraphPad Software, San Diego California USA, www.graphpad.com). The Pearson chi-square test was used to compare differences in discrete or categorical data. Continuous data were tested for normality with d’Agostino &Pearson normality test. Normally-distributed data were analyzed with t-test or one-way ANOVA. If data would not have been normally distributed, analysis by means of the Mann–Whitney U test or Kruskal–Wallis test would have been performed. DFS and OS curves were generated using the Kaplan–Meier method; differences between survival curves were assessed by log rank test. A level of P <.05 was considered statistically significant.
ACKNOWLEDGMENTS AND GRANT SUPPORT
KT was supported by grants from the PON foundation and the Dirkzwager Assink Foundation. NF is supported by grants from the Alexandre Suerman Foundation and the Dutch Cancer Society (UU2014-6904). JMJ was supported by a grant from the Dutch Cancer Society (UU2013-5865) NK is supported by a grant from the Dutch Arthritis Foundation (LLP-22).
CONFLICTS OF INTEREST
The authors declare no conflicts of interest.
REFERENCES
1. Wada H, Shiozawa M, Katayama K, Okamoto N, Miyagi Y, Rino Y, Masuda M, Akaike M. Systematic review and meta-analysis of histopathological predictive factors for lymph node metastasis in T1 colorectal cancer. J Gastroenterol. 2015; 50:727-34. https://doi.org/10.1007/s00535-015-1057-0.
2. Beaton C, Twine CP, Williams GL, Radcliffe AG. Systematic review and meta-analysis of histopathological factors influencing the risk of lymph node metastasis in early colorectal cancer. Colorectal Dis. 2013; 15:788-97. https://doi.org/10.1111/codi.12129.
3. De Sousa EMF, Wang X, Jansen M, Fessler E, Trinh A, de Rooij LP, de Jong JH, de Boer OJ, van Leersum R, Bijlsma MF, Rodermond H, van der Heijden M, van Noesel CJ, et al. Poor-prognosis colon cancer is defined by a molecularly distinct subtype and develops from serrated precursor lesions. Nat Med. 2013; 19:614-8. https://doi.org/10.1038/nm.3174.
4. Marisa L, de Reynies A, Duval A, Selves J, Gaub MP, Vescovo L, Etienne-Grimaldi MC, Schiappa R, Guenot D, Ayadi M, Kirzin S, Chazal M, Flejou JF, et al. Gene expression classification of colon cancer into molecular subtypes: characterization, validation, and prognostic value. PLoS Med. 2013; 10:e1001453. https://doi.org/10.1371/journal.pmed.1001453.
5. Sadanandam A, Lyssiotis CA, Homicsko K, Collisson EA, Gibb WJ, Wullschleger S, Ostos LC, Lannon WA, Grotzinger C, Del Rio M, Lhermitte B, Olshen AB, Wiedenmann B, et al. A colorectal cancer classification system that associates cellular phenotype and responses to therapy. Nat Med. 2013; 19:619-25. https://doi.org/10.1038/nm.3175.
6. Roepman P, Schlicker A, Tabernero J, Majewski I, Tian S, Moreno V, Snel MH, Chresta CM, Rosenberg R, Nitsche U, Macarulla T, Capella G, Salazar R, et al. Colorectal cancer intrinsic subtypes predict chemotherapy benefit, deficient mismatch repair and epithelial-to-mesenchymal transition. Int J Cancer. 2014; 134:552-62. https://doi.org/10.1002/ijc.28387.
7. Schlicker A, Beran G, Chresta CM, McWalter G, Pritchard A, Weston S, Runswick S, Davenport S, Heathcote K, Castro DA, Orphanides G, French T, Wessels LF. Subtypes of primary colorectal tumors correlate with response to targeted treatment in colorectal cell lines. BMC Med Genomics. 2012; 5:66. https://doi.org/10.1186/1755-8794-5-66.
8. Budinska E, Popovici V, Tejpar S, D'Ario G, Lapique N, Sikora KO, Di Narzo AF, Yan P, Hodgson JG, Weinrich S, Bosman F, Roth A, Delorenzi M. Gene expression patterns unveil a new level of molecular heterogeneity in colorectal cancer. J Pathol. 2013; 231:63-76. https://doi.org/10.1002/path.4212.
9. Guinney J, Dienstmann R, Wang X, de Reynies A, Schlicker A, Soneson C, Marisa L, Roepman P, Nyamundanda G, Angelino P, Bot BM, Morris JS, Simon IM, et al. The consensus molecular subtypes of colorectal cancer. Nat Med. 2015; 21:1350-6. https://doi.org/10.1038/nm.3967.
10. Calon A, Lonardo E, Berenguer-Llergo A, Espinet E, Hernando-Momblona X, Iglesias M, Sevillano M, Palomo-Ponce S, Tauriello DV, Byrom D, Cortina C, Morral C, Barcelo C, et al. Stromal gene expression defines poor-prognosis subtypes in colorectal cancer. Nat Genet. 2015; 47:320-9. https://doi.org/10.1038/ng.3225.
11. Isella C, Terrasi A, Bellomo SE, Petti C, Galatola G, Muratore A, Mellano A, Senetta R, Cassenti A, Sonetto C, Inghirami G, Trusolino L, Fekete Z, et al. Stromal contribution to the colorectal cancer transcriptome. Nat Genet. 2015; 47:312-9. https://doi.org/10.1038/ng.3224.
12. Calon A, Espinet E, Palomo-Ponce S, Tauriello DV, Iglesias M, Cespedes MV, Sevillano M, Nadal C, Jung P, Zhang XH, Byrom D, Riera A, Rossell D, et al. Dependency of colorectal cancer on a TGF-beta-driven program in stromal cells for metastasis initiation. Cancer Cell. 2012; 22:571-84. https://doi.org/10.1016/j.ccr.2012.08.013.
13. Mantovani A, Allavena P, Sica A, Balkwill F. Cancer-related inflammation. Nature. 2008; 454:436-44. https://doi.org/10.1038/nature07205.
14. Balkwill F, Mantovani A. Inflammation and cancer: back to Virchow? Lancet. 2001; 357:539-45. https://doi.org/10.1016/S0140-6736(00)04046-0.
15. Becht E, de Reynies A, Giraldo NA, Pilati C, Buttard B, Lacroix L, Selves J, Sautes-Fridman C, Laurent-Puig P, Fridman WH. Immune and Stromal Classification of Colorectal Cancer Is Associated with Molecular Subtypes and Relevant for Precision Immunotherapy. Clin Cancer Res. 2016; 22:4057-66. https://doi.org/10.1158/1078-0432.CCR-15-2879.
16. Mlecnik B, Bindea G, Angell HK, Maby P, Angelova M, Tougeron D, Church SE, Lafontaine L, Fischer M, Fredriksen T, Sasso M, Bilocq AM, Kirilovsky A, et al. Integrative Analyses of Colorectal Cancer Show Immunoscore Is a Stronger Predictor of Patient Survival Than Microsatellite Instability. Immunity. 2016; 44:698-711. https://doi.org/10.1016/j.immuni.2016.02.025.
17. Galon J, Costes A, Sanchez-Cabo F, Kirilovsky A, Mlecnik B, Lagorce-Pages C, Tosolini M, Camus M, Berger A, Wind P, Zinzindohoue F, Bruneval P, Cugnenc PH, et al. Type, density, and location of immune cells within human colorectal tumors predict clinical outcome. Science. 2006; 313:1960-4. https://doi.org/10.1126/science.1129139.
18. Mlecnik B, Bindea G, Kirilovsky A, Angell HK, Obenauf AC, Tosolini M, Church SE, Maby P, Vasaturo A, Angelova M, Fredriksen T, Mauger S, Waldner M, et al. The tumor microenvironment and Immunoscore are critical determinants of dissemination to distant metastasis. Sci Transl Med. 2016; 8:327ra26. https://doi.org/10.1126/scitranslmed.aad6352.
19. Mantovani A, Bottazzi B, Colotta F, Sozzani S, Ruco L. The origin and function of tumor-associated macrophages. Immunol Today. 1992; 13:265-70. https://doi.org/10.1016/0167-5699(92)90008-U.
20. Liu Y, Cao X. The origin and function of tumor-associated macrophages. Cell Mol Immunol. 2015; 12:1-4. https://doi.org/10.1038/cmi.2014.83.
21. Goswami KK, Ghosh T, Ghosh S, Sarkar M, Bose A, Baral R. Tumor promoting role of anti-tumor macrophages in tumor microenvironment. Cell Immunol. 2017; 316:1–10. https://doi.org/10.1016/j.cellimm.2017.04.005.
22. Condeelis J, Pollard JW. Macrophages: obligate partners for tumor cell migration, invasion, and metastasis. Cell. 2006; 124:263-6. https://doi.org/10.1016/j.cell.2006.01.007.
23. Tang X, Mo C, Wang Y, Wei D, Xiao H. Anti-tumour strategies aiming to target tumour-associated macrophages. Immunology. 2013; 138:93-104. https://doi.org/10.1111/imm.12023.
24. Bindea G, Mlecnik B, Tosolini M, Kirilovsky A, Waldner M, Obenauf AC, Angell H, Fredriksen T, Lafontaine L, Berger A, Bruneval P, Fridman WH, Becker C, et al. Spatiotemporal dynamics of intratumoral immune cells reveal the immune landscape in human cancer. Immunity. 2013; 39:782-95. https://doi.org/10.1016/j.immuni.2013.10.003.
25. Forse CL, Rahimi M, Diamandis EP, Assarzadegan N, Dawson H, Grin A, Kennedy E, O'Connor B, Messenger DE, Riddell RH, Kirsch R, Karagiannis GS. HtrA3 stromal expression is correlated with tumor budding in stage II colorectal cancer. Exp Mol Pathol. 2017; 103:94-100. https://doi.org/10.1016/j.yexmp.2017.07.002.
26. Graham RP, Vierkant RA, Tillmans LS, Wang AH, Laird PW, Weisenberger DJ, Lynch CF, French AJ, Slager SL, Raissian Y, Garcia JJ, Kerr SE, Lee HE, et al. Tumor Budding in Colorectal Carcinoma: Confirmation of Prognostic Significance and Histologic Cutoff in a Population-based Cohort. Am J Surg Pathol. 2015; 39:1340-6. https://doi.org/10.1097/PAS.0000000000000504.
27. Koelzer VH, Assarzadegan N, Dawson H, Mitrovic B, Grin A, Messenger DE, Kirsch R, Riddell RH, Lugli A, Zlobec I. Cytokeratin-based assessment of tumour budding in colorectal cancer: analysis in stage II patients and prospective diagnostic experience. J Pathol Clin Res. 2017; 3:171-8. https://doi.org/10.1002/cjp2.73.
28. Lugli A, Kirsch R, Ajioka Y, Bosman F, Cathomas G, Dawson H, El Zimaity H, Flejou JF, Hansen TP, Hartmann A, Kakar S, Langner C, Nagtegaal I, et al. Recommendations for reporting tumor budding in colorectal cancer based on the International Tumor Budding Consensus Conference (ITBCC) 2016. Mod Pathol. 2017; 30:1299-311. https://doi.org/10.1038/modpathol.2017.46.
29. Zlobec I, Lugli A. Epithelial mesenchymal transition and tumor budding in aggressive colorectal cancer: tumor budding as oncotarget. Oncotarget. 2010; 1:651-61. https://doi.org/10.18632/oncotarget.199.
30. Vellinga TT, den Uil S, Rinkes IH, Marvin D, Ponsioen B, Alvarez-Varela A, Fatrai S, Scheele C, Zwijnenburg DA, Snippert H, Vermeulen L, Medema JP, Stockmann HB, et al. Collagen-rich stroma in aggressive colon tumors induces mesenchymal gene expression and tumor cell invasion. Oncogene. 2016; 35:5263-71. https://doi.org/10.1038/onc.2016.60.
31. Yoshihara K, Shahmoradgoli M, Martinez E, Vegesna R, Kim H, Torres-Garcia W, Trevino V, Shen H, Laird PW, Levine DA, Carter SL, Getz G, Stemke-Hale K, et al. Inferring tumour purity and stromal and immune cell admixture from expression data. Nat Commun. 2013; 4:2612. https://doi.org/10.1038/ncomms3612.
32. Snoeren N, van Hooff SR, Adam R, van Hillegersberg R, Voest EE, Guettier C, van Diest PJ, Nijkamp MW, Brok MO, van Leenen D, Koerkamp MJ, Holstege FC, Rinkes IH. Exploring gene expression signatures for predicting disease free survival after resection of colorectal cancer liver metastases. PLoS One. 2012; 7:e49442. https://doi.org/10.1371/journal.pone.0049442.
33. Emmink BL, Van Houdt WJ, Vries RG, Hoogwater FJ, Govaert KM, Verheem A, Nijkamp MW, Steller EJ, Jimenez CR, Clevers H, Borel Rinkes IH, Kranenburg O. Differentiated human colorectal cancer cells protect tumor-initiating cells from irinotecan. Gastroenterology. 2011; 141:269-78. https://doi.org/10.1053/j.gastro.2011.03.052.
34. Vermeulen L, Todaro M, de Sousa Mello F, Sprick MR, Kemper K, Perez Alea M, Richel DJ, Stassi G, Medema JP. Single-cell cloning of colon cancer stem cells reveals a multi-lineage differentiation capacity. Proc Natl Acad Sci U S A. 2008; 105:13427-32. https://doi.org/10.1073/pnas.0805706105.
35. Bandapalli OR, Dihlmann S, Helwa R, Macher-Goeppinger S, Weitz J, Schirmacher P, Brand K. Transcriptional activation of the beta-catenin gene at the invasion front of colorectal liver metastases. J Pathol. 2009; 218:370-9. https://doi.org/10.1002/path.2539.
36. Demir R, Dimmler A, Naschberger E, Demir I, Papadopoulos T, Melling N, Sturzl M, Hohenberger W. Malignant progression of invasive tumour cells seen in hypoxia present an accumulation of beta-catenin in the nucleus at the tumour front. Exp Mol Pathol. 2009; 87:109-16. https://doi.org/10.1016/j.yexmp.2009.05.004.
37. Bonnans C, Chou J, Werb Z. Remodelling the extracellular matrix in development and disease. Nat Rev Mol Cell Biol. 2014; 15:786-801. https://doi.org/10.1038/nrm3904.
38. Low JA, Johnson MD, Bone EA, Dickson RB. The matrix metalloproteinase inhibitor batimastat (BB-94) retards human breast cancer solid tumor growth but not ascites formation in nude mice. Clin Cancer Res. 1996; 2:1207-14.
39. Feuerhake F, Kutok JL, Monti S, Chen W, LaCasce AS, Cattoretti G, Kurtin P, Pinkus GS, de Leval L, Harris NL, Savage KJ, Neuberg D, Habermann TM, et al. NFkappaB activity, function, and target-gene signatures in primary mediastinal large B-cell lymphoma and diffuse large B-cell lymphoma subtypes. Blood. 2005; 106:1392-9. https://doi.org/10.1182/blood-2004-12-4901.
40. Myant KB, Cammareri P, McGhee EJ, Ridgway RA, Huels DJ, Cordero JB, Schwitalla S, Kalna G, Ogg EL, Athineos D, Timpson P, Vidal M, Murray GI, et al. ROS production and NF-kappaB activation triggered by RAC1 facilitate WNT-driven intestinal stem cell proliferation and colorectal cancer initiation. Cell Stem Cell. 2013; 12:761-73. https://doi.org/10.1016/j.stem.2013.04.006.
41. Horst D, Budczies J, Brabletz T, Kirchner T, Hlubek F. Invasion associated up-regulation of nuclear factor kappaB target genes in colorectal cancer. Cancer. 2009; 115:4946-58. https://doi.org/10.1002/cncr.24564.
42. Wu Y, Deng J, Rychahou PG, Qiu S, Evers BM, Zhou BP. Stabilization of snail by NF-kappaB is required for inflammation-induced cell migration and invasion. Cancer Cell. 2009; 15:416-28. https://doi.org/10.1016/j.ccr.2009.03.016.
43. Hahn-Stromberg V, Edvardsson H, Bodin L, Franzen L. Tumor volume of colon carcinoma is related to the invasive pattern but not to the expression of cell adhesion proteins. APMIS. 2009; 117:205-11. https://doi.org/10.1111/j.1600-0463.2008.00011.x.
44. Resnick MB, Konkin T, Routhier J, Sabo E, Pricolo VE. Claudin-1 is a strong prognostic indicator in stage II colonic cancer: a tissue microarray study. Mod Pathol. 2005; 18:511-8. https://doi.org/10.1038/modpathol.3800301.
45. De Smedt L, Palmans S, Sagaert X. Tumour budding in colorectal cancer: what do we know and what can we do? Virchows Arch. 2016; 468:397-408. https://doi.org/10.1007/s00428-015-1886-5.
46. Lee M, Vasioukhin V. Cell polarity and cancer—cell and tissue polarity as a non-canonical tumor suppressor. J Cell Sci. 2008; 121:1141-50. https://doi.org/10.1242/jcs.016634.
47. Osanai M, Murata M, Nishikiori N, Chiba H, Kojima T, Sawada N. Epigenetic silencing of occludin promotes tumorigenic and metastatic properties of cancer cells via modulations of unique sets of apoptosis-associated genes. Cancer Res. 2006; 66:9125-33. https://doi.org/10.1158/0008-5472.CAN-06-1864.
48. Zhang Y, Sime W, Juhas M, Sjolander A. Crosstalk between colon cancer cells and macrophages via inflammatory mediators and CD47 promotes tumour cell migration. Eur J Cancer. 2013; 49:3320-34. https://doi.org/10.1016/j.ejca.2013.06.005.
49. Solinas G, Schiarea S, Liguori M, Fabbri M, Pesce S, Zammataro L, Pasqualini F, Nebuloni M, Chiabrando C, Mantovani A, Allavena P. Tumor-conditioned macrophages secrete migration-stimulating factor: a new marker for M2-polarization, influencing tumor cell motility. J Immunol. 2010; 185:642-52. https://doi.org/10.4049/jimmunol.1000413.
50. Kurokawa S, Arimura Y, Yamamoto H, Adachi Y, Endo T, Sato T, Suga T, Hosokawa M, Shinomura Y, Imai K. Tumour matrilysin expression predicts metastatic potential of stage I (pT1) colon and rectal cancers. Gut. 2005; 54:1751-8. https://doi.org/10.1136/gut.2005.071035.
51. Lischper M, Beuck S, Thanabalasundaram G, Pieper C, Galla HJ. Metalloproteinase mediated occludin cleavage in the cerebral microcapillary endothelium under pathological conditions. Brain Res. 2010; 1326:114-27. https://doi.org/10.1016/j.brainres.2010.02.054.
52. Pflugfelder SC, Farley W, Luo L, Chen LZ, de Paiva CS, Olmos LC, Li DQ, Fini ME. Matrix metalloproteinase-9 knockout confers resistance to corneal epithelial barrier disruption in experimental dry eye. Am J Pathol. 2005; 166:61-71. https://doi.org/10.1016/S0002-9440(10)62232-8.
53. Remy L, Trespeuch C, Bachy S, Scoazec JY, Rousselle P. Matrilysin 1 influences colon carcinoma cell migration by cleavage of the laminin-5 beta3 chain. Cancer Res. 2006; 66:11228-37. https://doi.org/10.1158/0008-5472.CAN-06-1187.
54. Yamamoto K, Miyazaki K, Higashi S. Cholesterol sulfate alters substrate preference of matrix metalloproteinase-7 and promotes degradations of pericellular laminin-332 and fibronectin. J Biol Chem. 2010; 285:28862-73. https://doi.org/10.1074/jbc.M110.136994.
55. Giannandrea M, Parks WC. Diverse functions of matrix metalloproteinases during fibrosis. Dis Model Mech. 2014; 7:193-203. https://doi.org/10.1242/dmm.012062.
56. Li CY, Yuan P, Lin SS, Song CF, Guan WY, Yuan L, Lai RB, Gao Y, Wang Y. Matrix metalloproteinase 9 expression and prognosis in colorectal cancer: a meta-analysis. Tumour Biol. 2013; 34:735-41. https://doi.org/10.1007/s13277-012-0601-2.
57. Sun DW, Zhang YY, Qi Y, Zhou XT, Lv GY. Prognostic significance of MMP-7 expression in colorectal cancer: a meta-analysis. Cancer Epidemiol. 2015; 39:135-42. https://doi.org/10.1016/j.canep.2015.01.009.
58. Overall CM, Lopez-Otin C. Strategies for MMP inhibition in cancer: innovations for the post-trial era. Nat Rev Cancer. 2002; 2:657-72. https://doi.org/10.1038/nrc884.
59. Fields GB. New strategies for targeting matrix metalloproteinases. Matrix Biol. 2015; 44-46:239-46. https://doi.org/10.1016/j.matbio.2015.01.002.
60. Guan PP, Yu X, Guo JJ, Wang Y, Wang T, Li JY, Konstantopoulos K, Wang ZY, Wang P. By activating matrix metalloproteinase-7, shear stress promotes chondrosarcoma cell motility, invasion and lung colonization. Oncotarget. 2015; 6:9140-59. https://doi.org/10.18632/oncotarget.3274.
61. Zhu L, Li X, Chen Y, Fang J, Ge Z. High-mobility group box 1: a novel inducer of the epithelial-mesenchymal transition in colorectal carcinoma. Cancer Lett. 2015; 357:527-34. https://doi.org/10.1016/j.canlet.2014.12.012.
62. St-Pierre Y, Couillard J, Van Themsche C. Regulation of MMP-9 gene expression for the development of novel molecular targets against cancer and inflammatory diseases. Expert Opin Ther Targets. 2004; 8:473-89. https://doi.org/10.1517/14728222.8.5.473.
63. Wang D, Fu L, Sun H, Guo L, DuBois RN. Prostaglandin E2 Promotes Colorectal Cancer Stem Cell Expansion and Metastasis in Mice. Gastroenterology. 2015; 149:1884-95 e4. https://doi.org/10.1053/j.gastro.2015.07.064.
64. Fernandez-Majada V, Aguilera C, Villanueva A, Vilardell F, Robert-Moreno A, Aytes A, Real FX, Capella G, Mayo MW, Espinosa L, Bigas A. Nuclear IKK activity leads to dysregulated notch-dependent gene expression in colorectal cancer. Proc Natl Acad Sci U S A. 2007; 104:276-81. https://doi.org/10.1073/pnas.0606476104.
65. Sakamoto K, Maeda S, Hikiba Y, Nakagawa H, Hayakawa Y, Shibata W, Yanai A, Ogura K, Omata M. Constitutive NF-kappaB activation in colorectal carcinoma plays a key role in angiogenesis, promoting tumor growth. Clin Cancer Res. 2009; 15:2248-58. https://doi.org/10.1158/1078-0432.CCR-08-1383.
66. Patras L, Sesarman A, Licarete E, Luca L, Alupei MC, Rakosy-Tican E, Banciu M. Dual role of macrophages in the response of C26 colon carcinoma cells to 5-fluorouracil administration. Oncol Lett. 2016; 12:1183-91. https://doi.org/10.3892/ol.2016.4708.
67. Ryan AE, Colleran A, O'Gorman A, O'Flynn L, Pindjacova J, Lohan P, O'Malley G, Nosov M, Mureau C, Egan LJ. Targeting colon cancer cell NF-kappaB promotes an anti-tumour M1-like macrophage phenotype and inhibits peritoneal metastasis. Oncogene. 2015; 34:1563-74. https://doi.org/10.1038/onc.2014.86.
68. Pyonteck SM, Akkari L, Schuhmacher AJ, Bowman RL, Sevenich L, Quail DF, Olson OC, Quick ML, Huse JT, Teijeiro V, Setty M, Leslie CS, Oei Y, et al. CSF-1R inhibition alters macrophage polarization and blocks glioma progression. Nat Med. 2013; 19:1264-72. https://doi.org/10.1038/nm.3337.
69. Repnik U, Knezevic M, Jeras M. Simple and cost-effective isolation of monocytes from buffy coats. J Immunol Methods. 2003; 278:283-92.
70. Huang LK, Wang MJ. Image thresholding by minimizing the measure of fuzziness. Pattern Recognit. 1995; 28:41–51.
71. Yen JC, Chang FJ, Chang S. A new criterion for automatic multilevel thresholding. IEEE Trans Image Process. 1995; 4:370-8. https://doi.org/10.1109/83.366472.