
INTRODUCTION
Prostate cancer (PCa) is the most common non-cutaneous cancer among men worldwide and a leading cause of cancer-related death in the United States and in Europe [1]. An estimated 180,890 men were diagnosed with PCa in the United States in 2016, and nearly 26,120 men died from it [1]. The diagnostic use of prostate-specific antigen (PSA) has resulted in early diagnosis, and has substantially increased the number of new PCa cases. However, there is no consensus regarding whether PSA screening effectively reduces the risk of death from the disease. The poor association between disease state and PSA levels sometimes leads to needless diagnoses and overtreatment of indolent PCa [2]. Because of the molecular heterogeneity of PCa [3], identification and testing of molecular markers may be a rational approach to expedite PCa diagnosis, prognosis, and treatment. Apart from proteins and messenger RNAs (mRNAs), which have shown utility in several clinical scenarios, there is growing interest regarding the utility of microRNAs (miRNAs) as PCa biomarkers. miRNAs are a group of small (<22 nt) noncoding RNAs that regulate gene expression post-transcriptionally by targeting their corresponding mRNAs. These miRNAs can be isolated from a variety of biological samples [4, 5]. Additionally, circulating cell-free miRNAs are extremely resistant to ribonucleases, extreme pH conditions, and freeze-thawing because of their packaging in microvesicles or exosomes [6].
Exosomes are an intriguing class of nano-sized (30–150 nm in diameter) extracellular vesicles secreted by cells for intercellular communication. Most cell types, including cancer cells, secrete exosomes in body fluids, including blood, urine, semen, milk and saliva. They carry a wealth of information about disease characteristics in their unique cargo proteins, lipids, nucleic acids, and metabolites [7] which are unique to specific diseases and types of cells [8]. Biomarker mining from exosomes has emerged as an attractive opportunity mainly because various components are well protected within the lipid bilayer and preserved for longer duration without any significant loss of information [9]. Furthermore, compared to complex plasma samples, exosomes provide a much cleaner clinical sample, thus easing analyses [7]. Hence, analysis of exosomes is an avenue for developing novel protein and nucleotide biomarkers for cancer diagnosis and prognosis. For example, McKiernan et al. identified a noninvasive 3-gene expression assay in urinary exosomes that can discriminate clinically relevant Gleason-grade 7 diseases from low-grade (Gleason-grade 6) PCa [10]. This is a huge advancement as currently overdiagnosis and unnecessary PCa treatment are immense clinical problems.
The tumor microenvironment plays a crucial role in tumor growth, angiogenesis, epithelial-to-mesenchymal transition (EMT) and metastasis [11]. Intercellular communication between tumor and tumor microenvironment components is mediated by paracrine signaling involving growth factors, chemokines, and proteinases [11–13]. Recent reports have suggested the contribution of exosomes and microvesicles in intercellular communication in the local tumor microenvironment and in preparation of pre-metastatic niches in secondary organs [14, 15]. Hypoxia (low oxygen conditions) in prostate tumors is associated with an aggressive phenotype and poor prognosis [16] and induces genetic and proteomic changes in cancer cells by selecting for clones with enhanced invasiveness, drug resistance, and stemness [17]. Therefore, a non-invasive biomarker to assess hypoxia status in PCa is warranted to better understand the pathogenesis of PCa.
Recently, we reported that exosomes secreted by PCa cells under hypoxic conditions (ExoHypoxic) promote motility, invasiveness and stemness of naive PCa cells and promote cancer-associated fibroblasts (CAF)-type phenotype in prostate fibroblasts [18]. We also identified that ExoHypoxic are loaded with higher amount and number of proteins. We then identified the lipid signature in hypoxic PCa cells and their ExoHypoxic, which may serve as a biomarker to assess the aggressiveness of malignant tumors [19]. In the present investigation, we aimed to profile the exosomal miRNAs in PCa cells (LNCaP) both under hypoxic and normoxic conditions. This study identified a unique set of miRNAs loaded in hypoxic PCa exosomes that could contribute to enhanced invasiveness, stemness, and microenvironmental changes [18, 19] and might be of clinical use as non-invasive blood-based biomarkers to assess hypoxia in primary tumors.
RESULTS
Expression profile of miRNA in ExoNormoxic and ExoHypoxic secreted by PCa cells.
Exosomes were isolated from human PCa LNCaP cells cultured under hypoxic (1% O2, ExoHypoxic) and normoxic (~21% O2, ExoNormoxic) conditions. Thereafter, miRNAs were isolated from ExoNormoxic and ExoHypoxic and profiled by TaqMan® Array MicroRNA Cards with a pre-amplification kit. Out of a total of 384 unique miRNAs, 292 were loaded in both ExoHypoxic and ExoNormoxic (Supplementary Table 1); the remaining 92 miRNAs has fewer than 2 successful measurements in at least 1 condition. Approximately 56 of the 92 miRNAs were not detected in any samples. The top 20 miRNAs significantly up- or down-regulated in ExoHypoxic compared to ExoNormoxic are listed in Table 1. Nine miRNAs were expressed at a significantly lower level in ExoHypoxic compared to ExoNormoxic: miR-521 (Fold change = 0.0005), miR-27a (Fold change = 0.24), miR-324 (Fold change = 0.446), miR-579 (Fold change = 0.448), miR-502 (Fold change = 0.396), miR-222 (Fold change = 0.232), miR-135b (Fold change = 0.325), miR-146a (Fold change = 0.456) and miR-491(Fold change = 0.482). On the other hand, 11 miRNAs were significantly higher in ExoHypoxic compared to ExoNormoxic: miR-517a (Fold change = 7.18), miR-204 (Fold change = 6.62), miR-885 (Fold change = 2.62), miR-143 (Fold change = 2.55), miR-335 (Fold change = 2.06), miR-127 (Fold change = 2.49), miR-542 (Fold change = 4.32), miR-433 (Fold change = 3.13), miR-451 (Fold change = 1.87), miR-92a (Fold change = 1.65) and miR-181a (Fold change = 1.51).
Table 1: miRNAs Significantly Up- and Downregulated in ExoNormoxic versus ExoHypoxic
Sl No |
Target Name |
Normoxia range |
Hypoxia range |
p Value |
Fold Change |
Change under hypoxia |
|---|---|---|---|---|---|---|
1 |
hsa-miR-521-001122 |
0.3820 |
0.4270 |
0.0007 |
0.0005 |
DOWN |
2 |
hsa-miR-27a-000408 |
0.8950 |
0.9850 |
0.0066 |
0.2468 |
DOWN |
3 |
hsa-miR-324-3p-002161 |
0.7490 |
0.4330 |
0.0104 |
0.4462 |
DOWN |
4 |
hsa-miR-579-002398 |
0.6610 |
0.8510 |
0.0215 |
0.4485 |
DOWN |
5 |
hsa-miR-502-001109 |
0.6150 |
1.0410 |
0.0225 |
0.3963 |
DOWN |
6 |
hsa-miR-222-002276 |
1.5440 |
1.4600 |
0.0304 |
0.2325 |
DOWN |
7 |
hsa-miR-135b-002261 |
1.4240 |
0.8850 |
0.0395 |
0.3259 |
DOWN |
8 |
hsa-miR-146a-000468 |
0.9840 |
0.8200 |
0.0401 |
0.4562 |
DOWN |
9 |
hsa-miR-491-5p-001630 |
1.1460 |
0.5680 |
0.0484 |
0.4822 |
DOWN |
10 |
hsa-miR-517a-002402 |
1.2900 |
1.7650 |
0.0124 |
7.1834 |
UP |
11 |
hsa-miR-204-000508 |
1.0390 |
2.0000 |
0.0484 |
6.6246 |
UP |
12 |
hsa-miR-885-5p-002296 |
1.1280 |
0.4070 |
0.0159 |
2.6250 |
UP |
13 |
hsa-miR-143-002249 |
0.3210 |
1.0210 |
0.0182 |
2.5568 |
UP |
14 |
hsa-miR-335-000546 |
0.8500 |
0.4390 |
0.0210 |
2.0634 |
UP |
15 |
hsa-miR-127-000452 |
0.6730 |
1.0910 |
0.0316 |
2.4932 |
UP |
16 |
hsa-miR-542-5p-002240 |
0.2180 |
0.8120 |
0.0374 |
4.3229 |
UP |
17 |
hsa-miR-433-001028 |
1.4870 |
1.1720 |
0.0411 |
3.1383 |
UP |
18 |
hsa-miR-451-001141 |
0.3140 |
0.3020 |
0.0030 |
1.8738 |
UP |
19 |
hsa-miR-92a-000431 |
0.5130 |
0.4160 |
0.0191 |
1.6548 |
UP |
20 |
hsa-miR-181a-000480 |
0.2140 |
0.5160 |
0.0275 |
1.5161 |
UP |
Ingenuity pathway analysis (IPA) and prediction of miRNA targets
To identify possible functions of expressed miRNAs in ExoNormoxic and ExoHypoxic, we predicted miRNA targets using the microRNA Target Filter function in IPA software. All 20 significantly modulated miRNAs in ExoNormoxic and ExoHypoxic were analyzed for target mRNA identification. Among these, 15 miRNAs (miR-143, miR-146a, miR-181a, miR-204, miR-222, miR-27a, miR-335, miR-433, miR-491, miR-502, miR-521, miR-92a, miR-127, miR-135b and miR-451) target 211 mRNAs when the confidence limit was set as “Experimentally Observed” only. The miRNA-mRNA pairs and source are listed in Table 2.
Table 2: Target mRNAs regulated by corresponding miRNAs, analyzed by IPA
ID |
Source |
Targeted mRNA (Symbol) |
|---|---|---|
hsa-miR-127 |
TarBase, miRecords |
BCL6, PRDM, RTL1, XBP1 |
hsa-miR-135b |
Ingenuity Expert Findings, TargetScan Human, miRecords |
ALOX5AP, APC, HTR1A, JAK2, RUNX2, SLC6A4, SMAD5, TRPS1 |
hsa-miR-143 |
Ingenuity Expert, Findings, TarBase, TargetScan Human, miRecords |
BCL2, DNMT3A, FNDC3B, IGFBP5, KRAS, MAPK12, MAPK7, MDM2, PLK1, PRC1, TOP2A |
hsa-miR-146a |
Ingenuity Expert Findings,TargetScan Human,miRecords |
ATOH8, BLMH, BRCA1, C8A, CAMP, CCL8, CCNA2, CCR3, CD1D, CD40, CDKN3, CFH, CHUK, COL13A1, CRP, CXCL8, CXCR4, DMBT1, FADD, IFNA1/IFNA13, IFNB1, IL10, IL12RB2, IL1F10, IL1R1, IL1RAP, IL1RAPL2, IL1RL2, IL36A, IL36B, IL36G, IL36RN, IL37, IRAK1, IRAK2, IRF5, KIF22, LALBA, LBP, LTB, LTF, MCM10, MCPH1, METTL7A, MMP16, MR1, NFIX, NLGN1, NOS2, NOVA1, PA2G4, PBLD, PDIK1L, PEX11G, PGLYRP1, PGLYRP2, PLEKHA4, POLE2, PRR15, PTAFR, PTGES2, RAD54L, S100A12, SDCBP2, SFTPD, STAT1, SYT1, TIMELESS, TLR1, TLR10, TLR4, TLR9, TMSB15A, TRAF6, TRIM14, UHRF1, VWCE |
hsa-miR-181a |
Ingenuity Expert Findings,TarBase,TargetScan Human,miRecords |
AICDA, BCL2, CD69, CDKN1B, CDX2, ESR1, GATA6, GRIA2, HOXA11, KRAS, NLK, NOTCH4, PLAG1, TCL1A, TIMP3, TRA, VSNL1 |
hsa-miR-204 |
Ingenuity Expert Findings,TargetScan Human, miRecords |
ARPC1B, ATP2B1, AURKB, BMP1, CDC25B, CDH11, CTSC, EFNB1, ERF, FBN2, HMGA2, HOXB7, ITGB4, MMP3, MMP9, SHC1, SOX4, SPARC, SPDEF, TRPS1 |
hsa-miR-222 |
Ingenuity Expert Findings,TarBase,TargetScan Human,miRecords |
BBC3, BCL2L11, BMF, BNIP3L, CDKN1B, CDKN1C, DDIT4, DIRAS3, ESR1, FOS, FOXO3, ICAM1, KIT, MMP1, PIK3R1, PPP2R2A, PTEN, PTPRM, SOD2, TBK1, TIMP3 |
hsa-miR-27a |
Ingenuity Expert Findings,TargetScan Human,miRecords, TarBase |
ADORA2B, BAX, BBC3, CTNNBIP1, CYP1B1, FADD, FBXW7, FOXO1, GCA, GRB2, IFI16, IGF1, MEF2C, MMP13, NOTCH1, ODC1, PDPK1, PEX7, PHB, PKMYT1, PMAIP1, PPARG, PXN, RUNX1, RXRA, SMAD3, SMAD4, SMAD5, SRM, ST14, THRB, WEE1, ZBTB10 |
hsa-miR-335 |
Ingenuity Expert Findings,TargetScan Human |
KIT, PTPN11, PXN, RASA1, SRF |
hsa-miR-433 |
TarBase, miRecords |
FGF20, HDAC6, RTL1 |
hsa-miR-451 |
Ingenuity Expert Findings, TargetScan Human, miRecords |
ABCB1, AKTIP, FBXO33, MIF |
hsa-miR-491-5p |
Ingenuity Expert Findings,TargetScan Human |
BCL2L1, GIT1 |
hsa-miR-502 |
TargetScan Human, miRecords |
KMT5A |
hsa-miR-521 |
Ingenuity Expert Findings |
ERCC8 |
hsa-miR-92a |
Ingenuity Expert Findings,TargetScan Human,miRecords |
BCL2L11, BMPR2, CCNE2, CDKN1A, CDKN1C, ENPP6, FBXW7, HIPK3, IKZF1, ITGA5, ITGB3, MAP2K4, MAPRE1, MYLIP, OSBPL2, OSBPL8, PCGF1, PTEN, RFFL, VSNL1, ZEB2, |
Next, we performed core analysis of the above 211 mRNAs using IPA software to predict involvement of different pathways. Target mRNAs were grouped into top canonical pathways, diseases and Biological functions (e.g. Diseases and disorders, Molecular and cellular functions, Physiological system development and functions) and Toxicologic functions (e.g. Assays: Clinical chemistry and hematology, Cardiotoxicity, Hepatotoxicity and Nephrotoxicity). Results are summarized in Table 3. The canonical pathways (with –log (p-value) more than 15) are depicted in Figure 1. The top five canonical pathways for genes that are targets of differentially expressed microRNAs were IL-6 signaling (p value: 6.46E-28), Role of Osteoblasts, Osteoclasts and Chondrocytes in Rheumatoid Arthritis (p value: 1.22E-26), Role of Macrophages, Fibroblasts and Endothelial Cells in Rheumatoid Arthritis (p value: 4.48E-26), Molecular Mechanisms of Cancer (p value: 3.75E-24), and Acute Phase Response Signaling (p value: 7.59E-21).
Table 3: Analysis of 211 target mRNAs by ingenuity pathway analysis
Molecular and Cellular Functions |
p-value |
|---|---|
Cellular Movement |
5.12E-13–3.33E-49 |
Cell Death and Survival |
5.91E-13–3.60E-49 |
Cellular Development |
1.06E-13–1.07E-48 |
Cellular Growth and Proliferation |
9.86E-14–1.56E-44 |
Cell-To-Cell Signaling and Interaction |
5.92E-13–2.43E-38 |
Diseases and Disorders |
p-value |
Inflammatory Response |
6.90E-13–9.60E-39 |
Cancer |
6.83E-13–1.73E-34 |
Organismal Injury and Abnormalities |
7.48E-13–1.73E-34 |
Connective Tissue Disorders |
4.78E-14–1.60E-29 |
Inflammatory Disease |
6.87E-14–1.60E-29 |
Physiological System Development and Function |
p-value |
Organismal Survival |
9.57E-42–3.36E-47 |
Hematological System Development and Function |
6.90E-13–3.62E-41 |
Tissue Morphology |
6.90E-13–3.62E-41 |
Immune Cell Trafficking |
3.61E-13–1.27E-38 |
Hematopoiesis |
1.06E-13–2.83E-35 |
Top Canonical Pathways |
p-value |
IL-6 Signaling |
6.46E-28 |
Role of Osteoblasts, Osteoclasts and Chondrocytes in Rheumatoid Arthritis |
1.22E-26 |
Role of Macrophages, Fibroblasts and Endothelial Cells in Rheumatoid Arthritis |
4.48E-26 |
Molecular Mechanisms of Cancer |
3.75E-24 |
Acute Phase Response Signaling |
7.59E-21 |
Top Tox Functions: Assays-Clinical Chemistry and Hematology |
p-value |
Increased Levels of Alkaline Phosphatase |
3.45E-08–3.45E-08 |
Increased Levels of Red Blood Cells |
8.43E-06–8.43E-06 |
Increased Levels of ALT |
5.90E-02–4.28E-05 |
Increased Levels of Creatinine |
4.89E-05–4.89E-05 |
Increased Levels of AST |
9.73E-03–9.73E-03 |
Top Tox Functions: Cardiotoxicity |
p-value |
Cardiac Necrosis/Cell Death |
2.05E-03–7.99E-15 |
Cardiac Hypertrophy |
5.78E-02–1.76E-14 |
Heart Failure |
2.99E-01–1.23E-08 |
Cardiac Infarction |
3.97E-02–1.32E-08 |
Congenital Heart Anomaly |
8.71E-02–3.74E-08 |
Top Tox Functions: Hepatotoxicity |
p-value |
Liver Necrosis/Cell Death |
1.67E-01–2.68E-27 |
Hepatocellular Carcinoma |
1.14E-01–3.69E-12 |
Liver Hyperplasia/Hyperproliferation |
1.32E-01–3.69E-12 |
Liver Damage |
6.85E-02–1.26E-11 |
Liver Proliferation |
1.67E-01–6.30E-11 |
Top Tox Functions: Nephrotoxicity |
p-value |
Renal Inflammation |
5.00E-01–1.65E-12 |
Renal Nephritis |
5.00E-01–1.65E-12 |
Renal Necrosis/Cell Death |
2.00E-01–1.57E-11 |
Renal Proliferation |
5.90E-02–9.32E-07 |
Glomerular Injury |
1.14E-01–1.82E-06 |
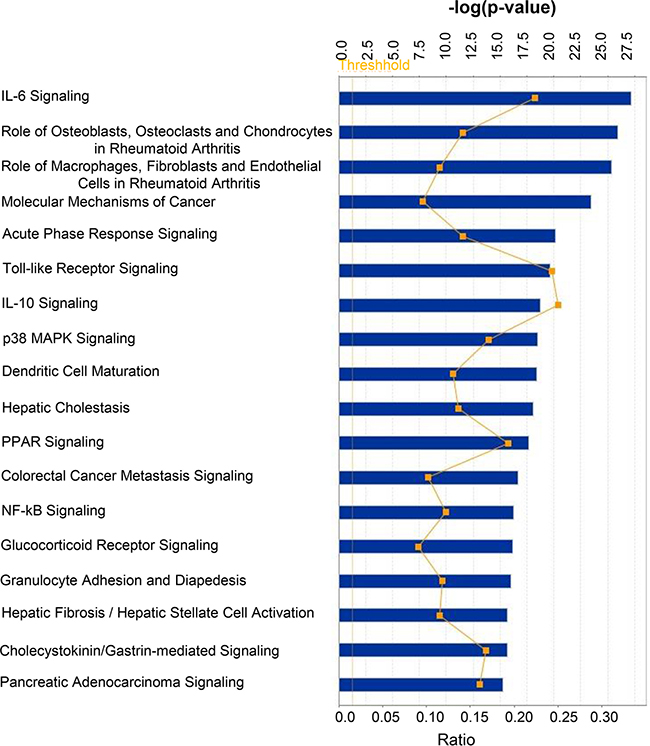
Figure 1: Top canonical pathways targeted by mRNAs whose expression is regulated by miRNAs differentially loaded in ExoHypoxic from human PCa LNCaP cells. Data were analyzed by IPA; pathways having –log (p-value) more than 15 are presented with threshold value 0.5. Fisher’s exact test was used to calculate a P-value determining the probability of the association between the genes and the dataset in the canonical pathways.
The top five Molecular and Cellular Functions were Cellular Movement (p value: 5.12E-13–3.33E-49), Cell Death and Survival (p value: 5.91E-13–3.60E-49), Cellular Development (p value: 1.06E-13–1.07E-48), Cellular Growth and Proliferation (p value: 9.86E-14–1.56E-44), and Cell-To-Cell Signaling and Interaction (p value: 5.92E-13–2.43E-38) (Figure 2A). The top five Diseases and Disorders were Inflammatory Response (p value: 6.90E-13–9.60E-39), Cancer (p value: 6.83E-13–1.73E-34), Organismal Injury and Abnormalities (p value: 7.48E-13–1.73E-34), Connective Tissue Disorders (p value: 4.78E-14–1.60E-29), and Inflammatory Disease (p value: 6.87E-14–1.60E-29) (Figure 2B). The top five Physiological system development and functions included Organismal Survival (p value: 9.57E-42–3.36E-47), Hematological System Development and Function (p value: 6.90E-13–3.62E-41), Tissue Morphology (p value: 6.90E-13–3.62E-41), Immune Cell Trafficking (p value: 3.61E-13–1.27E-38), and Hematopoiesis (p value: 1.06E-13–2.83E-35) (Figure 2C).
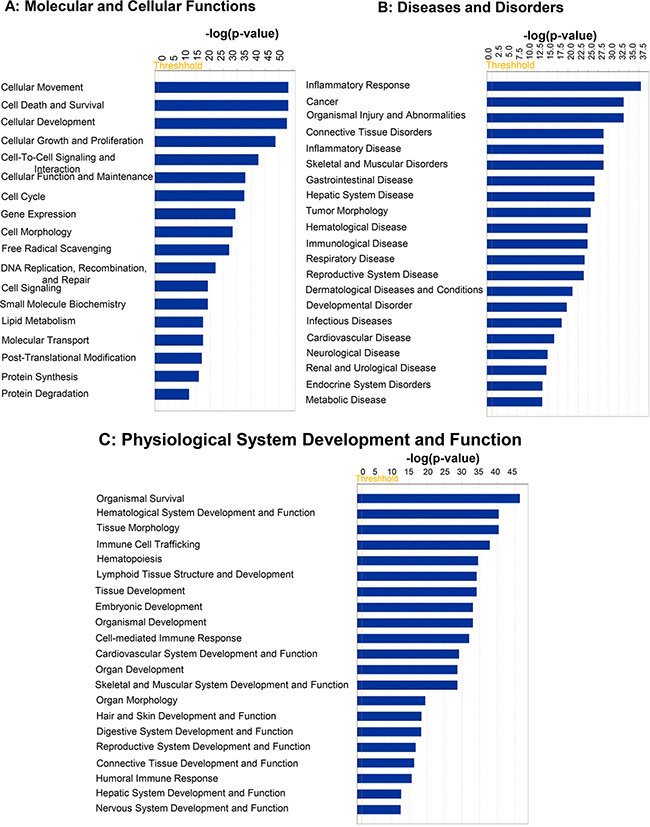
Figure 2: Top predicted “Disease and Bio functions” targeted by mRNAs whose expression is regulated by miRNAs differentially loaded in ExoHypoxic from human PCa LNCaP cells. Data were analyzed by IPA. Top (A) ‘Molecular and Cellular Functions’; (B) ‘Disease and Disorders’; and (C) ‘Physiological System Development and Function’ are presented. Fisher’s exact test was used to calculate a P-value determining the probability of the association between the genes and the dataset in the canonical pathways.
Analysis of Top Tox Functions in IPA (Figure 3)
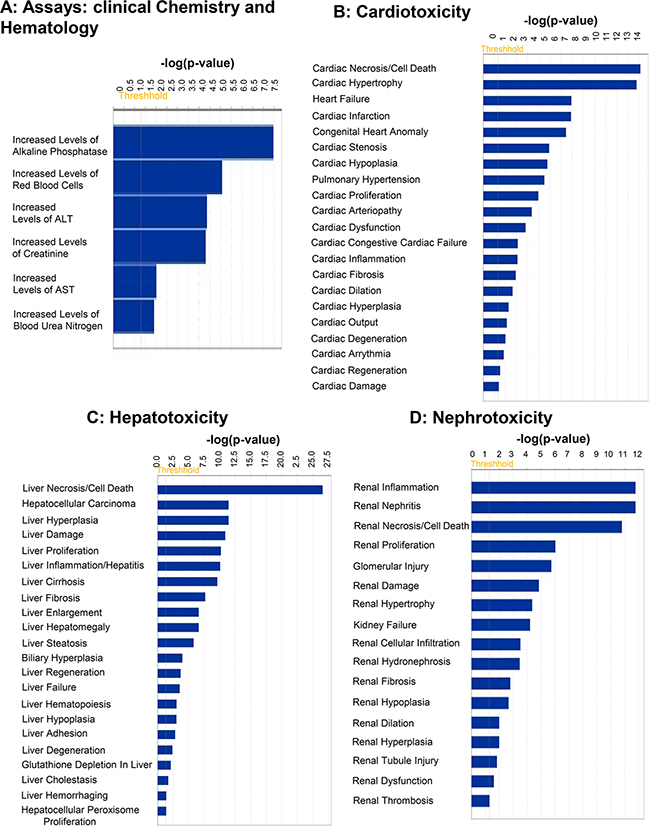
Figure 3: Top predicted “Tox Functions” targeted by mRNAs whose expression is regulated by miRNAs differentially loaded in ExoHypoxic from human PCa LNCaP cells. Data were analyzed by IPA and top (A) ‘Assays: Clinical Chemistry and Hematology’; (B) ‘Cardiotoxicity’; (C) ‘Hepatotoxicity’; and (D) ‘Nephrotoxicity’ are presented. Fisher’s exact test was used to calculate a P-value determining the probability of the association between the genes and the dataset in the functions.
Among the Tox Functions mentioned above, the top five Assays were: Clinical chemistry and hematology, including increased levels of alkaline phosphatase; increased levels of red blood cells; increased levels of alanine transferase; increased levels of creatinine; and increased levels of AST (Figure 3A). The top five functions affected in cardiotoxicity includes Cardiac Necrosis/Cell Death; Cardiac Hypertrophy; Heart Failure; Cardiac Infarction; and Congenital Heart Anomaly (Figure 3B). The top five functions affected in Hepatotoxicity include Liver Necrosis/Cell Death; Hepatocellular Carcinoma; Liver Hyperplasia/Hyperproliferation; Liver Damage; and Liver Proliferation (Figure 3C). The top five functions affected in Nephrotoxicity include Renal Inflammation; Renal Nephritis; Renal Necrosis/Cell Death; Renal Proliferation; and Glomerular Injury (Figure 3D).
Heatmap of predicted KEGG pathways
Using MirPath v.3 analysis of upregulated miRs (Diana Tools Software), 19 pathways such as PCa, cell cycle, and Hippo signaling pathways were identified (Figure 4A). Pathways associated with 11 downregulated miRNAs were also analyzed and the list includes TGF-beta, adherent junction, PCa, neurotrophin and regulating pluripotency of stem cells signaling pathways (Figure 4B). Differential expression of miRNAs under hypoxic conditions were associated with different biological processes that occur in PCa. Up- and down-regulated miRNAs in response to hypoxia were also analyzed by hierarchical clustering and miRNA cluster dendrograms (Figure 5A and 5B).
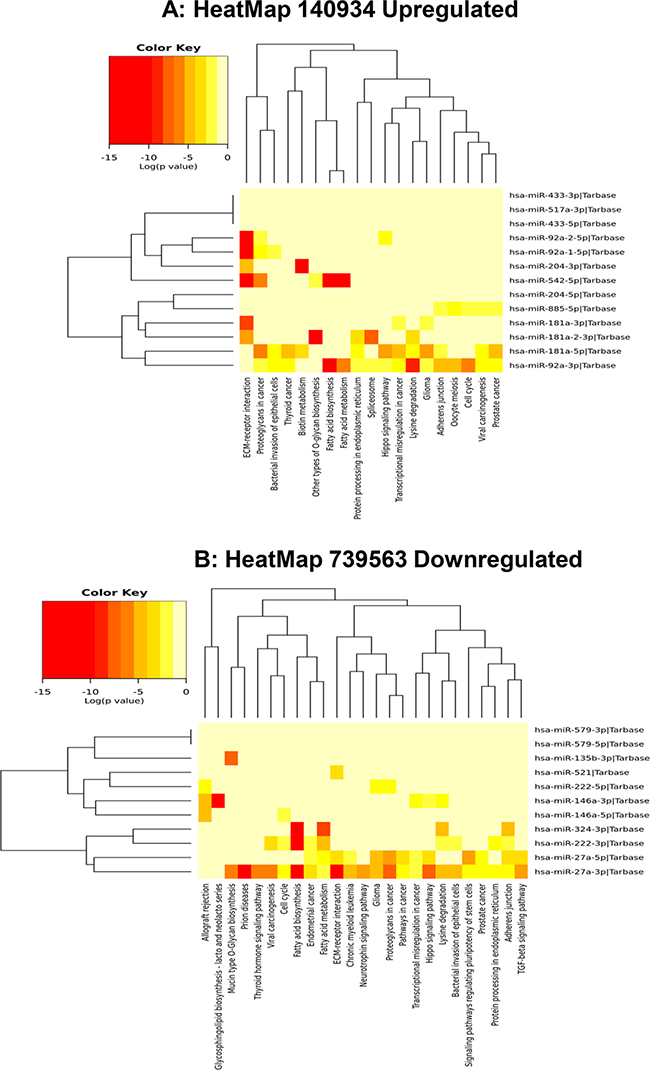
Figure 4: Heat map of up- and downregulated miRNAs and their predicted pathways. (A) Heat map-predicting pathways of upregulated miRs in ExoHypoxic. (B) Heat map-predicting pathways of downregulated miRs in ExoHypoxic. Red indicates up-regulated and yellow indicates down-regulated miRs. The heatmap was generated using mirPath v.3 (Diana Tools) as described.
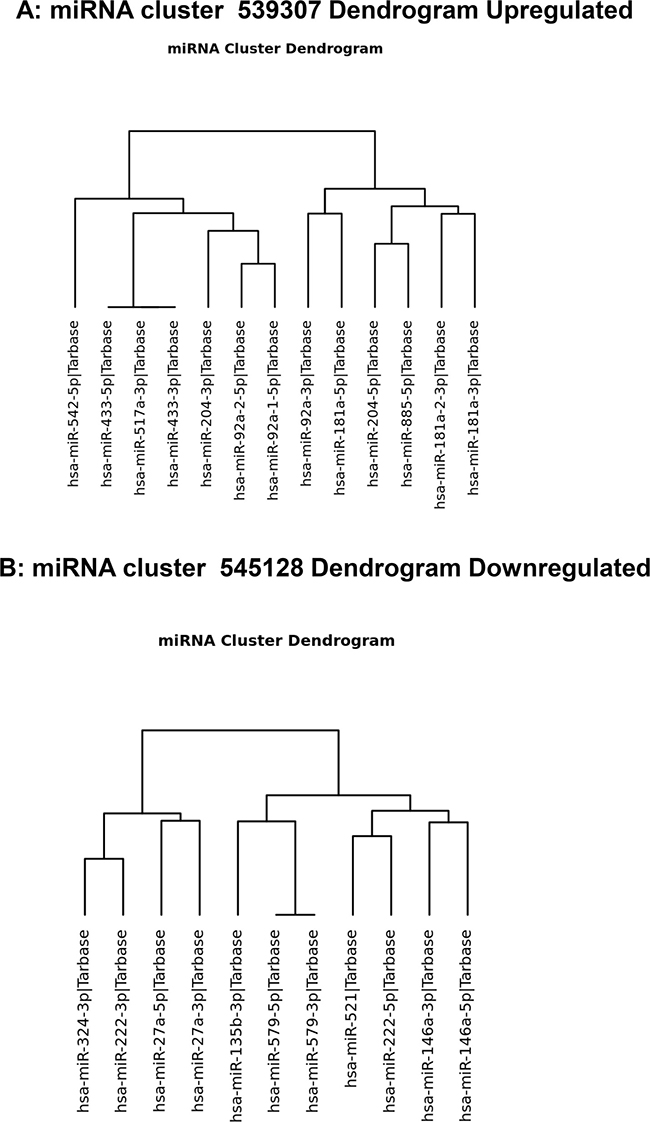
Figure 5: Dendrogram of hierarchical clustering up- and downregulated miRNAs. (A) Hierarchical clustering of upregulated miRs in ExoHypoxic. (B) Hierarchical clustering of downregulated miRs in ExoHypoxic.
Characterization of ExoHypoxic specific miRNAs in PCa patients
Next, we analyzed the levels of some LNCaP ExoHypoxic miRNAs (up- or down-regulated in the microRNA array) in exosomal samples from serum of patients with prostate cancer (patients’ characteristics are listed in Table 4). We first validated array data in LNCaP cells and ExoHypoxic by q-PCR. Similar to array results, miR-521 levels were lower in ExoHypoxic compared to ExoNormoxic , although cellular levels of miR-521 were higher in hypoxic LNCaP cells compared to normoxic LNCaP cells (Figure 6A). Importantly, lower miR-521 levels were observed in exosomes from PCa patients (n = 12) compared to healthy individuals (n = 7). Furthermore, similar to microarray data, miR-885 levels were higher in ExoHypoxic compared to ExoNormoxic, and a similar increase was also observed in hypoxic LNCaP cells compared to normoxic LNCaP cells (Figure 6B). Intriguingly, miR-885 levels in exosomes isolated from the serum of PCa patients were significantly higher compared to exosomes from the serum of healthy individuals (Figure 6B). q-PCR results showed that ExoHypoxic had higher levels of miR-324 compared to ExoNormoxic, although array data showed decreased miR-324 levels in ExoHypoxic (Figure 6C). Furthermore, miR-324 levels were higher in hypoxic LNCaP cells compared to normoxic LNCaP cells (Figure 6C). Similar to ExoHypoxic, we observed higher miR-324 levels in exosomes in serum of PCa patients versus healthy individuals (Figure 6C). Overall, all three miRs analyzed in serum exosome samples showed trends similar to those in ExoHypoxic.
Table 4: Patients’ characteristics
Parameter |
Normal |
PCa patients |
|
|---|---|---|---|
Age (years) |
Mean ± SD |
59.9 ± 6.7 |
63.6 ± 8.2 |
Gleason score (N) |
>7 |
4 |
|
= 7 |
2 |
||
<7 |
6 |
||
Prostate-specific antigen (ng/ml) |
Mean ± SD |
10.8 ± 6.6 |
|
Tumor volume (mm3) |
Mean ± SD |
18.45 ± 13.5 |
|
Stage |
T2c |
6 |
|
T3a |
4 |
||
T3b |
2 |
||
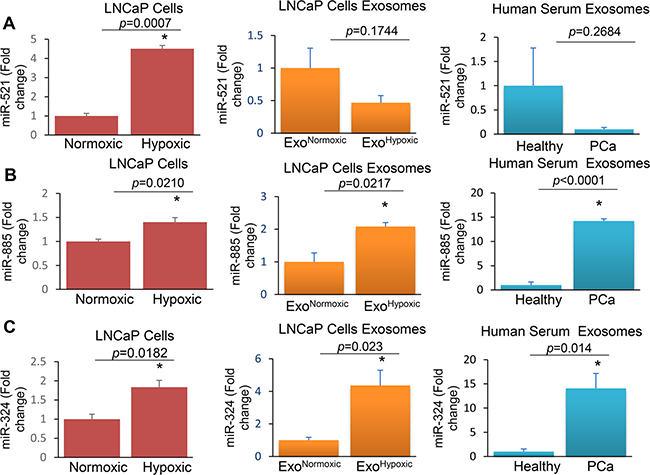
Figure 6: Levels of miR-521, miR-885, and miR-324 in LNCaP cells, ExoHypoxic and exosomes derived from the serum of PCa patients. RNA was extracted from LNCaP cells cultured under hypoxic (1% O2) and normoxic (21% O2) conditions as well as exosomes secreted by the cells (ExoHypoxic and ExoNormoxic). In addition, RNA was extracted from exosomes isolated from the serum of healthy individuals and PCa patients. cDNA was synthesized and real-time PCR was performed. RNU6-2 (U6) was used as an internal control and q-PCR results were represented as a fold change relative to normoxic or healthy subjects for miR-521 (A), miR-885 (B) and miR-324 (C). *denotes significance at p < 0.05 and p value is presented.
Next, we compared levels of the miRNAs (521, 885 and 324) among non-neoplastic prostate epithelial (RWPE1) and various prostate cancer cell lines – LNCaP (AR+), PC-3 (AR–) and DU145 (AR–) – and exosomes secreted by these cells. Expression of all three miRNAs was significantly lower in the prostate cancer cells. Further, exosomes secreted by LNCaP cells had significantly higher levels of all three miRNAs compared to the other cell lines (Figure 7).
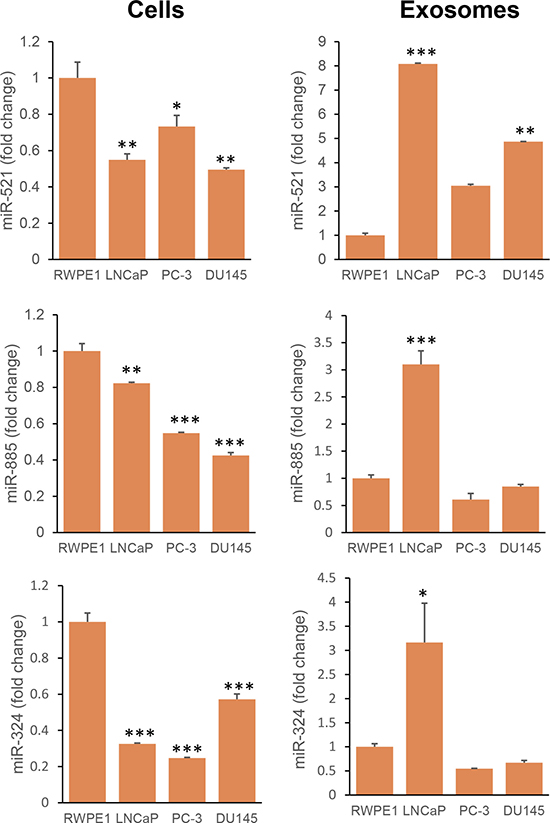
Figure 7: Expression of miR-521, miR-885, and miR-324 in non-neoplastic and neoplastic prostate cells and their exosomes. Exosomes were isolated from the conditioned medium of RWPE1 (non-neoplastic prostate epithelial cells) and PCa cells (LNCaP, PC-3 and DU145). RNA was extracted from cells and exosomes. Real-time PCR was performed as described in the Methods section. Expression was calculated as a fold change relative to RWPE1. Data was analyzed by One way ANOVA followed by Bonferroni t-test. *p < 0.05; **p < 0.01; ***p < 0.001.
TCGA analysis of ExoHypoxic specific miRs
The Cancer Genome Atlas (TCGA) prostate adenocarcinoma (PRAD) genomic dataset was used to compare associations between miRs of interest and pathological measures of PCa aggressiveness in 488 primary prostate tumors. Two miRs, hsa-miR-204 (up-regulated in hypoxia) and hsa-miR-222 (down-regulated in hypoxia), displayed correlated expression patterns in prostate tumors (Pearson R = 0.66, p < 0.0001), and showed statistically significant inverse correlations with tumor T stage, N stage and Gleason score (Table 5).
Table 5: Associations between miR expression and pathological scores of prostate tumors
Change under hypoxia |
Pathology T stage (Pearson R, P val) |
Pathology nodal [N] stage (Odds Ratio [CI], P val) |
Gleason score (Pearson R, P val) |
|
|---|---|---|---|---|
hsa-miR-204 |
UP |
–0.15, 1.1E-03 |
0.73 [0.57–0.95], 1.8E-02 |
–0.24, 7.6E-08 |
hsa-miR-222 |
DOWN |
–0.25, 1.5E-08 |
0.58 [0.42–0.79], 4.0E-04 |
–0.32, 5.3E-13 |
DISCUSSION
Hypoxia is a hallmark of solid tumors, endowing them with malignant, aggressive, and treatment-refractory characteristics [20]. Exosomes play an important role in transferring message from hypoxic cancer cells to normoxic cells in the tumor microenvironment, thereby contributing toward cancer growth, progression, and metastasis [14, 18, 21, 22]. Clinical studies clearly suggest the potential of hypoxia/hypoxia signaling biomarkers as a tool for prognosis of the disease and making key treatment decisions [20]. However, more reliable non-invasive methods are needed for longitudinal measures of hypoxia in tumors. Exosomes could be useful in this role. Hence, in the present study we sought to characterize a hypoxic exosomal miRNA signature for PCa cells and to assess the clinical utility of such a signature.
The top miRNAs that we found to be significantly modulated in ExoHypoxic have functional relevance in various cancers. For example, Jin et al. recently reported that miR-517a-3p promotes lung cancer cell proliferation and invasion by targeting FOXJ3 expression [23]. This microRNA is now used to help classify hepatocellular carcinoma [24]. Similarly, miR-92 is involved in induction of angiogenesis and enhancement of endothelial cell migration [25]. The prognostic and biological significance of miR-127 expression in breast cancer was reported by Wang et al. [26]. Parikh et al. reported that in ovarian cancer miR-181a promotes TGF-β-mediated epithelial-to-mesenchymal transition via repression of its functional target, Smad7 [27].
Our data in the present study are consistent with the above findings showing the upregulation of miR-517, miR-92a, miR-127, and miR-181a in ExoHypoxic. Furthermore, in a previous study of non-small cell lung cancer cells, miR-146a inhibited cell growth and cell migration but induced apoptosis [28]; we observed decreased levels of miR-146a in ExoHypoxic. In another study, Tadorova et al. showed that miR-204 is dysregulated in metastatic PCa in vitro [29]. In colon cancer, dysregulation of miR-324-5p resulted in macrophage dysfunction [30]. A later study highlighted the role of miR-324-5p in suppression of hepatocellular carcinoma by counteracting extracellular matrix degradation [31].
Similarly, Heyn et al. described the importance of miR-335 in breast cancer development, since it targets the BRCA1 regulatory cascade [32]. Gong et al. reported that miR-335 inhibits small cell lung cancer bone metastasis via IGF-IR and RANKL pathways [33]. Another study identified miR-335 as an independent prognostic marker in epithelial ovarian cancer [34]. A recent study on miR-502 reported its potential tumor suppressor role in colon cancer [35]; in the present study, this miR was downregulated in ExoHypoxic. Taken together, the literature suggests that significantly modulated miRNAs in ExoHypoxic are relevant in PCa, and should be studied further for their usefulness as a molecular biomarker for hypoxic tumors and to assess their targets.
In the present study, we observed a similar expression trend in ExoHypoxic (compared to ExoNormoxic) and exosomes from PCa patients’ serum (compared to healthy individuals) for all 3 miRs (521, 885 and 324). Arrays and q-PCR analyses showed that miR-521 levels are lower in ExoHypoxic; however, miR-521 levels were higher in hypoxic LNCaP cells, suggesting a differential loading of miRs in exosomes. We anticipate that the differential release of miRNAs via exosomes, in the conditioned medium or blood stream, is one way cells can communicate with each other to create specific biological effects [36]. Furthermore, arrays showed that miR-324 levels are decreased in ExoHypoxic; however, q-PCR results showed an increase in miR-324 in ExoHypoxic. These results highlight that validation of array data by q-PCR is important in identifying novel miRNAs as possible biomarkers. Further, there remain different pitfalls of using each technique [37, 38]. Biological and non-biological procedures mostly affect microarray and q-PCR results [39]. Despite these limitations, it is encouraging to see similar trends in miRNA levels in ExoHypoxic and exosomes from PCa patients.
In the present study, IL-6 signalling was the top hit in canonical pathways. This signaling pathway has been implicated in several human cancers [40, 41]. It is a multifunctional pro-inflammatory cytokine expressed in specimens from patients with PCa and in multiple cell lines [42]. Earlier studies revealed that IL-6 mediates resistance to chemotherapy in PCa [43]. Bao et al. reported that IL6 was involved in hypoxia-induced aggressiveness in PCa PC-3 cells [16]. Jeong et al. showed that IL-6 production is linked to hypoxia-induced activation of MAP kinase, HIF-1α, and NF-κB [44]. Therefore, it is plausible that miRNA/s loaded in ExoHypoxic could affect the mRNA expression of genes that regulate IL6 expression in target cells, a question that merits further explortion.
Earlier, we reported that ExoHypoxic are associated with remodelling of the epithelial adherens junction and cytoskeleton signaling [18]. In the present study, IPA analyses identified ‘Cellular Movement’ as the top hit under Molecular and cellular functions, which is consistent with our earlier finding. However, the specific pathways and key molecules involved in this biological response are still not clear. For example, we reported that ExoHypoxic treatment promoted invasiveness in PC-3 cells via decreasing E-cadherin expression and increasing nuclear β-catenin expression [18]. Parikh et al. have shown that miR-181a targets E-cadherin expression in ovarian cancer cells [27]. In the present study, we observed an increase in miR-181a (1.5 fold) in ExoHypoxic compared to ExoNormoxic. Further, the molecular effects of miRNAs loaded in ExoHypoxic on local and distant cell types in the tumor microenvironment remain unclear.
Our IPA analysis identified ‘cardiotoxicity pathway’ as a target pathway, but in the literature this has not been consistently reported. In the Rotterdam randomized screening trial [45], PCa treatment did not increase the risk of dying as a result of cardiovascular causes. However, in another study, androgen-deprivation therapy was associated with a 5% absolute excess risk of cardiac-specific mortality at 5 years in men with congestive heart failure or past myocardial infarction [46].
Overall, results from the present study showed significantly different levels of key miRNAs in ExoHypoxic compared with ExoNormoxic. These outcomes correlate well in PCa patients’ samples, suggesting the utility of exosomes as possible biomarkers for hypoxia levels in tumors. Furthermore, our results support our previous findings on hypoxia-induced biological effects in PCa. In the future, we will further characterize the biological effects of key miRNAs in ExoHypoxic on components of the local and distant tumor microenvironment, and mechanisms involved in their uptake by target cells.
MATERIALS AND METHODS
Cell lines and reagents
Human LNCaP, PC-3, and DU145 PCa cell lines and non-neoplastic prostate epithelial RWPE-1 cells were purchased from ATCC (Manassas, VA). miRNeasy micro kits were obtained from Qiagen (Valencia, CA). TaqMan® Array MicroRNA Cards with pre-amplification and TaqMan® MicroRNA Reverse Transcription Kits were purchased from Life Technologies, Applied Biosystems (Foster City, CA). RPMI-1640 medium and other cell culture materials were from Invitrogen Corporation (Gaithersburg, MD). All other reagents were obtained in the highest purity that is commercially available.
Cell culture and hypoxia exposure
PC-3, DU145, and LNCaP cells were cultured in a humidified environment at 37° C and 5% CO2 as adherent monolayer in DMEM or RPMI1640 (for LNCaP) medium supplemented with 10% fetal bovine serum (FBS) in presence of 100 U/mL penicillin G and 100mg/mL streptomycin sulfate. RWPE-1 cells were grown in keratinocyte serum-free media supplemented with bovine pituitary extract and epidermal growth factor (Life Tech. Corp., Grand Island, NY). Hypoxia experiments were performed in a hypoxia chamber at 1% O2 at 37° C in a 5% CO2 humidified environment.
Exosome collection and miRNA isolation
Exosomes were collected from the conditioned media of LNCaP cells cultured under normoxic or hypoxic conditions for 72 h by ultracentrifugation as we previously described [18, 19]. ExoHypoxic and ExoNormoxic miRNA was isolated using the miRNeasy micro kit (Qiagen) following the vendor’s instructions. Briefly, exosomes were disrupted and homogenized in RLT buffer (Qiagen), and the rest of the procedure was performed according to the manufacturer’s protocol. RNA concentrations and purity were confirmed by the spectrophotometric ratio using absorbance measurements at wavelengths of 260 nm and 280 nm on a Nanodrop 2000 (Thermo Fisher, Wilmington, DE).
miRNA expression profile
miRNA in ExoHypoxic and ExoNormoxic were analyzed using TaqMan® Array MicroRNA Cards with pre-amplification kit (Life Technologies, Applied Biosystems). 350 ng of miRNA was used as input in each reverse transcription (RT) reaction. The RT reaction and pre-amplification steps were done according to the manufacturer’s instructions. miRNAs were reverse transcribed using TaqMan® MicroRNA Reverse Transcription Kit (Life Technologies, Applied Biosystems). RT reaction products from the exosome sample were further amplified using the Custom PreAmp Primer Pool. The expression profile of miRNAs was determined using the TaqMan® Universal Master Mix II (Life Technologies, Applied Biosystems) in an Applied Biosystems 7900HT thermal cycler using the manufacturer’s recommended program. Finally, all the raw data from each array were retrieved from the 7900HT and run on Data Assist Software ver.3.1 (Applied Biosystems). In another set of experiments, we collected exosomes from the conditioned medium of RWPE1, LNCaP, PC-3 and DU145 cells; RNA was isolated from cells and exosomes, followed by miRNA cDNA synthesis (Applied Biological Materials Inc., BC, Canada). Real-time PCR was performed using SYBR Green master mix on a Bio-Rad CFX96 detection system (Bio-Rad, Hercules, CA). The fold change in expression levels was determined using RNU6 and 5S rRNA as an internal control.
miRNA target prediction and pathway analysis
miRNA targets prediction was carried out using the microRNA Target Filter function in Ingenuity Pathways Analysis software (IPA, Ingenuity Systems, Redwood City, CA). IPA’s microRNA Target Filter employs experimentally validated and predicted mRNA targets from TargetScan, TarBase, miRecords, and the Ingenuity® Knowledge Base. Subsequently, the predicted target mRNAs were subjected to pathway exploration by core analysis in IPA considering only the relationships where the confidence limit was “experimentally observed”. The heatmap and clustering of predicted KEEG pathways of up- and downregulated miRs in ExoHypoxic were performed according to Vlachos et al. [47].
Validation of array data and detection of exosome-associated miRNAs in serum from patients with PCa
Serum was collected from 12 patients with PCa (clinical information summarized in Table 4) and 7 healthy individuals following a protocol approved by the IRB from Texas A&M Health Science Center. MiRCURYTM exosome isolation kits were used according to the manufacturer’s directions (Exiqon). Briefly, 0.6 ml serum was centrifuged at 10,000 × g to remove cell debris and 200 μl of exosome precipitation solution was added to the clear supernatant and incubated for 60 minutes at 4° C. Samples were centrifuged at 1,500 g for 30 min and the exosomal pellet was re-suspended in 300 μl of resuspension buffer for subsequent analyses. Total RNA was extracted using modified protocol from miRCURY™ RNA Isolation Kits-Biofluids (Exiqon). Briefly, to 300 μl of re-suspended exosomes, 90 μl of lysis solution was added to samples and the protocol for RNA extraction was completed. For mature miRNA cDNA synthesis, miScript II RT kit (Qiagen) was used for q-PCR amplification according to the manufacturer’s instructions. Quantitative real-time PCR was performed using a Bio-Rad CFX96 iCycler device. U6 was used as a reference gene for normalizations and the relative amount of each miRNA was calculated as ΔCt = Ct miRNA-Ct U6. The fold change of each miRNA was calculated using the comparative Ct method (ΔΔCt), where mean ΔCt of control samples for the miRNA subtracted from that of each sample. The fold change (FC) calculated according to this formula FC = 2−ΔΔCt. Each sample was used in triplicate and repeated at least twice.
TCGA analysis
Level 3-processed miR-Seq profiles and clinical data files from the TCGA PRAD dataset were downloaded from the Broad Institute’s FireBrowse (Release 1.1.35) website (http://firebrowse.org/). Of the 494 tumors sequenced, 488 were associated with corresponding clinical data related to pathological T stage, nodal status (N stage) and Gleason score. Associations between miR log2 RPKM expression values and pathological variables were assessed by Pearson correlation (T stage, Gleason score) and multiple logistic regression analysis (N stage).
Statistical analyses
Significant differences between levels of miRNA in normoxic and hypoxic conditions were determined using Student’s t-tests. All miRNA results from qPCR analysis were presented as fold change relative to healthy individuals or RWPE1 cells using RNU6 and 5S rRNA as internal controls. Statistical analyses were performed using a Mann-Whitney test (GraphPad Software, Inc., La Jolla, CA). A p-value of less than 0.05 was considered significant. For data analysed in IPA, Fisher’s exact test was used to calculate a p-value determining the probability of the association between the genes and the dataset in the functions or the pathways.
Abbreviations
ADT: Androgen-deprivation therapy; CAF: Cancer-associated fibroblasts; CSM: Cardiac-specific mortality; ExoHypoxic: Exosomes secreted by cells under hypoxic condition; ExoNormoxic: Exosomes secreted by cells under normoxic condition; FBS: Fetal bovine serum; IPA: Ingenuity pathways analysis; KEGG: Kyoto encyclopedia of genes and genomes; miRNA: microRNA; PCa: Prostate cancer; PRAD: Prostate adenocarcinoma; PSA: Prostate-specific antigen; q-PCR: Quantitative-polymerase chain reaction; TCGA: The Cancer Genome Atlas.
Author contributions
GKP, AR, HEAA, and SV performed the experiments and wrote the manuscript; CA contributed to cell culture and manuscript writing; DB and LDM helped in data analyses and manuscript writing; RV, RA and ZYAE provided the reagents and contributed in experimental design and manuscript writing; and GD developed the original hypothesis, study design, supervised the experiments, provided reagents, and contributed to manuscript writing. All authors read and approved the final manuscript.
CONFLICTS OF INTEREST
The authors have declared that no competing interests exist.
FUNDING
This work was supported by grant NIH/NCI R21 CA199628 (G.D.) and NIH/NCI R21CA194750 (Z.Y.A.). We acknowledge the editorial assistance of Karen Klein, MA, in the Wake Forest Clinical and Translational Science Institute (UL1 TR001420; PI: McClain)
REFERENCES
1. Siegel RL, Miller KD, Jemal A. Cancer statistics, 2016. CA Cancer J Clin. 2016; 66:7–30.
2. Dall’Era MA, Cooperberg MR, Chan JM, Davies BJ, Albertsen PC, Klotz LH, Warlick CA, Holmberg L, Bailey DE Jr, Wallace ME, Kantoff PW, Carroll PR. Active surveillance for early-stage prostate cancer: review of the current literature. Cancer. 2008; 112:1650–1659.
3. Fraser M, Berlin A, Bristow RG, van der Kwast T. Genomic, pathological, and clinical heterogeneity as drivers of personalized medicine in prostate cancer. Urol Oncol. 2015; 33:85–94.
4. Chen X, Ba Y, Ma L, Cai X, Yin Y, Wang K, Guo J, Zhang Y, Chen J, Guo X, Li Q, Li X, Wang W, et al. Characterization of microRNAs in serum: a novel class of biomarkers for diagnosis of cancer and other diseases. Cell Res. 2008; 18:997–1006.
5. Fabris L, Ceder Y, Chinnaiyan AM, Jenster GW, Sorensen KD, Tomlins S, Visakorpi T, Calin GA. The Potential of MicroRNAs as Prostate Cancer Biomarkers. Eur Urol. 2016; 70:312–322.
6. Cortez MA, Bueso-Ramos C, Ferdin J, Lopez-Berestein G, Sood AK, Calin GA. MicroRNAs in body fluids—the mix of hormones and biomarkers. Nat Rev Clin Oncol. 2011; 8:467–477.
7. Boukouris S, Mathivanan S. Exosomes in bodily fluids are a highly stable resource of disease biomarkers. Proteomics Clin Appl. 2015; 9:358–367.
8. Verma M, Lam TK, Hebert E, Divi RL. Extracellular vesicles: potential applications in cancer diagnosis, prognosis, and epidemiology. BMC Clin Pathol. 2015; 15:6.
9. Kalra H, Adda CG, Liem M, Ang CS, Mechler A, Simpson RJ, Hulett MD, Mathivanan S. Comparative proteomics evaluation of plasma exosome isolation techniques and assessment of the stability of exosomes in normal human blood plasma. Proteomics. 2013; 13:3354–3364.
10. McKiernan J, Donovan MJ, O’Neill V, Bentink S, Noerholm M, Belzer S, Skog J, Kattan MW, Partin A, Andriole G, Brown G, Wei JT, Thompson IM Jr, et al. A Novel Urine Exosome Gene Expression Assay to Predict High-grade Prostate Cancer at Initial Biopsy. JAMA Oncol. 2016; 2:882–889.
11. Joyce JA. Therapeutic targeting of the tumor microenvironment. Cancer Cell. 2005; 7:513–520.
12. Albini A, Sporn MB. The tumour microenvironment as a target for chemoprevention. Nat Rev Cancer. 2007; 7:139–147.
13. Deep G, Agarwal R. Targeting tumor microenvironment with silibinin: promise and potential for a translational cancer chemopreventive strategy. Curr Cancer Drug Targets. 2013; 13:486–499.
14. Azmi AS, Bao B, Sarkar FH. Exosomes in cancer development, metastasis, and drug resistance: a comprehensive review. Cancer Metastasis Rev. 2013; 32:623–642.
15. Sceneay J, Smyth MJ, Moller A. The pre-metastatic niche: finding common ground. Cancer Metastasis Rev. 2013; 32:449–464.
16. Bao B, Ahmad A, Kong D, Ali S, Azmi AS, Li Y, Banerjee S, Padhye S, Sarkar FH. Hypoxia induced aggressiveness of prostate cancer cells is linked with deregulated expression of VEGF, IL-6 and miRNAs that are attenuated by CDF. PLoS One. 2012; 7:e43726.
17. Tatum JL, Kelloff GJ, Gillies RJ, Arbeit JM, Brown JM, Chao KS, Chapman JD, Eckelman WC, Fyles AW, Giaccia AJ, Hill RP, Koch CJ, Krishna MC, et al. Hypoxia: importance in tumor biology, noninvasive measurement by imaging, and value of its measurement in the management of cancer therapy. Int J Radiat Biol. 2006; 82:699–757.
18. Ramteke A, Ting H, Agarwal C, Mateen S, Somasagara R, Hussain A, Graner M, Frederick B, Agarwal R, Deep G. Exosomes secreted under hypoxia enhance invasiveness and stemness of prostate cancer cells by targeting adherens junction molecules. Mol Carcinog. 2015; 54:554–565.
19. Schlaepfer IR, Nambiar DK, Ramteke A, Kumar R, Dhar D, Agarwal C, Bergman B, Graner M, Maroni P, Singh RP, Agarwal R, Deep G. Hypoxia induces triglycerides accumulation in prostate cancer cells and extracellular vesicles supporting growth and invasiveness following reoxygenation. Oncotarget. 2015; 6:22836–22856. https://doi.org/10.18632/oncotarget.4479.
20. Deep G, Panigrahi GK. Hypoxia-induced signaling promotes prostate cancer progression: Exosomes role as messenger of hypoxic response in tumor microenvironment. Crit Rev Oncog. 2015; 20:419–34.
21. Zhao H, Yang L, Baddour J, Achreja A, Bernard V, Moss T, Marini JC, Tudawe T, Seviour EG, San Lucas FA, Alvarez H, Gupta S, Maiti SN, et al. Tumor microenvironment derived exosomes pleiotropically modulate cancer cell metabolism. Elife. 2016; 5:e10250.
22. King HW, Michael MZ, Gleadle JM. Hypoxic enhancement of exosome release by breast cancer cells. BMC Cancer. 2012; 12:421.
23. Jin J, Zhou S, Li C, Xu R, Zu L, You J, Zhang B. MiR-517a-3p accelerates lung cancer cell proliferation and invasion through inhibiting FOXJ3 expression. Life Sci. 2014; 108:48–53.
24. Toffanin S, Hoshida Y, Lachenmayer A, Villanueva A, Cabellos L, Minguez B, Savic R, Ward SC, Thung S, Chiang DY, Alsinet C, Tovar V, Roayaie S, et al. MicroRNA-based classification of hepatocellular carcinoma and oncogenic role of miR-517a. Gastroenterology. 2011; 140:1618–28.e16.
25. Umezu T, Ohyashiki K, Kuroda M, Ohyashiki JH. Leukemia cell to endothelial cell communication via exosomal miRNAs. Oncogene. 2013; 32:2747–2755.
26. Wang S, Li H, Wang J, Wang D, Yao A, Li Q. Prognostic and biological significance of microRNA-127 expression in human breast cancer. Dis Markers. 2014; 2014:401986.
27. Parikh A, Lee C, Joseph P, Marchini S, Baccarini A, Kolev V, Romualdi C, Fruscio R, Shah H, Wang F, Mullokandov G, Fishman D, D’Incalci M, et al. microRNA-181a has a critical role in ovarian cancer progression through the regulation of the epithelial-mesenchymal transition. Nat Commun. 2014; 5:2977.
28. Chen G, Umelo IA, Lv S, Teugels E, Fostier K, Kronenberger P, Dewaele A, Sadones J, Geers C, De Greve J. miR-146a inhibits cell growth, cell migration and induces apoptosis in non-small cell lung cancer cells. PLoS One. 2013; 8:e60317.
29. Todorova K, Metodiev MV, Metodieva G, Zasheva D, Mincheff M, Hayrabedyan S. miR-204 is dysregulated in metastatic prostate cancer in vitro. Mol Carcinog. 2016; 55:131–147.
30. Chen Y, Wang SX, Mu R, Luo X, Liu ZS, Liang B, Zhuo HL, Hao XP, Wang Q, Fang DF, Bai ZF, Wang QY, Wang HM, et al. Dysregulation of the miR-324-5p-CUEDC2 axis leads to macrophage dysfunction and is associated with colon cancer. Cell Rep. 2014; 7:1982–1993.
31. Cao L, Xie B, Yang X, Liang H, Jiang X, Zhang D, Xue P, Chen D, Shao Z. MiR-324-5p Suppresses Hepatocellular Carcinoma Cell Invasion by Counteracting ECM Degradation through Post-Transcriptionally Downregulating ETS1 and SP1. PLoS One. 2015; 10:e0133074.
32. Heyn H, Engelmann M, Schreek S, Ahrens P, Lehmann U, Kreipe H, Schlegelberger B, Beger C. MicroRNA miR-335 is crucial for the BRCA1 regulatory cascade in breast cancer development. Int J Cancer. 2011; 129:2797–2806.
33. Gong M, Ma J, Guillemette R, Zhou M, Yang Y, Yang Y, Hock JM, Yu X. miR-335 inhibits small cell lung cancer bone metastases via IGF-IR and RANKL pathways. Mol Cancer Res. 2014; 12:101–110.
34. Cao J, Cai J, Huang D, Han Q, Chen Y, Yang Q, Yang C, Kuang Y, Li D, Wang Z. miR-335 represents an independent prognostic marker in epithelial ovarian cancer. Am J Clin Pathol. 2014; 141:437–442.
35. Zhai H, Song B, Xu X, Zhu W, Ju J. Inhibition of autophagy and tumor growth in colon cancer by miR-502. Oncogene. 2013; 32:1570–1579.
36. Taylor DD, Gercel-Taylor C. MicroRNA signatures of tumor-derived exosomes as diagnostic biomarkers of ovarian cancer. Gynecol Oncol. 2008; 110:13–21.
37. Morey JS, Ryan JC, Van Dolah FM. Microarray validation: factors influencing correlation between oligonucleotide microarrays and real-time PCR. Biol Proced Online. 2006; 8:175–193.
38. Shi L, Perkins RG, Fang H, Tong W. Reproducible and reliable microarray results through quality control: good laboratory proficiency and appropriate data analysis practices are essential. Curr Opin Biotechnol. 2008; 19:10–18.
39. Chuaqui RF, Bonner RF, Best CJ, Gillespie JW, Flaig MJ, Hewitt SM, Phillips JL, Krizman DB, Tangrea MA, Ahram M, Linehan WM, Knezevic V, Emmert-Buck MR. Post-analysis follow-up and validation of microarray experiments. Nat Genet. 2002; 32:509–514.
40. Schafer ZT, Brugge JS. IL-6 involvement in epithelial cancers. J Clin Invest. 2007; 117:3660–3663.
41. Guo Y, Xu F, Lu T, Duan Z, Zhang Z. Interleukin-6 signaling pathway in targeted therapy for cancer. Cancer Treat Rev. 2012; 38:904–910.
42. Culig Z. Proinflammatory cytokine interleukin-6 in prostate carcinogenesis. Am J Clin Exp Urol. 2014; 2:231–238.
43. Borsellino N, Belldegrun A, Bonavida B. Endogenous interleukin 6 is a resistance factor for cis-diamminedichloroplatinum and etoposide-mediated cytotoxicity of human prostate carcinoma cell lines. Cancer Res. 1995; 55:4633–4639.
44. Jeong HJ, Hong SH, Park RK, Shin T, An NH, Kim HM. Hypoxia-induced IL-6 production is associated with activation of MAP kinase, HIF-1, and NF-kappaB on HEI-OC1 cells. Hear Res. 2005; 207:59–67.
45. Otto SJ, Schroder FH, de Koning HJ. Risk of cardiovascular mortality in prostate cancer patients in the Rotterdam randomized screening trial. J Clin Oncol. 2006; 24:4184–4189.
46. Ziehr DR, Chen MH, Zhang D, Braccioforte MH, Moran BJ, Mahal BA, Hyatt AS, Basaria SS, Beard CJ, Beckman JA, Choueiri TK, D’Amico AV, Hoffman KE, et al. Association of androgen-deprivation therapy with excess cardiac-specific mortality in men with prostate cancer. BJU Int. 2015; 116:358–365.
47. Vlachos IS, Zagganas K, Paraskevopoulou MD, Georgakilas G, Karagkouni D, Vergoulis T, Dalamagas T, Hatzigeorgiou AG. DIANA-miRPath v3.0: deciphering microRNA function with experimental support. Nucleic Acids Res. 2015; 43:W460–466.