
INTRODUCTION
Dermatofibrosarcoma protuberans (DFSP) accounts for 6% of all soft tissue sarcomas, and affects young and middle-aged adults. Its slow growth contrasts with a predisposition to local recurrence and evolution to higher-grade sarcoma, or “transformed DFSP” (DFSP-T) in 10-20% of cases [1]. Clinically, DFSP-T is characterized by rapid growth, shorter recurrence-free survival and greater metastatic potential than DFSP [2]. This heterogeneous clinical evolution is associated with a histologic heterogeneity. The histologic pattern of DFSP comprises bulky nodules with an infiltrative periphery of CD34+ fibroblastic spindle cells [3]. The evolution to DFSP-T is characterized by the occurrence of areas of atypical spindle or pleomorphic cells with numerous mitoses. These clinical and tissular heterogeneities could explain why the molecular mechanisms underlying tumor progression have not yet been deciphered and why no predictive biomarker is currently available.
Biologically, DFSP is characterized by a genomic rearrangement involving chromosomes 17 and 22, in a supernumerary ring chromosome, or in a reciprocal balanced translocation t(17;22)(q22;q13) [4]. This rearrangement places the PDGFB gene under the control of the constitutively active COL1A1 promoter, leading to overexpression of PDGFB, and thus to sustained platelet-derived growth factor receptor (PDGFR) signaling as a result of an activating autocrine loop [4]. The first targeted therapy used in DFSP and DFSP-T was imatinib, a PDGFR tyrosine-kinase inhibitor. Response rates to imatinib do not exceed 50% using RECIST criteria and secondary resistance occurs among the responders, especially in metastatic DFSP and DFSP-T [5–9]. Therefore, other receptor tyrosine kinase pathways may be involved in DFSP progression.
Recently, epidermal growth factor receptor (EGFR) has been found phosphorylated in 7 patients with DFSP [7]. EGFR (also known as ERBB1 or HER1) is a cell-surface receptor tyrosine kinase whose ligands include epidermal growth factor and transforming growth factor-α [10]. EGFR signaling through receptor phosphorylation and activation of downstream effectors contributes to tumor cell proliferation, apoptosis evasion, angiogenesis and metastasis [11]. The EGFR downstream effectors include phospholipase C (PLC), Janus kinase (JAK)/Signal Transducer and Activator of Transcription (STAT), Mitogen-Activated Protein Kinase (MAPK), and phosphoinositide 3-kinase (PI3K)/protein kinase B (AKT)/Target of Rapamycin (TOR) pathways. Functional EGFR dysregulation, with overexpression and activation by mutations or autocrine/paracrine growth factor loops, has been identified in 50% of human epithelial malignancies, leading to EGFR-targeted therapy [12].
Here, we laser-microdissected areas from DFSP center, DFSP infiltrative periphery and DFSP-T higher-grade sarcoma in 22 patients followed over 3 to 156 months, and we assessed EGFR expression, mutational pattern, activation and signaling in each of them.
RESULTS
Our study included 12 DFSP patients, mean age 42.3 ± 9.5 years with a male-to-female ratio of 1, and 10 DFSP-T patients, mean age 48 ± 20.2 years with a male-to-female ratio of 0.67 (Table 1). All 22 cases presented COL1A1-PDGFB rearrangement and none had received imatinib before tumor sampling.
Table 1: Clinical, biological and follow-up data of the 22 patients with DFSP or DFSP-T
Patient |
Diagnosis |
Age at diagnosis (years) |
Sex |
Tumor site |
Largest Tumor size (cm) |
Treatment |
Follow-up duration (months) |
Metastatic disease |
Status at last follow-up |
|---|---|---|---|---|---|---|---|---|---|
1 |
DFSP |
54 |
M |
Shoulder |
2.5 |
Surgery |
38 |
No |
aned |
2 |
DFSP |
37 |
F |
Thigh |
2.5 |
Surgery |
36 |
No |
aned |
3 |
DFSP |
33 |
M |
Thigh |
2 |
Surgery |
39 |
No |
aned |
4 |
DFSP |
27 |
F |
Chest |
2 |
Surgery |
38 |
No |
aned |
5 |
DFSP |
50 |
F |
Thigh |
2 |
Surgery |
40 |
No |
aned |
6 |
DFSP |
40 |
M |
Face |
3 |
Surgery |
26 |
No |
aned |
7 |
DFSP |
55 |
F |
Shoulder |
1.5 |
Surgery |
39 |
No |
aned |
8 |
DFSP |
44 |
M |
Chest |
7 |
Surgery |
10 |
No |
aned |
9 |
DFSP |
41 |
F |
Back |
1.5 |
Surgery |
42 |
No |
aned |
10 |
DFSP |
47 |
M |
Chest |
3 |
Surgery |
24 |
No |
aned |
11 |
DFSP |
51 |
F |
Arm |
6.5 |
Surgery |
39 |
No |
aned |
12 |
DFSP |
29 |
M |
Back |
9 |
Surgery |
156 |
No |
aned |
13 |
DFSP-T (FS) |
21 |
M |
Shoulder |
2 |
Surgery |
38 |
No |
aned |
14 |
DFSP-T (FS) |
33 |
F |
Thigh |
4 |
Surgery |
25 |
No |
aned |
15 |
DFSP-T (FS) |
54 |
F |
Abdomen |
20 |
Imatinib, surgery and radiotherapy |
110 |
No |
aned |
16 |
DFSP-T (FS) |
48 |
M |
Thigh |
4.5 |
Surgery |
24 |
No |
aned |
17 |
DFSP-T (FS) |
23 |
F |
Face |
15 |
Imatinib |
120 |
Yes |
awd |
18 |
DFSP-T (FS) |
68 |
M |
Abdomen |
8 |
Surgery and radiotherapy |
51 |
No |
aned |
19 |
DFSP-T (FS) |
49 |
F |
Back |
6 |
Surgery |
40 |
No |
aned |
20 |
DFSP-T (FS) |
36 |
M |
Thigh |
9 |
Surgery |
66 |
No |
aned |
21 |
DFSP-T (UPS) |
83 |
F |
Leg |
17 |
Surgery |
40 |
No |
aned |
22 |
DFSP-T (UPS) |
65 |
F |
Chest |
16 |
Surgery |
3 |
Yes |
dod |
Abbreviations: DFSP, dermatofibrosarcoma protuberans; DFSP-T, transformed dermatofibrosarcoma protuberans; FS, fibrosarcoma; UPS, undifferentiated pleomorphic sarcoma; M, male; F, female; aned, alive with no evidence of disease; awd, alive with disease; dod, dead of disease.
EGFR is expressed in tumor cells from DFSP infiltrative areas and from DFSP-T higher-grade sarcoma areas
Among the 22 DFSP and DFSP-T, we first assessed EGFR expression using immunohistochemistry (Figure 1). EGFR expression was found in 8/12 DFSP (67%) and in 5/10 DFSP-T (50%).
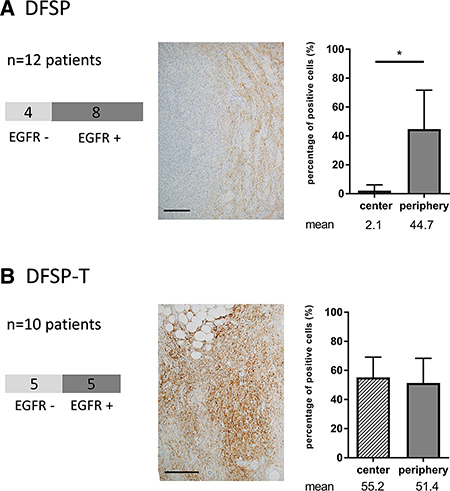
Figure 1: EGFR expression in patients with dermatofibrosarcoma protuberans (DFSP) and transformed DFSP (DFSP-T). (A) 8/12 DFSP patients have positive EGFR staining with a peripheral distribution of EGFR expression within the tumor; (B) 5/10 DFSP-T patients have positive EGFR staining within the tumor with a diffuse distribution of EGFR expression within the tumor. Scale bar = 100 μm; *p < 0.05.
Among the 13/22 patients with EGFR expression, when we analyzed the percentage of EGFR-positive tumor cells in the center and in the infiltrative periphery of the tumors, we found that, in DFSP, EGFR expression was significantly more marked in the peripheral invasive area than in the center of the tumor (44.7% vs 2.1%; p < 0.05). In addition, the percentages of EGFR-positive tumor cells were not different between DFSP-T and DFSP peripheral areas (p > 0.20).
The same pattern of expression, both on areas of local extension and on areas of higher-grade sarcoma, was found for EGFR mRNA in laser-microdissected cells (Figure 2): a significant increase was found in the DFSP infiltrative periphery compared to the DFSP center (1.11 ± 0.21 vs 0.32 ± 0.08; p < 0.01); the mean level of EGFR mRNA was highly elevated in DFSP-T, but no significant difference was observed between the DFSP-T and DFSP infiltrative periphery due to variation in EGFR mRNA expression among DFSP-T samples (DFSP-T, 3.98 ± 3.7 vs DFSP periphery, 1.11 ± 0.21; p > 0.20).
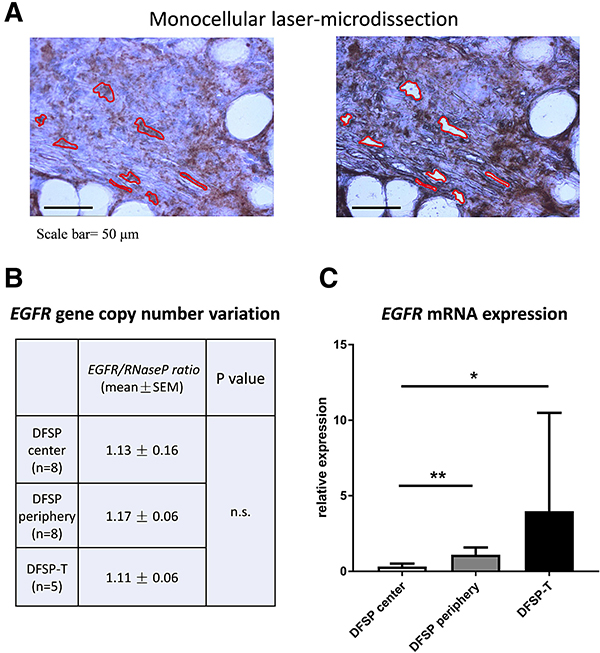
Figure 2: EGFR gene copy-number and mRNA analysis in microdissected tumor cells. (A) monocellular tumor cell laser-microdissection was performed in DFSP center, DFSP periphery and DFSP-T samples (here represented DFSP periphery); (B) EGFR gene copy-number was in the normal range compared to Rnase P gene, in DFSP and DFSP-T; (C) EGFR mRNA expression increased significantly in DFSP periphery and DFSP-T compared to DFSP center (*p < 0.05; **p <0 ,01).
The EGFR gene is not mutated in hotspots nor amplified in DFSP
We aimed to determine whether EGFR expression in the different microdissected areas was related to EGFR gene alterations, i.e. cancer hotspot point mutations, exon 19 deletion, or gene copy-number variations.
No L858R-activating mutation was found for the EGFR gene using allelic discrimination; no mutation or deletion was found on exons 18–21 using PCR-HRM and Sanger sequencing. Each microdissected sample was also tested for cancer hotspot mutations on KRAS, BRAF and NRAS genes, and for the T790M EGFR resistanc e mutation, but no mutation was found.
For the analysis of EGFR gene copy-number variation, we used quantitative droplet-digital PCR on DNA extracted from microdissected tumor cells (Figure 2B). In all DFSP and DFSP-T samples studied, the EGFR/RNaseP allele ratio was in the normal range, indicating no significant EGFR allele gain or loss in DFSP center, DFSP infiltrative periphery, or DFSP-T higher-grade sarcoma.
Overall, these results indicated that EGFR expression in DFSP and DFSP-T was not associated with known cancer-associated EGFR gene alterations, whether mutations or copy-number variations.
EGFR and SNAIL are expressed in the same DFSP tumor areas
As EGFR expression in cancer may be linked to the epithelial-mesenchymal transition (EMT), and as EMT may impede the effect of EGFR-directed therapies [12], we analyzed the mRNA and protein expression of EMT factors in DFSP center, DFSP infiltrative periphery and DFSP-T higher-grade sarcoma areas.
A differential pattern of expression was only observed for SNAIL1 and SNAIL2, for both mRNA and protein (Figure 3). There was a significant increase in SNAIL protein expression in DFSP infiltrative periphery compared to DFSP center. When DFSP infiltrative periphery was compared to DFSP-T, there was no significant difference for mRNA (Figure 3), but the percentage of positive cells in immunohistochemistry was significantly higher in DFSP-T (66.8 ± 22% in DFSP periphery vs 90.3 ± 4% in DFSP-T areas; p < 0.05).
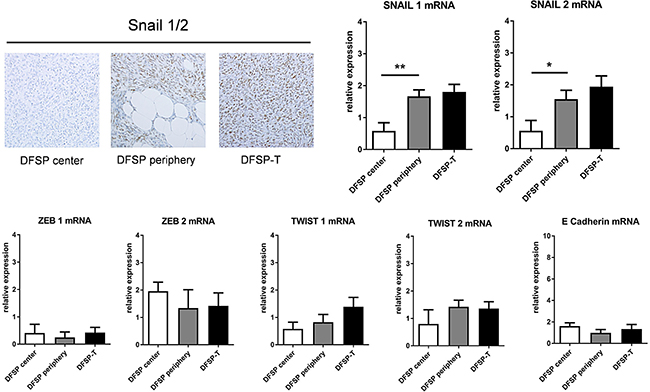
Figure 3: Expression of SNAIL and other epithelial-mesenchymal transition factors in patients with DFSP and DFSP-T. The percentage of SNAIL1/2 positive cells on immunostaining increased in DFSP periphery and DFSP-T compared to DFSP center (upper left). For mRNA , SNAIL 1 and SNAIL 2 increased significantly in DFSP periphery and DFSPT compared to DFSP center (*p < 0.05; **p < 0,01), whereas no significant difference was found for ZEB1, ZEB2, TWIST1, TWIST2 and E Cadherin.
No difference in the patterns of expression was found for TWIST1, TWIST2, ZEB1, ZEB2, or E-Cadherin mRNAs in the 3 microdissected areas (Figure 3). No E-cadherin protein was detected using immunohistochemistry (data not shown).
Altogether, these results indicate that DFSP and DFSP-T had a molecular mesenchymal phenotype, and that no mesenchymal to epithelial transition occurred in DFSP and DFSP-T. In addition, SNAIL expression, as for EGFR, increased in areas of DFSP progression, especially DFSP-T.
EGFR phosphorylation and downstream pathway activation in DFSP
We aimed to analyze whether EGFR expression in DFSP and DFSP-T was associated with EGFR activation through phosphorylation, and to determine which downstream signaling pathways were preferentially activated in DFSP tumor progression. For this, we used a proteome profiler phospho-kinase array on microdissected cryopreserved tissue samples of DFSP infiltrative periphery (n = 3) and DFSP-T higher-grade sarcoma (n =3 ).
EGFR phosphorylation was detected in all cases (mean relative quantity of phosphorylated protein compared to negative control, 2.45 ± 0.66). Among the potential downstream effectors of EGFR signaling, phosphorylation of ERK, STAT5a/b, and TOR was detected (2.60 ± 0.86; 2.52 ± 0.83; 1.87 ± 0.55 respectively), while PLCγ and STAT3 showed only slight phosphorylation (1.15 ± 0.03; 1.16 ± 0.13 respectively).
To analyze the possible signaling relationship between EGFR and ERK, STAT5a/b, STAT3, TOR or PLCγ, we studied the correlation of the phosphorylation levels of EGFR and that of each of these potential downstream effectors (Figure 4A). ERK, STAT3, and PLCγ phosphorylation levels were not correlated to EGFR phosphorylation levels. The phosphorylation levels of STAT5a/b and TOR were positively correlated to EGFR phosphorylation levels (r = 0.87/r = 0.83, p < 0.05; r = 0.95, p < 0.01, respectively).
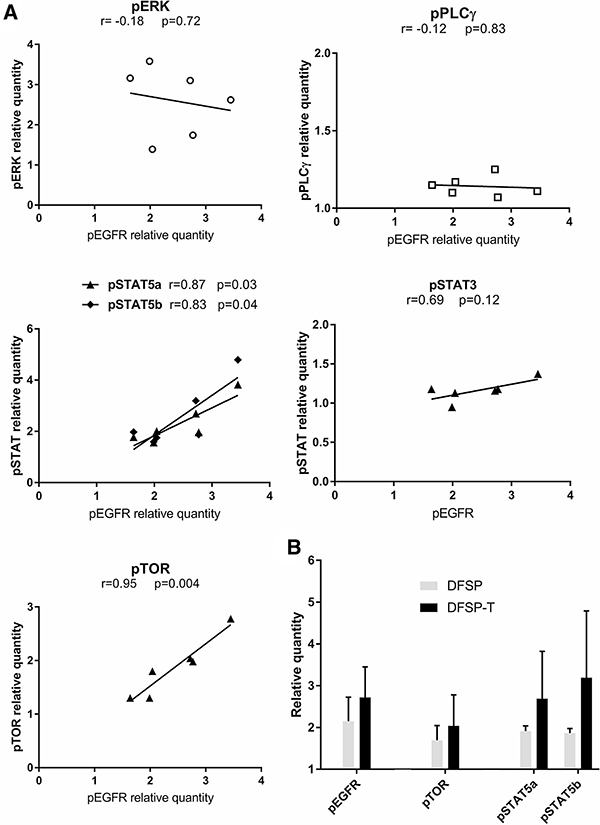
Figure 4: EGFR phosphorylation and downstream pathway activation in DFSP. (A) The correlation analysis between the phosphorylation levels of ERK, PLCγ, STAT5a/b, STAT3 or TOR and the EGFR phosphorylation level showed a significant positive correlation for STAT5a/b and TOR. (B) The relative quantity of phosphorylated protein for EGFR, TOR, STAT5a, and STAT5b increased non-significantly in EGFR+ DFSP-T areas (n = 3) compared to EGFR+ DFSP areas (n = 3).
When we quantified pEGFR, pTOR, and pSTAT5a/b in DFSP samples and DFSP-T samples, all phosphoprotein levels were higher in DFSP-T compared to DFSP (Figure 4B).
EGFR was thus activated in DFSP infiltrative periphery and DFSP-T, and EGFR signaling in DFSP tumor progression preferentially involved TOR and STAT5a/b downstream effectors, but not ERK in the MAPK pathway.
DISCUSSION
We studied here the possible involvement of EGFR expression and signaling in DFSP evolution to high grade sarcoma, using laser-microdissection and tissue-based molecular methods in a series of 22 patients.
We first demonstrated that EGFR mRNA and protein are expressed by tumor cells in a majority of DFSP, preferentially in the areas of local extension and areas of higher-grade sarcoma transformation. Among the 12 previously reported series involving in all 1072 adult soft tissue sarcomas studied for EGFR expression, EGFR was frequently expressed in malignant fibrous histiocytomas, myxofibrosarcomas, synovial sarcomas and malignant peripheral sheath tumors, but few DFSP samples were tested [13–24]: 5 samples were negative in immunohistochemistry (IHC), and 4 others showed EGFR mRNA expression on Northern blot [14,22–24]. The discrepancy in IHC results between the 22 cases in our series and the 5 published cases could be linked to the different antibody clones used for EGFR detection: clone EGFR.113 in the studies by Dobashi et al. [14,24], known to detect a smaller number of positive cases [16], versus clone 31G7 in our study. One strength of our study was that it combined EGFR protein and mRNA detection in the same microdissected areas to provide more reliable results.
In 2005, high levels of EGFR expression in 281 patients with soft tissue sarcomas other than DFSP were significantly associated with the histological grade and with a shorter overall survival [17]. We also found in our 22 DFSP patients that EGFR expression increased with DFSP progression to high grade sarcoma, a known marker of poor prognosis [1, 2]. In our cohort, 2 patients with DFSP-T out of 10 developed metastasis (20%) and 1 died of disease (10%). These rates are in line with published data regarding DFSP evolution in large retrospective epidemiological cohorts: Liang CA et al. reported 14.4% metastasis and 14.7% death from disease in DFSP-T [1] ; Hoesly PM et al. reported 18% metastasis and 0% death from disease [2]. In our 2 DFSP-T patients with metastasis, EGFR expression was present. The low number of metastatic or death events in our cohorts precluded any statistical analysis including this variable. It will be of interest in the future to analyze further the prognostic value of EGFR expression for metastasis or death in DFSP.
We also demonstrated similar patterns for EGFR and SNAIL expression in the areas of DFSP progression to high grade sarcoma. In malignant fibrous histiocytomas, synovial sarcoma and osteosarcomas, SNAIL1 expression has been detected in areas of invasion, and correlated with the grade of the tumor [25,26]. In accordance, the evolution of DFSP to high grade sarcoma has been associated with a transcriptional reprogramming including epithelial-mesenchymal transition-like process, in 5 DFSP and 5 DFSP-T samples [27]. Previous studies have shown that the role of SNAIL is not restricted to triggering EMT in epithelial cells. In fibroblastic cell lines, SNAIL1 overexpression provided tumorigenic potential [28] and was required to drive the invasion of fibroblasts [29]. In soft tissue tumors, SNAIL1 may be expressed by cells with mesenchymal stem cells properties and higher metastatic potential [25]. As in cervical and gastric cancer, SNAIL expression in DFSP may be promoted by EGFR signaling [30–32].
In our 22 cases, as in 275 soft-tissue sarcomas reported elsewhere, EGFR expression was not linked to EGFR activating mutation [33], or to EGFR gene copy-number alteration. In other soft-tissue sarcomas, EGFR is activated through phosphorylation [14,17,19,34]. EGFR amplification is found only in 3.5 to 7% of soft-tissue sarcomas [14,16,24]. In our cases, laser microdissection enabled us to localize EGFR phosphorylation in the areas of DFSP local extension and DFSP-T higher-grade sarcoma. In these areas, EGFR phosphorylation was associated with downstream activation of TOR and STAT5a/b.
To date, few studies have focused on the pathways of EGFR signaling in soft-tissue tumors. As in our study, AKT/TOR pathway was reported to be predominantly activated in association with EGFR expression in 39 bone and soft-tissue tumors [14]. TOR activation was also found in 27 epithelioid sarcoma human samples and 2 cell lines expressing EGFR [19]. In EGFR-positive areas of our DFSP samples, the phosphorylation level of STAT5a/b was elevated. As an alternative cell survival pathway, STAT5a/b has a pro-tumor effect, via overexpression and activation, in head and neck squamous cell carcinomas [35], and EGFR has been shown to activate STAT5a/b in breast cancer cell lines [36–38]. In our DFSP patients, EGFR and STAT5a/b phosphorylation levels were correlated, suggesting that a similar STAT-mediated EGFR signaling could be involved DFSP evolution to high grade sarcoma. To validate our findings using functional studies, we attempted to establish patient derived xenografts of DFSP and DFSP-T primary tumors in nude mice, but the tumors did not engraft. We also attempted to develop primary cell culture from 2 DFSP primary tumor samples, but cells did not survive. In the literature, primary cell culture of DFSP-T was only achieved in one patient using metastatic imatinib-resistant DFSP-T tissue [5]. From our experience, it seems that DFSP or DFSP-T primary tumor biology is not adequate for patient derived xenograft or primary cell culture using conventional methods.
PDGFR-inhibition by imatinib provides clinical benefit in about 50% of DFSP patients, but secondary resistance occurs among the responders [5–9], and other therapeutic options are required. Our findings on EGFR expression, activation, and putative signaling through TOR and STAT5a/b in DFSP progression open fields for new therapeutic options in patients with non-operable or metastatic DFSP. The first test of EGFR inhibition using gefitinib and conventional chemotherapy was active in vitro and in vivo in a human fibrosarcoma cell lines [34], but a phase II clinical trial on gefitinib in EGFR-expressing EGFR-wild type advanced synovial sarcomas had low response rates and short-lived disease control [39]. Recently, preclinical studies combining EGFR blockade with either mTOR or STAT blockade overcame resistance to anti-EGFR monotherapy in EGFR-expressing soft tissue sarcomas and in fibrosarcoma cell line [19, 40].
In conclusion, using laser-microdissection and tissue-based molecular methods in 22 patients with DFSP, we found that EGFR was involved in DFSP progression to DFSP-T, associated with SNAIL overexpression, and mTOR and STAT5a/b signaling. These novel insights into the biology of DFSP tumor progression could help to optimize future clinical trials and could lead on to new targeted therapies for advanced DFSP.
MATERIALS AND METHODS
Patients and samples
Twenty-two patients with DFSP or transformed DFSP (DFSP-T) from a single university hospital (Hôpital Saint Louis) diagnosed between 2002 and 2015 were included in the study. They had enough formalin-fixed paraffin embedded and frozen tumor material remaining after the diagnosis had been established. All patients were informed that part of the remaining tissue material could be used for research, and gave their consent according to the declaration of Helsinki and to the French law. Samples were obtained from the Tumorothèque of the Hôpital Saint Louis. All samples were taken at diagnosis, before any medical treatment of the disease. Among the 22 patients, 12 had DFSP and 10 had DFSP-T (fibrosarcomatous or an undifferentiated pleomorphic variant) at diagnosis. Diagnoses were performed according to the latest 2013 WHO criteria, and validated in the French Sarcoma Pathology Network.
In situ EGFR and mesenchymal-epithelial transition protein immunostaining
Immunohistochemical analyses were carried out on formalin-fixed paraffin-embedded (FFPE) tissue sections. An indirect immunoperoxidase method using anti-human EGFR mouse monoclonal antibody (clone 31G7, Abcam, Cambridge, UK) as the primary antibody was performed on 4 μm-thick tissue sections. Universal Secondary Antibody (Roche Diagnostics, Meylan, France) was used as the secondary antibody, and the DabMap kit (Roche Diagnostics) was used for detection. Appropriate controls with non-relevant isotype antibody and with omission of the primary antibody were implemented. Epidermal cells with a strong membrane expression of EGFR were used as a positive internal control.
Each section was examined at ×400 magnification on five randomly chosen fields in the central area of the tumor and five randomly chosen fields in the infiltrative periphery of the tumor. A ProvisBX51 light microscope (Olympus, Tokyo, Japan) was used, providing a field size of 0.344 mm2 at ×400 magnification. All samples were assessed independently by two investigators. The percentage of EGFR-expressing cells among all tumor cells in each field was calculated. Results were expressed as mean ± standard error of the mean (SEM).
The same method was used for the detection and quantification of Snail1/2 and E-cadherin expression. The primary antibodies were respectively anti-Snail/Slug rabbit polyclonal antibody (ab85936, 1/50 dilution, Abcam, Cambridge, UK) and anti-human E-cadherin mouse monoclonal antibody (clone HECD-1, 1/100 dilution, Abcam).
Laser microdissection and nucleic acid extraction
Monocellular laser-microdissection of tumor cells from the EGFR-negative central DFSP area, the EGFR-positive peripheral invasive DFSP area, and the EGFR-positive higher-grade sarcoma DFSP-T area, was performed on 7-μm thick FFPE tissue sections using a Zeiss Microdissection and Pressure Catapulting system (Zeiss, Munich, Germany). A minimum of 1000 cells were microdissected for DNA studies for each area, corresponding to a minimum surface area of 228 000 μm². Total DNA was extracted from the microdissected cells using DNeasy-Mini-Kit (Qiagen, Courtaboeuf, France).
For RNA studies, monocellular laser-microdissection was performed in the same areas, and total RNA was extracted from the laser-microdissected cells using miRNeasy kit (Qiagen). DNA and RNA were qualified and quantified using spectrometric assay (Nanodrop ND-1000, Thermo Scientific, Wilmington, USA).
Cancer hotspot mutation analyses for EGFR, KRAS, NRAS and BRAF genes
Cancer hotspot mutation analyses were performed on microdissected cells from each area using: allelic discrimination method on an LC480 system (Roche) for KRAS G12S, G12R, G12C, G12D, G12A, G12V, G13D mutations, EGFR L858R, T790M mutations, BRAF V600E mutation; high-resolution melting (HRM) PCR mutation screening on LC480 system (Roche) for KRAS exons 2, 3, 4, NRAS exons 2,3, EGFR exons 18, 21, and BRAF exon 15; Sanger sequencing on an ABI3130 DNA sequencer (Applied Biosystems, Darmstadt, Germany) for each suspected mutation after HRM-PCR, and systematically for EGFR exons 19 and 20.
Droplet-digital quantitative PCR for DNA copy number and RNA expression analyses
For EGFR gene copy number analyses on microdissected cells, the Droplet Digital Polymerase Chain Reaction (ddPCR) was performed using the QX100 ddPCR workflow system (Biorad, Hercules, CA, USA). The mix contained 20 ng of genomic DNA from microdissected cells, 10 μl of So Fast Eva Green Supermix (Bio Rad), 1 μl of EGFR probes (Hs00538812-cn, Life Technologies, Foster City, USA) and 1μl RnaseP probes (Taqman® copy number Reference Assay, 4403326, Life Technologies) per well and the final volume for the reaction was 20 μl. Droplets were generated by a QX200 Droplet Generator (Biorad). PCR was carried out on the CFX96 Real Time System (Bio Rad). PCR was performed with an initial denaturing step at 95°C for 10mn, followed by 40 cycles of denaturing (95°C for 15s), and annealing (60°C for 1 mn). A post-amplification melting curve program was initiated by heating to 98°C for 10 mn and then cooling down to 12°C. Each PCR run included a no-template control. The results of ddPCR were generated using QX100 Droplet Reader (Biorad), and analysed using QuantaSoft software (Biorad). The ratio of EGFR positive droplets to RnaseP positive droplets was calculated for each sample. A ratio of 0.8–1.2 was considered as a normal copy number of the EGFR gene.
For RNA expression, quantitative analyses were carried out using a two-step reverse transcription ddPCR with the QX100 ddPCR workflow system (Biorad). Total RNA from the microdissected cells was converted into cDNA using the GoScript Reverse Transcription system (Promega, Madison, WI, USA). For the ddPCR, the following probes were used: EGFR (Hs01076090-m1), SNAIL1 (Hs00195591-m1), SNAIL2 (Hs00950344-m1), Twist 1 (Hs01675818-s1), Twist 2 (Hs02379973-s1), Zeb1 (Hs00232783-m1), Zeb2 (Hs00207691-m1), and E-Cadherin (Hs01023894, all from Life Technologies). Droplet generation and PCR amplification were carried out as described above. Expression levels were evaluated using the QuantaSoft software, comparing the number of positive droplets for the gene of interest to the number of positive droplets for the endogenous control gene TATA-Binding Protein (TBP, Hs00427620m1, Life Technologies), in each sample.
Protein phosphorylation array analysis of EGFR and downstream signalling pathways
The phosphorylation of surface and intracellular proteins was studied using the Proteome Profiler Human Phospho-Kinase Array kit (ARY003B, R&D systems, Minneapolis, MN, USA) on laser microdissected cells from invasive areas of 3 DFSP frozen-tissue samples and higher-stage sarcoma areas of 3 DFSP-T frozen tissue samples.
Tumor lysate samples were centrifuged, and the supernatant placed in a new tube and used for further steps. The amount of lysate loaded into each array was 365μg. The array kit was run according to the product instructions. Pixel density analysis was performed on a 10min film exposure, providing the mean pixel density of each spot. The relative quantity of each phosphorylated protein was calculated from: mean pixel density of the phosphoprotein duplicate spots / mean pixel density of the PBS negative control duplicate spots.
Statistics
Quantitative values were compared using Student’s t-test (two-tailed) or Pearson’s r-correlation test with the GraphPad Prism 7 software (GraphPad software, La Jolla, CA, USA). P values under 0.05 were considered significant. Results are displayed in bar graphs representing mean ± standard error of the mean (SEM) or as linear regressions for data for correlation studies.
Author contributions
A Osio, S Xu, M El Bouchtaoui, C Leboeuf, G Gapihan and M Battistella collected data, collated data and carried out experiments. M Battistella, G Bousquet and A Janin designed experiments and analyzed the data. All authors were involved in writing the paper and had final approval of the submitted and published versions.
ACKNOWLEDGMENTS
We thank Mrs Angela Swaine-Verdier for English language editing. We thank the Tumorothèque, Hôpital Saint Louis, for tissue banking.
CONFLICTS OF INTEREST
None to disclose.
FUNDING
This work was supported by INCa subvention for rare cancers, INSERM, and Université Paris 7. No grant number is applicable.
REFERENCES
1. Liang CA, Jambusaria-Pahlajani A, Karia PS, Elenitsas R, Zhang PD, Schmults CD. A systematic review of outcome data for dermatofibrosarcoma protuberans with and without fibrosarcomatous change. J Am Acad Dermatol. 2014; 71:781–786.
2. Hoesly PM, Lowe GC, Lohse CM, Brewer JD, Lehman JS. Prognostic impact of fibrosarcomatous transformation in dermatofibrosarcoma protuberans: a cohort study. J Am Acad Dermatol. 2015; 72:419–425.
3. Thway K, Noujaim J, Jones RL, Fisher C. Dermatofibrosarcoma protuberans: pathology, genetics, and potential therapeutic strategies. Ann Diagn Pathol. 2016; 25:64–71.
4. Sirvent N, Maire G, Pedeutour F. Genetics of dermatofibrosarcoma protuberans family of tumors: from ring chromosomes to tyrosine kinase inhibitor treatment. Genes Chromosomes Cancer. 2003; 37:1–19.
5. Eilers G, Czaplinski JT, Mayeda M, Bahri N, Tao D, Zhu M, Hornick JL, Lindeman NI, Sicinska E, Wagner AJ, Fletcher JA, Mariño-Enriquez A. CDKN2A/p16 Loss Implicates CDK4 as a Therapeutic Target in Imatinib-Resistant Dermatofibrosarcoma Protuberans. Mol Cancer Ther. 2015; 14:1346–1353.
6. McArthur GA, Demetri GD, van Oosterom A, Heinrich MC, Debiec-Rychter M, Corless CL, Nikolova Z, Dimitrijevic S, Fletcher JA. Molecular and clinical analysis of locally advanced dermatofibrosarcoma protuberans treated with imatinib: Imatinib Target Exploration Consortium Study B2225. J Clin Oncol. 2005; 23:866–873.
7. Ugurel S, Mentzel T, Utikal J, Helmbold P, Mohr P, Pföhler C, Schiller M, Hauschild A, Hein R, Kämpgen E, Kellner I, Leverkus M, Becker JC, et al. Neoadjuvant imatinib in advanced primary or locally recurrent dermatofibrosarcoma protuberans: a multicenter phase II DeCOG trial with long-term follow-up. Clin Cancer Res. 2014; 20:499–510.
8. Kerob D, Porcher R, Vérola O, Dalle S, Maubec E, Aubin F, D’Incan M, Bodokh I, Boulinguez S, Madelaine-Chambrin I, Mathieu-Boue A, Servant JM, de Kerviler E, et al. Imatinib mesylate as a preoperative therapy in dermatofibrosarcoma: results of a multicenter phase II study on 25 patients. Clin Cancer Res. 2010; 16:3288–3295.
9. Stacchiotti S, Pantaleo MA, Negri T, Astolfi A, Tazzari M, Dagrada GP, Urbini M, Indio V, Maestro R, Gronchi A, Fiore M, Dei Tos AP, Conca E, et al. Efficacy and biological activity of imatinib in metastatic dermatofibrosarcoma protuberans (DFSP). Clin Cancer Res. 2016; 22:837–846.
10. Ceresa BP, Peterson JL. Cell and molecular biology of epidermal growth factor receptor. Int Rev Cell Mol Biol. 2014; 313:145–178.
11. Mitsudomi T, Yatabe Y. Epidermal growth factor receptor in relation to tumor development: EGFR gene and cancer. FEBS J. 2010; 277:301–308.
12. Chong CR, Janne PA. The quest to overcome resistance to EGFR-targeted therapies in cancer. Nat Med. 2013; 19:1389–400.
13. Barbashina V, Benevenia J, Aviv H, Tsai J, Patterson F, Aisner S, Cohen S, Fernandes H, Skurnick J, Hameed M. Oncoproteins and proliferation markers in synovial sarcomas: a clinicopathologic study of 19 cases. J Cancer Res Clin Oncol. 2002; 128:610–616.
14. Dobashi Y, Suzuki S, Sugawara H, Ooi A. Involvement of epidermal growth factor receptor and downstream molecules in bone and soft tissue tumors. Hum Pathol. 2007; 38:914–25.
15. Gusterson B, Cowley G, McIlhinney J, Ozanne B, Fisher C, Reeves B. Evidence for increased epidermal growth factor receptors in human sarcomas. Int J Cancer. 1985; 36:689–693.
16. Kersting C, Packeisen J, Leidinger B, Brandt B, von Wasielewski R, Winkelmann W, van Diest PJ, Gosheger G, Buerger H. Pitfalls in immunohistochemical assessment of EGFR expression in soft tissue sarcomas. J Clin Pathol. 2006; 59:585–590.
17. Sato O, Wada T, Kawai A, Yamaguchi U, Makimoto A, Kokai Y, Yamashita T, Chuman H, Beppu Y, Tani Y, Hasegawa T. Expression of epidermal growth factor receptor, ERBB2 and KIT in adult soft tissue sarcomas: a clinicopathologic study of 281 cases. Cancer. 2005; 103:1881–1890.
18. Thomas DG, Giordano TJ, Sanders D, Biermann S, Sondak VK, Trent JC, Yu D, Pollock RE, Baker L. Expression of receptor tyrosine kinases epidermal growth factor receptor and HER-2/neu in synovial sarcoma. Cancer. 2005; 103:830–838.
19. Xie X, Ghadimi MP, Young ED, Belousov R, Zhu QS, Liu J, Lopez G, Colombo C, Peng T, Reynoso D, Hornick JL, Lazar AJ, Lev D. Combining EGFR and mTOR blockade for the treatment of epithelioid sarcoma. Clin Cancer Res. 2011; 17:5901–5912.
20. Yang JL, Hannan MT, Russell PJ, Crowe PJ. Expression of HER1/EGFR protein in human soft tissue sarcomas. Eur J Surg Oncol. 2006; 32:466–468.
21. Perosio PM, Brooks JJ. Expression of growth factors and growth factor receptors in soft tissue tumors. Implications for the autocrine hypothesis. Lab Invest. 1989; 60:245–253.
22. Duda RB, Cundiff D, August CZ, Wagman LD, Bauer KD. Growth factor receptor and related oncogene determination in mesenchymal tumors. Cancer. 1993; 71:3526–3530.
23. Nielsen TO, Hsu FD, O’Connell JX, Gilks CB, Sorensen PH, Linn S, West RB, Liu CL, Botstein D, Brown PO, van de Rijn M. Tissue microarray validation of epidermal growth factor receptor and SALL2 in synovial sarcoma with comparison to tumors of similar histology. Am J Pathol. 2003; 163:1449–1456.
24. Dobashi Y, Takei N, Suzuki S, Yoneyama H, Hanawa M, Ooi A. Aberration of epidermal growth factor receptor expression in bone and soft-tissue tumors: protein overexpression, gene amplification and activation of downstream molecules. Mod Pathol. 2004; 17:1497–1505.
25. Alba-Castellon L, Batlle R, Franci C, Fernandez-Aceñero MJ, Mazzolini R, Peña R, Loubat J, Alameda F, Rodriguez R, Curto J, Albanell J, Muõz A, Bonilla F, et al. Snail1 expression is required for sarcomagenesis. Neoplasia. 2014; 16:413–421.
26. Lv YF, Dai H, Yan GN, Meng G, Zhang X, Guo QN. Downregulation of tumor suppressing STF cDNA 3 promotes epithelial-mesenchymal transition and tumor metastasis of osteosarcoma by the Wnt/GSK-3beta/beta-catenin/Snail signaling pathway. Cancer Lett. 2016; 373:164–173.
27. Stacchiotti S, Astolfi A, Gronchi A, Fontana A, Pantaleo MA, Negri T, Brenca M, Tazzari M, Urbini M, Indio V, Colombo C, Radaelli S, Brich S, et al. Evolution of dermatofibrosarcoma protuberans to DFSP-derived fibrosarcoma: an event marked by epithelial-mesenchymal transition like process and 22q loss. Mol Cancer Res. 2016; 14 :820–829.
28. Batlle R, Alba-Castellon L, Loubat-Casanovas J, Armenteros E, Franci C, Stanisavljevic J, Banderas R, Martin-Caballero J, Bonilla F, Baulida J, Casal JI, Gridley T, Garcia de Herreros A. Snail1 controls TGF-beta responsiveness and differentiation of mesenchymal stem cells. Oncogene. 2013; 32:3381–3389.
29. Rowe RG, Li XY, Hu Y, Saunders TL, Virtanen I, Garcia de Herreros A, Becker KF, Ingvarsen S, Engelholm LH, Bommer GT, Fearon ER, Weiss SJ. Mesenchymal cells reactivate Snail1 expression to drive three-dimensional invasion programs. J Cell Biol. 2009; 184:399–408.
30. Luo BH, Xiong F, Wang JP, Li JH, Zhong M, Liu QL, Luo GQ, Yang XJ, Xiao N, Xie B, Xiao H, Liu RJ, Dong CS, et al. Epidermal growth factor-like domain-containing protein 7 (EGFL7) enhances EGF receptor-AKT signaling, epithelial-mesenchymal transition, and metastasis of gastric cancer cells. PLoS One. 2014; 9:e99922.
31. Lee MY, Chou CY, Tang MJ, Shen MR. Epithelial-mesenchymal transition in cervical cancer: correlation with tumor progression, epidermal growth factor receptor overexpression, and snail up-regulation. Clin Cancer Res. 2008; 14:4743–4750.
32. Li Q, Bao W, Fan Q, Shi WJ, Li ZN, Xu Y, Wu D. Epidermal growth factor receptor kinase substrate 8 promotes the metastasis of cervical cancer via the epithelial-mesenchymal transition. Mol Med Rep. 2016; 14:3220–3228.
33. Baird K, Davis S, Antonescu CR, Harper UL, Walker RL, Chen Y, Glatfelter AA, Duray PH, Meltzer PS. Gene expression profiling of human sarcomas: insights into sarcoma biology. Cancer Res. 2005; 65:9226–9235.
34. Ren W, Korchin B, Zhu QS, Wei C, Dicker A, Heymach J, Lazar A, Pollock RE, Lev D. Epidermal growth factor receptor blockade in combination with conventional chemotherapy inhibits soft tissue sarcoma cell growth in vitro and in vivo. Clin Cancer Res. 2008; 14:2785–2795.
35. Kalyankrishna S, Grandis JR. Epidermal growth factor receptor biology in head and neck cancer. J Clin Oncol. 2006; 24:2666–2672.
36. Olayioye MA, Beuvink I, Horsch K, Daly JM, Hynes NE. ErbB receptor-induced activation of stat transcription factors is mediated by Src tyrosine kinases. J Biol Chem. 1999; 274:17209–17218.
37. Silva CM. Role of STATs as downstream signal transducers in Src family kinase-mediated tumorigenesis. Oncogene. 2004; 23:8017–8023.
38. Quesnelle KM, Boehm AL, Grandis JR. STAT-mediated EGFR signaling in cancer. J Cell Biochem. 2007; 102:311–319.
39. Ray-Coquard I, Le Cesne A, Whelan JS, Schoffski P, Bui BN, Verweij J, Marreaud S, van Glabbeke M, Hogendoorn P, Blay JY. A phase II study of gefitinib for patients with advanced HER-1 expressing synovial sarcoma refractory to doxorubicin-containing regimens. Oncologist. 2008; 13:467–473.
40. Wang X, Goldstein D, Crowe PJ, Yang M, Garrett K, Zeps N, Yang JL. Overcoming resistance of targeted EGFR monotherapy by inhibition of STAT3 escape pathway in soft tissue sarcoma. Oncotarget. 2016; 7:21496–21509. https://doi.org/10.18632/oncotarget.7452.