
INTRODUCTION
Cancer has become a huge burden for our society. According to the GLOBOCAN 2012 estimates, there were about 14.1 million newly diagnosed cases of cancer and 8.2 million cases of cancer-related deaths in the world [1]. Although more than half of the cancer patients receive the treatment of cytotoxic agents, marked tumor heterogeneity leads to variable responses even for tumors with the same staging and cytopathologic characteristics. Thus, it is crucial to accurately evaluate early tumor response to treatment in order to prevent unnecessary chemotherapy and for timely implementation of new therapeutic strategies.
Response Evaluation Criteria in Solid Tumors (RECIST) are the standard most often utilized to evaluate tumor response to chemotherapy, which relies on morphological measurements of tumor size based on CT or MRI examination [2]. However, reduction in tumor size often takes several weeks or months to be measurable after initiation of treatment. Functional imaging modalities have been used to detect alterations in the perfusion or metabolism of the tumors and often provide valuable information earlier during therapy [3-5]. However, these imaging techniques are variously limited by their cost, the patient’s risk of radiation exposure, and the need for contrast agents.
Changes in tumor metabolism, perfusion, receptor expression, and survival (apoptosis and/or necrosis) are common responses to chemotherapy that occur far earlier than changes in tumor volume [6]. Cancer cell death in the early stage of therapy has been demonstrated to be an effective indicator to predict treatment outcome in both preclinical and clinical studies [7, 8]. Currently, histological analysis is the standard methods to detect cancer cell death, however, this method needs to acquire tissue samples through biopsy which is invasive. Since effective treatment would lead to the reduction in cancer cell density, water apparent diffusion coefficient measured by diffusion-weighted magnetic resonance imaging (DW-MRI) has been showed to be increased in the treatment responder in clinical studies [9, 10]. However, in order to evaluate tumor response to treatments, repeated and dynamic examinations are required which limits the clinical utilization of DW-MRI since the cost of MRI is relative high. Comparing with other imaging technique using in assessing tumor response to chemotherapy, ultrasonography has the advantages as no ionizing radiation, easy availability, portability and relative low cost of ultrasound equipment. Based on the analysis of the ultrasonic radiofrequency (RF) data, quantitative analysis of the ultrasonic spectrum has been employed to collect information of tissue microstructures. In previous studies, this noninvasive technique has been used to diagnose some disease such as the anisotropy of myocardial structures, ocular tumors, and prostate cancer and to evaluate cancer cell apoptosis caused by anticancer therapies in mice tumor models [11-16]. Our previous study showed that quantitative analysis of the ultrasonic spectrum could be used to evaluate tumor response to cytotoxic therapy by characterizing tumor microstructure changes [17]. Unlike ultrasonic spectral analysis of a single frame, ultrasound RF time series is calculated through analyzing sequence of RF echoes continuously acquired from one stationary tissue location within a few seconds. Previous studies showed that RF time series had higher accuracy, sensitivity, and specificity in tissue typing in comparison with spectrum analysis of only one frame of RF data [18]. Past research also showed that when a location in the tissue receives repetitive irradiation of sequential ultrasound, the signal of RF time series backscattered from the location would carry information regarding “tissue characteristic” [19], and that changes in the magnitude of RF signal over time in the sample location depend on tissue microstructure [20]. Although the mechanisms responsible for these effects are not fully understood, it has been shown that variations in ultrasound backscattering are related to changes in both ultrasound speed and tissue temperature which occurs in the course of the ultrasonic RF time series scanning procedure, and depend in turn on tissue properties [21]. Ultrasonic RF time series has been utilized for the diagnosis of breast and prostate tumors, and to monitor changes after tissue ablation, with promising preliminary results [22-24]. However, as far as we know, no study has so far been published addressing the application of ultrasonic RF time series in the evaluation of early tumor response to the treatment of cytotoxic agents. Therefore, this study aimed to assess whether ultrasonic RF time series could be used to assess early tumor response to conventional chemotherapy in a mice breast cancer models.
RESULTS
Assessment of tumor growth
Tumor volume didn’t significantly differ between control and chemotherapy-treated mice on days 0 and 3. On days 6 and 8, tumor volumes from treated mice were significantly smaller than control tumors (day 6: control group = 1.05 ± 0.38 cm3, treatment group = 0.59 ± 0.24 cm3, P < 0.01; day 8, control group = 1.68 ± 0.78 cm3, treatment group = 0.59 ± 0.23 cm3, P < 0.01) (Figure 1).
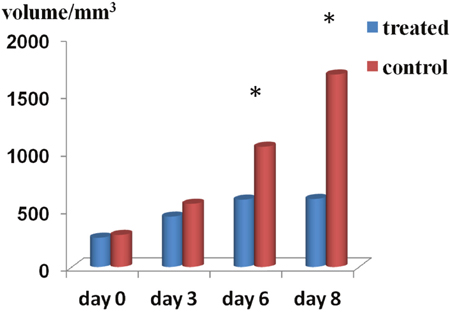
Figure 1: Tumor volume changes. Summary bar graphs show that treatment with cisplatin and paclitaxel significantly reduced tumor growth on days 6 and 8 as compared with control tumors (*P < 0.01).
Changes in ultrasonic RF time series features
Significant differences were observed when comparing RF time series features of tumors from treated and control mice on days 3, 6, and 8 (P < 0.05). Significantly increased intercept, S1, S2, S3, and S4 values, as well as decreased slope, were registered for treated tumors (P < 0.01) at those three time points (Figure 2). Compared to baseline (day 0), intercept, S1, and S2 increased significantly, while the slope was significantly decreased (P < 0.01) on days 3, 6, and 8 in the treatment group. In contrast, no significant changes occurred in the 6 ultrasonic spectral features on days 3, 6, and 8 in the control group. We noticed that RF time series features demonstrated significant variations on day 3 after treatment, namely 3 days before differences in tumor size could be readily measured by conventional imaging.
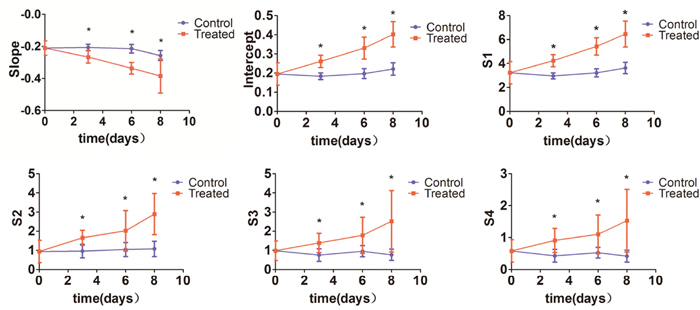
Figure 2: Changes in ultrasonic RF time series features. Intercept, S1, S2, S3 and S4 were significantly increased, and slope was significantly decreased in tumors from chemotherapy-treated mice compared with control tumors on days 3, 6, and 8 (*P < 0.01).
Histological changes
In the control tumors, tumor cell density did not significantly differ on days 3, 6, and 8 in comparison with day 0, while in samples from the treated tumors, treatment with cisplatin and paclitaxel significantly decreased tumor cell density on days 3, 6, and 8 relative to day 0 (P < 0.05). Compared with control, chemotherapy treatment significantly reduced tumor cell density on days 3, 6, and 8. Additional microstructural changes, involving nuclear condensation and fragmentation were also revealed by H&E staining in tumor specimens from chemotherapy-treated mice (Figure 3).
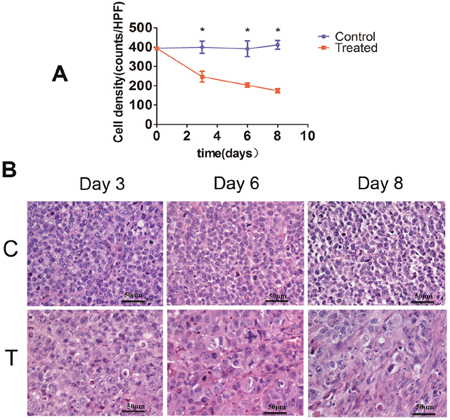
Figure 3: Histopathological analysis of tumor cell density. (A) Bar graph summarizing changes in tumor cell density in control and treatment groups. (*P < 0.01). (B) Representative tissue micrographs showing substantially decreased tumor cell density in samples from chemotherapy-treated mice (T) as compared with control mice (C) receiving vehicle on days 3, 6, and 8. (Scale bars: 50 μm).
Correlation between ultrasonic RF time series features and histological results
A negative correlation was observed between tumor cell density and intercept (r = −0.84, P < 0.01), S1 (r = −0.84, P < 0.01), S2 (r = −0.70, P < 0.01), S3 (r = −0.66, P < 0.01), and S4 (r = −0.67, P < 0.01). In contrast, there was positive correlation between tumor cell density and slope (r = 0.67, P < 0.01) (Figure 4).
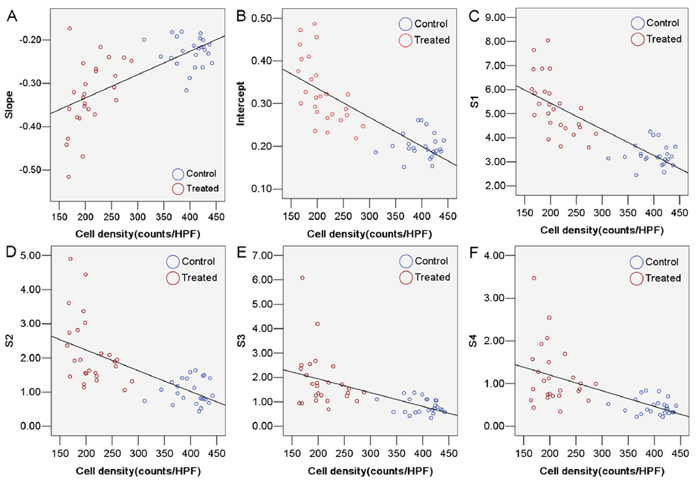
Figure 4: Correlation between tumor cell density and ultrasonic RF time series features. (A) slope (r = 0.67, P < 0.01). (B) intercept (r = −0.84, P < 0.01). (C) S1 (r = −0.84, P < 0.01). (D) S2 (r = −0.70, P < 0.01). (E) S3 (r = −0.66, P < 0.01). (F) S4 (r = −0.67, P < 0.01).
DISCUSSION
This study was designed to evaluate the feasibility of ultrasonic RF time series in the assessment of early tumor response to combination chemotherapy with cisplatin and paclitaxel in a subcutaneous breast cancer model in mice. With the use of tumor size and tumor cell nuclei density as end-point measurements, our results revealed that ultrasonic RF time series data showed good correlation with longitudinal treatment response following chemotherapy. Whereas conventional imaging could detect the differences in tumor size by day 6, changes in ultrasound RF time series parameters were evident just 3 days after treatment. Paralleling these changes, histopathology revealed significant chemotherapy-induced alterations in tumor microstructure.
Early monitoring of tumor response to anticancer therapy is crucial to prevent further unnecessary therapy and to help determining new treatment choices. For a long time, the Response Evaluation Criteria in Solid Tumors (RECIST), which relies on CT- or MRI-based morphological measurements, has been widely applicated for evaluation of clinical responses [2, 25]. However, since the tumor shrinkage occurs late in the course of treatment, it is hard to be determined early tumor response to chemotherapy based on conventional radiographic modalities [26]. Therefore, there is a strong need to develop and validate reliable imaging techniques for this purpose.
Cancer cell death in the early stage of therapy has been demonstrated to be an effective indicator to predict treatment outcome in both preclinical and clinical studies [7, 8]. Owing to tumor cell death, tumor cell density would significantly decrease after treatment [27] and this reduction has become a hallmark of early tumor response to chemotherapy [6]. In this study, the decrease in tumor cell density was the most significant changes in tumor microstructure after treatment, which could be detected just 3 days following treatment initiation. Previous clinical studies showed that these changes were also found in breast cancer which was response to neoadjuvant chemotherapy [27, 28]. Due to the decrease in tumor cell density, apparent diffusion coefficient of water measured by diffusion-weighted MRI has been shown to be increased in patients with breast [29, 30] and ovarian cancers which was response to chemotherapy [10], soon after treatment (within 2–4 days) and before changes in tumor volume could be measureable. However, the application MRI in assessing tumor response to chemotherapy is limited due to its relative high cost.
Ultrasound imaging offers some major advantages, i.e. relatively low cost, wide availability and portability, and no risk of exposing to radiation in comparison to other imaging modalities utilized to assess tumor response to treatment. Ultrasound have been used for tissue characterization since the early 70’s by quantitatively analyzing the RF signal backscattered from the tissue [31]. The usefulness of ultrasonic spectrum analysis of single RF frame data in assessing tumor response to radiotherapy [15] and chemotherapy [32] has been investigated by parallel analyses of tissue microstructural changes. RF time series analysis, which is calculated through analyzing sequence of RF echoes continuously acquired from one stationary tissue location within a few seconds, has been proposed as a new tissue characterizing technique for tissue typing to enable cancer detection (18, 21, 23). Although both features extracted from RF time series and features of spectrum analysis are calculated from the ultrasound RF signals, the principles underlined above two means are different, as features of spectrum analysis are computed from only one single frame of RF data, while the features of RF time series are calculated from sequence of ultrasound RF echoes that originate from a constant tissue location and depth [18]. Hence, an advantage of RF time series analysis over single-frame spectrum analysis is that in the former there is no need for signal compensation to account for depth-dependent effects [33].
Ultrasound beams undergo scattering and will be absorbed by tissue when propagating through tissue. Moradi and his colleagues proposed that when a location in the tissue receives repetitive irradiation of sequential ultrasound, the signal of RF time series backscattered from the location would carry information regarding “tissue characteristic”. Their study showed that compared to traditional ultrasonic spectral features and texture analysis of B-scan, RF time series was superior in detecting prostate cancer. The area under the receiver operating characteristic curve of RF time series was 0.87, which was significantly higher than traditional ultrasonic spectral analysis (0.78) and the texture analysis (0.72) [18]. The potential reasons underlining the improved performance might be due to the changes in temperature and sound speed caused by continuous sonification of the frame sequences [22]. The absorption of the mechanical energy of the ultrasound beams in the tissue will induce thermal effects and potentially cause a small increase in the temperature, which will change the ultrasound speed and induce a time shift in receiving the ultrasound signal backscattering from the tissue. The increase in the temperature due to ultrasound propagation depends on the thermal properties of tissue and varies from one to another [22].
Our study has several limitations. For instance, it was hard to exactly match the imaging plane on ultrasound system with the pathological section since the ultrasound transducer is much thicker than the histopathological section. However, as tumor microstructures seen on HE staining were mostly homogenous, this should have not led to significantly bias. Quantification of the ultrasonic features with three dimensional transducers which covered the whole tumor area could improve the definition of the features calculated from the sequential RF data to better correlate them with concomitant pathological changes. Second, ultrasound attenuation during propagating in the tissue was not made up for in the current study since tumors were located subcutaneously and we placed the ROI center at about 0.2 cm under the skin. It was reasonable to think the results would not be significantly changed even if the ultrasound attenuation of a 6 MHz transducer was compensated. Third, no comparison was made between ultrasonic RF time series and single frame spectrum analysis, although previous studies had showed that ultrasonic RF time series had higher accuracy, sensitivity, and specificity in tissue characterization compared with ultrasonic spectrum analysis of a single RF frame (18, 23, 33). Nevertheless, further studies are needed to fully characterize and compare the performance of these two imaging modalities during early assessment of chemotherapy response.
In conclusion, our preclinical study suggested that ultrasonic RF time series offered a simple way to noninvasively detect early tumor microstructure changes post chemotherapy with the use of a clinical ultrasound system. In line with previous reports, we propose that ultrasonic RF time series could be utilized for early evaluation of tumor response to conventional chemotherapy before changes in tumor volume become detectable without contrast agent injection.
MATERIALS AND METHODS
Cell line and tumor implantation
This study was approved by the Committee on the Ethics of Animal Experiments of the Sun Yat-Sen University and followed the Guide for the Care and Use of Laboratory Animals of the National Institutes of Health. The human breast cancer cell line MCF-7 was obtained from the State Key Laboratory of Oncology in Southern China. Cells were grown in DMEM (HyClone Co., UT, USA) supplemented with 10% fetal bovine serum (Gibco, Grand Island, NY, USA), penicillin (50 U/ml), and streptomycin (50 μg/ml) at 37°C in a humidified 5% CO2 atmosphere. For inoculation, approximately 5 × 10⁷ MCF-7 cells suspended in phosphate-buffered saline were injected subcutaneously into the right chest wall of 5- to 6-week-old BALB/c female nude mice.
Experimental design
A total of 55 mice were used for the experiments. After implantation MCF-7 tumors were allowed to grow for 14 days, until their longest diameter reached ~8-10 mm. The first-dose chemotherapy time point was referred to as day 0. At this point, 5 untreated mice were randomly chosen for ultrasonic examination, and their tumors then excised for histopathological analysis. The remaining mice were randomized into a treatment group (n = 26) and a control group (n = 24). The mice in the treatment group received combination chemotherapy with cisplatin (2 mg/kg.d-1, Mayne Pharma Pty Ltd, Salisbury, Australia) and paclitaxel (10 mg/kg.d-1, Bristol-Myers Squibb, Italy) by intraperitoneal injection once daily for 3 days. The mice in the control group received vehicle (sterile saline) with the same timing and dosing schedule. After the last dose, ultrasound imaging was performed on days 3, 6, and 8. On days 3 and 6, 8 mice from the control group and 9 mice from the treatment group were sacrificed after ultrasound imaging and tumors were excised for histopathological analysis. On day 8, the same procedures were carried out in the remaining 16 mice (8 mice per group) (Figure 5).
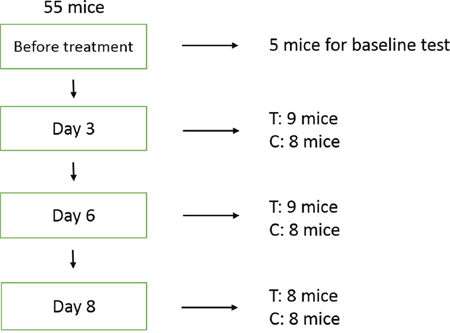
Figure 5: Experimental design. Five mice were randomly chosen for baseline evaluation prior to treatment. On days 3 and 6, 8 mice from the control group and 9 mice from the treatment (chemotherapy) group were sacrificed after ultrasound imaging and tumors were excised for histopathologic analysis. The same procedures were performed on day 8 on the remaining 16 mice (8 mice per group). T: treatment; C: control.
Ultrasound data acquisition
Ultrasound imaging was performed on days 0, 3, 6, and 8. Each mouse was anesthetized by intraperitoneal injection of pentobarbital sodium at a dose of 75 mg/kg (Sigma, St. Louis, MO, USA) before imaging. Centrifuged gel was used to minimize bubble formation in the gel and a stand-off gel pad was placed on the skin for scanning. A commercially available clinical ultrasound scanner, Sonix TOUCH (Ultrasonix Medical Corporation, Richmond, Canada) with an L14–5/38 ultrasound transducer at a center frequency of 6 MHz was used to simultaneously collect B-mode tumor images and RF data. For data acquisition, the ultrasound transducer was positioned such that the focal zone was at the same depth in each imaged specimen to control for any potential attenuation. All RF data were sampled with mechanical index of 0.25, frame rate of 33 Hz, dynamic range of 76 dB, and imaging depth of 2.5 cm. Imaging settings, including TGC, gain, power, and sampling rate were identical in all imaging sessions. The ultrasound probe and the tumors remained stationary in position for 10 seconds and a total of 330 RF data frames were digitally recorded at three different image planes for each tumor. All ultrasound examinations were performed by one radiologist (J.W.W), who was blinded to treatment status. The greatest longitudinal, transverse, and anteroposterior dimensions of tumors were registered each time by electronic caliper measurements available on the ultrasound system. Tumor volume was determined using the formula for a prolate ellipsoid: volume = π/6 × length × width × depth. The largest cross-section plane of the tumor was imaged with the transducer held manually in this position throughout the examination.
Features extraction from RF time series
Ultrasound RF time series analysis was performed by a radiologist (L.Q.G) who was blinded to treatment information. All the ultrasound RF data was analyzed with MATLAB-based (v. 2009a: MathWorks, Natick, MA, USA) software developed in our lab for ultrasound RF time series analysis. Rectangular regions of interest (ROI) were centered approximately at the focal depth of the transducer onto tumor images. Three representative ROIs were selected for each tumor sample and averaged for the final analysis.
Temporal ultrasound RF echo signals collected from a fixed spot of tumor tissue formed one RF time series (Figure 6A). We use the method originally described by Moradi et al. which proposed summarizing the power spectrum of the RF time series in six features, as described below [21]. These six features were extracted from the amplitude of the Discrete Fourier Transformation (DFT) of RF time series averaged over an ROI. For analysis, a window of size M×N was selected to form RF time series. The power spectrum was averaged over the ROI and then normalized by dividing it by its maximum to obtain values in the range [0, 1]. This normalization process sets the maximum of the averaged spectrum to 1 and enables us to compare data from different ROIs. As all samples of one RF time series originated from the same depth of the tissue, there was no need for compensation of signals for depth-dependent effects. The normalized amplitude of the DFT can be described as:
(1)
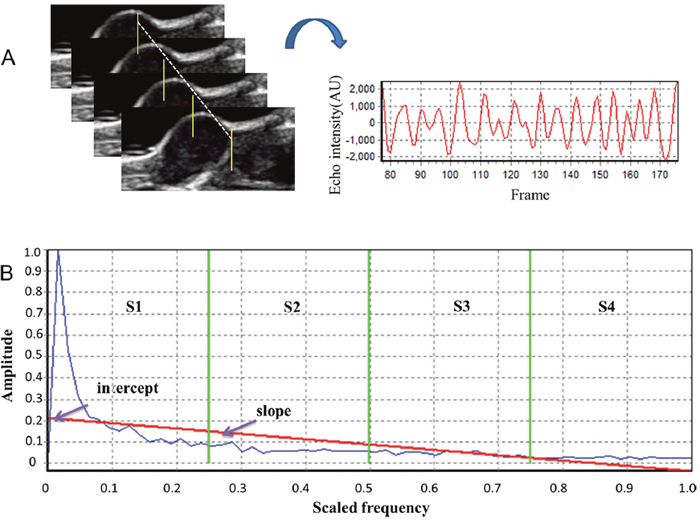
Figure 6: Analysis of ultrasonic RF time series features. (A) Samples of RF echo signals collected over time from a fixed tumor location under continuous emission of ultrasound. (B) Quantitative features included the slope and intercept of the linear regression of the frequency spectrum (red line), and the sum of the amplitude values in four different frequency bands (separated by green vertical lines on the graphs), namely S1-S4.
where is the amplitude of RF time series in point , and is the amount of RF time series. We transform the RF time series into using the Fast Fourier Transform (FFT) algorithm as implemented in MATLAB. Then we average the spectrum over all RF time series corresponding to RF samples in one ROI. The averaged spectrum of the ROI () is then normalized as follows:
(2)
This normalization process sets the maximum of the averaged spectrum to 1 and enables us to compare data from different ROIs. The six proposed RF time series features, listed below, are extracted from and are designed to represent the frequency spectrum through only a few parameters. The first four features (S1, S2, S3, and S4) are the integral of in four quarters of the frequency range:
(3)
where L is the length of the RF time series. We also fit a regression line to values of the spectrum versus normalized frequency. The slope and intercept of the regression line are the remaining two features (Figure 6B).
Histopathological examination
At each time point after ultrasound imaging, mice were sacrificed and tumors were removed and fixed in 10% buffered formalin before paraffin processing. Tumor specimens were sectioned (5 μm) at the largest cross sections corresponding to the ultrasound imaging planes. Sections were stained with hematoxylin and eosin (H&E) and assessed microscopically for changes in cell morphology. Tumor cell density was measured by a team member (L.Q) who was blinded to treatment status. Regions with the highest tumor cell density in H&E stained sections were located by scanning the sections under 40 × magnification optics, and ten different fields within such regions were randomly captured at 400 × magnification. Image-Pro Plus 6.0 software (Media Cybernetics, Silver Spring, MD, USA) was used to calculate the number of nuclei in each histology image. Data were averaged over ten fields for statistical analysis.
Statistical analysis
All analyses were performed using SPSS version 16.0 (SPSS, Inc, Chicago, IL). The Kolmogorov-Smirnov test was applied to evaluate normal distribution. The Levene test was applied to evaluate the homogeneity of variance. Independent student’s t-test was used to assess significance when comparing tumor sizes between treated and control mice. One-way analysis of variance (ANOVA) was used to determine whether significant differences in RF time series features and tumor nuclei density existed at the three imaging points between the treatment and control groups. The post-hoc Bonferroni corrected t test was performed for multiple comparisons to confirm differences between individual time points. The Pearson correlation test was used to determine the relationship between RF time series features and histopathological changes. P ≤ 0.05 was considered as being statistically significant.
CONFLICTS OF INTEREST
The authors declare no conflicts of interest.
FUNDING
This work was supported by National Natural Science Foundation of China (No.81271578), the Fundamental Research Funds for the Central Universities (NO.13ykzd25) and Program for New Century Excellent Talents in University.
REFERENCES
1. Torre LA, Bray F, Siegel RL, Ferlay J, Lortet-Tieulent J, Jemal A. Global cancer statistics, 2012. CA Cancer J Clin. 2015; 65:87–108. https://doi.org/10.3322/caac.21262.
2. Therasse P, Arbuck SG, Eisenhauer EA, Wanders J, Kaplan RS, Rubinstein L, Verweij J, Van Glabbeke M, van Oosterom AT, Christian MC, Gwyther SG. New guidelines to evaluate the response to treatment in solid tumors. European Organization for Research and Treatment of Cancer, National Cancer Institute of the United States, National Cancer Institute of Canada. J Natl Cancer Inst. 2000; 92:205–16. https://doi.org/10.1093/jnci/92.3.205.
3. Ah-See ML, Makris A, Taylor NJ, Harrison M, Richman PI, Burcombe RJ, Stirling JJ, d’Arcy JA, Collins DJ, Pittam MR, Ravichandran D, Padhani AR. Early changes in functional dynamic magnetic resonance imaging predict for pathologic response to neoadjuvant chemotherapy in primary breast cancer. Clin Cancer Res. 2008; 14:6580–89. https://doi.org/10.1158/1078-0432.CCR-07-4310.
4. Keam B, Im SA, Koh Y, Han SW, Oh DY, Cho N, Kim JH, Han W, Kang KW, Moon WK, Kim TY, Park IA, Noh DY, et al. Early metabolic response using FDG PET/CT and molecular phenotypes of breast cancer treated with neoadjuvant chemotherapy. BMC Cancer. 2011; 11:452. https://doi.org/10.1186/1471-2407-11-452.
5. Bellomi M, Petralia G, Sonzogni A, Zampino MG, Rocca A. CT perfusion for the monitoring of neoadjuvant chemotherapy and radiation therapy in rectal carcinoma: initial experience. Radiology. 2007; 244:486–93. https://doi.org/10.1148/radiol.2442061189.
6. Brindle K. New approaches for imaging tumour responses to treatment. Nat Rev Cancer. 2008; 8:94–107. https://doi.org/10.1038/nrc2289.
7. Ellis PA, Smith IE, McCarthy K, Detre S, Salter J, Dowsett M. Preoperative chemotherapy induces apoptosis in early breast cancer. Lancet. 1997; 349:849. https://doi.org/10.1016/S0140-6736(05)61752-7.
8. Chang J, Ormerod M, Powles TJ, Allred DC, Ashley SE, Dowsett M. Apoptosis and proliferation as predictors of chemotherapy response in patients with breast carcinoma. Cancer. 2000; 89:2145–52. https://doi.org/10.1002/1097-0142(20001201)89:11<2145::AID-CNCR1>3.0.CO;2-S.
9. Hamstra DA, Galbán CJ, Meyer CR, Johnson TD, Sundgren PC, Tsien C, Lawrence TS, Junck L, Ross DJ, Rehemtulla A, Ross BD, Chenevert TL. Functional diffusion map as an early imaging biomarker for high-grade glioma: correlation with conventional radiologic response and overall survival. J Clin Oncol. 2008; 26:3387–94. https://doi.org/10.1200/JCO.2007.15.2363.
10. Kyriazi S, Collins DJ, Messiou C, Pennert K, Davidson RL, Giles SL, Kaye SB, Desouza NM. Metastatic ovarian and primary peritoneal cancer: assessing chemotherapy response with diffusion-weighted MR imaging—value of histogram analysis of apparent diffusion coefficients. Radiology. 2011; 261:182–92. https://doi.org/10.1148/radiol.11110577.
11. Liu T, Lizzi FL, Silverman RH, Kutcher GJ. Ultrasonic tissue characterization using 2-D spectrum analysis and its application in ocular tumor diagnosis. Med Phys. 2004; 31:1032–39. https://doi.org/10.1118/1.1690196.
12. Yang M, Krueger TM, Miller JG, Holland MR. Characterization of anisotropic myocardial backscatter using spectral slope, intercept and midband fit parameters. Ultrason Imaging. 2007; 29:122–34. https://doi.org/10.1177/016173460702900204.
13. Banihashemi B, Vlad R, Debeljevic B, Giles A, Kolios MC, Czarnota GJ. Ultrasound imaging of apoptosis in tumor response: novel preclinical monitoring of photodynamic therapy effects. Cancer Res. 2008; 68:8590–96. https://doi.org/10.1158/0008-5472.CAN-08-0006.
14. Liu T, Mansukhani MM, Benson MC, Ennis R, Yoshida E, Schiff PB, Zhang P, Zhou J, Kutcher GJ. A feasibility study of novel ultrasonic tissue characterization for prostate-cancer diagnosis: 2D spectrum analysis of in vivo data with histology as gold standard. Med Phys. 2009; 36:3504–11. https://doi.org/10.1118/1.3166360.
15. Vlad RM, Brand S, Giles A, Kolios MC, Czarnota GJ. Quantitative ultrasound characterization of responses to radiotherapy in cancer mouse models. Clin Cancer Res. 2009; 15:2067–75. https://doi.org/10.1158/1078-0432.CCR-08-1970.
16. Hwang JY, Park J, Kang BJ, Lubow DJ, Chu D, Farkas DL, Shung KK, Medina-Kauwe LK. Multimodality imaging in vivo for preclinical assessment of tumor-targeted doxorubicin nanoparticles. PLoS One. 2012; 7:e34463. https://doi.org/10.1371/journal.pone.0034463.
17. Lin CY, Cao LH, Wang JW, Zheng W, Chen Y, Feng ZZ, Li AH, Zhou JH. Ultrasonic spectrum analysis for in vivo characterization of tumor microstructural changes in the evaluation of tumor response to chemotherapy using diagnostic ultrasound. BMC Cancer. 2013; 13:302. https://doi.org/10.1186/1471-2407-13-302.
18. Moradi M, Abolmaesumi P, Siemens DR, Sauerbrei EE, Boag AH, Mousavi P. Augmenting detection of prostate cancer in transrectal ultrasound images using SVM and RF time series. IEEE Trans Biomed Eng. 2009; 56:2214–24. https://doi.org/10.1109/TBME.2008.2009766.
19. Moradi M, Mousavi P, Siemens DR, Sauerbrei EE, Isotalo P, Boag A, Abolmaesumi P. Discrete Fourier analysis of ultrasound RF time series for detection of prostate cancer. Conf Proc IEEE Eng Med Biol Soc. 2007; 2007:1339–42. https://doi.org/10.1109/IEMBS.2007.4352545
20. Moradi M, Mousavi P, Abolmaesumi P. Tissue characterization using fractal dimension of high frequency ultrasound RF time series. Med Image Comput Comput Assist Interv. 2007; 10:900–8. https://doi.org/10.1007/978-3-540-75759-7_109.
21. Moradi M, Mahdavi SS, Nir G, Jones EC, Goldenberg SL, Salcudean SE. Ultrasound RF time series for tissue typing: First in vivo clinical results. Proc. SPIE 8670, Medical Imaging 2013: Computer-Aided Diagnosis, 86701I. 2013; 8670. https://doi.org/10.1117/12.2007672.
22. Daoud MI, Mousavi P, Imani F, Rohling R, Abolmaesumi P. Tissue classification using ultrasound-induced variations in acoustic backscattering features. IEEE Trans Biomed Eng. 2013; 60:310–20. https://doi.org/10.1109/TBME.2012.2224111.
23. Uniyal N, Eskandari H, Abolmaesumi P, Sojoudi S, Gordon P, Warren L, Rohling RN, Salcudean SE, Moradi M. Ultrasound RF time series for classification of breast lesions. IEEE Trans Med Imaging. 2015; 34:652–61. https://doi.org/10.1109/TMI.2014.2365030.
24. Imani F, Wu MZ, Lasso A, Burdette EC, Daoud M, Fitchinger G, Abolmaesumi P, Mousavi P. Monitoring of tissue ablation using time series of ultrasound RF data. Med Image Comput Comput Assist Interv. 2011; 14:379–86. https://doi.org/10.1007/978-3-642-23623-5_48.
25. Bogaerts J, Ford R, Sargent D, Schwartz LH, Rubinstein L, Lacombe D, Eisenhauer E, Verweij J, Therasse P, and RECIST Working Party. Individual patient data analysis to assess modifications to the RECIST criteria. Eur J Cancer. 2009; 45:248–60. https://doi.org/10.1016/j.ejca.2008.10.027.
26. Hlatky L, Hahnfeldt P, Folkman J. Clinical application of antiangiogenic therapy: microvessel density, what it does and doesn’t tell us. J Natl Cancer Inst. 2002; 94:883–93. https://doi.org/10.1093/jnci/94.12.883.
27. Rajan R, Poniecka A, Smith TL, Yang Y, Frye D, Pusztai L, Fiterman DJ, Gal-Gombos E, Whitman G, Rouzier R, Green M, Kuerer H, Buzdar AU, et al. Change in tumor cellularity of breast carcinoma after neoadjuvant chemotherapy as a variable in the pathologic assessment of response. Cancer. 2004; 100:1365–73. https://doi.org/10.1002/cncr.20134.
28. Rajan R, Esteva FJ, Symmans WF. Pathologic changes in breast cancer following neoadjuvant chemotherapy: implications for the assessment of response. Clin Breast Cancer. 2004; 5:235–38. https://doi.org/10.3816/CBC.2004.n.028.
29. Park SH, Moon WK, Cho N, Song IC, Chang JM, Park IA, Han W, Noh DY. Diffusion-weighted MR imaging: pretreatment prediction of response to neoadjuvant chemotherapy in patients with breast cancer. Radiology. 2010; 257:56–63. https://doi.org/10.1148/radiol.10092021.
30. Galbán CJ, Ma B, Malyarenko D, Pickles MD, Heist K, Henry NL, Schott AF, Neal CH, Hylton NM, Rehemtulla A, Johnson TD, Meyer CR, Chenevert TL, et al. Multi-site clinical evaluation of DW-MRI as a treatment response metric for breast cancer patients undergoing neoadjuvant chemotherapy. PLoS One. 2015; 10:e0122151. https://doi.org/10.1371/journal.pone.0122151.
31. Lizzi FL, Greenebaum M, Feleppa EJ, Elbaum M, Coleman DJ. Theoretical framework for spectrum analysis in ultrasonic tissue characterization. J Acoust Soc Am. 1983; 73:1366–73. https://doi.org/10.1121/1.389241.
32. Sadeghi-Naini A, Falou O, Tadayyon H, Al-Mahrouki A, Tran W, Papanicolau N, Kolios MC, Czarnota GJ. Conventional frequency ultrasonic biomarkers of cancer treatment response in vivo. Transl Oncol. 2013; 6:234–43. https://doi.org/10.1593/tlo.12385.
33. Moradi M, Abolmaesumi P, Mousavi P. Tissue typing using ultrasound RF time series: experiments with animal tissue samples. Med Phys. 2010; 37:4401–13. https://doi.org/10.1118/1.3457710.