
INTRODUCTION
Polycystic ovary syndrome (PCOS) is an endocrine-metabolic disorder in women of reproductive age with a prevalence, in dependence on the study population, of 5–20% [1–11]. The key basic features for its diagnosis are hyperandrogenism, chronic anovulation, and polycystic ovaries [12–18]. PCOS pathology is often associated with obesity [19–24], insulin resistance [21, 23, 25, 26], type II diabetes [11, 27], cardiovascular disease, metabolic syndrome [28–34], and gynecological cancer [35–38]. Female infertility and pregnancy loss are additional consequences of this disorder. In addition, PCOS has been also related to an increased oxidative stress and leukocyte-endothelium interactions, suggesting mitochondrial dysfunction and cardiovascular events under this condition [39, 40].
Although hyperandrogenism is one of the underlying key factors in this syndrome [15, 41, 42], likely as the result of a primary defect in steroidogenesis [21], the pathological conditions associated with PCOS complicate the understanding of the disease’s origin becoming a big challenge for both clinical and scientific communities.
The recent development of comprehensive omics approaches has provided an opportunity to address open questions about this disorder. Thus, genomics, transcriptomics, and proteomics approaches suggest the existence of altered pathways that affect protein folding, cytoskeleton, immune response, inflammation, iron metabolism, fibrinolysis and thrombosis, TGF-beta pathway, insulin signaling pathway, intracellular calcium metabolism, and oxidative stress, among others, which could play a role in the pathophysiology of PCOS [43, 44]. At present moment, however, no conclusive results have been obtained and thus, no mechanistic conclusions can be formulated.
More recently, metabolomics has offered a new perspective to study PCOS [44, 45], because it is closer to the actual phenotype than either both genomics/transcriptomics or proteomics. This approach allows to identify in plasma/serum and urine samples metabolites involved mostly in carbohydrate, lipid, and amino acid metabolism, as well as steroid hormone metabolism, as potential biomarkers for different PCOS phenotypes [46–49] or PCOS patients with other pathologies associated (e.g. overweight/obesity [48, 50] or insulin resistance or type 2 diabetes [51–55]). Interestingly, a recent and unique metabolomic study centered in follicular niche demonstrated that mitochondrial dysfunction of cumulus cells can be important in the pathogenesis of PCOS [56]. Later on, three studies specifically focused on the lipid metabolism have allowed to define a lipidomic profile in PCOS patients compared with control women at different stages of menstrual cycle [57], or suffering from obesity [58, 59].
In all these studies, however, the group of PCOS patients showed an important phenotypic heterogeneity, basically due to two factors: a) the variability in the diagnosis criteria, and b) the broad range of overlaid metabolic traits (dyslipemia, obesity, insulin resistance, cardiovascular disease). As pathophysiological mechanisms underlying the different PCOS phenotypes may differ from each other, these constraints can lead to differential metabolomic profiles not necessarily ascribed to the basic PCOS condition.
In this work, UPLC-QTOF-MS-based lipidomics approach was used to unravel changes in the plasma lipidome of PCOS patients. The aim of the study is to offer new insights in PCOS patients strictly selected in order to avoid confounding factors such as dyslipemia, obesity, altered glucose/insulin metabolism, cardiovascular disease, or cancer.
RESULTS
Clinical and metabolic characteristics
The clinical and metabolic characteristics of control and PCOS women are presented in Table 1.
Table 1: Anthropometric and metabolic parameters in healthy control subjects and PCOS patients
Controls (n = 20) |
PCOS (n =14) |
P value |
|
|---|---|---|---|
Age (years) |
23.85 ± 5.63 |
24.14 ± 5.01 |
0.877 |
BMI (kg/m2) |
20.78 ± 1.59 |
21.78 ± 2.77 |
0.362 |
Waist (cm) |
76.50 ± 6.26 |
80.50 ± 9.41 |
0.127 |
Systolic BP (mmHg) |
110.74 ± 14.46 |
112.93 ± 12.66 |
0.654 |
Diastolic BP (mmHg) |
69.00 ± 10.81 |
71.50 ± 9.25 |
0.812 |
Total cholesterol (mg/dl) |
163.00 ± 21.64 |
150.00 ± 33.22 |
0.494 |
LDLc (mg/dl) |
85.00 ± 18.01 |
86.50 ± 24.59 |
0.528 |
HDLc (mg/dl) |
61.00 ± 12.12 |
49.00 ± 9.52 |
0.051 |
Triglycerides (mg/dl) |
63.15 ± 25.50 |
55.71 ± 21.40 |
0.379 |
Glucose (mg/dl) |
82.50 ± 5.79 |
83.00 ± 8.79 |
0.806 |
Insulin (mg/dl) |
5.65 ± 2.18 |
6.25 ± 1.99 |
0.969 |
HOMA-IR (mg/dl) |
1.13 ± 0.45 |
1.25 ± 0.44 |
0.984 |
HbA1c (%) |
5.08 ± 0.27 |
5.13 ± 0.25 |
0.783 |
FSH (mIU/ml) |
3.90 ± 2.19 |
4.80 ± 1.44 |
0.054 |
LH (mIU/ml) |
4.99 ± 4.90 |
5.72 ± 3.44 |
0.664 |
Total testosterone (ng/ml) |
0.33 ± 0.12 |
0.53 ± 0.20 |
0.002 |
Androstendione (ng/ml) |
3.35 ± 1.36 |
3.49 ± 1.37 |
0.506 |
SHBG (nmol/l) |
81.05 ± 73.66 |
68.45 ± 31.83 |
0.455 |
hsCRP (mg/l) |
1.12 ± 1.21 |
2.20 ± 2.34 |
0.103 |
Data are expressed as mean ± SD for parametric data and median (interquartile range) for non-parametric variables. Statistical significance (p < 0.05) was considered when compared by an unpaired Student’s t-test or Mann-Whitney U-test for parametric or non-parametric data, respectively. Adjustment of variables by BMI was carried out using a univariate general linear model.
No statistically significant differences were found for age, BMI, waist, or blood pressure between PCOS and control women. Regarding the metabolic parameters, PCOS patients showed no changes in general lipid metabolism (total cholesterol, cholesterol-LDL, cholesterol-LDL, or triacylglycerides), glucose metabolism (glucose, HBA1c, insulin, or HOMA), endocrine system (FSH, LH, androstendione, or SHBG), and inflammatory marker (hsCRP) with respect to control subjects. Higher total testosterone levels (p < 0.002) in PCOS women than in controls was the only biochemical parameters significantly different.
Plasma lipidomic signature of PCOS patients
The first goal of this study was to analyze global lipidomic differences between PCOS patients and healthy controls. Thus, we applied a non-targeted lipidomics approach focusing on the profiles of low molecular weight (m/z between 300 and 3000) ionizable lipid molecules. First, we detected 13380 features but after applied the MFE algorithm, 1320 features remained. Then, we filtered by frequency keeping those features present in at least 50% of the samples of each group, so 339 lipid species integrate the studied lipidome.
First of all, we analyzed whether specific lipid species correlate with the most used plasma biomarker of PCOS pathogenesis, total plasma testosterone, and also the only clinical parameter studied which revealed statistically different levels between groups (Table 1). The results indicate that 72 compounds statistically correlated with testosterone levels (Supplementary Table 2), suggesting a relationship between androgenic endocrine regulation and these lipid species.
To determine whether the metabolite fingerprints in plasma differed between PCOS patients and healthy control subjects multivariate statistics were applied (Figure 1). Non-supervised PCA (Figure 1A) shows that there is an almost perfect clusterization of both groups suggesting a specific plasma lipidomic signature for PCOS subject without associated pathologies comparing to healthy control individuals. These results were confirmed by a supervised method such as PLS-DA (Figure 1B) where the both groups are perfectly discriminated. Cross validation values of PLS-DA model (Figure 1C) confirm that it is a good model to discriminate between PCOS and controls obtaining an accuracy value up to 0.8 and a maximum value of R2 using 3 components. The lower values of Q2 could be explained by the reduced number of individuals used in this study. After building the PLS-DA model, variable importance in projection (VIP) score was applied to rank the distinctive features based on their significance in discriminating between groups. Lipid molecular species with VIP score > 2 were selected as significant variables. Figure 1D shows the key differentiating lipid species sorted by increasing VIP score. Taking a VIP cut-off at 2, 15 molecular species were found to be significant discriminators between groups. Among them, we could identify (basing on exact mass, retention time, isotopic distribution and/or MS/MS spectrum) two glycerophospholipids (the phosphatidylglyceride 33:0, PG (33:0); and the phosphatidic acid 41:2, PA(41:2)) and a sphingolipid, the ceramide t34:0 (Cert34:0), all of them decreased in PCOS patients.
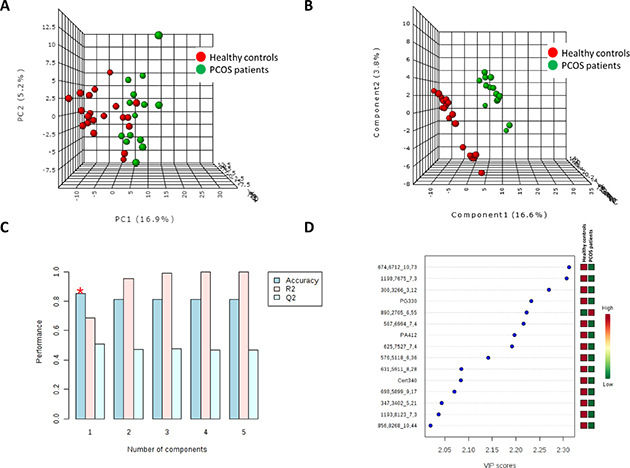
Figure 1: Multivariate statistics revealed the existence of a specific lipidomic signature of PCOS patients. Both unsupervised Principal Component Analyses (PCA) (A) and supervised Partial Least Discriminant Analyses (s-PLS-DA) (B) indicate that it is possible to discriminate between healthy controls and PCOS patients basing on their plasma lipidome. (C) Cross validation (CV) analyses (10-fold CV method) indicates that we obtained the maximum accuracy using only one component. (D) Among the metabolites which most contribute to define the first component of PLS-DA we could identify (basing on exact mass, retention time, isotopic distribution and/or MSMS spectrum) the phosphatidylglyceride 33:0 (PG330), the phosphatidic acid 41:2 (PA412) and the ceramide t34:0 (Cert34:0). Unknown identities are represented as exact mass_retention time.
To better characterized plasma lipidomic signature of PCOS patients hierarchical clustering analyses using all 339 lipid species detected was performed (Figure 2A). This analysis reinforced the idea of a specific lipidomic signature of PCOS patients although a perfect separation is not reached.
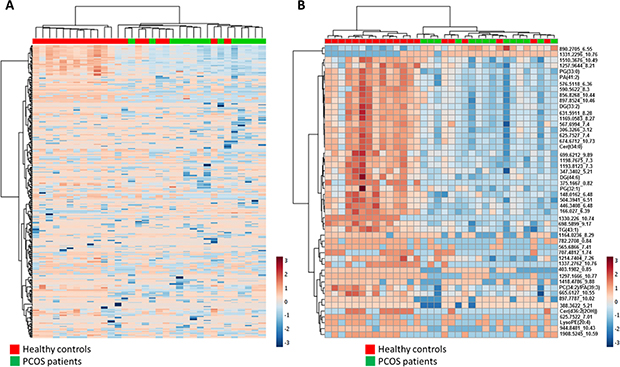
Figure 2: (A) Heat map representation of hierarchical clustering of 339 molecular features found in PCOS patients and healthy control plasma samples. (B) Heat map representations of hierarchical clustering analyses using 50 most statistical significant lipids species (T-test Unpaired with Benjamini Hochberg Correction) between PCOS and control samples. Unknown identities are represented as exact mass_retention time. Each line of this graphic represents an accurate mass ordered by retention time, coloured by its abundance intensity normalized to internal standard and baselining to median/mean across the samples. The scale from -7 (blue) to 7 (red) represents this normalized abundance in arbitrary units.
After global characterization using multivariate statistics we wanted to describe changes in specific lipid species. To reach this goal, parametric T Test for unequal variances (p < 0.05, False Discovery Rate correction) was applied. Among 339 lipid species detected, 56 were statistically different between groups. 11 lipid species were identified (Table 2) and the remaining are still unidentified (Table 3).
Table 2: Identified compounds statistically different between groups (T-test unpaired with Benjamini Hochberg correction false discovery rate)
Lipid Family |
Compounds |
p.value |
FDR |
PCOS vs Healthy Controls |
m/z |
Retention Time |
Product ion |
|---|---|---|---|---|---|---|---|
Glycero-phospholipids |
LysoPE(20:4) |
4.49E-04 |
4.83E-03 |
down |
502.2839 |
0.86 |
M+H+ |
PA(39:3) |
1.81E-04 |
2.27E-03 |
down |
758.5633 |
7.63 |
M+NH4+ |
|
PA(41:2) |
7.51E-07 |
5.09E-05 |
down |
771.584 |
6.36 |
M+H+ |
|
PG(32:1) |
1.03E-03 |
9.65E-03 |
down |
721.5012 |
7.98 |
M+H+ |
|
PG(33:0) |
3.71E-07 |
4.20E-05 |
down |
754.5572 |
6.36 |
M+NH4+ |
|
PS(O-29:0) |
5.17E-03 |
3.31E-02 |
down |
680.4733 |
7.98 |
M+H+ |
|
Sphingolipids |
Cer(t34:0) |
2.98E-06 |
9.57E-05 |
down |
556.5276 |
8.29 |
M+H+ |
Glycerolipids |
DG(44:6) |
6.82E-05 |
1.16E-03 |
down |
763.5499 |
8.96 |
M+K+ |
DG(33:2) |
7.49E-05 |
1.21E-03 |
down |
596.5205 |
8.3 |
M+NH4+ |
|
DG(32:3) |
3.38E-04 |
3.82E-03 |
down |
580.5062 |
5.87 |
M+NH4+ |
|
TG(43:1) |
4.55E-04 |
4.83E-03 |
down |
757.6426 |
9.18 |
M+Na+ |
Lipid species were identified by exact mass, retention time, isotopic distribution and MS/MS spectrum.
Table 3: Unidentified compounds statistically different between groups (T-test unpaired with Benjamini Hochberg correction false discovery rate)
Compounds |
p.value |
FDR |
Mass |
Retention Time |
PCOS vs Healthy Controls |
|---|---|---|---|---|---|
674.6712_10.73 |
7.87E-08 |
1.44E-05 |
674.6712 |
10.74 |
down |
1198.7675_7.3 |
8.52E-08 |
1.44E-05 |
1198.7675 |
7.31 |
down |
890.2705_6.55 |
5.45E-07 |
4.62E-05 |
890.2705 |
6.56 |
up |
306.3266_3.12 |
9.90E-07 |
5.60E-05 |
306.3266 |
3.12 |
down |
625.7527_7.4 |
1.24E-06 |
6.00E-05 |
625.7527 |
7.41 |
down |
576.5118_6.36 |
1.71E-06 |
7.27E-05 |
576.5118 |
6.36 |
down |
631.5911_8.28 |
3.10E-06 |
9.57E-05 |
631.5911 |
8.29 |
down |
567.6994_7.4 |
2.78E-06 |
9.57E-05 |
567.6994 |
7.41 |
down |
698.5899_9.17 |
5.76E-06 |
1.50E-04 |
698.5899 |
9.17 |
down |
1193.8123_7.3 |
5.75E-06 |
1.50E-04 |
1193.8123 |
7.31 |
down |
1169.0583_8.27 |
1.35E-05 |
3.28E-04 |
1169.0583 |
8.27 |
down |
856.8268_10.44 |
1.79E-05 |
3.90E-04 |
856.8268 |
10.44 |
down |
347.3402_5.21 |
1.84E-05 |
3.90E-04 |
347.3402 |
5.21 |
down |
699.6212_9.89 |
2.65E-05 |
5.28E-04 |
699.6212 |
9.9 |
down |
897.8524_10.46 |
3.89E-05 |
7.32E-04 |
897.8524 |
10.46 |
down |
504.3941_6.51 |
4.89E-05 |
8.73E-04 |
504.3941 |
6.51 |
down |
625.7522_7.01 |
7.95E-05 |
1.22E-03 |
625.7522 |
7.02 |
down |
590.5622_8.3 |
8.54E-05 |
1.26E-03 |
590.5622 |
8.3 |
down |
782.2708_0.84 |
1.18E-04 |
1.57E-03 |
782.2708 |
0.85 |
down |
446.3408_6.48 |
1.20E-04 |
1.57E-03 |
446.3408 |
6.48 |
down |
1330.226_10.74 |
1.19E-04 |
1.57E-03 |
1330.226 |
10.75 |
down |
166.027_6.39 |
2.19E-04 |
2.65E-03 |
166.027 |
6.39 |
down |
375.1667_0.82 |
3.38E-04 |
3.82E-03 |
375.1667 |
0.82 |
down |
1257.9644_8.21 |
6.29E-04 |
6.46E-03 |
1257.9644 |
8.21 |
down |
665.6127_10.55 |
8.87E-04 |
8.84E-03 |
665.6127 |
10.56 |
down |
565.6866_7.41 |
9.76E-04 |
9.45E-03 |
565.6866 |
7.42 |
down |
1908.5245_10.59 |
1.26E-03 |
1.09E-02 |
1908.5245 |
10.59 |
down |
1510.3676_10.49 |
1.23E-03 |
1.09E-02 |
1510.3676 |
10.5 |
down |
1337.2762_10.76 |
1.20E-03 |
1.09E-02 |
1337.2762 |
10.77 |
down |
707.4812_1.74 |
1.41E-03 |
1.20E-02 |
707.4812 |
1.75 |
down |
148.0162_6.48 |
1.56E-03 |
1.27E-02 |
148.0162 |
6.48 |
down |
1331.2296_10.76 |
1.58E-03 |
1.27E-02 |
1331.2296 |
10.76 |
up |
1214.7404_7.26 |
1.84E-03 |
1.45E-02 |
1214.7404 |
7.27 |
down |
1297.1666_10.77 |
2.46E-03 |
1.90E-02 |
1297.1666 |
10.77 |
down |
849.2429_6.54 |
3.31E-03 |
2.49E-02 |
849.2429 |
6.55 |
up |
795.539_7.54 |
3.62E-03 |
2.61E-02 |
795.539 |
7.55 |
down |
1566.5088_10.07 |
3.55E-03 |
2.61E-02 |
1566.5088 |
10.07 |
down |
1612.4489_10.36 |
4.08E-03 |
2.82E-02 |
1612.4489 |
10.36 |
down |
1418.4786_9.88 |
4.06E-03 |
2.82E-02 |
1418.4786 |
9.88 |
down |
944.8481_10.43 |
4.20E-03 |
2.85E-02 |
944.8481 |
10.43 |
down |
1164.0236_8.29 |
4.51E-03 |
3.00E-02 |
1164.0236 |
8.29 |
down |
403.1982_0.85 |
5.05E-03 |
3.29E-02 |
403.1982 |
0.85 |
down |
897.7787_10.02 |
6.20E-03 |
3.89E-02 |
897.7787 |
10.02 |
down |
872.2602_8.96 |
7.76E-03 |
4.78E-02 |
872.2602 |
8.96 |
down |
1328.2119_10.68 |
7.96E-03 |
4.82E-02 |
1328.2119 |
10.68 |
up |
Unknown identities are represented as exact mass_retention time.
Among the identified lipids we found 6 lipids belonging to glycerophospholipids family, two belonging to sphingolipids and three glycerolipids. When a hierarchical analysis to statistically significant molecules was applied, we did not obtain a better clusterization than using the whole lipidome (Figure 2B).
To further characterize the predictive value of these metabolites to discriminate PCOS condition, we performed ROC analyses using MS peak areas. Supplementary Table 3 shows the lipid species with an area under the curve (AUC) higher to 0.8. Among them, the identified molecules with a higher AUC (PG (33:0), PA (41:2), DG (44:6) and PA (39:3)) had lower levels in PCOS individuals than in healthy controls (Figure 3).
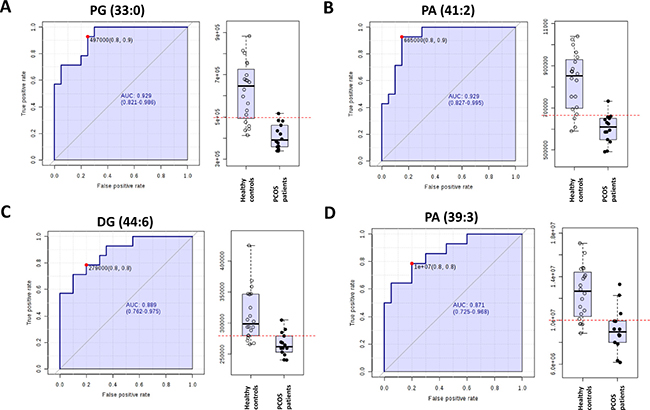
Figure 3: Receiver operating characteristic curve of (A) phosphatidylglicerol 33:0 (PG (33:0), (B) phosphatidic acid 41:2 (PA (41:2)), (C) diacylglycerol 44:6 (DG (44:6)) and (D) PA (39:3).
In addition with these changes, we also verified the existence of minor but significant differences in total plasma fatty acid profile between groups (Table 4). For particular fatty acids, there was a significant increase in the content of 14:0, and 24:0 in PCOS women; whereas 18:4n-3, 20:0, 20:1n-9, 20:2n-6, 20:5n-3, 22:4n-6, 22:5n-3, 24:1n-9, and 26:0 were decreased in PCOS group. These minor changes lead to a slight but significant change in the average chain length (ACL). Any additional change is verified for the other fatty acid indexes such as SFA, UFA, MUFA, PUFA, PUFAn-3, PUFAn-6, DBI, PI, or AI.
Table 4: Total fatty acid composition of plasma from control subjects and PCOS patients
Control |
PCOS |
P value |
|||||
|---|---|---|---|---|---|---|---|
C14:0 |
0.401 |
± |
0.023 |
0.608 |
± |
0.054 |
0.001 |
C16:0 |
20.563 |
± |
0.469 |
21.553 |
± |
0.370 |
0.130 |
C16:1n-7 |
1.149 |
± |
0.093 |
1.351 |
± |
0.130 |
0.203 |
C18:0 |
7.967 |
± |
0.496 |
8.319 |
± |
0.128 |
0.559 |
C18:1n-9 |
20.615 |
± |
0.391 |
20.336 |
± |
0.628 |
0.694 |
C18:1n-7 |
1.797 |
± |
0.052 |
1.746 |
± |
0.046 |
0.514 |
C18:2n-6 |
32.502 |
± |
0.774 |
32.123 |
± |
1.033 |
0.767 |
C18:3n-3 |
0.309 |
± |
0.017 |
0.314 |
± |
0.036 |
0.881 |
C18:4n-3 |
0.205 |
± |
0.007 |
0.140 |
± |
0.006 |
0.001 |
C20:0 |
0.302 |
± |
0.013 |
0.160 |
± |
0.006 |
0.001 |
C20:1n-9 |
0.276 |
± |
0.013 |
0.232 |
± |
0.009 |
0.019 |
C20:2n-6 |
0.067 |
± |
0.009 |
0.041 |
± |
0.003 |
0.031 |
C20:3n-6 |
1.502 |
± |
0.080 |
1.405 |
± |
0.086 |
0.425 |
C20:4n-6 |
6.626 |
± |
0.300 |
6.534 |
± |
0.365 |
0.847 |
C20:5n-3 |
0.055 |
± |
0.004 |
0.043 |
± |
0.003 |
0.034 |
C22:0 |
0.278 |
± |
0.011 |
0.271 |
± |
0.008 |
0.680 |
C22:1n-9 |
2.355 |
± |
0.259 |
2.214 |
± |
0.213 |
0.694 |
C22:4n-6 |
0.238 |
± |
0.009 |
0.180 |
± |
0.008 |
0.001 |
C22:5n-6 |
0.118 |
± |
0.008 |
0.156 |
± |
0.026 |
0.127 |
C22:5n-3 |
0.377 |
± |
0.033 |
0.282 |
± |
0.022 |
0.038 |
C24:0 |
0.055 |
± |
0.004 |
0.128 |
± |
0.017 |
0.001 |
C22:6n-3 |
1.615 |
± |
0.085 |
1.518 |
± |
0.115 |
0.493 |
C24:1n-9 |
0.387 |
± |
0.017 |
0.283 |
± |
0.011 |
0.001 |
C26:0 |
0.244 |
± |
0.014 |
0.043 |
± |
0.006 |
0.001 |
ACL |
17.972 |
± |
0.021 |
17.899 |
± |
0.018 |
0.019 |
SFA |
29.808 |
± |
0.492 |
31.093 |
± |
0.416 |
0.069 |
UFA |
70.192 |
± |
0.492 |
68.906 |
± |
0.416 |
0.069 |
MUFA |
26.577 |
± |
0.507 |
26.163 |
± |
0.654 |
0.616 |
PUFA |
43.615 |
± |
0.657 |
42.742 |
± |
0.789 |
0.401 |
PUFAn3 |
2.562 |
± |
0.100 |
2.303 |
± |
0.156 |
0.154 |
PUFAn6 |
41.053 |
± |
0.706 |
40.439 |
± |
0.851 |
0.582 |
DBI |
137.867 |
± |
1.202 |
134.605 |
± |
1.151 |
0.068 |
PI |
81.355 |
± |
1.275 |
78.730 |
± |
1.371 |
0.178 |
AI |
49.801 |
± |
3.379 |
46.676 |
± |
2.755 |
0.504 |
Abbreviations: ACL, average chain length; SFA, saturated fatty acids; UFA, unsaturated fatty acids; MUFA, monounsaturated fatty acids; PUFA, polyunsaturated fatty acids; PUFAn-3, polyunsaturated fatty acids series n-3; PUFAn-6, polyunsaturated fatty acids series n-6; DBI, double bond index; PI, peroxidizability index; AI, anti-inflammatory index.
DISCUSSION
Previous metabolomic studies using plasma, serum, urine and follicular fluids suggested marked metabolic shifts associated with PCOS disease. In these studies, metabolomics techniques have been applied in PCOS patients suffering from obesity, insulin resistance, cardiovascular disease or treated with polytherapy in order to refine their molecular traits [44, 45, 47, 49–55]. The results suggested some particular changes in lipid profile, and different levels of free fatty acids, phosphoglycerides, and sphingolipids are recurrent findings. It is important to be in mind that human diseases such as obesity, diabetes and cardiovascular disease are linked with disturbances in lipid metabolism and, consequently, it could be very difficult to discern whether PCOS per se also shows alterations in lipid metabolism when PCOS patients with associated pathologies are studied.
Further, previous studies focused in PCOS patients strictly diagnosed by the basic triad (polycystic ovaries, amenorrhea and hyperandrogenism) in absence of associated pathologies suggested minor changes in lipid metabolism. Only slightly increased LDL-cholesterol and decreased HDL-cholesterol, as well as total cholesterol, have been described [57–59]. In this line, in our study (only focused in PCOS patients without associated pathologies) we did not find changes in the levels of triglycerides, total cholesterol, LDLc and HDLc, glucose levels, hemoglobin A1c, insulin, and HOMA index. However, this apparent low impact of PCOS pathology in lipid metabolism could be masked by limitations in the biochemical analysis where very few lipid species are analyzed (basically, triacylglycerides and cholesterol). In contrast, mass spectrometry (MS) and nuclear magnetic resonance (NMR)-based techniques have become powerful tools for high-throughput screening for lipid characterization giving us the possibility to describe the complete lipid profile (lipidome) within an organism, organ, tissue, cell, organelle, subcellular membrane or microdomain, and biological fluids. In this scenario, the human plasma lipidome is composed of more than 3000 confirmed lipid compounds which represent around 80% of the total human plasma metabolome [60].
In the present study we applied an LC-MS-based technique in order to describe specific changes in plasma lipidome which could be only attributed to PCOS physiopathology. The results demonstrated for the first time the existence of a plasma lipidomic profiling specifically associated with PCOS patients. This signature could be defined by 15 molecules including two glycerophospholipids (PG (33:0), PA (41:2)) and a sphingolipid (Cer(t34:0). Unfortunately, the other species are still unidentified.
Further, we found 56 lipid molecular species with different concentration (4 lipid species were up-regulated (7.1%), whereas 52 were down-regulated (92.9%)) in plasma from PCOS patients compared to healthy controls. Among them, 11 (19.3%) were identified (based on exact mass, retention time, isotopic distribution, and/or MS/MS spectrum) and different functions can be attributed.
The identified lipid species (11) belong to diverse lipid classes such as glycerolipids (5), glycerophospholipids (5), and sphingolipids (1), all of them down-regulated. One of the main components of cellular membranes are glycerophospholipids (GP), which are synthesized from glycerol-3-phosphate in a de novo pathway that primarily produces phosphatidic acid (PA) and diacylglycerol (DAG) or cytidine diphosphate-DAG (CDP-DAG). Via the de novo pathway, different types of GPs such as phosphatidylcholine (PC), phosphatidylethanolamine (PE), phosphatidylserine (PS), phosphatidylinositol (PI), phosphatidylglycerol (PG), and cardiolipin (CL) are generated. Subsequently, GP acyl chains are remodeled, via generation of lysoglycerophospholipids, by regulated and coordinated reactions of diverse enzymes [61]. Thus, the decreased content observed in PCOS patients of different lipid species such as PA (2), DAG (3), and even TAG (1), PG (2), PS(1), and LPE(1) suggest that PCOS is associated with a lower de novo biosynthesis pathway of glycerophospholipids and lower remodeling activity of PE likely due to the hyperandrogenism ascribed to PCOS. In addition, the decreased content in the identified ceramide (1) is probably also linked to a decreased de novo synthesis induced by PCOS status instead of an increase in degradation pathway. Globally, the down-regulation of the identified lipid species likely due to a decreased activity of the biosynthesis pathway along with the minor changes in the total plasma fatty acid composition could explain the not alterations o minor changes for LDL and HDL levels described in PCOS patients. This particular lipid profile can also have additional effects derived from their role as lipid second messengers for some of them such as DAGs and ceramides. These molecules have been linked to obesity, insulin resistance, and metabolic disorders [62]. Consequently, the decrease in some of the DAGs may be a reason why these PCOS patients have not developed any of the metabolic diseases associated yet. According to our results, this pathway could be differentially regulated in PCOS patients and affected at long-term during the natural history of the disease and be involved in infertility and pregnancy loss, two main clinical consequences of this pathology [63, 64]. An interesting additional observation derived from our study is that free fatty acids (FFAs) are not differential lipid species between PCOS women and healthy control, in contrast to several previous metabolomics and lipidomics studies where systematic increases in free fatty acid contents are described [44, 45, 50, 51, 53, 54, 65]. FFAs are important for physiological homeostasis, providing a major portion of mammalian bioenergetics needs. In addition, FFAs are the substrate by which TAG stored in adipose tissue is transported to its sites of consumption, being the adipose tissue the only significant site of FFA release into plasma [66]. Therefore, the results of our study demonstrate that the described changes in lipid species can be ascribed specifically to the PCOS condition, whereas the described changes in FFAs in most studies are derived from the obesity associated to PCOS women.
In conclusion, our study demonstrates that PCOS per se is a pathological entity that also presents alterations, though modest, in lipid metabolism. Although sample size is small, and should be validated in other cohorts, the accuracy in the elected group ensures and offers valuable information about the physiopathology of PCOS. Furthermore, our study confirms that using a lipidomic approach it is able to discriminate a specific phenotype from PCOS women without others associated pathologies.
MATERIALS AND METHODS
Subjects
The study was conducted in the Service of Endocrinology at the University Hospital Dr. Peset (Valencia, Spain). Fourteen women with PCOS and 20 controls were selected according to age and body mass index (BMI). Table 1 shows anthropometric and metabolic parameters in control subjects and PCOS patients participating in this study. Controls were volunteers recruited from the University Hospital Dr Peset and the Faculty of Medicine (Valencia University, Valencia, Spain). PCOS subjects were diagnosed using the Rotterdam criteria [13], which are the following: oligoovulation (cycles longer than 35 days or less than 26 days) [5]; elevated free testosterone levels (>0.5 ng/dl; the cut-off level for free testosterone was the mean ± 2 SD according to normal levels in controls); hirsutism (total Ferriman-Gallwey score > 7) and polycystic ovaries (presence of 12 or more small -2 to 9 mm- follicles in each ovary), identified by trans-vaginal ultrasonography. Ultrasound scans were performed and scored independently by one of two experienced and blinded reviewers. None of the subjects had any systemic or endocrine disease or galactorrhea, or any condition affecting her reproductive physiology. Exclusion criteria were active infectious diseases, malignant neoplasia, diabetes mellitus, anemia, thromboembolism, history of ischaemic heart disease, stroke and the taking of lipid-lowering or antihypertensive drugs. Absence during the previous semester of any medication that might have affected the hypothalamic-pituitary-gonadal axis was confirmed in all subjects. The study was approved by the ethics committee of the University Hospital Dr. Peset and was performed in accordance with the Helsinki declaration. Informed consent of all participants was obtained as required by these institutions.
Biochemical determinations
An anthropometric evaluation was performed in all subjects in whom weight (kg), height (m) and waist circumference (cm) were measured. Body mass index was then calculated (BMI = weight (kg)/height (m)2). After 12 hours of fasting, blood was collected from the antecubital vein at 8–10 a.m, on the second/third day of the menstrual cycle (follicular phase) or after 3 months of amenorrhea. In subjects with very irregular cycles, blood was collected after progesterone deprivation. Samples were processed immediately in order to avoid haemolysis and were frozen until analysis.
Total cholesterol and triglycerides were measured using enzymatic assays. Concentration of low density lipoproteins cholesterol (LDLc) was calculated using the Friedewald formula, and high density lipoproteins cholesterol (HDLc) levels were recorded using a direct method with a Beckman LX-20 autoanalyser (Beckman Coulter, La Brea, CA, USA). The intraserial variation coefficient was <3.5 % for all determinations. An Automatic Glycohemoglobin Analyzer was employed to assess HbA1c (Arkray, Inc., 73 KYOTO, Japan). Glucose levels were measured with a Dax-72 autoanalyzer using enzymatic techniques (Bayer Diagnostic, Tarrytown, NY, USA). Insulin concentration was determined by means of an enzymatic luminescence technique. High sensitivity C-reactive protein (hsCRP) levels were assessed by an immunonephelometric assay (Behring Nephelometer II, Dade Behring, Inc., Newark, DE, USA) with an intra-assay coefficient of variation of 8.7% and sensitivity of 0.01 mg/L. IR was calculated by homeostasis model assessment (HOMA) using baseline glucose and insulin: HOMA = (fasting insulin (μU/ml) × fasting glucose (mmol/L)/22.5. Serum luteinizing hormone (LH) and follicle-stimulating hormone (FSH) were measured using a 2-site monoclonal non-isotopic system (Architect, Abbott Laboratories, Abbott Park, IL). Sex hormone binding globulin (SHBG), androstendione and testosterone were measured in our hospital’s Clinical Analysis Service using specialized chemiluminiscence techniques.
Lipidomic analysis
Chemicals. Synthetic lipids were obtained from Avanti Polar Lipids Inc. (Alabaster, AL, USA) and Sigma-Aldrich (Madrid, Spain). Fatty acid methyl ester standards were obtained from Larodan Fine Chemicals (Mälmo, Sweden) and from Sigma-Aldrich (Madrid, Spain). Methyl tert-butyl ether (MTBE) LC-MS, acetonitrile LC-MS, isopropanol LC-MS, potassium chloride, chloroform, ammonium formate and ammonium hydroxide were purchased from Sigma-Aldrich (Madrid, Spain); methanol was from Carlo Erba (Milano, Italy); acetone was from Riedel-de-Häen (Seelze, Germany); and LC/MS-grade isopropanol and formic acid were from Baker (Phillipsburg, NJ, USA).
Lipidomic analysis: plasma lipidome
Preparation of Lipid Standards. Lipid standards consisting of isotopically labeled lipids (see Supplementary Table 1) were used for external standardization (i.e. lipid family assignment) and internal standardization (i.e. for adjustment of potential inter- and intra-assay variances). Stock solutions were prepared by dissolving lipid standards in MTBE at a concentration of 1 mg/mL and working solutions were diluted to 2.5 μg/mL in MTBE.
Lipid extraction. Lipidomic analysis was based on a previously validated method [67]. Briefly, in order to precipitate plasma protein fraction, 5 μl of miliQ water and 20 μl of methanol were added to 10 μl of plasma sample. After the addition, samples were vigorously shaken for 2 min. Then, for lipid extraction, 250 μl of MTBE (containing internal lipid standards) were added and samples were immersed in a water bath (ATU Ultrasonidos, Valencia, Spain) with an ultrasound frequency and power of 40 kHz and 100 W, respectively, at 10°C for 30 min. Then, 75 μL of miliQ water were added to the mixture and organic phase was separated by centrifugation (1,400 g) at 10°C for 10 min. Lipid extracts, contained in the upper phase, were collected and subjected to mass-spectrometry. A pool of all lipid extracts was prepared and used as quality controls (QC) as previously described [68].
LC-MS/MS method. Lipid extracts were subjected to liquid chromatography coupled to mass-spectrometry (LC-MS) using an Agilent UPLC 1290 coupled to the Q-TOF MS/MS 6520 (Agilent Technologies, Barcelona, Spain) basing on previously published method [69]. Sample compartment was refrigerated at 4°C and, for each sample, 10 μl of lipid extract was applied onto 1.8 μm particle 100 × 2.1 mm id Waters Acquity HSS T3 column (Waters, Mildord, MA, USA) heated at 55°C. The flow rate was 400 μl/min with solvent A composed of 10mM ammonium acetate in acetonitrile-water (40:60, v/v) and solvent B composed of 10 mM ammonium acetate in acetonitrile-isopropanol (10:90, v/v). The gradient started at 40% B and reached 100% B in 10min and held for 2 min. Finally, the system was switched back to 60% B and equilibrated for 3 min. Duplicate runs of the samples were performed to collect positive and negative electrospray ionized lipid species in a TOF mode, operated in full-scan mode at 100 to 3000 m/z in an extended dynamic range (2 GHz), using N2 as nebulizer gas (5 L/min, 350°C). The capillary voltage was set 3500 V with a scan rate of 1 scan/s. Continuous infusion using a double spray with masses 121.050873, 922.009798 (positive ion mode) and 119.036320, 966.000725 (negative ion mode) was used for in-run calibration of the mass spectrometer. For MS/MS analyses we applied a previously described method [70].
Data Analyses. The MassHunter Data Analysis Software (Agilent Technologies, Barcelona, Spain) was used to collect the results and the MassHunter Qualitative Analysis Software (Agilent Technologies, Barcelona, Spain) to obtain the molecular features of the samples, representing different, co-migrating ionic species of a given molecular entity (i.e. ion adducts) using the Molecular Feature Extractor algorithm (Agilent Technologies, Barcelona, Spain) [71]. This algorithm is a compound-finding technique that locates individual sample components (molecular features), even when chromatograms are complex and compounds are not well resolved. MFE locates ions that are covariant (rise and fall together in abundance), but the analysis is not exclusively based on chromatographic peak information. The algorithm uses the accuracy of the mass measurements to group related ions, related by charge-state envelope, isotopic distribution, and/or the presence of adducts and dimers. It assigns multiple species (ions) that are related to the same neutral molecule (for example, ions representing multiple charge states or adducts of the same neutral molecule) to a single compound that is referred to as a feature. Using this approach, the MFE algorithm can locate multiple compounds within a single chromatographic peak. We selected samples with a minimum absolute abundance of 5000 counts and with a minimum of 2 ions. Multiple charge states were not considered. Compounds from different samples were aligned using a RT window of 0.1% ± 0.15 min and a mass window of 5.0 ppm ± 2.0 mDa. Only common features (found in at least 50% of the samples of the same condition) were analyzed, correcting for individual bias and excluding possible contaminants and artefacts. Finally, the MassHunter Mass Profiler Professional Software (Agilent Technologies, Barcelona, Spain) was used to perform a non-targeted lipidomic analysis over the extracted features. Only common features (found in at least 50% of the samples of the same condition) were taken into account to correct for individual bias. Multivariate statistics (Hirerchical Clustering, PCA and PLS-DA analyses) were done using both MassHunter Mass Profiler Professional and Metaboanalyst softwares. Variable importance in projection (VIP) score was calculated using Metaboanalyst software [72, 73]. The masses representing significant differences by ANOVA (p < 0.05 with Benjamini-Hochberg Multiple Testing Correction) were searched against the LIPID MAPS database (The LIPID MAPS Lipidomics Gateway, http://www.lipidmaps.org/, May 2014) (exact mass ppm <20) and the MS/MS spectra were checked using the LipidBlast software [74].
Lipidomic analysis: plasma fatty acids
Fatty acid preparation. After lipid extraction, fatty acyl groups were analyzed as methyl esters derivatives by gas chromatography (GC) [70]. Briefly, fatty acids were transesterified by incubation in 2 ml of 5% methanolic HCl at 75°C for 90 min. The resulting fatty acid methyl esters (FAMEs) were extracted by adding 2 ml of n-pentane and 1 ml of saturated NaCl solution. The n-pentane phase was separated, evaporated under N2 gas, re-dissolved in 80 μl of carbon disulfide and 2 μl were used for GC analysis.
GC method. The analysis was performed on a GC System 7890A with a Series Injector 7683B and a flame ionization detector (FID) (Agilent Technologies Inc., Barcelona, Spain) equipped with a DBWAX capillary column (length 30 m × inner diameter 0.25 mm × film thickness 0.20 μm; Agilent Technologies Inc., Barcelona, Spain). The injections were performed in the splitless mode. The temperature of the injector was 220°C. The flow rate of helium (99.99%) carrier gas was maintained at a constant rate of 1.8 ml/min. The column temperature was held at 145°C for 5 min; subsequently, the column temperature was increased by 2°C/min to 245°C for 50 min, and held at 245°C for 10 min, and with a post-run of 250°C for 10 min.
Data analysis. Identification of the twenty-four FAMEs was made by comparison with authentic standards. Results were expressed as mol%. The fatty acid profile detected, identified and quantified represents more than 95% of the total chromatogram. The following fatty acid indexes were calculated: saturated fatty acids (SFA); unsaturated fatty acids (UFA); monounsaturated fatty acids (MUFA); polyunsaturated fatty acids (PUFA) from n-3 and n-6 series (PUFAn-3 and PUFAn-6); average chain length (ACL) = [(Σ%Total14 × 14) + (Σ%Total16 × 16) + (Σ%Total18 × 18) + (Σ%Total20 × 20) + (Σ%Total22 × 22)+ (Σ%Total24 × 24)]/100]; double bond index (DBI) = [(1 × Σmol% monoenoic) + (2 × Σmol% dienoic) + (3 × Σmol% trienoic) + (4 × Σmol% tetraenoic) + (5 × Σmol% pentaenoic) + (6 × Σmol% hexaenoic)]; peroxidizability index (PI) = [(0.025 × Σmol% monoenoic) + (1 × Σmol% dienoic) + (2 × Σmol% trienoic) + (4 × Σmol% tetraenoic) + (6 × Σmol% pentaenoic) + (8 × Σmol% hexaenoic)]; and anti-inflammatory index (AI): [[(20:3n-6) + (20:5n-3) + (22:6n-3)]/ (20:4n-6)]*100.
Statistics. Comparisons between groups were analyzed with one way ANOVA followed by DMS tests. These statistical analyses were performed using the SPSS software (SPSS, Chicago, IL, USA). The level of statistical significance was set at p < 0.05 in all the analyses.
Abbreviations
ACL: Average Chain Length; BMI: Body Mass Index; BP: Blood Pressure; CER: Ceramide; DAG: Diacylglyceride; DBI: Double Bond Index; FA: Fatty Acid; FSH: Follicle-Stimulating Hormone; HOMA-IR: Homeostatic Model Assessment-Insulin Resistance; HDL: High Density Lipoprotein; hsCRP: high sensitivity C-Reactive Protein; LC-ESI-QTOF MS/MS: Liquid Chromatography-Electrospray Ionization-Quadrupole Time of Flight Mass Spectrometry/Mass Spectrometry; LDL: Low Density Lipoprotein; LH: Luteinizing Hormone; MUFA: Monounsaturated Fatty Acid; PC: Phosphatidylcholine; PCA: Principal Component Analysis; PCOS: Polycystic Ovary Syndrome; PE: Phosphatidylethanolamine; PLS-DA: Partial Least Square-Discrimination; PI: Peroxidizability Index; PUFA: Polyunsaturated Fatty Acid; PS: Phosphatidylserine; SFA: Saturated Fatty Acid; SHBG: Sex Hormone-Binding Globulin; SP: Sphingolipid; TAG: Triacylglyceride; UFA: Unsaturated Fatty Acid.
Author contributions
v.M.V. and R.P. designed the experiments. M.J., I.P., A.N., S.R.L., C.B., M.R., and M.P.O. performed the experiments and data analysis. A.H.M., V.M.V. and R.P. supervised the design and data interpretation. The manuscript was written by M.J., V.M.V. and R.P. and edited by R.P. All authors discussed the results and commented on the manuscript.
ACKNOWLEDGMENTS
V.M.V. and M.R. are recipients of contracts from the Ministry of Health of the Valencian Regional Government and Carlos III Health Institute (CES10/030 and CP10/0360, respectively). C.B. is recipient of a Sara Borrell contract from Institute of Health Carlos III (CD14/00043). S.R-LL. is recipient of a Juan de la Cierva contract from Spanish Ministry of Economy and Competitiveness (FJCI-2015–25,040). I.P. received a predoctoral fellowship from the Lleida University. We thank Maria Rosa Gomez and David Argiles for technical support.
CONFLICTS OF INTEREST
The authors declare that they have no competing interests.
FUNDING
We acknowledge funding from the Fund for Health Research (FIS) and co-funding from the European Regional Development Fund of the European Union (FEDER, ‘Una manera de hacer Europa’): PI15/1424, PI16/1083, PI16/0301 and UGP15-193 by FISABIO, to A.H.M, M.R. and V.M.V, respectively.
This research was also in part funded by the Spanish Ministry of Economy and Competitiveness, Institute of Health Carlos III (FIS grants PI14/00328), and the Autonomous Government of Catalonia (2017SGR and SLT002/16/00250) to R.P. This study was co-financed by FEDER funds from the European Union (‘Una manera de hacer Europa’).
REFERENCES
1. Dunaif A. Insulin resistance and the polycystic ovary syndrome: mechanism and implications for pathogenesis. Endocr Rev. 1997; 18:774–800. https://doi.org/10.1210/edrv.18.6.0318.
2. Legro RS, Driscoll D, Strauss JF, Fox J, Dunaif A. Evidence for a genetic basis for hyperandrogenemia in polycystic ovary syndrome. Proc Natl Acad Sci USA. 1998; 95:14956–60.
3. Knochenhauer ES, Key TJ, Kahsar-Miller M, Waggoner W, Boots LR, Azziz R. Prevalence of the polycystic ovary syndrome in unselected black and white women of the southeastern United States: a prospective study. J Clin Endocrinol Metab. 1998; 83:3078–82. https://doi.org/10.1210/jcem.83.9.5090.
4. Asunción M, Calvo RM, San Millán JL, Sancho J, Avila S, Escobar-Morreale HF. A prospective study of the prevalence of the polycystic ovary syndrome in unselected Caucasian women from Spain. J Clin Endocrinol Metab. 2000; 85:2434–8. https://doi.org/10.1210/jcem.85.7.6682.
5. Azziz R, Woods KS, Reyna R, Key TJ, Knochenhauer ES, Yildiz BO. The prevalence and features of the polycystic ovary syndrome in an unselected population. J Clin Endocrinol Metab. 2004; 89:2745–9. https://doi.org/10.1210/jc.2003-032046.
6. Carmina E, Lobo RA. Polycystic ovary syndrome (PCOS): arguably the most common endocrinopathy is associated with significant morbidity in women. J Clin Endocrinol Metab. 1999; 84:1897–9. https://doi.org/10.1210/jcem.84.6.5803.
7. Chen X, Yang D, Mo Y, Li L, Chen Y, Huang Y. Prevalence of polycystic ovary syndrome in unselected women from southern China. Eur J Obstet Gynecol Reprod Biol. 2008; 139:59–64. https://doi.org/10.1016/j.ejogrb.2007.12.018.
8. March WA, Moore VM, Willson KJ, Phillips DIW, Norman RJ, Davies MJ. The prevalence of polycystic ovary syndrome in a community sample assessed under contrasting diagnostic criteria. Hum Reprod. 2010; 25:544–51. https://doi.org/10.1093/humrep/dep399.
9. Moran C, Tena G, Moran S, Ruiz P, Reyna R, Duque X. Prevalence of polycystic ovary syndrome and related disorders in mexican women. Gynecol Obstet Invest. 2010; 69:274–80. https://doi.org/10.1159/000277640.
10. Goodarzi MO, Dumesic DA, Chazenbalk G, Azziz R. Polycystic ovary syndrome: etiology, pathogenesis and diagnosis. Nat Rev Endocrinol. 2011; 7:219–31. https://doi.org/10.1038/nrendo.2010.217.
11. Sanchón R, Gambineri A, Alpañés M, Martínez-García MÁ, Pasquali R, Escobar-Morreale HF. Prevalence of functional disorders of androgen excess in unselected premenopausal women: a study in blood donors. Hum Reprod. 2012; 27:1209–16. https://doi.org/10.1093/humrep/des028.
12. Zawadski J, Dunaif A. Diagnostic Criteria for Polycystic Ovary Syndrome: Towards a Rational Approach. Polycystuc Ovary Syndr. 1992; 377–84.
13. Rotterdam ESHRE/ASRM-Sponsored PCOS consensus workshop group. Revised 2003 consensus on diagnostic criteria and long-term health risks related to polycystic ovary syndrome (PCOS). Hum Reprod. 2004; 19:41–7.
14. Azziz R. Diagnostic criteria for polycystic ovary syndrome: a reappraisal. Fertil Steril. 2005; 83:1343–6. https://doi.org/10.1016/j.fertnstert.2005.01.085.
15. Azziz R, Carmina E, Dewailly D, Diamanti-Kandarakis E, Escobar-Morreale HF, Futterweit W, Janssen OE, Legro RS, Norman RJ, Taylor AE, Witchel SF, Androgen Excess Society. Positions statement: criteria for defining polycystic ovary syndrome as a predominantly hyperandrogenic syndrome: an Androgen Excess Society guideline. J Clin Endocrinol Metab. 2006; 91:4237–45. https://doi.org/10.1210/jc.2006-0178.
16. Norman RJ, Dewailly D, Legro RS, Hickey TE. Polycystic ovary syndrome. Lancet. 2007; 370:685–97. https://doi.org/10.1016/S0140-6736(07)61345-2.
17. Escobar-Morreale HF. Polycystic ovary syndrome: treatment strategies and management. Expert Opin Pharmacother. 2008; 9:2995–3008.
18. Lujan ME, Chizen DR, Pierson RA. Diagnostic criteria for polycystic ovary syndrome: pitfalls and controversies. J Obs Gynaecol Can. 2008; 30:671–9.
19. Hoeger K. Obesity and weight loss in polycystic ovary syndrome. Obstet Gynecol Clin North Am. 2001; 28:85–97, vi–vii.
20. Alvarez-Blasco F, Botella-Carretero JI, San Millán JL, Escobar-Morreale HF. Prevalence and characteristics of the polycystic ovary syndrome in overweight and obese women. Arch Intern Med. 2006; 166:2081–6. https://doi.org/10.1001/archinte.166.19.2081.
21. Escobar-Morreale HF, San Millán JL. Abdominal adiposity and the polycystic ovary syndrome. Trends Endocrinol Metab. 2007; 18:266–72. https://doi.org/10.1016/j.tem.2007.07.003.
22. Carmina E, Bucchieri S, Esposito A, Del Puente A, Mansueto P, Orio F, Di Fede G, Rini G. Abdominal fat quantity and distribution in women with polycystic ovary syndrome and extent of its relation to insulin resistance. J Clin Endocrinol Metab. 2007; 92:2500–5. https://doi.org/10.1210/jc.2006-2725.
23. Gambineri A, Pelusi C, Vicennati V, Pagotto U, Pasquali R. Obesity and the polycystic ovary syndrome. Int J Obes Relat Metab Disord. 2002; 26:883–96. https://doi.org/10.1038/sj.ijo.0801994.
24. Borruel S, Fernández-Durán E, Alpañés M, Martí D, Alvarez-Blasco F, Luque-Ramírez M, Escobar-Morreale HF. Global adiposity and thickness of intraperitoneal and mesenteric adipose tissue depots are increased in women with polycystic ovary syndrome (PCOS). J Clin Endocrinol Metab. 2013; 98:1254–63. https://doi.org/10.1210/jc.2012-3698.
25. Cotrozzi G, Matteini M, Relli P, Lazzari T. Hyperinsulinism and insulin resistance in polycystic ovarian syndrome: a verification using oral glucose, I.V. Glucose and tolbutamide. Acta Diabetol Lat. 20: 135–42.
26. González F. Inflammation in Polycystic Ovary Syndrome: underpinning of insulin resistance and ovarian dysfunction. Steroids. 2012; 77:300–5. https://doi.org/10.1016/j.steroids.2011.12.003.
27. Legro RS, Kunselman AR, Dodson WC, Dunaif A. Prevalence and predictors of risk for type 2 diabetes mellitus and impaired glucose tolerance in polycystic ovary syndrome: a prospective, controlled study in 254 affected women. J Clin Endocrinol Metab. 1999; 84:165–9. https://doi.org/10.1210/jcem.84.1.5393.
28. Talbott EO, Guzick DS, Sutton-Tyrrell K, McHugh-Pemu KP, Zborowski JV, Remsberg KE, Kuller LH. Evidence for association between polycystic ovary syndrome and premature carotid atherosclerosis in middle-aged women. Arterioscler Thromb Vasc Biol. 2000; 20:2414–21.
29. Lo JC, Feigenbaum SL, Yang J, Pressman AR, Selby JV, Go AS. Epidemiology and adverse cardiovascular risk profile of diagnosed polycystic ovary syndrome. J Clin Endocrinol Metab. 2006; 91:1357–63. https://doi.org/10.1210/jc.2005-2430.
30. Krentz AJ, von Mühlen D, Barrett-Connor E. Searching for polycystic ovary syndrome in postmenopausal women: evidence of a dose-effect association with prevalent cardiovascular disease. Menopause. 2007; 14:284–92. https://doi.org/10.1097/GME.0b013e31802cc7ab.
31. Shaw LJ, Bairey Merz CN, Azziz R, Stanczyk FZ, Sopko G, Braunstein GD, Kelsey SF, Kip KE, Cooper-Dehoff RM, Johnson BD, Vaccarino V, Reis SE, Bittner V, et al. Postmenopausal women with a history of irregular menses and elevated androgen measurements at high risk for worsening cardiovascular event-free survival: results from the National Institutes of Health--National Heart, Lung, and Blood Institute sponsored Women’s Ischemia Syndrome Evaluation. J Clin Endocrinol Metab. 2008; 93:1276–84. https://doi.org/10.1210/jc.2007-0425.
32. Glueck CJ, Morrison JA, Goldenberg N, Wang P. Coronary heart disease risk factors in adult premenopausal white women with polycystic ovary syndrome compared with a healthy female population. Metabolism. 2009; 58:714–21. https://doi.org/10.1016/j.metabol.2009.02.005.
33. Rizzo M, Berneis K, Spinas G, Rini GB, Carmina E. Long-term consequences of polycystic ovary syndrome on cardiovascular risk. Fertil Steril. 2009; 91:1563–7. https://doi.org/10.1016/j.fertnstert.2008.09.070.
34. Wild RA, Carmina E, Diamanti-Kandarakis E, Dokras A, Escobar-Morreale HF, Futterweit W, Lobo R, Norman RJ, Talbott E, Dumesic DA. Assessment of cardiovascular risk and prevention of cardiovascular disease in women with the polycystic ovary syndrome: a consensus statement by the Androgen Excess and Polycystic Ovary Syndrome (AE-PCOS) Society. J Clin Endocrinol Metab. 2010; 95:2038–49. https://doi.org/10.1210/jc.2009-2724.
35. Schildkraut JM, Schwingl PJ, Bastos E, Evanoff A, Hughes C. Epithelial ovarian cancer risk among women with polycystic ovary syndrome. Obstet Gynecol. 1996; 88:554–9.
36. Balen A. Polycystic ovary syndrome and cancer. Hum Reprod Update. 7: 522–5.
37. Galazis N, Pang YL, Galazi M, Haoula Z, Layfield R, Atiomo W. Proteomic biomarkers of endometrial cancer risk in women with polycystic ovary syndrome: a systematic review and biomarker database integration. Gynecol Endocrinol. 2013; 29:638–44. https://doi.org/10.3109/09513590.2013.777416.
38. Barry JA, Azizia MM, Hardiman PJ. Risk of endometrial, ovarian and breast cancer in women with polycystic ovary syndrome: a systematic review and meta-analysis. Hum Reprod Update. 2014; 20:748–58. https://doi.org/10.1093/humupd/dmu012.
39. Victor VM, Rocha M, Bañuls C, Sanchez-Serrano M, Sola E, Gomez M, Hernandez-Mijares A. Mitochondrial complex I impairment in leukocytes from polycystic ovary syndrome patients with insulin resistance. J Clin Endocrinol Metab. 2009; 94:3505–12. https://doi.org/10.1210/jc.2009-0466.
40. Victor VM, Rocha M, Bañuls C, Alvarez A, de Pablo C, Sanchez-Serrano M, Gomez M, Hernandez-Mijares A. Induction of oxidative stress and human leukocyte/endothelial cell interactions in polycystic ovary syndrome patients with insulin resistance. J Clin Endocrinol Metab. 2011; 96:3115–22. https://doi.org/10.1210/jc.2011-0651.
41. Wickenheisser JK, Nelson-DeGrave VL, McAllister JM. Human ovarian theca cells in culture. Trends Endocrinol Metab. 2006; 17:65–71. https://doi.org/10.1016/j.tem.2006.01.003.
42. Azziz R, Carmina E, Dewailly D, Diamanti-Kandarakis E, Escobar-Morreale HF, Futterweit W, Janssen OE, Legro RS, Norman RJ, Taylor AE, Witchel SF, Task Force on the Phenotype of the Polycystic Ovary Syndrome of The Androgen Excess and PCOS Society. The Androgen Excess and PCOS Society criteria for the polycystic ovary syndrome: the complete task force report. Fertil Steril. 2009; 91:456–88. https://doi.org/10.1016/j.fertnstert.2008.06.035.
43. Kosova G, Urbanek M. Genetics of the polycystic ovary syndrome. Mol Cell Endocrinol. 2013; 373:29–38. https://doi.org/10.1016/j.mce.2012.10.009.
44. Insenser M, Montes-Nieto R, Murri M, Escobar-Morreale HF. Proteomic and metabolomic approaches to the study of polycystic ovary syndrome. Mol Cell Endocrinol. 2013; 370:65–77. https://doi.org/10.1016/j.mce.2013.02.009.
45. Murri M, Insenser M, Escobar-Morreale HF. Metabolomics in polycystic ovary syndrome. Clin Chim Acta. 2014; 429:181–8. https://doi.org/10.1016/j.cca.2013.12.018.
46. Zhao Y, Fu L, Li R, Wang LN, Yang Y, Liu NN, Zhang CM, Wang Y, Liu P, Tu BB, Zhang X, Qiao J. Metabolic profiles characterizing different phenotypes of polycystic ovary syndrome: plasma metabolomics analysis. BMC Med. 2012; 10:153. https://doi.org/10.1186/1741-7015-10-153.
47. Atiomo W, Daykin CA. Metabolomic biomarkers in women with polycystic ovary syndrome: A pilot study. Mol Hum Reprod. 2012; 18:546–53. https://doi.org/10.1093/molehr/gas029.
48. Sun L, Hu W, Liu Q, Hao Q, Sun B, Zhang Q, Mao S, Qiao J, Yan X. Metabonomics reveals plasma metabolic changes and inflammatory marker in polycystic ovary syndrome patients. J Proteome Res. 2012; 11:2937–46. https://doi.org/10.1021/pr3000317.
49. Wang W, Wang S, Tan S, Wen M, Qian Y, Zeng X, Guo Y, Yu C. Detection of urine metabolites in polycystic ovary syndrome by UPLC triple-TOF-MS. Clin Chim Acta. 2015; 448:39–47. https://doi.org/10.1016/j.cca.2015.06.008.
50. Zhao X, Xu F, Qi B, Hao S, Li Y, Zou L, Lu C, Xu G, Hou L. Serum metabolomics study of polycystic ovary syndrome based on liquid chromatography-mass spectrometry. J Proteome Res. 2014; 13:1101–11.
51. Galazis N, Iacovou C, Haoula Z, Atiomo W. Metabolomic biomarkers of impaired glucose tolerance and type 2 diabetes mellitus with a potential for risk stratification in women with polycystic ovary syndrome. Eur J Obstet Gynecol Reprod Biol. 2012; 160:121–30. https://doi.org/10.1016/j.ejogrb.2011.11.005.
52. Sun L, Hu W, Liu Q, Hao Q, Sun B, Zhang Q, Mao S, Qiao J, Yan X. Metabonomics reveals plasma metabolic changes and inflammatory marker in polycystic ovary syndrome patients. J Proteome Res. 2012; 11:2937–46. https://doi.org/10.1021/pr3000317.
53. Zhao Y, Fu L, Li R, Wang LN, Yang Y, Liu NN, Zhang CM, Wang Y, Liu P, Tu BB, Zhang X, Qiao J. Metabolic profiles characterizing different phenotypes of polycystic ovary syndrome: plasma metabolomics analysis. BMC Med. 2012; 10:153. https://doi.org/10.1186/1741-7015-10-153.
54. Dong F, Deng D, Chen H, Cheng W, Li Q, Luo R, Ding S. Serum metabolomics study of polycystic ovary syndrome based on UPLC-QTOF-MS coupled with a pattern recognition approach. Anal Bioanal Chem. 2015; 407:4683–95. https://doi.org/10.1007/s00216-015-8670-x.
55. Chen YX, Zhang XJ, Huang J, Zhou SJ, Liu F, Jiang LL, Chen M, Wan JB, Yang DZ. UHPLC/Q-TOFMS-based plasma metabolomics of polycystic ovary syndrome patients with and without insulin resistance. J Pharm Biomed Anal. 2016; 121:141–50. https://doi.org/10.1016/j.jpba.2016.01.025.
56. Zhao H, Zhao Y, Li T, Li M, Li J, Li R, Liu P, Yu Y, Qiao J. Metabolism alteration in follicular niche: The nexus among intermediary metabolism, mitochondrial function, and classic polycystic ovary syndrome. Free Radic Biol Med. 2015; 86:295–307. https://doi.org/10.1016/j.freeradbiomed.2015.05.013.
57. Haoula Z, Ravipati S, Stekel DJ, Ortori CA, Hodgman C, Daykin C, Raine-Fenning N, Barrett DA, Atiomo W. Lipidomic analysis of plasma samples from women with polycystic ovary syndrome. Metabolomics. 2015; 11:657–66. https://doi.org/10.1007/s11306-014-0726-y.
58. Li S, Chu Q, Ma J, Sun Y, Tao T, Huang R, Liao Y, Yue J, Zheng J, Wang L, Xue X, Zhu M, Kang X, et al. Discovery of Novel Lipid Profiles in PCOS: Do Insulin and Androgen Oppositely Regulate Bioactive Lipid Production? J Clin Endocrinol Metab. 2017; 102:810–21. https://doi.org/10.1210/jc.2016-2692.
59. Moran LJ, Mundra PA, Teede HJ, Meikle PJ. The association of the lipidomic profile with features of polycystic ovary syndrome. J Mol Endocrinol. 2017; 59:93–104. https://doi.org/10.1530/JME-17-0023.
60. Jové M, Naudí A, Gambini J, Borras C, Cabré R, Portero-Otín M, Viña J, Pamplona R. A Stress-Resistant Lipidomic Signature Confers Extreme Longevity to Humans. J Gerontol A Biol Sci Med Sci. 2017; 72:30–7. https://doi.org/10.1093/gerona/glw048.
61. Hishikawa D, Hashidate T, Shimizu T, Shindou H. Diversity and function of membrane glycerophospholipids generated by the remodeling pathway in mammalian cells. J Lipid Res. 2014; 55:799–807. https://doi.org/10.1194/jlr.R046094.
62. Fucho R, Casals N, Serra D, Herrero L. Ceramides and mitochondrial fatty acid oxidation in obesity. FASEB J. 2017; 31:1263–72. https://doi.org/10.1096/fj.201601156R.
63. Lee SY, Lee YY, Choi JS, Yoon MS, Han JS. Phosphatidic acid induces decidualization by stimulating Akt-PP2A binding in human endometrial stromal cells. FEBS J. 2016; 283:4163–75. https://doi.org/10.1111/febs.13914.
64. Pitangui-Molina CP, Vireque AA, Tata A, Belaz KRA, Santos VG, Ferreira CR, Eberlin MN, Silva-de-Sá MF, Ferriani RA, Rosa-E-Silva AC. Effect of soybean phosphatidylcholine on lipid profile of bovine oocytes matured in vitro. Chem Phys Lipids. 2017; 204:76–84. https://doi.org/10.1016/j.chemphyslip.2017.03.003.
65. Kino T, Tomori T, Abutarboush R, Castri P, Chen Y, Lenz FA, McCarron RM, Spatz M. Effect of N-arachidonoyl-L-serine on human cerebromicrovascular endothelium. 2016; https://doi.org/10.1016/j.bbrep.2016.09.002.
66. Karpe F, Dickmann JR, Frayn KN. Fatty acids, obesity, and insulin resistance: time for a reevaluation. Diabetes. 2011; 60:2441–9. https://doi.org/10.2337/db11-0425.
67. Pizarro C, Arezana-Rámila I, Pérez-del-Notario N, Pérez-Matute P, González-Sáiz JM. Plasma Lipidomic Pro fi ling Method Based on Ultrasound Extraction and Liquid Chromatography Mass Spectrometry. Anal Chem. 2013; 85:12085–92. http://doi.org/10.1021/ac403181.
68. Want EJ, Masson P, Michopoulos F, Wilson ID, Theodoridis G, Plumb RS, Shockcor J, Loftus N, Holmes E, Nicholson JK. Global metabolic profiling of animal and human tissues via UPLC-MS. Nat Protoc. 2013; 8:17–32. https://doi.org/10.1038/nprot.2012.135.
69. Castro-Perez JM, Kamphorst J, DeGroot J, Lafeber F, Goshawk J, Yu K, Shockcor JP, Vreeken RJ, Hankemeier T. Comprehensive LC-MS E lipidomic analysis using a shotgun approach and its application to biomarker detection and identification in osteoarthritis patients. J Proteome Res. 2010; 9:2377–89. https://doi.org/10.1021/pr901094j.
70. Jové M, Naudí A, Portero-Otin M, Cabré R, Rovira-Llopis S, Bañuls C, Rocha M, Hernández-Mijares A, Victor VM, Pamplona R. Plasma lipidomics discloses metabolic syndrome with a specific HDL phenotype. FASEB J. 2014; 28:5163–71. https://doi.org/10.1096/fj.14-253187.
71. Sana TR, Roark JC, Li X, Waddell K, Fischer SM. Molecular formula and METLIN Personal Metabolite Database matching applied to the identification of compounds generated by LC/TOF-MS. J Biomol Tech. 2008; 19:258–66. Available from http://www.pubmedcentral.nih.gov/articlerender.fcgi?artid=2567134&tool=pmcentrez&rendertype=abstract.
72. Xia J, Psychogios N, Young N, Wishart DS. MetaboAnalyst: a web server for metabolomic data analysis and interpretation. Nucleic Acids Res. 2009; 37:W652–60. https://doi.org/10.1093/nar/gkp356.
73. Xia J, Mandal R, Sinelnikov IV, Broadhurst D, Wishart DS. MetaboAnalyst 2.0—a comprehensive server for metabolomic data analysis. Nucleic Acids Res. 2012; 40: W127–33. https://doi.org/10.1093/nar/gks374.
74. Kind T, Liu KH, Lee DY, DeFelice B, Meissen JK, Fiehn O. LipidBlast in silico tandem mass spectrometry database for lipid identification. Nat Methods. Nature Publishing Group, a division of Macmillan Publishers Limited. All Rights Reserved.; 2013; 10:755–8. https://doi.org/10.1038/nmeth.2551.