
Introduction
Prostate cancer (PCa) is the most common urological malignancy in western countries. The American Cancer Society estimates that 233,000 American men will be diagnosed with PCa in 2014 [1]. In recent years, prostate specific antigen (PSA) testing has led to a sharp increase in PCa incidence [2], yet serum PSA does not accurately measure the threat that PCa poses to the patient’s life [3]. It is estimated that approximately 15-30% of patients who undergo radical prostatectomy have been over-treated as the tumors would likely not affect their life span or quality of life [4], thus suffering the harsh side effects of this treatment without any clinical benefit. Tumors with the same histopathologic grade are biologically diverse, as some may remain indolent while others behave aggressively, leading to local recurrence and metastatic disease. Based on the vast tumor heterogeneity in PCa, more accurate biomarkers are needed to help accurately distinguish between indolent and aggressive PCas. A better understanding of the molecular mechanisms of PCa progression would help address the unmet clinical need for the identification of biomarkers that can accurately distinguish between indolent and aggressive tumors and would also help form the basis for the development of novel therapeutic targets.
Epigenetic changes, including DNA methylation, have been shown to play a role in prostate carcinogenesis by regulating gene expression. DNA methylation occurs when a methyl group is added to a cytosine base that precedes a guanine (CpG). This epigenetic change has been shown to play a role in promoting chromosomal stability and regulating gene expression [5, 6]. Aberrant DNA methylation patterns are the most widely studied epigenetic mechanism and have been shown to be valuable diagnostic [7-9], prognostic [10, 11], and predictive [12, 13] biomarkers for PCa and other cancers [14, 15]. We, and others have previously identified HOXD3, TGFβ2, APC, and TBX15 as markers of PCa progression [16-20].
The integrated analyses, described in this manuscript, provide a comprehensive approach to identify potential novel candidate genes and signaling pathways that are regulated by epigenetic mechanisms and contribute to PCa progression. We compared genome wide methylation levels before and after treatment with the demethylating agent 5-Aza 2’ –deoxycytidine (DAC) to identify regions of CpG methylation in the PCa cell lines 22Rv1 and DU-145. We identified genes regulated by methylation mechanisms by determining differential gene expression post-DAC treatment in the same cells. Gene set enrichment analysis (GSEA) identified biological pathways that are over represented in these gene sets, including DNA replication and activation of ataxia telangiectasia and Rad3 related (ATR) in response to stress. Furthermore, we determined the prognostic significance of these markers by examining methylation levels in three independent cohorts of patients; two independent PCa patient cohorts with Gleason score (GS) 8 vs. GS6 tumors recruited at the University Health Network (UHN) and a third publically available dataset of PCa patients from The Cancer Genome Atlas (TCGA) database. These analyses identified novel potential methylation biomarkers associated with PCa progression.
Results
Identification of methylated CpG probes in prostate cancer cell lines
We treated two cell lines with the demethylating agent 5-Aza 2’–deoxycytidine (DAC). 22Rv1 is derived from a PCa xenograft and is AR positive; while DU-145 is derived from PCa brain metastases and is AR negative. Global methylation status was analyzed by performing methylation-sensitive restriction enzyme based differential methylation hybridization strategy followed by genome-wide CpG methylation profiling. The Agilent Human CpG Island Microarray assessed genome-wide, 27,800 CpG islands with 237,220 probes in or within 95bp of CpG islands. The hypomethylated genomic DNA (gDNA) fractions were isolated and we compared CpG methylation status before and after treatment with DAC. In the 22Rv1 cells, we identified 11,212 CpG probes (representing 4922 genes; p<0.05) with reduced methylation post-DAC treatment, suggesting these probes were methylated in the untreated cells. We observed 25% identified CpG probes were found in promoter regions while 69% probes were intronic and 6% were located in intergenic regions (Figure 1). A representative list of 25 such methylated CpGs in 22Rv1 cells is shown in Table 2. The most significant hypomethylated region identified after DAC treatment was an intragenic region of tumor protein D52 (TPD52; p<0.001).
Table 1: Primer and probes sequences for MethyLight analysis.
Gene |
Forward Primer |
Reverse Primer |
Probe |
ACTA1 |
5’- GGATTTTTTA GTGGGGTTTCGCG-3’ |
5’- CCAAAAACC TAAAAACATCTCC TACCG-3’ |
5’- AGGTCGAGAAGAGAATTTT TGGTCGTCGTTTTGGTAG-3’ |
B4GALNT1 |
5’- GTTTTGTAGGG GTGAAGCG -3’ |
5’- AATTACCTCCA AACGAACCTAA -3’ |
5’-AGGTATCGGAGCGTAGAT TTTGATTTTTTCGGGT-3’ |
ALU-C4 |
5’-GGTTAGGTATAGT GGTTTATATTTGTAATTT TAGTA-3’ |
5’-ATTAACTAAAC TAATCTTAAACTCCTA ACCTCA-3’ |
5’-CCTACCTTAACCTCCC-3’ |
We performed a parallel analysis with DU-145 cells and found 32,511 CpG probes (8008 genes; p<0.05) showed reduced methylation after treatment with DAC. 22% identified CpG probes were found in promoter regions while 72% probes were located intragenically and 6% were in intergenic regions (Figure 1). This pattern of differentially methylated CpG distribution throughout the genome is similar to the pattern observed in the 22Rv1 cells. A representative list of CpG probes identified with reduced methylation after DAC treatment in DU-145 cells is shown in Table 3. The top significant hypomethylated region identified after treatment was located in an intragenic region of the contactin associated protein-like 5 (CNTNAP5) gene. Other genes identified include glutathione S-transferase pi 1 (GSTP1), whose methylation in PCa is well documented in the literature, and homeobox D3 (HOXD3), T-box 15 (TBX15), and cytochrome P450, family 26, subfamily A, polypeptide 1 (CYP26A1), which we have previously shown to be methylated in PCa [21].
Table 2: A representative list of CpG sites that showed significant increased hypomethylation in 22Rv1 cells after treatment with 5-Aza 2’ –deoxycitidine (DAC).
Gene Symbol |
Gene Name |
CpG Location |
p value |
TPD52 |
tumor protein D52 |
Intragenic |
3.88E-07 |
CDR2L |
cerebellar degeneration-related protein 2-like |
Intragenic |
1.50E-03 |
GPER1 |
G Protein-Coupled Estrogen Receptor 1 |
Promoter |
2.00E-03 |
CLK2 |
CDC-like kinase 2 |
Intragenic |
3.40E-03 |
ADAM8 |
ADAM metallopeptidase domain 8 |
Promoter |
6.90E-03 |
SSTR1 |
somatostatin receptor 1 |
Intragenic |
9.50E-03 |
OSR1 |
odd-skipped related 1 |
Intragenic |
1.05E-02 |
BANK1 |
B-cell scaffold protein with ankyrin repeats 1 |
Promoter |
1.08E-02 |
ACTA1 |
actin, Alpha 1, Skeletal Muscle |
Intragenic |
1.18E-02 |
INPP5A |
inositol polyphosphate-5-phosphatase, 40kDa |
Intragenic |
1.78E-02 |
CYP26A1 |
cytochrome P450, family 26, subfamily A, polypeptide 1 |
Promoter |
2.08E-02 |
ADRA1A |
adrenoceptor alpha 1A |
Promoter |
2.26E-02 |
TFDP1 |
transcription factor Dp-1 |
Intragenic |
2.28E-02 |
RAB11B |
RAB11B, member RAS oncogene family 1 |
Intragenic |
2.36E-02 |
OBSCN |
obscurin, cytoskeletal calmodulin and titin-interacting RhoGEF |
Intragenic |
2.95E-02 |
NCOR2 |
nuclear receptor corepressor 2 |
Intragenic |
2.99E-02 |
TLX1 |
T-cell leukemia homeobox 1 |
Intragenic |
3.10E-02 |
SCAND1 |
SCAN domain containing 1 |
Promoter |
3.38E-02 |
KCND2 |
potassium voltage-gated channel, Shal-related subfamily,member 2 |
Intragenic |
3.64E-02 |
DHRS12 |
dehydrogenase/reductase (SDR family) member 12 |
Promoter |
4.19E-02 |
ONECUT2 |
one cut homeobox 2 |
Intragenic |
4.43E-02 |
B4GALNT1 |
beta-1,4-N-Acetyl-Galactosaminyl Transferase 1 |
Intragenic |
4.47E-02 |
CD248 |
CD248 molecule, endosialin |
Intergenic |
4.48E-02 |
HSF4 |
heat shock transcription factor 4 |
Promoter |
4.55E-02 |
IRX3 |
iroquois homeobox 3 |
Promoter |
4.61E-02 |
In addition, we examined the common CpG regions that showed decreased methylation after DAC treatment in both the 22Rv1 and DU-145 cell lines. These genes may represent common pathways in PCa that are regulated by methylation mechanisms. We found there were 7406 CpG probes, representing 3380 unique genes that showed decreased methylation in both 22Rv1 and DU-145 cell lines after DAC treatment. Pathway analyses showed that these genes belong to pathways involved in the regulation of DNA methylation and histone modifications as well as the regulation of cell-cell adhesion and epithelial to mesenchymal transition, among others, which are important for tumorigenesis.
Table 3: A representative list of CpG sites that showed significant increased hypomethylation in DU-145 cells after treatment with 5-Aza 2’ –deoxycitidine (DAC).
Gene Symbol |
Gene Name |
CpG Location |
p value |
CNTNAP5 |
contactin associated protein-like 5 |
Intragenic |
4.74E-06 |
KIAA0415 |
adaptor-related protein complex 5, zeta 1 subunit |
Intragenic |
1.00E-04 |
SOGA2 |
SOGA Family Member 2 |
Intragenic |
7.00E-04 |
ZNF418 |
zinc finger protein 418 |
Intragenic |
1.70E-03 |
TBX15 |
T-box 15 |
Intragenic |
1.80E-03 |
B4GALNT1 |
Beta-1,4-N-Acetyl-Galactosaminyl Transferase 1 |
Intragenic |
1.90E-03 |
CENPM |
centromere protein M |
Promoter |
3.30E-03 |
FIGN |
fidgetin |
Promoter |
3.30E-03 |
ARRDC2 |
arrestin domain containing 2 |
Promoter |
3.30E-03 |
OBSCN |
obscurin, cytoskeletal calmodulin and titin-interacting RhoGEF |
Intragenic |
3.50E-03 |
HOXD3 |
homeobox D3 |
Intragenic |
3.70E-03 |
MMP17 |
matrix metallopeptidase 17 (membrane-inserted) |
Intragenic |
5.30E-03 |
CRB2 |
crumbs homolog 2 (Drosophila) |
Intragenic |
5.90E-03 |
MARK3 |
MAP/microtubule affinity-regulating kinase 3 |
Intragenic |
1.71E-02 |
CYP26A1 |
cytochrome P450, family 26, subfamily A, polypeptide 1 |
Intragenic |
2.23E-02 |
GSTP1 |
glutathione S-transferase pi 1 |
Intragenic |
2.66E-02 |
PDZD4 |
PDZ domain containing 4 |
Intragenic |
3.12E-02 |
KLK12 |
kallikrein-related peptidase 12 |
Intragenic |
3.19E-02 |
IRX2 |
iroquois homeobox 2 |
Intragenic |
3.31E-02 |
ADCYAP1 |
adenylate cyclase activating polypeptide 1 (pituitary) |
Intragenic |
3.37E-02 |
MEX3B |
mex-3 RNA binding family member B |
Intragenic |
3.48E-02 |
GPR135 |
G protein-coupled receptor 135 |
Intragenic |
3.49E-02 |
COL9A3 |
collagen, type IX, alpha 3 |
Intragenic |
3.99E-02 |
MAST1 |
microtubule associated serine/threonine kinase 1 |
Intragenic |
4.57E-02 |
ACTA1 |
actin, Alpha 1, Skeletal Muscle |
Promoter |
4.88E-02 |
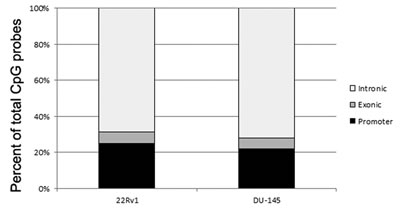
Figure 1: Bar graph showing the distribution of the location of CpG probes that were identified in the hypomethylated DNA fraction after treatment with 5-Aza 2’–deoxycitidine (DAC). In the 22Rv1 cells, we identified 11,212 probes with reduced methylation, representing 4922 genes (p<0.05) post-DAC treatment. In the DU-145 cells, we identified 32,511 CpG probes (representing 8008 genes, p<0.05) that showed reduced methylation after treatment. Interestingly, both cell lines showed similar distribution patterns of CpG locations. In the 22Rv1 cells, 25% CpG probes were found in promoter regions while 69% probes were located intragenically and 6% were located in intergenic regions. In the DU-145 cells, 22% CpG probes were found in promoter regions while 72% probes were located intragenically and 6% were located in intergenic regions.
Differential mRNA expression after DAC treatment
In order to investigate the contribution of DNA methylation to the regulation of gene expression in PCa, we treated cells with DAC and performed mRNA expression profiling. Gene expression was compared before and after treatment and was assayed using a custom microarray (GEO platform accession GPL16604), enriched for PCa metastasis-associated genes. We found 6598 probes (representing 2581 genes; FDR p<0.05) showed increased expression in 22Rv1 cells treated with DAC when compared to the untreated cells, suggesting expression of these genes may be, in part, regulated by methylation mechanisms. We also found there were 4604 probes (2020 genes; FDR p<0.05) that showed decreased expression in the treated cells. This may be due to either off target or indirect effects (e.g. demethylating a repressive factor, thereby increasing its expression and the repression of downstream targets). We performed GSEA pathway enrichment analysis to identify significant biological processes over represented in the 22Rv1 cells post-DAC treatment. We found that genes differentially regulated post-DAC treatment were most significantly enriched for DNA replication, activation of ATR in response to replication stress, and DNA metabolic pathways (Figure 2A).
We also analyzed gene expression in DU-145 cells after treatment with DAC and identified 16,092 probes (representing 5851 genes, FDR p<0.05) that showed significantly increased expression in treated cells when compared to untreated cells. There were also 12,970 probes (4067 genes; FDR p<0.05) that showed decreased expression. GSEA analyses of significantly differentially expressed genes in DU-145 cells post-DAC identified the most significant pathways including microtubule motor activity, lysosome pathway, activation of ATR in response to replication stress, and fatty acid oxidation (Figure 2B).
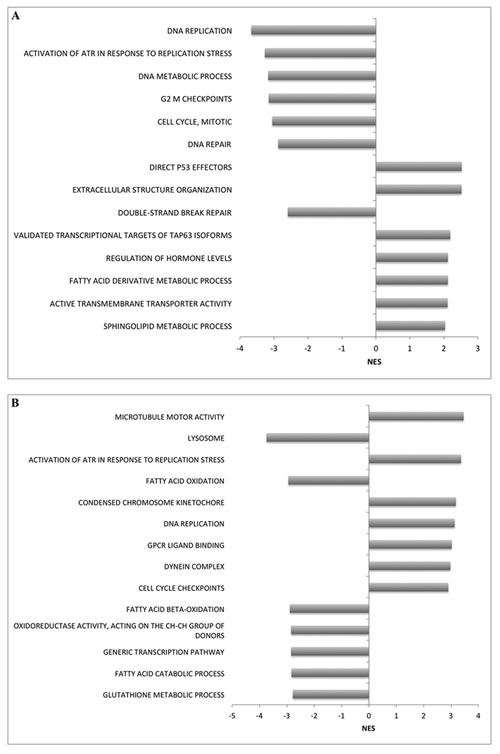
Figure 2: Enriched gene sets identified in (A) 22Rv1 and (B) DU-145 cells for upregulated genes following DAC treatment (positive normalized enrichment score (NES)) and downregulated genes post-DAC treatment (negative NES). Gene sets were found to be over-represented using GSEA software, with FDR (q-val) <0.05.
Correlation between reduced methylation and increased mRNA expression
In order to determine genes controlled by DNA methylation-dependent mechanisms, we correlated regions of CpG hypermethylation in untreated cells with increased gene expression after treatment. We found 670 genes, representing 1641 CpG probes in the 22Rv1 cell line had increased gene expression (adjusted p<0.05) after DAC treatment. This represents a total of 13% (670/4922) genes that had decreased methylation following DAC treatment. Pathway analysis showed that these genes were involved in cell migration and the regulation of DNA methyltransferase activity.
In the DU-145 cells, we found there were 2330 genes with decreased CpG methylation post DAC treatment, with a corresponding increased mRNA expression (adjusted p<0.05) and these were represented by 9910 CpG probes. This represents a total of 28% (2330/8008) genes that had decreased methylation following DAC treatment. Pathway analysis showed that these genes were involved in the regulation of cell-cell adhesion and focal adhesion assembly as well as cellular proliferation and migration.
Identification of potential methylation markers in tumor tissues
In order to assess the potential role of these genes in the initiation and/or progression of PCa, we assayed methylation status in PCa tumors using CpG island microarray analysis in 20 PCa tumors, 10 cases with Gleason Scores (GS) 6 (3+3) and 10 cases with GS8 (4+4). We assessed methylation status of the 670 genes (1641 CpG probes) that were hypermethylated in 22Rv1 and transcriptionally upregulated after DAC treatment. Among these genes, 117 genes (represented by 170 probes) showed significant (p<0.05) increased methylation in GS8 compared to GS6 tumors. Nine genes, representing potential biomarkers for PCa, are shown in Table 4. Of these nine probes, eight were intragenic while one was located in the promoter region. A number of these genes have been previously shown to be methylated in PCa, including transforming growth factor beta 2 (TGFB2), transcription factor AP-2 beta (TFAP2B), T-box 2 (TBX2), tescalcin (TESC), and desmocollin 3 (DSC3). We also identified novel potential methylation markers for PCa including actin, alpha 1, skeletal muscle (ACTA1), beta-1,4-N-acetyl-galactosaminyl transferase 1 (B4GALNT1), nuclear receptor interacting protein 3 (NRIP3), and TNF receptor-associated factor 3 (TRAF3).
Table 4: Genes identified through analysis with 22Rv1 cells that showed significant increased methylation in Gleason score 8 vs Gleason score 6 prostate cancer tumors
Gene Symbol |
Gene Name |
CpG Location |
Fold Change |
p- value |
NRIP3 |
nuclear receptor interacting protein 3 |
Promoter |
2.023 |
<0.001 |
B4GALNT1 |
beta-1,4-N-acetyl-galactosaminyl transferase 1 |
Intragenic |
2.19 |
<0.001 |
ACTA1 |
actin, alpha 1, skeletal muscle |
Intragenic |
3.026 |
0.0007 |
TFAP2B |
transcription factor AP-2 beta (activating enhancer binding protein 2 beta) |
Intragenic |
2.219 |
0.0039 |
TGFB2 |
transforming growth factor, beta 2 |
Intragenic |
1.846 |
0.0048 |
TBX2 |
T-box 2 |
Intragenic |
1.558 |
0.0121 |
TESC |
tescalcin |
Intragenic |
1.545 |
0.0191 |
TRAF3 |
TNF receptor-associated factor 3 |
Intragenic |
1.804 |
0.0205 |
DSC3 |
desmocollin 3 |
Intragenic |
1.508 |
0.0481 |
We performed a similar analysis with genes identified in the DU-145 cells. We identified 835 genes (1456 probes) that showed reduced methylation and increased gene expression post-DAC treatment in cells and had significant differential methylation in GS8 vs. GS6 PCa patients (p<0.05). Eight genes representing potential biomarkers are shown in Table 5. Interestingly, this analysis identified and confirmed a few genes that we previously reported to be associated with aggressive PCa including homeobox D3 (HOXD3), T-box 15 (TBX15), and T-box-3 (TBX3), as well as genes formerly reported methylated in PCa including homeobox D8 (HOXD8) and ventral anterior homeobox 1 (VAX1). Furthermore, we identified genes that have not been previously reported to be methylated in PCa including homeobox B6 (HOXB6), forkhead box D2 (FOXD2) and actin, alpha 1, skeletal muscle (ACTA1).
Table 5: Genes identified through analysis with DU-145 cells that showed significant increased methylation in Gleason score 8 vs Gleason score 6 prostate cancer tumors
Gene Symbol |
Gene Name |
CpG Location |
Fold Change |
p-value |
ACTA1 |
actin, alpha 1, skeletal muscle |
Intragenic |
3.026 |
0.0007 |
TBX3 |
T-box 3 |
Intergenic |
2.939 |
0.0016 |
HOXD3 |
homeobox D3 |
Intragenic |
2.124 |
0.0026 |
VAX1 |
ventral anterior homeobox 1 |
Intragenic |
3.679 |
0.0051 |
TBX15 |
T-box 15 |
Intragenic |
3.155 |
0.0102 |
HOXD8 |
homeobox D8 |
Promoter |
2.043 |
0.0124 |
HOXB6 |
homeobox B6 |
Intragenic |
2.165 |
0.0174 |
FOXD2 |
forkhead box D2 |
Promoter |
2.030 |
0.0243 |
We validated the correlation of methylation status with Gleason grade using an independent publically available database. Clincopathological and survival data for 127 PCa patients is shown in Supplementary Table 1. We accessed Level 3 methylation data from The Cancer Genome Atlas (TCGA) database, as described in the Materials section, and correlated with Gleason score. We found actin, alpha 1, skeletal muscle (ACTA1) had significantly higher methylation in GS ≥8 vs. GS7 patients (p=0.035; Table 6). Also, we found homeobox D3 (HOXD3) showed higher methylation levels in GS≥8 vs. GS≤6 tumors (p=0.025) while higher methylation levels of beta-1,4-N-acetyl-galactosaminyl transferase 1 (B4GALNT1) were associated with GS ≥8 vs. GS7 patients (p=0.027).
Table 6: Association of gene methylation status with Gleason Score
Clinical |
χ2 p-value |
||
Characteristic |
ACTA1 |
HOXD3 |
B4GALNT1 |
|
Gleason Score |
|||
≥8 vs. ≤6 |
0.258 |
0.025 |
0.205 |
≥8 vs. 7 |
0.035 |
0.113 |
0.027 |
We experimentally verified increased methylation of ACTA1 and B4GALNT1 in higher Gleason grade tumors in a separate, independent cohort of patients. We measured methylation levels using the MethyLight assay, on an independent cohort of 10 cases of GS≥8 vs. 10 cases of GS≤6 specimens. We found that ACTA1 showed significantly higher percent methylated reference (PMR) values in GS≥8 cases (average PMR=5.27) vs. GS≤6 cases (average PMR=1.44; p=0.040, Figure 3), which confirmed our previous results. In addition, we found B4GALNT1 higher PMR values in GS≥8 tumors (average PMR=8.23) vs GS≤6 cases (average PMR= 3.11; p=0.005, Figure 3), again, confirming our previous results.
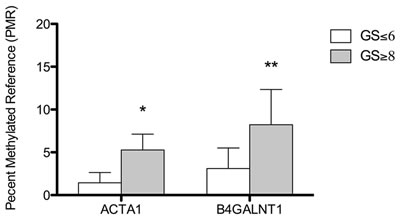
Figure 3: Bar graph showing differential methylation levels in GS≥8 vs. GS≤6 prostate tumor specimens. ACTA1 showed significantly higher percent methylated reference (PMR) values in GS≥8 cases (average PMR=5.27) vs. GS≤6 cases (average PMR=1.44). B4GALNT1 had higher PMR values in GS≥8 tumors (average PMR=8.23) vs GS≤6 cases (average PMR= 3.11). *;p=0.040, **; p=0.005.
Discussion
In this study, we preformed comparative assessment of methylation and gene expression data from PCa cell lines after treatment with the demethylating agent DAC to identify genes that are potentially regulated by DNA methylation dependent mechanisms in PCa. These data provide further insight to the contribution of methylation mechanisms to PCa tumorigenesis. We further explored the role of these genes in PCa carcinogenesis by performing GSEA analysis and determined the biological pathways that are affected by DNA methylation in these cells. Genes regulated by methylation mechanisms also represent potential biomarkers for PCa patients. We validated potential biomarkers using publically available databases and experimentally using two separate cohorts of patients.
In order to identify regions of CpG methylation in PCa cells, we employed a restriction enzyme based differential methylation hybridization strategy that enriched for hypomethylated gDNA [22]. This approach differs from others that focused mainly on the enrichment and detection of hypermethylated DNA [23-26]. Although focusing on the hypermethylated fraction is very useful for detecting major epigenetic changes in some regions of the genome, the overall proportion of interrogated CpG probes is substantially lower compared to approaches that focus on the unmethylated DNA fraction [22]. In addition, since we treated cells with a demethylating agent, we reasoned that quantifying methylation based on the hypomethylated fraction would be more logical to gain further insights into the genome-wide methylation events. Interestingly, we found that even though DU-145 cells had approximately three times more probes with reduced methylation post-DAC treatment than 22Rv1 cells (32,511 vs. 11,212, Figure 1), the locational distribution of the CpG probes was very similar. Approximately 23% CpG probes were found in promoter regions while approximately 71% CpG probes were intragenic, in both cell lines. This implies a conserved function for CpG methylation outside promoter regions. The significance of gene body DNA methylation is not well understood. CpG islands in intragenic or intergenic regions have been shown to exhibit high tissue-specific DNA methylation [27]. Recently, Maunakea et al., [28] showed DNA methylation in gene bodies has a role in regulating cell context-specific alternative promoters. More specifically, they examined the human SHANK3 locus and its mouse homologue and demonstrated that this tissue-specific DNA methylation regulates intragenic promoter activity in vitro and in vivo. Moreover, intragenic DNA methylation has been shown to have an effect on chromatin structure [29] gene expression [30, 31], and transcriptional elongation [29, 32].
Our integrated analysis identified genes regulated by methylation in PCa cell lines. We examined methylation levels of these genes in PCa patient tumors and found a number of genes showed significantly differential methylation levels in GS8 vs. GS6 tumors, suggesting potential prognostic significance. We identified increased methylation in genes that have been previously reported, including, HOXD3, TBX15, DSC3 and TGFB2 in GS8 vs. GS6 tumors (p<0.01; Table 4 and Table 5) [16, 21, 33-35]. In addition, we identified a number of genes that have not been implicated in PCa previously. ACTA1 was shown to have increased methylation in GS8 vs GS6 tumors using genome wide methylation profiling (p<0.05; Table 4 and 5), in GS≥8 vs. GS7 tumors using the TCGA database (p=0.035, Table 6), and as well as an independent set of GS≥8 vs. GS≤6 tumors (p<0.05, Figure 3). ACTA1 is developmentally regulated and one study showed that its promoter methylation was suppressed in mice that were exposed to a diet with high amounts of nutritional phytoestrogens compared to control mice [36]. To the best of our knowledge, this is the only report in the literature examining ACTA1 methylation in cancer. In addition, we examined B4GALNT1 methylation levels and found higher methylation was associated with higher Gleason grade in the three independent patient cohorts examined; the TCGA publically available database (p=0.027, Table 6), and two experimentally verified patient tumor cohorts (p<0.001, Table 4; p<0.005, Figure 3). The B4GALNT1 gene codes for GalNAc-T, a glycosyltransferase, that is involved in the first step of the biosynthesis of all complex derivatives of asialo, a-, b- and c-series gangliosides. Increased mRNA expression of B4GALNT1 was observed after DAC treatment in colorectal cancer [37] yet this is the first report describing the association of B4GALNT1 methylation with PCa progression. These markers should be validated in independent patient populations.
Methylation-based testing that would allow for the accurate prediction of disease aggressiveness at the time of prostate biopsy would greatly benefit patients. Patients who have aggressive disease would be treated with radical prostatectomy, while patients predicted to have indolent disease would be treated with a less aggressive course of treatment, such as active surveillance, and would not have to needlessly endure the harsh side effects of radical prostatectomy. Epigenetic testing, by measuring increased methylation levels of three genes, GSTP1, APC and RASSF1, has been shown to accurately predict the presence of PCa in a negative biopsy (ConfirmMDx, MDxHealth, Irvine, CA, USA). Our study provides potential candidate genes for a methylation-based test for PCa aggressiveness. These candidate genes require large-scale validation.
This study provides a comprehensive analysis through combined methylation and gene expression data from cell lines and methylation data from tumor specimens with different Gleason scores to help gain a better understanding of the epigenetic mechanisms that contribute to PCa tumorigenesis. Our analysis identified many novel genes and interesting pathways that were dysregulated in PCa cell lines after treatment with the demethylating agent, which warrant a further in-depth analysis. These genes also represent potential prognostic markers for PCa patients and provide the foundation to a better understanding of the molecular mechanisms involved in PCa.
Materials and Methods
Cell Lines and Treatment
The human cell lines DU-145 (ATCC# HTB-81) and 22Rv1 (ATCC# CRL-2505) were cultured in RPMI 1640 media supplemented with 10% fetal bovine serum. Cells were maintained in humidified atmosphere with 5% CO2 at 37°C. DNA was extracted after harvesting the cells by trypsinization using the QIAamp DNA Mini Kit (Qiagen). Total RNA was extracted using Trizol (Invitrogen) as recommended by the manufacturer.
For treatment with 5-Aza 2’–deoxycitidine (DAC), DU-145 and 22Rv1 cells were plated in 6 cm dishes and incubated in culture medium with 2 μg/mL DAC for 4 days with medium change every 2 days. Since DAC is incorporated into the DNA of dividing cells and inhibits DNA methylation by forming covalent complexes with DNA methyltransferases, it was important to treat the cells at least over their doubling time. To ensure maximum demethylation, we treated the cells over two doubling times. The doubling time for DU-145 and 22Rv1 cells is 29 hrs and 40 hrs, respectively. Cells were harvested and genomic DNA and RNA were extracted as described above.
Patient Samples
We used two separate cohorts of patient tissues. The first patient cohort consisted of twenty fresh frozen PCa tissue samples [10 Gleason score (GS) 6 (3+3) and 10 GS 8 (4+4)] and were obtained from prostatectomy specimens of patients with prostate cancer (PCa) diagnosed between 2001 and 2007 at the University Health Network (UHN), Toronto. PCa specimens were subjected to histological examination by an expert pathologist (TVDK) to confirm tumor. The second patient cohort consisted of twenty formalin fixed paraffin embedded (FFPE) PCa tissue samples [10 Gleason score (GS) ≤6 and 10 GS 8≥] were obtained from prostatectomy specimens of patients with prostate cancer diagnosed between 2007 and 2011 at the UHN, Toronto. PCa specimens were reviewed by a GU pathologist (TVDK) to confirm Gleason grade. For both cohorts, patients who had therapy prior to surgery were not included in this study. All patients consented to the donation of removed tissue to the UHN tissue bank and samples were obtained according to protocols approved by the Research Ethics Boards of Mount Sinai Hospital and UHN, Toronto, ON.
DNA was collected and extracted as previously described [38]. Briefly, consecutive serial sections (10 micron each) were obtained from FFPE tissues and air-dried onto slides. Areas enriched in tumor cells (>80% neoplastic cellularity) representing each Gleason grade were marked on the slide and were manually micro dissected. Tissues were digested in 30μL proteinase K at 56°C overnight, followed by the addition of 20μL proteinase K and digestion for one hour at 56°C the following day. The recommended protocol for extraction of DNA from FFPE tissue using the QIAmp DNA mini kit (Qiagen) was then followed. DNA concentration was determined using the NanoDrop 2000 (Thermo Scientific, Wilmington, USA) and stored at 4°C.
Differential Methylation Profiling and CpG Island Microarray
We assayed for genome wide CpG island methylation in cell lines and tumor tissues using methylation array profiling strategy. Methylation status in 22Rv1 and DU-145 prostate cancer cell lines was determined by using differential methylation hybridization approach whereby the hypomethylated fraction was enriched pre (or prior to) and post-DAC treatment. The hypomethylated fraction was isolated by first digesting genomic DNA with the methylation-sensitive restriction enzymes HpaII and BstUI [22]. The cleaved ends were ligated with linkers, followed by further digestion with the restriction enzyme McrBc which cleaves DNA containing methylcytosine on one or both strands and will not digest unmethylated/hypomethylated DNA. Linker PCR reactions were then performed to generate the final target amplicons for microarray hybridization. Only the final hypomethylated amplicons were purified using the QIAquick PCR purification kit (Qiagen). We compared the hybridization patterns before and after DAC treatment in each cell line. Experiments were performed in triplicate.
Differential methylation status was determined by comparing the hypomethylated fraction before and after DAC treatment. Genes that showed higher signal in the hypomethylated fraction post-DAC were considered. Any probes that were not associated with a gene were removed. Probes were considered significant if p<0.05 and retained for further analysis.
CpG methylation status was assessed in tumor tissues by first performing differential methylation hybridization and selecting for the hypermethylated fraction as described previously [38]. Briefly, genomic DNA was digested with MseI. The cleaved ends were ligated with annealed H-12/H-24 linkers, followed by further digestion with two successive rounds of digestion with methylation-sensitive enzymes, HpaII and BstUI. Linker PCR reactions were then performed with pre-treated DNA to generate the final target amplicons for microarray hybridization. Final hypermethylated amplicons were purified using the QIAquick PCR purification kit (Qiagen). The reference sample consisted of DNA isolated from lymphocytes of six healthy men age-matched with PCa patients (GEO accession # GSE15298). Reference samples were similarly treated for final target generation and pooled amplicons were co-hybridized to the test cases for individual arrays. Methylation status was determined as described previously [38].
Microarray gene expression profiling and data analysis
Gene expression was assayed by microarray profiling performed on a custom Agilent 4×180 k oligo custom array [39] using triplicates of each of DAC-treated and non-treated cells. The custom microarray incorporates Agilent human gene expression protein-coding probes as well as non-coding probes, with the probes targeting exonic regions, 3′UTRs, 5′UTRs, as well as intronic and intergenic regions. After RNA isolation was performed (RNeasy Mini Kit, Qiagen) samples were analyzed by a Bioanalyzer (Agilent) to ensure high quality and integrity of RNA samples. 200ng of RNA from each sample was amplified and labeled according to the protocol for One-Color Microarray-Based Gene Expression Analysis (Low Input Quick Amp Labeling Kit, Agilent). The input RNA was reversed transcribed into cDNA, using an oligo-dT-promoter primer, which introduces a T7 promoter region. The subsequent in vitro transcription uses a T7 RNA polymerase, which simultaneously amplifies target material and incorporates cyanine 3-labeled CTP. cDNA synthesis was performed at 40°C for 2 h, respectively. The labeled cRNA was purified with RNEasy Mini spin columns (Qiagen) and quantified using a Nanodrop-1000. 1650 ng cRNA from each sample were loaded onto 4×180 k custom microarray (GEO platform accession GPL16604) and allowed to hybridize at 65°C for 17 h. The arrays were scanned with the Agilent Microarray Scanner G2565CA.
Microarray data were processed with Agilent Feature Extraction Software (v10.7.3.1). A quantile between array normalization was applied and differential expression was determined using a Bayesian adjusted t-statistic from a Linear Models for Microarray Data (LIMMA) linear model. Gene expression was considered significant if fold change was >1.25 and p <0.05 (adjusted for a false discovery rate of 5%).
Gene Set Enrichment Analysis (GSEA)
Pathway enrichment analyses were performed on 22Rv1 and DU-145 cell line expression array datasets (DAC treated) to determine pathways or biological processes over-represented in genes with increased or decreased expression following DAC treatment. Two gene lists were generated for pathway enrichment analyses by identifying unique genes within each expression dataset (treated 22Rv1 and DU145 cells). Genes were pre-ranked according to the p-value and fold-change associated with differential expression [-log(p-value)*SIGN(fold-change)]. Genes with p-value less than 0.001 were assigned equal ranking. Further, in cases where distinct genes indicated multiple significant probes, the greatest absolute value was taken. The software used for pathways enrichment analysis was Gene Set Enrichment Analysis (GSEA) [40, 41]. Each gene list was uploaded into GSEA and the program was run with 1000 gene set permutations to calculate false discovery rate using multiple hypothesis testing. Downloaded gene sets [http://download.baderlab.org/EM_Genesets/September_14_2013/Human/symbol/] were used to discover over-represented pathways. GSEA enrichment results were shown using normalized enrichment scores (NES), which is a value assigned to each gene set after normalization across all analysed gene sets. NES is calculated by the following formula: NES = actual ES/mean (ESs against all permutations of the dataset), and is recommended as the primary statistic to examine GSEA results.
Prognostic significance and statistical analyses
In order to assess the prognostic ability of methylated genes, we queried the cBio Cancer Genomics Portal (www.cbioportal.org/publicportal/) and The Cancer Genome Atlas (TCGA) database for methylation data in prostate adenocarcinoma patients. Methylation β-values for identified genes of 248 patients with primary PCa using ‘Level 3’ methylation data [normalized gene expression data derived from the Cancer Genome Characterization Center (CGCC) at the University of North Carolina (unc.edu) using the Illumina Infinium Human Methylation 450 platform] were accessed. Clinical information and survival data were obtained from The Cancer Genome Atlas (TCGA), available through the cBio Cancer Genomics Portal (www.cbioportal.org/publicportal/). Clinical data was available for 124 patients (Supplementary Table 1). We correlated methylation levels with Gleason score using the Chi-squared test.
MethyLight Analysis
DNA methylation analysis was performed on PCa tumor specimens recruited from UHN using the semi-quantitative MethyLight assay [42]. Briefly, 20ng of bisulfite-converted genomic DNA was amplified using locus specific PCR primers flanking an oligonucleotide probe with a 5’ fluorescent reporter dye and a 3’ quencher dye. Primers and probe sequences used for the target genes, ACTA1 and B4GALNT1, and the reference gene, ALU-C4 are shown in Table 1. Methylation levels were assessed by the Percent Methylated Reference (PMR), which is calculated by dividing the target gene:Alu-C4 ratio of a sample by the target gene:Alu-C4 ratio of commercially available fully methylated DNA (Millipore) and multiplying by 100. The Alu-C4 PCR products (generated from a consensus CpG-devoid region of the ALU repetitive element) were used as controls to normalize for input DNA. Samples were analyzed using the ABI 7500 RT-PCR thermocycler [43]. Cycling conditions were as follows; 95°C for 10 minutes, followed by 50 cycles of 95°C for 15 sec and 60°C for 1 minute. Samples were analyzed in duplicate.
Acknowledgements
We would like to thank Dr. Gary Bader and Dr. Ruth Isserlin (University of Toronto) for their input with the Gene Set Enrichment Analysis and discussion.
The authors would like to acknowledge support from Ontario Institute for Cancer Research (OICR) Personalized Medicine Research Fund #10Nov-412, The Bill and Kathleen Troost Innovation Grant of the Canadian Cancer Society (grant#701456) and Prostate Cancer Canada (PCC) (#2011-700)(to B. Bapat, N. Fleshner, T. van der Kwast). Nicole White-Al Habeeb is funded by the Canadian Institutes of Health Research, Post-doctoral Fellowship program.
Conflict of Interest
The authors have no conflict of interest to declare.
References
1. Siegel R, Ma, J., Zou, Z. and Jemal, A. Cancer statistics, 2014. CA: A Cancer Journal for Clinicians. 2014; 64(1):9-29.
2. Center MM, Jemal A, Lortet-Tieulent J, Ward E, Ferlay J, Brawley O and Bray F. International variation in prostate cancer incidence and mortality rates. Eur Urol. 2012; 61(6):1079-1092.
3. Jeronimo C and Henrique R. Epigenetic biomarkers in urological tumors: A systematic review. Cancer Lett. 2014; 342(2):264-274.
4. Troyer DA, Mubiru J, Leach RJ and Naylor SL. Promise and challenge: Markers of prostate cancer detection, diagnosis and prognosis. Dis Markers. 2004; 20(2):117-128.
5. Eden A, Gaudet F, Waghmare A and Jaenisch R. Chromosomal instability and tumors promoted by DNA hypomethylation. Science. 2003; 300(5618):455.
6. Jones PA and Baylin SB. The fundamental role of epigenetic events in cancer. Nat Rev Genet. 2002; 3(6):415-428.
7. Roupret M, Hupertan V, Yates DR, Catto JW, Rehman I, Meuth M, Ricci S, Lacave R, Cancel-Tassin G, de la Taille A, Rozet F, Cathelineau X, Vallancien G, Hamdy FC and Cussenot O. Molecular detection of localized prostate cancer using quantitative methylation-specific PCR on urinary cells obtained following prostate massage. Clin Cancer Res. 2007; 13(6):1720-1725.
8. Ellinger J, Haan K, Heukamp LC, Kahl P, Buttner R, Muller SC, von Ruecker A and Bastian PJ. CpG island hypermethylation in cell-free serum DNA identifies patients with localized prostate cancer. Prostate. 2008; 68(1):42-49.
9. Baden J, Adams S, Astacio T, Jones J, Markiewicz J, Painter J, Trust C, Wang Y and Green G. Predicting prostate biopsy result in men with prostate specific antigen 2.0 to 10.0 ng/ml using an investigational prostate cancer methylation assay. J Urol. 2011; 186(5):2101-2106.
10. Cottrell S, Jung K, Kristiansen G, Eltze E, Semjonow A, Ittmann M, Hartmann A, Stamey T, Haefliger C and Weiss G. Discovery and validation of 3 novel DNA methylation markers of prostate cancer prognosis. J Urol. 2007; 177(5):1753-1758.
11. Banez LL, Sun L, van Leenders GJ, Wheeler TM, Bangma CH, Freedland SJ, Ittmann MM, Lark AL, Madden JF, Hartman A, Weiss G and Castanos-Velez E. Multicenter clinical validation of PITX2 methylation as a prostate specific antigen recurrence predictor in patients with post-radical prostatectomy prostate cancer. J Urol. 2010; 184(1):149-156.
12. Molinari C, Casadio V, Foca F, Zingaretti C, Giannini M, Avanzolini A, Lucci E, Saragoni L, Passardi A, Amadori D, Calistri D and Zoli W. Gene methylation in rectal cancer: predictive marker of response to chemoradiotherapy? J Cell Physiol. 2013; 228(12):2343-2349.
13. van den Bent MJ, Erdem-Eraslan L, Idbaih A, de Rooi J, Eilers PH, Spliet WG, den Dunnen WF, Tijssen C, Wesseling P, Sillevis Smitt PA, Kros JM, Gorlia T and French PJ. MGMT-STP27 methylation status as predictive marker for response to PCV in anaplastic Oligodendrogliomas and Oligoastrocytomas. A report from EORTC study 26951. Clin Cancer Res. 2013; 19(19):5513-5522.
14. Wrangle J, Machida EO, Danilova L, Hulbert A, Franco N, Zhang W, Glockner S, Tessema M, Van Neste L, Easwaran H, Schuebel KE, Licchesi J, Hooker CM, Ahuja N, Amano J, Belinsky SA, et al. Functional Identification of Cancer-Specific Methylation of CDO1, HOXA9, and TAC1 for the Diagnosis of Lung Cancer. Clin Cancer Res. 2014.
15. Dietrich D, Jung M, Puetzer S, Leisse A, Holmes EE, Meller S, Uhl B, Schatz P, Ivascu C and Kristiansen G. Diagnostic and Prognostic Value of SHOX2 and SEPT9 DNA Methylation and Cytology in Benign, Paramalignant and Malignant Pleural Effusions. PLoS One. 2013; 8(12):e84225.
16. Liu L, Kron KJ, Pethe VV, Demetrashvili N, Nesbitt ME, Trachtenberg J, Ozcelik H, Fleshner NE, Briollais L, van der Kwast TH and Bapat B. Association of tissue promoter methylation levels of APC, TGFbeta2, HOXD3 and RASSF1A with prostate cancer progression. Int J Cancer. 2011; 129(10):2454-2462.
17. Kron KJ, Liu L, Pethe VV, Demetrashvili N, Nesbitt ME, Trachtenberg J, Ozcelik H, Fleshner NE, Briollais L, van der Kwast TH and Bapat B. DNA methylation of HOXD3 as a marker of prostate cancer progression. Lab Invest. 2010; 90(7):1060-1067.
18. Richiardi L, Fiano V, Vizzini L, De Marco L, Delsedime L, Akre O, Tos AG and Merletti F. Promoter methylation in APC, RUNX3, and GSTP1 and mortality in prostate cancer patients. J Clin Oncol. 2009; 27(19):3161-3168.
19. Henrique R, Ribeiro FR, Fonseca D, Hoque MO, Carvalho AL, Costa VL, Pinto M, Oliveira J, Teixeira MR, Sidransky D and Jeronimo C. High promoter methylation levels of APC predict poor prognosis in sextant biopsies from prostate cancer patients. Clin Cancer Res. 2007; 13(20):6122-6129.
20. Syeed N, Syed Sameer A, Hamid A, Shah ZA, Afroze D, Rasool R and Siddiqi MA. Promoter methylation profile of GSTP1 and RASSF1A in benign hyperplasia and metastatic prostate cancer patients in a Kashmiri population. Mol Med Rep. 2010; 3(5):883-887.
21. Kron K, Liu L, Trudel D, Pethe V, Trachtenberg J, Fleshner N, Bapat B and van der Kwast T. Correlation of ERG expression and DNA methylation biomarkers with adverse clinicopathologic features of prostate cancer. Clin Cancer Res. 2012; 18(10):2896-2904.
22. Schumacher A, Kapranov P, Kaminsky Z, Flanagan J, Assadzadeh A, Yau P, Virtanen C, Winegarden N, Cheng J, Gingeras T and Petronis A. Microarray-based DNA methylation profiling: technology and applications. Nucleic Acids Res. 2006; 34(2):528-542.
23. Ashktorab H, Daremipouran M, Goel A, Varma S, Leavitt R, Sun X and Brim H. DNA methylome profiling identifies novel methylated genes in African American patients with colorectal neoplasia. Epigenetics. 2014; 9(4).
24. Yan PS, Chen CM, Shi H, Rahmatpanah F, Wei SH and Huang TH. Applications of CpG island microarrays for high-throughput analysis of DNA methylation. J Nutr. 2002; 132(8 Suppl):2430S-2434S.
25. Ricketts CJ, Morris MR, Gentle D, Shuib S, Brown M, Clarke N, Wei W, Nathan P, Latif F and Maher ER. Methylation profiling and evaluation of demethylating therapy in renal cell carcinoma. Clin Epigenetics. 2013; 5(1):16.
26. Glossop JR, Nixon NB, Emes RD, Haworth KE, Packham JC, Dawes PT, Fryer AA, Mattey DL and Farrell WE. Epigenome-wide profiling identifies significant differences in DNA methylation between matched-pairs of T- and B-lymphocytes from healthy individuals. Epigenetics. 2013; 8(11):1188-1197.
27. Zeng J, Nagrajan HK and Yi SV. Fundamental diversity of human CpG islands at multiple biological levels. Epigenetics. 2014; 9(4).
28. Maunakea AK, Nagarajan RP, Bilenky M, Ballinger TJ, D’Souza C, Fouse SD, Johnson BE, Hong C, Nielsen C, Zhao Y, Turecki G, Delaney A, Varhol R, Thiessen N, Shchors K, Heine VM, et al. Conserved role of intragenic DNA methylation in regulating alternative promoters. Nature. 2010; 466(7303):253-257.
29. Lorincz MC, Dickerson DR, Schmitt M and Groudine M. Intragenic DNA methylation alters chromatin structure and elongation efficiency in mammalian cells. Nat Struct Mol Biol. 2004; 11(11):1068-1075.
30. Gavery MR and Roberts SB. Predominant intragenic methylation is associated with gene expression characteristics in a bivalve mollusc. PeerJ. 2013; 1:e215.
31. Huang YZ, Zhan ZY, Sun YJ, Cao XK, Li MX, Wang J, Lan XY, Lei CZ, Zhang CL and Chen H. Intragenic DNA methylation status down-regulates bovine IGF2 gene expression in different developmental stages. Gene. 2014; 534(2):356-361.
32. Shenker N and Flanagan JM. Intragenic DNA methylation: implications of this epigenetic mechanism for cancer research. Br J Cancer. 2012; 106(2):248-253.
33. Carvalho RH, Hou J, Haberle V, Aerts J, Grosveld F, Lenhard B and Philipsen S. Genomewide DNA methylation analysis identifies novel methylated genes in non-small-cell lung carcinomas. J Thorac Oncol. 2013; 8(5):562-573.
34. Putnik M, Zhao C, Gustafsson JA and Dahlman-Wright K. Global identification of genes regulated by estrogen signaling and demethylation in MCF-7 breast cancer cells. Biochem Biophys Res Commun. 2012; 426(1):26-32.
35. Pan J, Chen Y, Mo C, Wang D, Chen J, Mao X, Guo S, Zhuang J and Qiu S. Association of DSC3 mRNA Down-Regulation in Prostate Cancer with Promoter Hypermethylation and Poor Prognosis. PLoS One. 2014; 9(3):e92815.
36. Guerrero-Bosagna CM, Sabat P, Valdovinos FS, Valladares LE and Clark SJ. Epigenetic and phenotypic changes result from a continuous pre and post natal dietary exposure to phytoestrogens in an experimental population of mice. BMC Physiol. 2008; 8:17.
37. Kawamura YI, Toyota M, Kawashima R, Hagiwara T, Suzuki H, Imai K, Shinomura Y, Tokino T, Kannagi R and Dohi T. DNA hypermethylation contributes to incomplete synthesis of carbohydrate determinants in gastrointestinal cancer. Gastroenterology. 2008; 135(1):142-151 e143.
38. Kron K, Pethe V, Briollais L, Sadikovic B, Ozcelik H, Sunderji A, Venkateswaran V, Pinthus J, Fleshner N, van der Kwast T and Bapat B. Discovery of novel hypermethylated genes in prostate cancer using genomic CpG island microarrays. PLoS One. 2009; 4(3):e4830.
39. Sieh S, Taubenberger AV, Rizzi SC, Sadowski M, Lehman ML, Rockstroh A, An J, Clements JA, Nelson CC and Hutmacher DW. Phenotypic characterization of prostate cancer LNCaP cells cultured within a bioengineered microenvironment. PLoS One. 2012; 7(9):e40217.
40. Subramanian A, Tamayo P, Mootha VK, Mukherjee S, Ebert BL, Gillette MA, Paulovich A, Pomeroy SL, Golub TR, Lander ES and Mesirov JP. Gene set enrichment analysis: a knowledge-based approach for interpreting genome-wide expression profiles. Proc Natl Acad Sci U S A. 2005; 102(43):15545-15550.
41. Mootha VK, Lindgren CM, Eriksson KF, Subramanian A, Sihag S, Lehar J, Puigserver P, Carlsson E, Ridderstrale M, Laurila E, Houstis N, Daly MJ, Patterson N, Mesirov JP, Golub TR, Tamayo P, et al. PGC-1alpha-responsive genes involved in oxidative phosphorylation are coordinately downregulated in human diabetes. Nat Genet. 2003; 34(3):267-273.
42. Eads CA, Danenberg KD, Kawakami K, Saltz LB, Blake C, Shibata D, Danenberg PV and Laird PW. MethyLight: a high-throughput assay to measure DNA methylation. Nucleic Acids Res. 2000; 28(8):E32.
43. Weisenberger DJ, Campan M, Long TI, Kim M, Woods C, Fiala E, Ehrlich M and Laird PW. Analysis of repetitive element DNA methylation by MethyLight. Nucleic Acids Res. 2005; 33(21):6823-6836.