
INTRODUCTION
Multiple myeloma is a malignancy characterized by proliferation of clonal plasma cells and is the second most commonly diagnosed hematologic malignancy [1]. Due to an aging population, myeloma cases will grow almost 60% between 2010 and 2030, ranking it third among all cancers in the rate of increase during this period [2]. Recent advances in the treatment of myeloma, including the introduction of several categories of novel agents, have contributed to a doubling of the median overall survival in myeloma patients [3, 4]. Among the most important of these classes are drugs that inhibit the proteasome [5, 6] such as bortezomib, and thereby interfere with intracellular regulated proteolysis, which occurs predominantly through the ubiquitin-proteasome pathway [7]. Protein turnover capacity is reduced during plasma cell differentiation, which increases proteasome load relative to capacity, and thereby induces cellular stress [8], which may explain the exquisite sensitivity of this tumor type to bortezomib, which upsets this balance further [9].
Despite the strong efficacy of proteasome inhibitors in the treatment of myeloma patients in the front-line, relapsed, refractory, and other settings, the majority of patients develop resistant disease [10] through mechanisms that are as yet incompletely understood. Early studies based on pre-clinical models described a role in resistance for bortezomib binding pocket mutations in the β5 proteasome subunit [11–13]. However, these mutations were later found to be absent from primary patient samples [14, 15], suggesting that they are not physiologically relevant. A more recent study utilizing both pre-clinical models and clinical data demonstrated the emergence of plasmablasts with reduced immunoglobulin production as another potential mechanism [16]. This would predict that all bortezomib-resistant patients should have non-secretory myeloma, and while this can be seen [17], it occurs in only a small fraction of patients. Thus, other mechanisms must contribute to acquired, or secondary resistance, as well as to primary, or de novo bortezomib resistance, which is demonstrated by the fact that the response rate in proteasome inhibitor-naive patients in the relapsed/refractory setting is under 50% [18, 19].
To better understand possible mechanisms of resistance, our group developed bortezomib-resistant human myeloma cell lines which, like primary samples, proved to have no β5 proteasome subunit mutations [20, 21]. In the current work, we used gene expression profiling (GEP) to identify down-regulation of Protein tyrosine phosphatase receptor-type O truncated (PTPROt) as being associated with bortezomib resistance. Conversely, over-expression of PTPROt induced cell cycle arrest and apoptosis, and also enhanced sensitivity to bortezomib. Mechanistic studies showed that PTPROt expression suppressed signaling through Protein kinase B/AKT, and this seemed to occur through an interaction with IQ motif containing GTPase activating protein 1 (IQGAP1). Importantly, higher PTPROt expression levels were associated with a greater likelihood of achieving a complete remission to single-agent bortezomib therapy, and with a longer survival after bortezomib therapy in the clinic. These data suggest that PTPROt expression levels could be used to predict which patients could most benefit from bortezomib-based therapy, and point to strategies targeting AKT signaling in patients with low PTPROt expression as a possible mechanism to overcome resistance.
RESULTS
PTPROt and bortezomib resistance
To better understand mechanisms responsible for bortezomib resistance (BR), we analyzed GEP data comparing drug-naïve ANBL-6, KAS-6/1, and RPMI 8226 myeloma cell lines and their BR counterparts. In particular, we searched for genes that would be significantly either up- or down-regulated consistently in all three model systems. PTPROt met these criteria in that ANBL-6, KAS-6/1, and RPMI 8226 BR cells had lower PTPROt expression at both the ILMN_1720113 (Figure 1A) and ILMN_23168783 (Figure 1B) probes for this gene on the Illumina microarray. To confirm these microarray data, we performed quantitative RT-PCR on RNA independently extracted from the same paired cell lines. These studies also showed reduced expression of PTPROt in the BR cells, which ranged from a 3- to 300-fold reduction (Figure 1C).
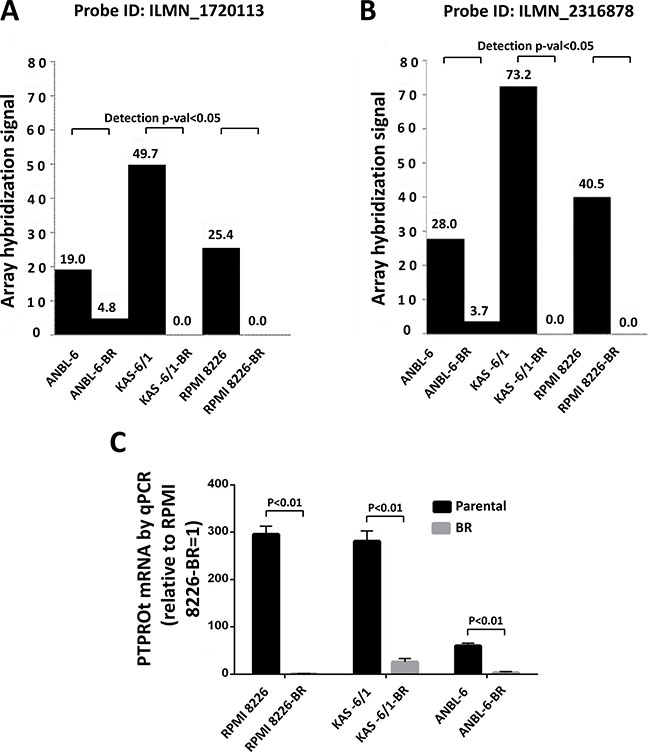
Figure 1: PTPROt expression in bortezomib-resistant and drug-naïve cell lines. Gene expression profiling data from Illumina microarrays showing PTPROt expression in bortezomib-resistant (BR) cell lines and their drug-naïve counterparts at PTPRO probe (A) ILMN_1720113 and (B) ILMN_23168783. (C) Quantitative real-time PCR analysis of these same cell lines is shown with data normalized to the signal in RPMI 8226-BR cells, which were arbitrarily set to 1.0. Error bars indicated standard deviation, and the differences between the BR cells and their controls were all significant (P < 0.01 by the Students t-test).
Impact of PTPROt on proliferation and apoptosis
PTPROt has been described to play roles in B-cell receptor signaling and proliferation [22, 23], but it has not been linked to the pathobiology of multiple myeloma. To better understand its potential role in plasma cells, we next over-expressed either wild-type (wt) PTPROt or a substrate trapping phosphatase-dead domain mutant (DC-mt), and compared their effects to those of an empty vector. Studies of cell proliferation showed that over-expression of wt PTPROt, but not the kinase-dead DC mutant, significantly slowed proliferation of drug-naïve MM1.S (Figure 2A) and KAS-6/1 (Figure 2B) myeloma cells versus controls. Since especially low PTPROt expression was seen in the bortezomib-resistant cells, we then over-expressed it in ANBL-6-BR and RPMI 8226-BR cells, and also found reduced proliferation (not shown). Cell cycle analysis showed that these cells, as well as drug-naïve MM1.S cells over-expressing wt PTPROt, had an increase in the sub-G0/G1 fraction (Figure 2C). Consistent with the possibility that there was at least some induction of programmed cell death, forced PTPROt expression increased levels of cleaved Caspases in ANBL-6 and H929 myeloma cells (Figure 2D).
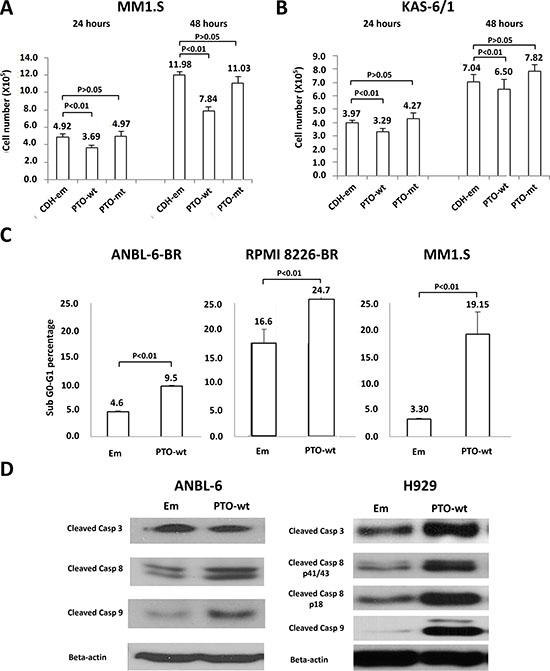
Figure 2: Expression of PTPROt and cell proliferation and apoptosis. Myeloma cell lines were transduced with Lentiviruses expressing wild-type PTPRPOt (PTO-wt), a substrate-trapping catalytic domain-inactivating mutant (PTO-mt), or an empty vector control (CDH-em). Cells expressing the constructs were selected by flow cytometry for green fluorescent protein expression, and then seeded into 12-well plates at a density of 3 × 10⁵ cells/well and cultured. The cell number was counted in (A) MM1.S and (B) KAS-6/1 cells at 24 (left set of bars) and 48 (right set of bars) hours, with all experiments performed in triplicate. Error bars indicate standard deviation, and the differences between the wt cells and their controls were all significant (P < 0.01 by the students t-test). (C) ANBL-6-BR (left panel), RPMI 8226 BR (middle panel), and MM1.S cells with either an empty vector (Em) or wt PTPROt were evaluated for cell death by propidium iodide staining and flow cytometry. Bar graphs show the percentage of cells in the apoptotic sub-G0/G1 fraction, error bars indicate standard deviation, and the differences between the wt cells and their controls were all significant (P < 0.01 by the students t-test). (D) ANBL-6 (left panel) and H929 (right panel) cells prepared as above were lysed and extracts were subjected to Western blotting looking for the abundance of cleaved Caspases (Casp) 3, 8, and 9, with β-actin as a loading control.
PTPROt acts as a chemosensitizer
In that PTPROt by itself induced apoptosis, it seemed possible that it could also enhance sensitivity to chemotherapeutics, providing a rationale for plasma cells to look for ways to suppress its expression to avoid cell death. We therefore first over-expressed wt PTPROt or an empty vector control, and then exposed stable cell lines to bortezomib over a range of concentrations for 24 hours. Interestingly, when normalized to vehicle-treated controls, both ANBL-6 (Figure 3A) and KAS-6/1 (Figure 3B) cells over-expressing wt PTPROt were consistently more sensitive to the induction of programmed cell death by bortezomib. Flow analysis of KAS-6/1 cells showed that this was associated with dual activation of Caspase 8 (Figure 3C, left panel) and Caspase 9 (Figure 3C, middle panel). Notably, this finding was not restricted to bortezomib, as ANBL-6 cells over-expressing wt PTPROt also had increased levels of Caspase cleavage after exposure to cisplatin (Figure 3D, left and right panels), and melphalan (Figure 3D, right panel), both of which are commonly used chemotherapeutics against myeloma.
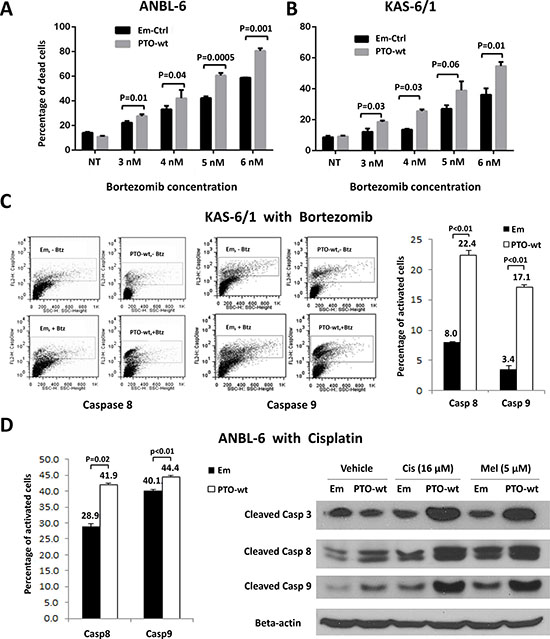
Figure 3: PTPROt and chemosensitivity in multiple myeloma. (A) ANBL-6 or (B) KAS-6/1 cells transduced with an empty vector (Em-Ctrl) or one expressing wt PTPROt (PTO-wt) were exposed to either vehicle or the indicated concentrations of bortezomib for 24 hours. Programed cell death was examined by propidium iodide staining and flow cytometry as described above. Bar graphs show the percentage of cells with a sub-G0/G1 DNA content, and statistical significance data are provided in the panel. (C) KAS-6/1 cells with either an empty vector or wild-type PTPROt were exposed to vehicle or bortezomib and analyzed for Caspase 8 (left panel) or Caspase 9 (middle panel) cleavage using fluorogenic substrates and flow cytometry. (D) ANBL-6 cells with an empty vector or wt PTPROt were exposed to either cisplatin (16 μM) or melphalan (5 μM) and analyzed for cell death by flow cytometry (left panel) for Caspase 8 or 9 cleavage or by Western blotting (right panel).
Decreased AKT activation in PTPROt over-expressing cells
Protein kinase B/AKT signaling has been linked to bortezomib resistance [24–26], and we therefore wondered if PTPROt could influence AKT. To test this, we established MM1.S-, ANBL-6-, KAS-6/1-, and H929-derived cells containing an empty vector, or a wt or phosphatase-dead mutant PTPROt, and examined AKT phosphorylation [27]. Compared to the vector control, wt PTPROt reduced phospho-Ser473 levels in all four cell lines (Figure 4A). In contrast, the phosphatase-dead DC mutant did not have this effect in three cell lines, though there was some reduction in ANBL-6 cells, suggesting possible involvement of a phosphatase domain-independent component in suppression of AKT signaling by PTPROt in this one line. Downstream AKT targets include Myeloid cell leukemia-1 (MCL1)[28], BCL-2 interacting mediator of cell death (BIM)[29], and Glycogen synthase kinase-3 alpha (GSK3)[30]. When we looked at these, anti-apoptotic MCL1 was decreased in MM1.S and H929 cells (Figure 4B) in the presence of wt PTPROt. Conversely, pro-apoptotic BIM isoforms, including BIMEL, were increased, while inhibitory GSK3 phosphorylation was reduced, implying that AKT activity was reduced. Next, we performed AKT kinase assays using a GSK3 fusion protein, which confirmed that reduced substrate phosphorylation was seen in MM1.S and H929 cells over-expressing wt PTPROt, but not the empty vector or DC mutant (Figure 4C). These corresponded with lower levels of phospho-AKT in the presence of the wt PTPROt. Finally, MM1.S cells expressing wt or DC mutant PTPROt were treated with the Phospho-inositide 3-kinase (PI3K) inhibitor LY294002 [31], and the AKT inhibitor MK2206 [32]. While both drugs reduced cellular viability in a concentration-dependent manner, the presence of wt PTPROt potentiated this effect (Figure 4D), likely due to the lower level of AKT activity in these cells at baseline.
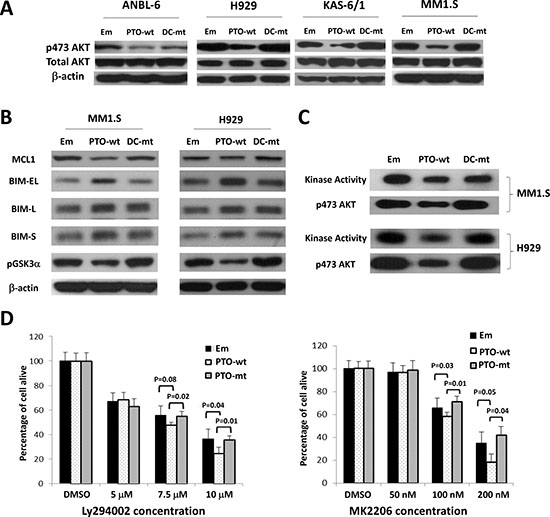
Figure 4: Impact of PTPROt on AKT signaling. (A) Lysates from ANBL-6, H929, KAS-6/1, and MM1.S cells expressing wt (PTO-wt) or mut PTPROt (DC-mut), or an empty vector control (Em), were analyzed by Western blotting for phospho-Ser473-AKT, total AKT, or β-actin. (B) The membranes with lysates from MM1.S and H929 cells were then re-examined for the expression and activation status of downstream AKT targets including MCL1, BIM isoforms, and phospho-Ser219-GSK. (C) An in vitro AKT kinase activity assay was performed using an antibody to precipitate AKT, followed by exposure of the precipitate to a GSK fusion protein in the presence of ATP. Western blotting was used to show AKT kinase activity (top panel for each cell line), as well as the level of phospho-AKT(S473) (bottom panels). (D) MM1.S cells expressing the indicated constructs were exposed to vehicle (DMSO), the PI3K inhibitor LY294002 (left panel), or the AKT inhibitor MK2206 (right panel). A tetrazolium assay was then used to determine viability with experiments performed in five replicates. Error bars represent standard deviation and statistical significance values are provided in the panels.
PTPROt interacts with and dephosphorylates IQGAP1
Since PTPROt is a phosphatase, the most straightforward mechanism for it to inhibit AKT would be through direct binding and dephosphorylation of this target. To examine if this could be the case, we over-expressed hemagglutinin (HA)- and FLAG-tagged wt or DC mutant PTPROt, as well as a vector control, and subjected the cells to tandem immunoprecipitation with anti-HA and anti-FLAG antibodies. The obtained, highly purified immunoprecipitates were then subjected to mass spectrometry analysis. One of the highest scoring peptides identified with both wild-type and substrate-trapping DC mutant PTPROt was IQ motif containing GTPase activating protein 1 (IQGAP1) (Table 1), a scaffold protein, which has been described as an activator of AKT signaling [33, 34]. In order to further substantiate the existence of a PTPROt-IQGAP1 interaction, we co-transfected 293T cells with vectors expressing c-Myc-tagged IQGAP1 and HA-tagged wt or DC mutant PTPROt. Immunoprecipitation was then performed from cell lysates with an anti-c-Myc antibody, and showed that both wt and DC mutant PTPROt were precipitated in concert with IQGAP1, although the co-precipitation of wtPTPROt was less efficient (Figure 5A). 293T expressed c-Myc-tagged IQGAP1 had also pulled down wt and DC mutant PTPROt expressed in E. coli (Figure 5B).
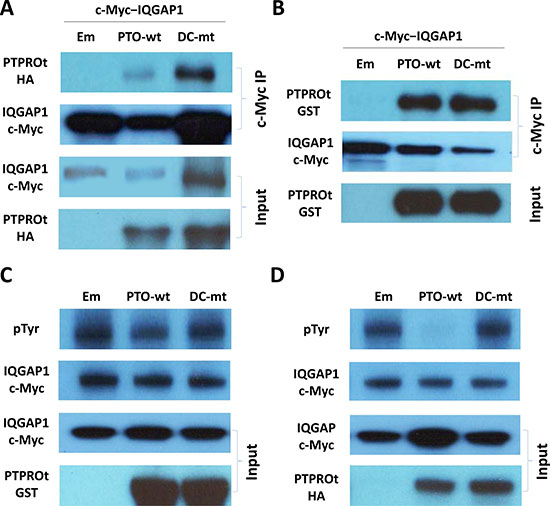
Figure 5: PTPROt interactions with IQGAP1. (A) Lysates from 293T cells co-transfected with vectors expressing c-Myc-tagged IQGAP1 and either hemagglutinin (HA)-tagged wt PTPROt, DC-mt PTPROt, or an empty vector were subjected to immunoprecipitation with an anti-c-Myc antibody. Precipitates were then analyzed for the indicated proteins on Western blot using anti-c-Myc and anti-HA antibody. (B) Lysates from E. coli expressing GST-tagged wt PTPROt, DC-mt PTPROt, or an empty vector were subjected to pull down with c-Myc–tagged IQGAP1 (expressed and purified from 293T cells) and c-Myc antibody beads. Precipitates were then analyzed for the indicated proteins on Western blot using anti-c-Myc and anti-GST antibodies. (C) c-Myc-tagged IQGAP1 (expressed and purified from 293T cells) and GST-tagged wt PTPROt, DC-mt PTPROt, or empty vector (expressed and purified from E. coli) were combined and incubated in dephosphorylation buffer for one hour. Products were then analyzed for the total and phosphorylated IQGAP1 using anti-c-Myc tag and anti-pTyr antibodies, respectively. (D) c-Myc-tagged IQGAP1 (expressed and purified from 293T cells) and wt PTPROt, DC-mt PTPROt, or empty vector (expressed and purified from 293T cells) were combined, reacted and then analyzed as in C.
Table 1: PTPROt interacting partners identified by co-immunoprecipitation and mass spectrometry1
Gene Symbol |
Wild-type PTPROt |
Mutant PTPROt |
Entrez Gene Name |
|---|---|---|---|
PTPRO |
+ |
Protein tyrosine phosphatase, receptor type, O |
|
ADAD1 |
+ |
Adenosine deaminase domain containing 1 (testis-specific) |
|
CACNA1I |
+ |
Calcium channel, voltage-dependent, t type, alpha 1I subunit |
|
GHSR |
+ |
Growth hormone secretagogue receptor |
|
HNRNPU |
+ |
Heterogeneous nuclear ribonucleoprotein U (Scaffold attachment factor A) |
|
ZNF638 |
+ |
Zinc finger protein 638 |
|
ADAMTS5 |
+ |
ADAM metallopeptidase with thrombospondin type 1 motif, 5 |
|
RPL13 |
+ |
Ribosomal protein L13 |
|
IQGAP1 |
+ |
+ |
IQ motif containing GTPase activating protein 1 |
LSM14A |
+ |
+ |
LSM14A, SCD6 homolog A (S. cerevisiae) |
1A “+” indicates detection of an interaction with either wild-type or substrate trapping DC mutant PTPROt or both.
In that IQGAP1 is a common substrate of receptor tyrosine kinases [35], we next hypothesized that a physical interaction between PTPROt and IQGAP1 could lead to dephosphorylation of the latter. We therefore performed an in vitro dephosphorylation assay using c-Myc-tagged IQGAP1 immunoprecipitated from 293T cells as the substrate, and GST-tagged wt or DC mutant PTPROt expressed in E. coli as the enzyme in the reaction. Confirming our assumption, the wt but not the substrate-trapping DC mutant PTPROt reduced the level of tyrosine phosphorylation of IQGAP1 (Figure 5C) compared to controls. We repeated these experiments with HA-tagged wt or DC mutant PTPROt expressed in 293T cells as the enzyme. Here, in an eukaryotic cell background, PTPROt almost quantitatively reduced IQGAP1 phosphorylation (Figure 5D), indicating that perhaps further post-translational modifications in 293T cells activate PTPROt to a greater extent than is possible in prokaryotic cells.
Clinical relevance of PTPROt expression
To explore the possibility that PTPROt could be of clinical relevance in predicting patient outcomes, we first analyzed the Millennium Pharmaceuticals dataset. This contains clinically annotated GEP data of myeloma patients with relapsed and/or refractory disease who were treated on phase II or III studies with bortezomib. Responses in this database were classified using the European Group for Blood and Marrow Transplantation criteria as fitting either a complete response (CR), partial response (PR), minimal response (MR), stable disease (SD), or progressive disease (PD). Patients were then stratified into high or low PTPROt expression groups based on the hybridization signals of the PTPROt probe from the cDNA microarray data as described in Materials and Methods. Notably, 9/14 (64%) patients who achieved a CR had high PTPROt expression levels (Table 2), while among patients who experienced PD, 45/66 (68%) had low PTPROt expression levels (P < 0.05). Differences between patients who achieved a CR or PD and any other response group were not statistically significant. We next analyzed the Arkansas (N = 414) and the Millennium Pharmaceuticals (N = 264) datasets from the Multiple Myeloma Genomics Portal (MMGP) (http://www.broadinstitute.org/mmgp/home) to examine if PTPROt could have an impact on long-term outcomes. In the Arkansas dataset of patients treated with a bortezomib-based induction regimen, those with a PTPROt expression level higher than the median had a superior overall survival than those whose myeloma cells had a median or lower PTPROt expression (Figure 6A; P = 0.0175). Similarly, in the Millennium dataset, higher PTPROt expression was associated with a better median survival (Figure 6B; P = 0.0003). Kaplan-Meier analysis of the latter showed that the median survival in the high PTPROt group was 691 days, while for the low group it was 391 days. Cox regression analysis (Breslow method) also showed that for every 100 interval of PTPROt hybridization signal the hazard ratio was 0.426587 (P = 0.0046).
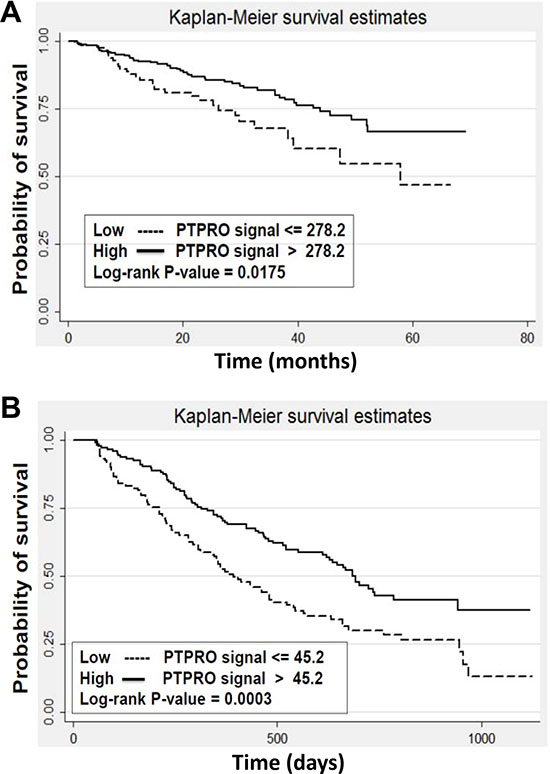
Figure 6: Expression of PTPROt and myeloma patient outcomes. Kaplan-Meier survival analysis was performed from (A) the University of Arkansas dataset (N = 414) of newly diagnosed patients receiving bortezomib-based therapy, and (B) the Millennium Pharmaceuticals dataset (N = 264) of patients with relapsed/refractory myeloma who received single-agent bortezomib. Patients were stratified into groups with a greater than median PTPROt expression (solid line curves) or an expression that was at or below the median (dotted line curves). Log-rank P-values were calculated and are indicated in the two panels.
Table 2: PTPROt expression levels and clinical responses to bortezomib from the Millennium Pharmaceuticals database on the Multiple Myeloma Genomics Portal
Response |
PTPROt Expression Level |
Proportion with High PTPROt (%) |
|
|---|---|---|---|
High |
Low |
||
CR*1 |
9 |
5 |
64.3 |
PR |
31 |
45 |
40.8 |
MR |
11 |
12 |
47.8 |
NC |
27 |
33 |
45.0 |
PD* |
21 |
45 |
31.8 |
*P < 0.05
1Abbreviations: CR, complete response; MR, minor response, NC, no change; PD, progressive disease; PR, partial response.
DISCUSSION
PTPRO is an R3 receptor-type protein tyrosine phosphatase (PTP) expressed in lymphoid cells as an alternatively spliced variant, PTPROt, with a short, 8 amino acid long, extracellular domain [22]. Available data suggest that PTPROt is developmentally regulated during B-cell differentiation, and may play a role as a tumor suppressor in lymphomagenesis. Its levels are decreased in germinal center-derived lymphomas, in which exogenous PTPROt expression induced G0/G1 cell cycle arrest, indicating its role in the growth control of B-cells [22]. This may occur in part through the ability of PTPROt to dephosphorylate the Spleen tyrosine kinase SYK, producing an effect on tonic B-cell receptor (BCR) signaling [23]. Interestingly, PTPROt may itself be a target for repression by BCL6 as the latter modulates tonic BCR signaling in diffuse large B-cell lymphoma [36]. However, its function in the context of multiple myeloma had not previously been studied. We found PTPROt expression was down-regulated in bortezomib-resistant models (Figure 1), while its over-expression suppressed myeloma proliferation and induced apoptosis (Figure 2). Moreover, rescue experiments in which PTPROt was expressed in bortezomib-resistant cells, and studies in drug-naïve cells, showed that it sensitized these models to proteasome inhibition, as well as the alkylating agent melphalan and the alkylating-like drug cisplatin (Figure 3). An association was then found between increased PTPROt expression and reduced levels of phospho-AKT, as well as reduced expression or activity of downstream AKT targets (Figure 4). Biochemical studies showed that PTPROt associated with and dephosphorylated IQGAP1 (Figure 5), providing one possible link between PTPROt and AKT. Finally, mining of clinical trial databases showed a direct relationship between increased PTPROt and both improved response quality to bortezomib (Table 2) as well as a longer overall survival after bortezomib-based therapy (Figure 6).
An interesting question which we are currently studying is the manner in which expression of PTPROt is down-regulated by plasma cells during the course of acquiring bortezomib resistance. One possibility is that PTPROt is known to be subject to aberrant methylation [37, 38], and in some malignancies, such as breast cancer, this has been associated with an inferior prognosis [39]. Notably, a recent study found aberrant methylation of several membrane-bound tyrosine phosphatase genes in acute lymphoblastic leukemia including PTPRO, and this was associated with a reduction in phosphorylated Extracellular signal-regulated kinases 1/2 and AKT, among others [40]. Another mechanism could be through loss of heterozygosity (LOH), and indeed LOH at the 12p12.3 locus of PTPROt has been identified in childhood acute lymphoblastic leukemia, where mapping studies suggested the presence of a tumor suppressor other than p27KIP1 [41]. Notably, in preliminary studies of array comparative genomic hybridization data from the MMGP, we found that 6/62 (9.7%) patients and 12/48 (25%) myeloma cell lines had decreased copy number of the 12p12.3 region (not shown), suggesting that loss of one PTPRO copy is a not infrequent occurrence in myeloma.
Our mechanistic data provide a novel pathway through which PTPROt may influence AKT signaling. A just published study noted that PTPRO -/- mice showed increased activation of AKT [42] but did not identify a possible mechanism. Another recent publication found that R3 receptor-like protein tyrosine phosphatase subfamily members inhibit insulin signaling by dephosphorylating the insulin receptor [43]. This could in part account for our finding that PTPROt reduces AKT activation given the prominent role of insulin signaling in regulating AKT activity [44]. However, we performed co-immunoprecipitation studies showing an association between PTPROt and IQGAP1, and in vitro dephosphorylation assays showing the latter was a substrate for the former. Moreover, we have also found that over-expression of IQGAP1 is by itself sufficient to enhance AKT activation in the absence of exogenous serum or growth factors (not shown). Thus, PTPROt appears to be able to regulate AKT through both an upstream impact on pathway activation, as well as through an IQGAP1-dependent mechanism by dephosphorylating the latter and placing it in an inactive conformation (Figure 7).
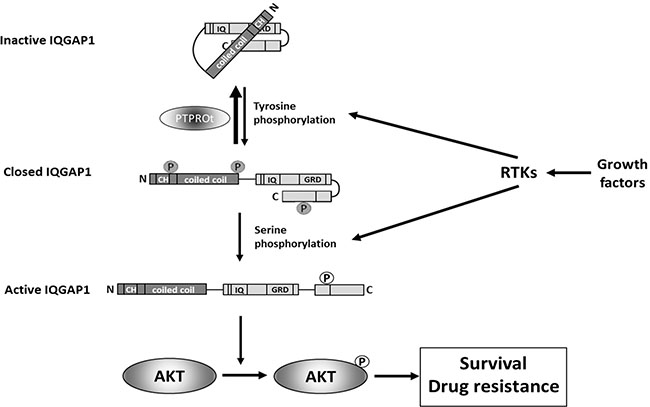
Figure 7: A model illustrating the role that PTPROt may play in modulating the IQGAP1 activation status. Growth factor-mediated activation of receptor tyrosine kinases (RTKs) induces tyrosine phosphorylation of IQGAP1 [35, 49], that converts inactive IQGAP1 [50] to a closed IQGAP1 conformation [51]. Subsequent serine phosphorylation in response to activation of RTKs [52, 53] after opens C-terminus of IQGAP1 converting it into active form [54] that stimulates phosphorylation of AKT at serine 473 and, thus, activates AKT [52] resulting in pro-survival signaling and drug resistance. The initial tyrosine phosphorylation of IQGAP1 can be reversed by PTPROt-mediated de-phosphorylation (this report) interfering with activation of IQGAP1 and subsequently also AKT.
With regard to bortezomib resistance, our previous studies showed that this was mediated in part through an increase in Insulin-like growth factor 1 secretion by myeloma cells. This led to an increased autocrine and paracrine stimulation of AKT signaling which made myeloma cells more dependent on this pathway for survival, and therefore more sensitive to its blockade [21]. The current data provide another mechanism by which myeloma cells activate pro-survival AKT, and further underscore the importance that this pathway may have in proteasome inhibitor resistance. Moreover, as AKT activation is associated with resistance to other drug classes [45], PTPROt expression could influence the efficacy of other chemotherapeutics used against myeloma, as well as other malignancies. A number of AKT inhibitors are being evaluated in the clinic against relapsed/refractory myeloma, such as afuresertib, which has shown some activity as a single agent [46] and possibly the ability to overcome bortezomib resistance [47]. Our data suggest that PTPROt could be used as a biomarker to select patients who might most benefit from AKT inhibitors, since patients with low expression of this gene would be predicted to have increased AKT activation. Their disease could be more dependent on AKT signaling for survival and therefore more sensitive to AKT blockade as a strategy to achieve either chemosensitization, or to overcome proteasome inhibitor resistance. Prospective studies will be needed, however, to validate this hypothesis, though the finding that PTPROt expression levels are related to bortezomib sensitivity in existing datasets provide strong impetus for such trials. Since proteasome inhibitor resistance is an emerging clinical problem, these studies therefore provide a number of possible avenues for clinical translation of approaches that could restore sensitivity to this important class of agents.
MATERIALS AND METHODS
Cell culture and reagents
ANBL-6, KAS-6/1, and RPMI 8226, as well as bortezomib resistant (BR) counterparts of some of these cell lines were obtained, derived, and propagated as described previously [21]. MM1.S, H929, MOLP-8, and 293T cell lines were obtained from ATCC and cultured in FBS-supplemented (10%) RPMI 1640 and DMEM media, respectively. Bortezomib, cisplatin, and melphalan were purchased from Sigma-Aldrich (St. Louis, MO), MK2206 was purchased from Selleckchem (Houston, TX), and LY294002 was purchased from Cell Signaling Technologies (Danvers, MA).
Gene expression profiling
GEP was obtained essentially as described previously [48]. Briefly, a biotinylated cRNA was generated from 300 ng of total RNA from wild-type and BR cells by the Eberwine procedure using the Illumina TotalPrep RNA Amplification kit (Invitrogen-Life Technologies; Grand Island, NY). Obtained cRNAs were hybridized overnight to Illumina HT-12 BeadArrays (Illumina; St. Diego, CA), stained with streptavidin-Cy3 (Invitrogen-Life Technologies), and scanned using a BeadArray Reader (Illumina).
Real-time RT-PCR
Total cellular RNA was isolated using the TRIzol reagent (Invitrogen-Life Technologies). First-strand cDNA was synthesized using the High Capacity cDNA Reverse Transcription Kit (Applied Biosystems; Grand Island, NY) and subjected to real-time RT-PCR with made-to-order assays specific for PTPRO (ID, HS00243097_m1) or GAPDH (ID, Hs99999905_m1, endogenous control)and the TaqMan Universal PCR Master Mix (Applied Biosystems). Reactions were carried out in triplicate using the ABI PRISM 7900 HT Sequence Detection System (Invitrogen-Life Technologies), and the relative amount of product was determined by the comparative Ct method.
Cell viability and apoptosis assays
The WST-1 tetrazolium reagent (Roche Diagnostics; Indianapolis, IN) was used to determine cellular viability according to the manufacturer’s instructions, typically with 1 × 10⁴ cells/well in 96-well plates. Cellular apoptosis was evaluated by flow cytometry after staining with Annexin V (BioVision; Mountain View, CA) and either TO-PRO-3 (Invitrogen-Life Technologies) or propidium iodide (PI). After the indicated drug treatments, cells seeded at 2 × 10⁵/well in 1 mL of growth medium in 24-well plates were collected, and washed with phosphate-buffered saline (PBS). Cells were then either resuspended in binding buffer and incubated as above at room temperature prior to flow cytometry, or they were fixed with 1% paraformaldehyde followed by incubation with 70% ethanol overnight prior to subsequent analysis. In some cases, treated cells were harvested for detection of activated Caspase 8 and 9 using the CaspGlowTM Red Active Caspase-8 and 9 Staining Kit from Biovision (Mountain View, CA) according to the manufacturer’s recommendations.
Cloning and lentiviral transduction
PTPROt was PCR amplified from a cDNA clone (cat, SC128012, Origene; Rockville, MD) using the forward primer 5’-GGAATTCCACC ATGGTTACAGAGATGAATCCCAATG-3’, which included an EcoRI site and the reverse primer, 5’-GGGATCCGGCATAATCAGGAACATCATAAGGG TAGGACTTGCTAACATTCTCGTATATG-3’, which incorporated and hemagglutinin (HA) coding sequence and a BamHI site. PCR products were then cloned into the pCDH-MCS-T2A-copGFP-MSCV plasmid (System Biosciences; Mountain View, CA) through the same two enzyme sites. The resultant construct was called pCDH-MCS-PTOwt-HA-T2A-copGFP-MSCV. Finally, the DNA oligo CTAGCAATGG ACTACAAAGACGATGACGATAAAGCATACCCTTAT GATGTTCCTGATTATGCCGATTATAAGGATGACGAT GACAAGGCTGGG, which encoded two FLAG tags and one HA tag, was inserted into pCDH-MCS-PTOwt-HA-T2A-copGFP-MSCV through NheI and EcoRI sites. The QuikChange Site-directed Mutagenesis Kit (Stratagene; LaJolla, CA) was used to generate PTPROt substrate-trapping catalytic domain-inactivating mutants (PTPROT-CS [C325S], DA [D291A], and DC with mutated both sites). For IQGAP1 cDNA expression, the c-Myc-tagged IQGAP1 coding region was digested from pcDNA3-Myc-IQGAP1 (#30118, Addgene; Cambridge, MA) and sub-cloned into pLVX-DsRed-mono-C1 (Clontech Laboratories, Inc.; Mountain View, CA).
All recombinant Lentiviruses were produced by transient transfection of 293T cells according to standard protocols. Briefly, subconfluent 293T cells were co-transfected with 20 μg of an expression vector, 15 μg of pAX2, and 5 μg of pMD2G-VSVG by calcium phosphate precipitation. Medium was changed after 16 hours and recombinant Lentivirus vectors were harvested 24- and 48-hours later. Raw virus supernatants were concentrated by PEG precipitation, and target cells were transduced with a comparable amount of cDNA encoding Lentivirus vectors or corresponding empty vectors in growth medium containing 6 μg/mL polybrene. Transduced cells were subjected to drug selection or sorted by flow cytometry 5 days post-infection.
Western blotting and antibodies
Cells were lysed in lysis buffer (20 mM Tris-HCl, pH 7.5, 150 mM NaCl, 1 mM Na2EDTA, 1 mM EGTA, 1% Triton, 2.5 mM sodium pyrophosphate, 1 mM β-glycerophosphate, 1 mM Na3VO4, 1 μg/mL leupeptin) containing complete Protease Inhibitor Cocktail tablets (Roche Diagnostics) and 1 mM phenylmethyl-sulfonyl-fluoride (PMSF). After three freeze-thaw cycles, lysate supernatants were obtained by centrifugation at 14,000 g for 15 minutes. Equal amounts (10–100 μg/lane) of protein were loaded on 10% SDS-PAGE gels and subjected to electrophoresis. Separated proteins were then transferred onto PVDF membranes and probed using mouse monoclonal anti-HA (Sigma-Aldrich), mouse monoclonal anti-AKT and rabbit monoclonal anti-phospho-AKT (Ser473), rabbit monoclonal anti-phospho-Glycogen synthase kinase (GSK)-3α/β (Ser219), anti-BIM, anti-MCL1, anti-cleaved Caspase 3, 8, or 9 (Cell Signaling Technology) antibodies, followed by a corresponding Horseradish peroxidase (HRP)–conjugated secondary antibody. The membranes were developed by enhanced chemiluminescence and exposed on Hyperfilm-ECL (both from GE Healthcare Biosciences; Pittsburgh, PA).
Immunoprecipitation and mass spectrometry
MM1.S cells were transduced with Lentiviruses to express HA- and FLAG-tagged wild type (wt)-PTPROt, mutant DC-PTPROt, or empty vector. The cells were treated with 1 mM H2O2 and 1 mM Na3VO4 for 30 minutes, and then put in the lysis buffer (20 mM Tris-HCl, pH 7.5, 100 mM NaCl, 1 mM EDTA, 1% Triton X-100, 10% glycerol, 5 mM iodoacetic acid, and protease inhibitors) for 30 minutes on ice. Precipitation was performed using the FLAG HA Tandem Affinity Purification Kit (Sigma Aldrich) and the final eluted proteins were submitted for mass spectrometry analysis. Fragmentation spectra results were then searched against the SwissProt protein database with Mascot, and protein scores were derived from ions scores as a non-probabilistic basis for ranking protein hits. Ions scores were calculated as -10*Log(P), where P was the probability that the observed match was a random event, with individual ions scores >20 indicating identity or extensive homology (p < 0.05).
For the reverse immunoprecipitation, 293T cells were co-transfected with plasmids expressing c-Myc-tagged IQGAP1, and HA-tagged wt-PTPROt or DC-PTPROt, or empty vectors. The c-Myc-tagged IQGAP1 was purified from transfected 293T cells using c-Myc antibody and protein A/G magnetic beads (Pierce-Life Technologies) according to the manufacturer’s instructions. Purified protein and beads were then used to pull down Glutathione-S-transferase (GST)-tagged wt-PTPROt or DC-PTPROt expressed from pGEX-6p-1 in E. coli. Co-precipitated proteins were separated by SDS-PAGE gel electrophoresis and analyzed by Western blot as described above.
In vitro AKT kinase assays
Assays were carried out using the AKT Kinase Assay Kit (Cell Signaling Technology) per the manufacturer’s instructions. Briefly, the cells were harvested and washed twice with PBS and subjected to lysis in the provided ice-cold buffer. Then, 250 μg of protein in 250 μl lysis buffer was immunoprecipitated with 20 μl of anti-phospho-AKT(S473) beads overnight at 4°C. After extensive washing, the immune-precipitates were incubated with 1 μg of GSK-3 fusion protein substrate in 50 μl of kinase buffer for 30 min at 30°C. Reactions were terminated by the addition of SDS loading buffer, samples were separated as described above, and substrate protein phosphorylation at Ser219 was detected by Western blotting.
Dephosphorylation assay
To obtain a substrate for the assay, 293T cells were transfected with plasmid expressing c-Myc-tagged IQGAP1, and treated with 1 mM H2O2 and 1 mM Na3VO4 prior to the preparation of protein extracts in the presence of the phosphatase inhibitors. A highly phosphorylated c-Myc-tagged IQGAP1 substrate was then purified by immunoprecipitation using c-Myc antibody and protein A/G magnetic beads (Pierce-Life Technologies). GST fused wt PTPRO or DC mutant PTPRO were expressed from pGEX-6p-1 in E. coli. The inclusion bodies containing the expressed proteins were harvested, solubilized, and renatured using the Rapid GST Inclusion Body Solubilization and Renaturation Kit (Cell Biolabs, Inc.; San Diego, CA). The renatured proteins were purified using glutathione agarose according to the manufacturer’s instructions (Pierce-Life Technologies). HA-tagged wt or DC mutant PTPRO were also expressed in 293T cells and immunoprecipitated using EZview Red Anti-HA Affinity Gel according to the manufacturer’s instructions (Sigma-Aldrich). The IQGAP1 substrate was then reacted with wt PTPRO or DC-mutant PTPRO, purified either from E. coli or 293T cells, for 1 hour at 30ºC in phosphatase buffer (25 mM HEPES, pH 7.4, 0.1 mM EDTA, 5 mM DTT, 50 mM NaCl). Reaction mixtures were then separated on SDS-PAGE gels and analyzed by Western blot using anti-c-Myc and -HA tag antibodies, and anti-phosphotyrosine antibody clone 4G10 (Millipore; Billerica, MA) was used to probe the phosphorylation status of IQGAP1.
Data mining and statistical analysis
Three datasets were downloaded from the open-access Multiple Myeloma Genomics Portal (MMGP): the Arkansas dataset, which contains GEP data from CD138-selected plasma cells from 414 myeloma patient bone marrows with associated survival and classification data; the Millennium Pharmaceuticals dataset, which contains GEP data from purified myeloma samples of 264 patients enrolled in clinical trials of bortezomib, along with survival data, treatment, and response; and the Mayo Clinic Cell Line and Patient dataset, which contains the array comparative genomic hybridization (aCGH; Agilent 44k comparative genomic hybridization) from 46 myeloma cell lines and tumor samples from 62 myeloma patients. Kaplan-Meier survival curves and the Cox proportional hazard model from STATA were used for the analysis of correlation between PTPROt expression levels from GEP data sets and patient survival. Hybridization signals from probe set 208121_s_at, which is the only validated probe for PTPRO, were transformed into log10 values and stratified into high and low level groups if the log10 signal was more and equal or less than the average value, respectively, before they were put into the models. Patients’ responses in the Millenium dataset were classified using European Group for Bone Marrow Transplantation criteria as complete response (CR), partial response (PR), minimal response (MR), no change (NC), or progressive disease (PD). Differences between treatment response groups stratified by the GEP expression levels of PTPROt were calculated using Pearson’s Chi-squared test and P < 0.05 was considered statistically significant.
Abbreviations
The abbreviations used are: aCGH, array comparative genomic hybridization; BCR, B-cell receptor; BIM, BCL-2 interacting mediator of cell death; BR, bortezomib resistant; CR, complete response; GEP, gene expression profiling; GSK, glycogen synthase kinase; GST, Glutathione-S-transferase; HA, hemagglutinin; HRP, horseradish peroxidase; IGV, Integrative Genomics Viewer; IQGAP1, IQ motif containing GTPase activating protein 1; LOH, loss of heterozygosity; MCL1, Myeloid cell leukemia 1; MMGP, Multiple Myeloma Genomics Portal; MR, minimal response; mut, mutant; NC, no change; PBS, phosphate-buffered saline; PD, progressive disease; PI, propidium iodide; PMSF, phenylmethyl-sulfonyl-fluoride; PR, partial response; PTP, protein tyrosine phosphatase; PTPRO, Protein tyrosine phosphatase receptor-type O; PTPROt, truncated PTPRO; wt, wild-type.
Author contributions
H.W. planned, conducted most of the experiments, analyzed the results, and drafted the manuscript. V.B. and H.L. performed statistical analyses. Z.W. analyzed mass spectrometry data. Z.B. analyzed the results and contributed to writing of the manuscript. R.E.D. designed experiments and edited the manuscript. L.Y. designed and conducted the experiments with H.W. R.Z.O. conceived the idea, designed the experiments, analyzed the results, and edited the manuscript.
ACKNOWLEDGMENTS
R.Z.O. would like to acknowledge support from the Florence Maude Thomas Cancer Research Professorship.
CONFLICTS OF INTEREST
R.Z.O. has served on advisory boards for Takeda Pharmaceuticals U.S.A., Inc., which manufactures and distributes bortezomib, but there was no commercial support for this research. Remaining authors have no conflicts of interest to declare.
FUNDING
This work was supported by funding from the National Cancer Institute (The MD Anderson Cancer Center SPORE in Multiple Myeloma (P50 CA142509) and R01s CA184464 and CA194264). The authors would like to thank the MD Anderson Flow Cytometry and Cellular Imaging Core Facility, and the Characterized Cell Line Core Facility, which are supported by the Cancer Center Support Grant (P30 CA16672).
REFERENCES
1. Siegel RL, Miller KD, Jemal A. Cancer statistics, 2015. CA Cancer J Clin. 2015; 65:5–29.
2. Smith BD, Smith GL, Hurria A, Hortobagyi GN, Buchholz TA. Future of cancer incidence in the United States: burdens upon an aging, changing nation. J Clin Oncol. 2009; 27:2758–65.
3. Bianchi G, Anderson KC. Understanding biology to tackle the disease: Multiple myeloma from bench to bedside, and back. CA Cancer J Clin. 2014; 64:422–44.
4. Moreau P, Attal M, Facon T. Frontline therapy of multiple myeloma. Blood. 2015; 125:3076–84.
5. Shah JJ, Orlowski RZ. Proteasome inhibitors in the treatment of multiple myeloma. Leukemia. 2009; 23:1964–79.
6. Manasanch EE, Orlowski RZ. Proteasome inhibitors in cancer therapy. Nat Rev Clin Oncol. 2017; 14:417–33.
7. Ciechanover A. The unravelling of the ubiquitin system. Nat Rev Mol Cell Biol. 2015; 16:322–4.
8. Cenci S, Mezghrani A, Cascio P, Bianchi G, Cerruti F, Fra A, Lelouard H, Masciarelli S, Mattioli L, Oliva L, Orsi A, Pasqualetto E, Pierre P, et al. Progressively impaired proteasomal capacity during terminal plasma cell differentiation. EMBO J. 2006; 25:1104–13.
9. Bianchi G, Oliva L, Cascio P, Pengo N, Fontana F, Cerruti F, Orsi A, Pasqualetto E, Mezghrani A, Calbi V, Palladini G, Giuliani N, Anderson KC, et al. The proteasome load versus capacity balance determines apoptotic sensitivity of multiple myeloma cells to proteasome inhibition. Blood. 2009; 113:3040–9.
10. Mimura N, Hideshima T, Anderson KC. Novel therapeutic strategies for multiple myeloma. Exp Hematol. 2015; 43:732–41.
11. Lu S, Yang J, Song X, Gong S, Zhou H, Guo L, Song N, Bao X, Chen P, Wang J. Point mutation of the proteasome beta5 subunit gene is an important mechanism of bortezomib resistance in bortezomib-selected variants of Jurkat T cell lymphoblastic lymphoma/leukemia line. J Pharmacol Exp Ther. 2008; 326:423–31.
12. Oerlemans R, Franke NE, Assaraf YG, Cloos J, van Zantwijk I, Berkers CR, Scheffer GL, Debipersad K, Vojtekova K, Lemos C, van der Heijden JW, Ylstra B, Peters GJ, et al. Molecular basis of bortezomib resistance: proteasome subunit beta5 (PSMB5) gene mutation and overexpression of PSMB5 protein. Blood. 2008; 112:2489–99.
13. Lu S, Chen Z, Yang J, Chen L, Zhou H, Xu X, Li J, Han F, Wang J. The effects of proteasome inhibitor bortezomib on a P-gp positive leukemia cell line K562/A02. Int J Lab Hematol. 2010; 32:e123–31.
14. Politou M, Karadimitris A, Terpos E, Kotsianidis I, Apperley JF, Rahemtulla A. No evidence of mutations of the PSMB5 (beta-5 subunit of proteasome) in a case of myeloma with clinical resistance to Bortezomib. Leuk Res. 2006; 30:240–1.
15. Lichter DI, Danaee H, Pickard MD, Tayber O, Sintchak M, Shi H, Richardson PG, Cavenagh J, Blade J, Facon T, Niesvizky R, Alsina M, Dalton W, et al. Sequence analysis of beta-subunit genes of the 20S proteasome in patients with relapsed multiple myeloma treated with bortezomib or dexamethasone. Blood. 2012; 120:4513–6.
16. Leung-Hagesteijn C, Erdmann N, Cheung G, Keats JJ, Stewart AK, Reece DE, Chung KC, Tiedemann RE. Xbp1s-negative tumor B cells and pre-plasmablasts mediate therapeutic proteasome inhibitor resistance in multiple myeloma. Cancer Cell. 2013; 24:289–304.
17. Lonial S, Kaufman JL. Non-secretory myeloma: a clinician’s guide. Oncology (Williston Park). 2013; 27:924–8, 30.
18. Richardson PG, Barlogie B, Berenson J, Singhal S, Jagannath S, Irwin D, Rajkumar SV, Srkalovic G, Alsina M, Alexanian R, Siegel D, Orlowski RZ, Kuter D, et al. A phase 2 study of bortezomib in relapsed, refractory myeloma. N Engl J Med. 2003; 348:2609–17.
19. Richardson PG, Sonneveld P, Schuster MW, Irwin D, Stadtmauer EA, Facon T, Harousseau JL, Ben-Yehuda D, Lonial S, Goldschmidt H, Reece D, San-Miguel JF, Blade J, et al. Bortezomib or high-dose dexamethasone for relapsed multiple myeloma. N Engl J Med. 2005; 352:2487–98.
20. Kuhn DJ, Chen Q, Voorhees PM, Strader JS, Shenk KD, Sun CM, Demo SD, Bennett MK, van Leeuwen FW, Chanan-Khan AA, Orlowski RZ. Potent activity of carfilzomib, a novel, irreversible inhibitor of the ubiquitin-proteasome pathway, against preclinical models of multiple myeloma. Blood. 2007; 110:3281–90.
21. Kuhn DJ, Berkova Z, Jones RJ, Woessner R, Bjorklund CC, Ma W, Davis RE, Lin P, Wang H, Madden TL, Wei C, Baladandayuthapani V, Wang M, et al. Targeting the insulin-like growth factor-1 receptor to overcome bortezomib resistance in preclinical models of multiple myeloma. Blood. 2012; 120:3260–70.
22. Aguiar RC, Yakushijin Y, Kharbanda S, Tiwari S, Freeman GJ, Shipp MA. PTPROt: an alternatively spliced and developmentally regulated B-lymphoid phosphatase that promotes G0/G1 arrest. Blood. 1999; 94:2403–13.
23. Chen L, Juszczynski P, Takeyama K, Aguiar RC, Shipp MA. Protein tyrosine phosphatase receptor-type O truncated (PTPROt) regulates SYK phosphorylation, proximal B-cell-receptor signaling, and cellular proliferation. Blood. 2006; 108:3428–33.
24. Mitsiades N, Mitsiades CS, Poulaki V, Chauhan D, Fanourakis G, Gu X, Bailey C, Joseph M, Libermann TA, Treon SP, Munshi NC, Richardson PG, Hideshima T, et al. Molecular sequelae of proteasome inhibition in human multiple myeloma cells. Proc Natl Acad Sci U S A. 2002; 99:14374–9.
25. Hideshima T, Catley L, Yasui H, Ishitsuka K, Raje N, Mitsiades C, Podar K, Munshi NC, Chauhan D, Richardson PG, Anderson KC. Perifosine, an oral bioactive novel alkylphospholipid, inhibits Akt and induces in vitro and in vivo cytotoxicity in human multiple myeloma cells. Blood. 2006; 107:4053–62.
26. Hideshima T, Catley L, Raje N, Chauhan D, Podar K, Mitsiades C, Tai YT, Vallet S, Kiziltepe T, Ocio E, Ikeda H, Okawa Y, Hideshima H, et al. Inhibition of Akt induces significant downregulation of survivin and cytotoxicity in human multiple myeloma cells. Br J Haematol. 2007; 138:783–91.
27. Alessi DR, Andjelkovic M, Caudwell B, Cron P, Morrice N, Cohen P, Hemmings BA. Mechanism of activation of protein kinase B by insulin and IGF-1. EMBO J. 1996; 15:6541–51.
28. Longo PG, Laurenti L, Gobessi S, Sica S, Leone G, Efremov DG. The Akt/Mcl-1 pathway plays a prominent role in mediating antiapoptotic signals downstream of the B-cell receptor in chronic lymphocytic leukemia B cells. Blood. 2008; 111:846–55.
29. Qi XJ, Wildey GM, Howe PH. Evidence that Ser87 of BimEL is phosphorylated by Akt and regulates BimEL apoptotic function. J Biol Chem. 2006; 281:813–23.
30. Spokoini R, Kfir-Erenfeld S, Yefenof E, Sionov RV. Glycogen synthase kinase-3 plays a central role in mediating glucocorticoid-induced apoptosis. Mol Endocrinol. 2010; 24:1136–50.
31. Vlahos CJ, Matter WF, Hui KY, Brown RF. A specific inhibitor of phosphatidylinositol 3-kinase, 2-(4-morpholinyl)-8-phenyl-4H-1-benzopyran-4-one (LY294002). J Biol Chem. 1994; 269:5241–8.
32. Hirai H, Sootome H, Nakatsuru Y, Miyama K, Taguchi S, Tsujioka K, Ueno Y, Hatch H, Majumder PK, Pan BS, Kotani H. MK-2206, an allosteric Akt inhibitor, enhances antitumor efficacy by standard chemotherapeutic agents or molecular targeted drugs in vitro and in vivo. Mol Cancer Ther. 2010; 9:1956–67.
33. Yamaoka-Tojo M, Ushio-Fukai M, Hilenski L, Dikalov SI, Chen YE, Tojo T, Fukai T, Fujimoto M, Patrushev NA, Wang N, Kontos CD, Bloom GS, Alexander RW. IQGAP1, a novel vascular endothelial growth factor receptor binding protein, is involved in reactive oxygen species--dependent endothelial migration and proliferation. Circ Res. 2004; 95:276–83.
34. Chen F, Zhu HH, Zhou LF, Wu SS, Wang J, Chen Z. IQGAP1 is overexpressed in hepatocellular carcinoma and promotes cell proliferation by Akt activation. Exp Mol Med. 2010; 42:477–83.
35. Meyer RD, Sacks DB, Rahimi N. IQGAP1-dependent signaling pathway regulates endothelial cell proliferation and angiogenesis. PLoS One. 2008; 3:e3848. doi: 10.1371/journal.pone.0003848.
36. Juszczynski P, Chen L, O’Donnell E, Polo JM, Ranuncolo SM, Dalla-Favera R, Melnick A, Shipp MA. BCL6 modulates tonic BCR signaling in diffuse large B-cell lymphomas by repressing the SYK phosphatase, PTPROt. Blood. 2009; 114:5315–21.
37. Motiwala T, Ghoshal K, Das A, Majumder S, Weichenhan D, Wu YZ, Holman K, James SJ, Jacob ST, Plass C. Suppression of the protein tyrosine phosphatase receptor type O gene (PTPRO) by methylation in hepatocellular carcinomas. Oncogene. 2003; 22:6319–31.
38. Motiwala T, Majumder S, Kutay H, Smith DS, Neuberg DS, Lucas DM, Byrd JC, Grever M, Jacob ST. Methylation and silencing of protein tyrosine phosphatase receptor type O in chronic lymphocytic leukemia. Clin Cancer Res. 2007; 13:3174–81.
39. Huang YT, Li FF, Ke C, Li Z, Li ZT, Zou XF, Zheng XX, Chen YP, Zhang H. PTPRO promoter methylation is predictive of poorer outcome for HER2-positive breast cancer: indication for personalized therapy. J Transl Med. 2013; 11:245.
40. Stevenson WS, Best OG, Przybylla A, Chen Q, Singh N, Koleth M, Pierce S, Kennedy T, Tong W, Kuang SQ, Garcia-Manero G. DNA methylation of membrane-bound tyrosine phosphatase genes in acute lymphoblastic leukaemia. Leukemia. 2014; 28:787–93.
41. Cave H, Gerard B, Martin E, Guidal C, Devaux I, Weissenbach J, Elion J, Vilmer E, Grandchamp B. Loss of heterozygosity in the chromosomal region 12p12-13 is very common in childhood acute lymphoblastic leukemia and permits the precise localization of a tumor-suppressor gene distinct from p27KIP1. Blood. 1995; 86:3869–75.
42. Zhang W, Hou J, Wang X, Jiang R, Yin Y, Ji J, Deng L, Huang X, Wang K, Sun B. PTPRO-mediated autophagy prevents hepatosteatosis and tumorigenesis. Oncotarget. 2015; 6:9420–33. https://doi.org/10.18632/oncotarget.3353.
43. Shintani T, Higashi S, Takeuchi Y, Gaudio E, Trapasso F, Fusco A, Noda M. The R3 receptor-like protein tyrosine phosphatase subfamily inhibits insulin signalling by dephosphorylating the insulin receptor at specific sites. J Biochem. 2015; 158:235–43.
44. Pollak M. The insulin and insulin-like growth factor receptor family in neoplasia: an update. Nat Rev Cancer. 2012; 12:159–69.
45. Zheng HC. The molecular mechanisms of chemoresistance in cancers. Oncotarget. 2017; 8:59950–64. https://doi.org/10.18632/oncotarget.19048.
46. Spencer A, Yoon SS, Harrison SJ, Morris SR, Smith DA, Brigandi RA, Gauvin J, Kumar R, Opalinska JB, Chen C. The novel AKT inhibitor afuresertib shows favorable safety, pharmacokinetics, and clinical activity in multiple myeloma. Blood. 2014; 124:2190–5.
47. Voorhees PM, Spencer A, Sutherland HJ, O’Dwyer ME, Huang SY, Stewart K, Chari A, Rosenzwieg M, Nooka AK, Rosenbaum CA, Hofmeister CC, Smith DA, Antal JM, et al. Novel AKT inhibitor afuresertib in combination with bortezomib and dexamethasone demonstrates favorable safety profile and significant clinical activity in patients with relapsed/refractory multiple myeloma. Blood. 2013; 122:ASH Abstract 283.
48. Bjorklund CC, Ma W, Wang ZQ, Davis RE, Kuhn DJ, Kornblau SM, Wang M, Shah JJ, Orlowski RZ. Evidence of a role for activation of Wnt/beta-catenin signaling in the resistance of plasma cells to lenalidomide. J Biol Chem. 2011; 286:11009–20.
49. Heil A, Nazmi AR, Koltzscher M, Poeter M, Austermann J, Assard N, Baudier J, Kaibuchi K, Gerke V. S100P is a novel interaction partner and regulator of IQGAP1. J Biol Chem. 2011; 286:7227–38.
50. Le Clainche C, Schlaepfer D, Ferrari A, Klingauf M, Grohmanova K, Veligodskiy A, Didry D, Le D, Egile C, Carlier MF, Kroschewski R. IQGAP1 stimulates actin assembly through the N-WASP-Arp2/3 pathway. J Biol Chem. 2007; 282:426–35.
51. Wang JB, Sonn R, Tekletsadik YK, Samorodnitsky D, Osman MA. IQGAP1 regulates cell proliferation through a novel CDC42-mTOR pathway. J Cell Sci. 2009; 122:2024–33.
52. Tekletsadik YK, Sonn R, Osman MA. A conserved role of IQGAP1 in regulating TOR complex 1. J Cell Sci. 2012; 125:2041–52.
53. McNulty DE, Li Z, White CD, Sacks DB, Annan RS. MAPK scaffold IQGAP1 binds the EGF receptor and modulates its activation. J Biol Chem. 2011; 286:15010–21.
54. Grohmanova K, Schlaepfer D, Hess D, Gutierrez P, Beck M, Kroschewski R. Phosphorylation of IQGAP1 modulates its binding to Cdc42, revealing a new type of rho-GTPase regulator. J Biol Chem. 2004; 279:48495–504.