
INTRODUCTION
Neuroblastoma (NB) is a childhood cancer arising from malignant transformation of cells from the sympatho-adrenergic lineage of the developing neural crest [1] and is characterized by a large clinical heterogeneity, including patients with tumours that spontaneously regress as well as patients with metastasis and refractory disease despite intensive therapy regimens [2]. For these high-risk neuroblastoma cases, a better understanding of the genes and pathways that are involved in disease development and progression is currently fuelling the identification of new molecular targets for therapy [3].
Overall, given the low frequency of mutations in neuroblastoma, options for targeted therapy are relatively limited. However, the recurrent somatic mutations of the tyrosine kinase receptor ALK identified in 8-10% of primary neuroblastoma tumours [4–8] and the emergence of ALK mutations at relapse mark ALK as an important novel drug target [9, 10]. Several orally available small molecule ALK inhibitors have been developed and successfully applied in patients with other ALK mutant tumour entities, so-called ALKoma’s, most notably a subset of lung cancers [11–17]. Several of these small molecule ALK inhibitors have recently gone into phase 1 clinical trials for patients with refractory neuroblastoma, inflammatory myofibroblastic tumour, non-small-cell lung cancer (NSCLC) and anaplastic large-cell lymphoma (ALCL) [18, 19].
Despite the promising therapeutic potential of ALK inhibitors, an important drawback is the rapid occurrence of resistance due to escape mechanisms including secondary mutations or activation of other kinase signaling pathways [17, 20–30]. A better understanding of the downstream ALK signaling cascades can inspire the development of more rationally designed combinatorial treatment approaches. In a previous study, ALK downstream signaling was characterized by in depth transcriptome analysis of neuroblastoma cells treated for six hours with the ALK inhibitor TAE684, resulting in the 77-gene ALK signature and the identification of a negative MAPK feedback loop and of RET as ALK activated target gene [31]. Moreover, we generated transcriptome data between 10 minutes and 6 hours after pharmacological ALK inhibition to show that our established 77-gene signature is gradually decreasing starting from 2 hours after the treatment. Here, we further explore this dynamic transcriptome data generated upon treatment with the ALK inhibitor TAE684 in order to look in more detail into the dynamics of early transcriptional responses following ALK inhibition to improve our understanding on downstream ALK signaling and identify novel targets for combination therapy. To this end, we performed differential gene expression analysis at different time points following TAE684 treatment of the neuroblastoma cell line CLB-GA with an activating ALKR1275Q mutation.
RESULTS AND DISCUSSION
MAPK, PI3K, RET and MYC(N) signaling pathways are downregulated starting from 1 to 2 hours after TAE684 treatment
In order to gain more insights into the early dynamics of transcriptional changes after pharmacological inhibition of ALK signaling in neuroblastoma cells, the neuroblastoma cell line CLB-GA, which harbours an ALKR1275Q mutation, was treated with the ALK inhibitor TAE684 and DMSO as control. While TAE684 did not go into clinical trials, TAE684 is a valid ALK-inhibitor as we previously showed that the transcriptional responses for this drug and the more clinically relevant ones, such as crizotinib, LDK378 and X396, are very similar [31]. RNA expression profiling was performed on cells harvested 10 and 30 minutes, 1, 2, 4 and 6 hours after treatment (Supplementary Figure 1).
Our previously established 77-gene ALK signature [31] significantly decreases from 2 hours after ALK inhibitor treatment, as shown earlier by Lambertz et al. [31]. In this study, we evaluated the dynamic regulation of known ALK downstream pathways, i.e. MAPK, PI3K, RET and MYC/MYCN signaling pathways [4–7, 31–34], by calculating signature activity scores for drugs specifically blocking these pathways. These drug signature scores summarize the transcriptional response of the components of a given signaling pathway upon pharmacological pathway inhibition. Our data confirm ALK regulation of these pathways and furthermore show that MAPK, PI3K and RET pathway activity is decreased as early as 1 to 2 hours after the start of TAE684 treatment, as the corresponding inhibitor scores become activated at those time points (Figure 1A–1C; Supplementary Figures 2A–2C, 3A–3C). Furthermore, we observed that MYCN expression levels significantly drop 1 hour after the treatment (p = 0.0015) (Figure 1D; Supplementary Figure 2D). As expected, MYC(N) activity scores [35, 36] follow a delayed response at later time points (Figure 1E, 1F; Supplementary Figures 2E, 2F, 3D, 3E). These results are in line with the previously established regulatory role on MYCN transcription initiation for ALK, in addition to its effect on MYCN activity via phosphorylation [32, 34, 37–39].
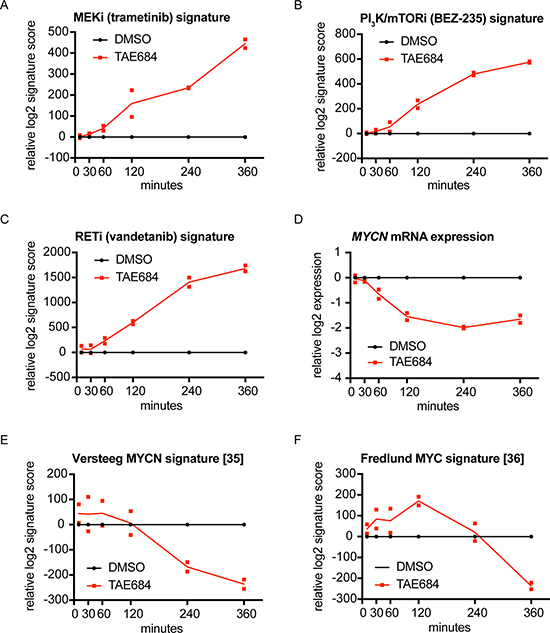
Figure 1: Signature score analysis for MAPK, PI3K, RET and MYC(N) signaling pathways, downregulated starting from 1 or 2 hours after TAE684 treatment. (A–E) MEK inhibitor (trametinib) (A), PI3K/mTOR inhibitor (BEZ-235) (B) and RET inhibitor (vandetanib) (C) signatures are upregulated from 1 or 2 hours after treatment of the CLB-GA cell line with 320 nM TAE684, while MYCN mRNA expression levels (D) are downregulated from 1 hour after treatment and the MYCN activity score from Valentijn et al. [35] (E) and the MYC signature score from Fredlund et al. [36] (F) from respectively 2 and 4 hours after pharmacological ALK blockade. Log2 transformed ratios of expression levels of TAE684 treated vs DMSO control samples are plotted.
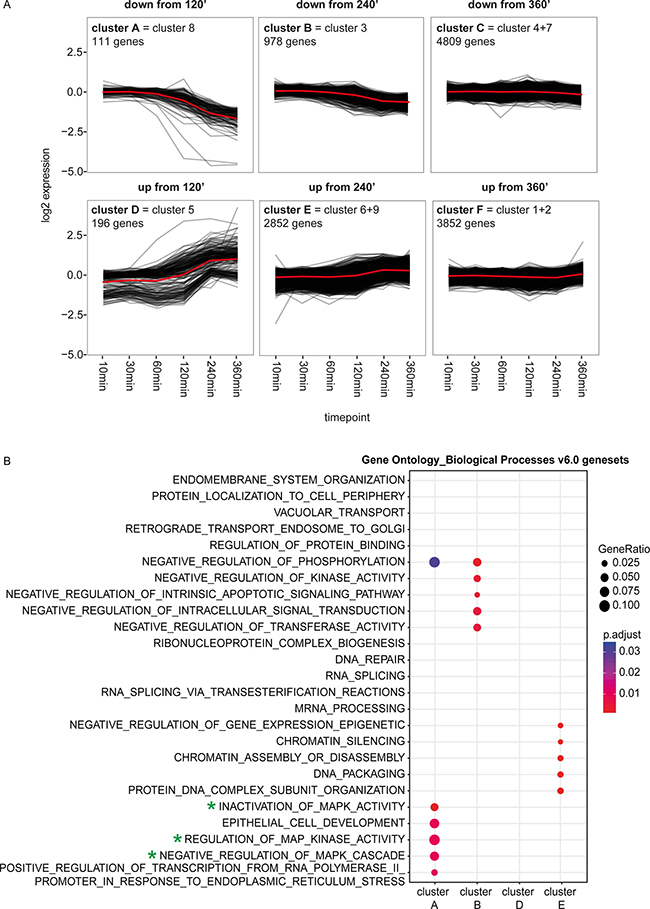
Figure 2: Functional characterization of the genes in the clusters with the MSigDB ‘c5 Gene Ontology (GO) Biological Process Ontology (BP) v6.0’. (A) The cluster plots represent the dynamic pattern of the expression of the genes belonging to 1 of the 6 clusters. The mean of the ratio of the expression in the TAE684 vs DMSO treated sample is plotted for each gene. The red lines show the average dynamic pattern of the expression of the genes belonging to these clusters, calculated by the average of the mean of the ratio of the expression in the TAE684 vs DMSO treated sample. (B) Plot showing the MSigDB ‘c5 Gene Ontology (GO) Biological Process Ontology (BP) v6.0’ genesets that are enriched in at least one of the four clusters, which are showing a clear dynamic pattern (clusters A, B, D, E). The size of each node corresponds to the number of genes overlapping between the cluster and the gene set and the colour represents the adjusted p-value of the enrichment test. Green stars indicate the genesets related to the MYC(N), KRAS-MAPK, PI3K/mTOR pathways.
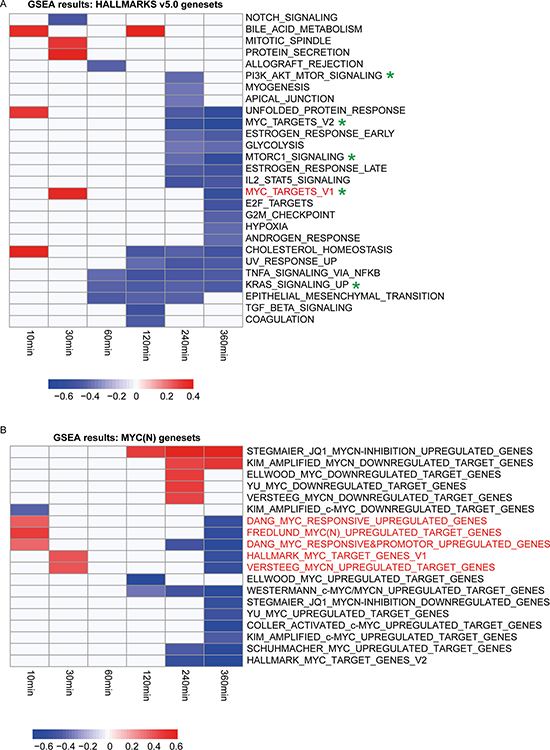
Figure 3: Gene Set Enrichment Analysis (GSEA) with the hallmarks and the MYC(N) signaling genesets shows that MYC(N) signaling is upregulated immediately following ALK inhibition. (A and B) Heatmap showing the genesets of the ‘Hallmarks v5.0’ genesets from MSigDB (A) and an in house compiled gene set collection containing all MYC target genesets from this hallmark catalogue as well as publically available MYC(N) activity or target signatures [35, 60–66] (B), that are enriched among the genes upregulated after ALK inhibition (positively enriched) (red) or that are enriched among the genes downregulated after ALK inhibition (negatively enriched) (blue) according to GSEA (with FDR < 0.1) [41]. Indicated in red are the genesets that are upregulated at earlier and downregulated at the later time points following ALK inhibition. Green stars indicate the genesets related to the MYC(N), KRAS-MAPK, PI3K/mTOR pathways.
To identify other dynamically regulated pathways upon ALK inhibition, functional enrichment analysis was performed on a set of k-means clusters of genes with similar transcriptional responses over the timeframe. After k-means clustering with 9 centers, as defined by the elbow method, we combined clusters with similar expression patterns over time yielding a total of 6 different clusters (Figure 2A; Supplementary Figures 4A, 4B, 5A). Moreover, 4 of these clusters, namely cluster A, B, D and E, are showing a clear dynamic pattern, with a change in expression starting at 120 or 240 minutes and increasing over time, while the other 2 are showing a more modest pattern over time with only a small change at the latest time point (Figure 2A, Supplementary Figure 5A). Functional characterization of these 4 clusters through evaluating the enrichment for gene ontology terms (MSigDB ‘c5 Gene Ontology (GO) Biological Process Ontology (BP) v6.0’), oncogenic signatures (MSigDB ‘c6 Oncogenic Signatures v5.0’) and pathways of the Reactome Database [40, 41] confirmed that these clusters consist of MYC, MAPK or mTOR targets and are involved in regulation of the MAPK cascade, in keeping with the downregulation of the MYC(N), PI3K-AKT-mTOR and MAPK pathway (Figure 2B; Supplementary Figure 5B, 5C). Moreover, cluster E is also enriched for genesets linked to epigenetic processes, regulating amongst others chromatin structure and gene expression (Figure 2B; Supplementary Figures 5B, 5C).
Taken together, this analysis provides insights into the dynamics of inactivation of ALK driven downstream pathways in ALK mutant neuroblastoma cells upon ALK inhibition and validates the applicability of the presented dataset to further scrutinize early temporal effects of ALK inhibition.
MYC(N) signaling is upregulated immediately following ALK inhibition
To functionally scrutinize the transcriptional changes upon ALK inhibitor treatment, Gene Set Enrichment Analysis (GSEA [42]) was performed using the ‘Hallmarks v5.0’ genesets from the Molecular Signatures Database (MSigDB) (software.broadinstitute.org/gsea/msigdb) at the different time points. This analysis further validates that the signaling pathways KRAS (MAPK) and PI3K-mTOR are significantly repressed (Figure 3A). Remarkably, one of the MYC genesets (HALLMARK_MYC_TARGETS_1) is significantly enriched for genes upregulated 30 minutes after treatment and significantly enriched for genes downregulated 6 hours after pharmacological ALK blockade (Figure 3A, indicated in red). Moreover, we observed a significant increase in the Fredlund MYC signature [36] 2 hours after ALK inhibition (p = 0.0038) (Figure 1F, Supplementary Figure 2F). Therefore, we also performed GSEA on other MYC(N) activity signatures and confirmed for 4 other genesets an initial upregulation (at 10 or 30 minutes after ALK inhibitor treatment) followed by a downregulation (from 2 hours after ALK inhibitor treatment) (Figure 3B). The observation of this initial upregulation of MYCN activity scores is intriguing and needs further investigation.
Adrenomedullin (ADM) is the earliest upregulated gene upon pharmacological ALK inhibition of NB cells
In order to identify the set of early and late genes that significantly change transcriptionally, differential gene expression analysis comparing TAE684 treated cells with DMSO treated controls was performed at each time point. This analysis revealed that no significant transcriptional changes occur as early as 10 or 30 minutes after treatment (using adjusted p-value (False Discovery Rate (FDR)) < 0.05), while starting from 2 hours after treatment an increasing number of significantly, differentially expressed genes are identified (Supplementary Table 1). Our observations are in line with these from Lai et al. [43], who have shown that transcriptional events occur between 2 and 4 hours after inhibition of a receptor tyrosine kinase.
Interestingly, one gene showed significant differential upregulation 1 hour post-TAE684 treatment, i.e. adrenomedullin (ADM) (Figure 4A; Supplementary Figure 6A). Interestingly, using second- and third-generation ALK inhibitors [31], the upregulation of ADM upon ALK inhibition was confirmed in CLB-GA and Kelly (Supplementary Figure 6B, 6C). Moreover, we could validate ADM upregulation 6 hours after treatment with TAE684 in more NB cell lines with an ALK amplification, an ALKR1275Q or ALKF1174L mutation (Figure 4B). Furthermore, the early upregulation of ADM was validated in the cell line NB-1 upon pharmacological ALK inhibition with TAE684 (Figure 4C), as the increase was already detectable 1 hour after the treatment. In addition, ADM expression levels are also significantly induced in the CLB-GA cell line, following PI3K/mTOR inhibitor BEZ-235, MEK antagonist trametinib and RET repressor vandetanib treatment [31] (Supplementary Figure 6D). Interestingly, ADM upregulation was also observed in the Anaplastic Large Cell Lymphoma (ALCL) cell line TS treated with three different ALK inhibitors for 6 hours [44] (Figure 4D).
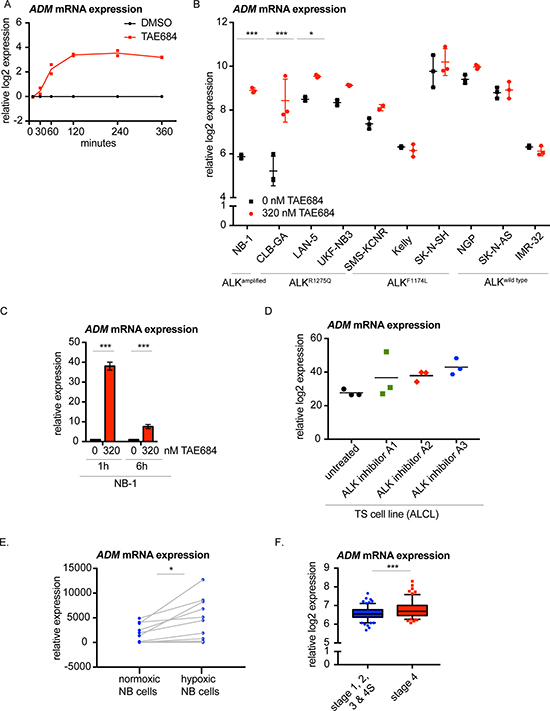
Figure 4: Adrenomedullin (ADM) is the earliest upregulated gene upon pharmacological ALK inhibition of NB cells. (A) ADM mRNA is significantly upregulated starting from 1 hour after TAE684 treatment of the CLB-GA cell line. Ratios of log2 transformed expression levels of TAE684 treated vs DMSO control samples are plotted. (B) ADM mRNA expression levels shown in several ALK wild type (NGP, SK-N-AS, IMR-32) and ALK mutant (NB-1, CLB-GA, LAN-5, UKF-NB3, SMS-KCNR, Kelly, SK-N-SH) cell lines treated for 6 hours with 0.32 μM TAE684 or DMSO. (C)ADM mRNA expression levels are upregulated in NB cell line NB-1 (ALKamp) 1 hour and 6 hours after treatment with 0.32 μM TAE684 compared to the DMSO control. (D) ADM expression levels are upregulated 6 hours upon ALK inhibition with three different ALK inhibitors in the ALCL cell line TS. (E) ADM mRNA expression levels are upregulated in 11 NB cell lines under hypoxic conditions. (F) ADM expression levels are higher in stage 4 primary neuroblastoma tumours versus neuroblastoma tumours of stage 1, 2, 3 and 4S. Boxplots represent mean ± 95% confidence interval. Statistical analyses: unpaired one-way ANOVA with Bonferroni correction (B. & C. & D.), paired t-test (E.) and unpaired t-test (F.). *P < 0.05, **P < 0.01, ***P < 0.001.
Adrenomedullin is upregulated under hypoxic conditions in neuroblastoma
As ADM is known to be induced under hypoxia [45–51], we investigated publically available transcriptome data from hypoxic versus normoxic neuroblastoma cells [52] and confirmed ADM upregulation under hypoxic conditions in these cells (Figure 4E). Of further interest, ADM is higher expressed in more aggressive neuroblastoma tumours (stage 4 versus other stages) (Figure 4F).
Furthermore, the observed ADM upregulation is intriguing and has a potentially important translational consequence. In addition to ADM activation upon hypoxia [45–51], ADM was also shown to act as growth factor, prevent apoptosis-mediated cell death, increase tumour cell motility and metastasis and induce angiogenesis in various cancer types [47–49, 51, 53–59]. Of further importance, it has been reported that hypoxia, which can activate ADM [45–51], induces resistance to ALK inhibitors in non-small cell lung cancer [60] and that ADM expression levels are increased in tyrosine kinase inhibitor sunitinib resistant renal cell carcinoma [61]. In view of these observations, we evaluated whether combining an adrenomedullin receptor antagonist (ADM22-52) [61] together with TAE684 would sensitize NB cells to ALK inhibition. No additional effects on decrease in cell viability were observed (data not shown). This observation could be due to the fact that elevated ADM levels have no effect on sensitivity for ALK inhibitors in neuroblastoma cells. Alternatively, given that the cell lines tested are very sensitive to the inhibitor with immediate strong and massive apoptotic effects, under these conditions elevated ADM levels may have no immediate effects on cell viability, while in a later stage in cells rendered resistant to ALK inhibition, combined exposure to both ALK inhibition and the ADM inhibitor might have effect.
MATERIALS AND METHODS
CLB-GA time series dataset
The CLB-GA time series dataset has been described before [31]. The neuroblastoma CLB-GA cell line (ALKR1275Q) was cultured in RPMI-1640 medium (Invitrogen), supplemented with fetal bovine serum (10%), kanamycin (100 μg/ml) penicillin/streptomycin (100 IU/ml), L-glutamine (2 mM) and HEPES (25 mM) (Life Technologies), and maintained at 37°C in a 5% C02-humidified environment. At different time points (10, 30 minutes, 1, 2, 4 and 6 hours) after treatment with 0.32 μM of the small molecule ALK inhibitor NVP-TAE684 (hereafter TAE684) (SelleckChem, S1108) or DMSO (VWR) as solvent control, cells were harvested and RNA quality was analysed using Experion (Bio-Rad) prior to gene-expression profiling. Samples were labelled and hybridized to the Sureprint G3 human GE 8x60K microarrays (Agilent Technologies), according to the manufacturer’s guidelines and starting from 200 ng RNA. The data was normalized with the vsn method in R version 3.3.3 (packages vsn and limma). The R package BioMart was used to annotate gene names to their corresponding probes. Probes detecting at least a two-fold higher expression than the negative control probes of the array in at least 60% of the DMSO or TAE samples, were selected as background correction. Data can be accessed through ArrayExpress (accession number E-MTAB-3206) [31].
Signature score analysis
To establish MAPK, PI3K/mTOR and RET inhibitor signatures, we used published gene expression profiling data (ArrayExpress accession number E-MTAB-3206) [31]. This dataset contains expression profiling data of the CLB-GA cell line 6 hours after treatment with MAPK inhibitor trametinib, the dual PI3K/mTOR repressor BEZ-235 or RET antagonist vandetanib and DMSO as control. Using the limma R-package, differential expression analysis was performed comparing the DMSO-control and the inhibitor treated samples. The established signatures consist of the differentially expressed genes with adjusted p-value (False Discovery Rate (FDR)) < 0.05. In addition, a published MYCN and a published MYC signature were used to establish the MYC(N) pathway activity [35, 36]. Signatures score analysis was conducted using a rank-scoring algorithm as described previously [31, 36]. For each time point and each duplicate separately, both the ratio between the TAE684 treated sample and his corresponding control sample (Figure 1) as the absolute values (Supplementary Figure 2) were plotted using GraphPad Prism 7.
Gene set enrichment analysis
Gene set enrichment analysis (GSEA [42]) was performed using the MSigDB ‘Hallmarks v5.0’ gene sets (software.broadinstitute.org/gsea/msigdb) and an in house compiled gene set catalogue containing all MYC target genesets from this hallmark catalogue as well as publically available MYC(N) activity or target signatures [35, 36, 62–67]. The genesets, showing positively or negatively enrichment at minimum one time point and with a FDR < 0.1 are plotted in a heatmap. Data was plotted as the mean of the ratio of the TAE684 treated sample and his corresponding control sample at every time point.
Cluster analysis and pathway enrichment analysis in the clusters
Using the Bayesian Information Criterion (BIC) and the elbow method, 9 was defined as the optimal number of clusters in the dataset (Supplementary Figure 4A, 4B). K-means clustering was performed on the expression level ratios of TAE684/DMSO samples for each time point in R (with k = 9). However, visual inspection of the expression patterns of the genes in the clusters showed that some clusters have a similar pattern over time (clusters 1 and 2, 4 and 7, 6 and 9) (Supplementary Figure 4B) and were therefore merged, ending with 6 final clusters (Supplementary Figure 5A). For every cluster, the average response of the genes was plotted as a line (red line). The 4 clusters that are showing a clear dynamic pattern over time, were screened for MSigDB ‘c5 Gene Ontology (GO) Biological Process Ontology (BP) v6.0’ (software.broadinstitute.org/gsea/msigdb), MSigDB ‘c6 Oncogenic Signatures v5.0’ and overrepresented Reactome pathways [40, 41] using the R-packages clusterProfiler and Reactome Pathway Analysis [68, 69].
Differential expression analysis
At every time point, differential expression analysis was performed using the R package limma, comparing the DMSO-control and the TAE684-treated sample. The duplicate experiments, independently generated at different time points, were set as blocking factor. Significantly differentially expressed genes refer to those with an adjusted p-value (FDR) < 0.001. Results are shown in Supplementary Table 2.
Analysis of ADM expression levels after ALK inhibition using qPCR
ADM expression levels were measured in CLB-GA (ALKR1275Q) and Kelly (ALKF1174L) cells that were treated for 6 hours with DMSO as control solvent and 0.09 μM of ALK inhibitor, PF06463922 acetate (Sigma-Aldrich, PZ0271) (dissolved in sterile DMSO and diluted to the final concentration in culture medium) and in NB-1 (ALKamp) cells that were treated for 1 and 6 hours with DMSO as control solvent and 0.32 μM of TAE684 (dissolved in sterile DMSO and diluted to the final concentration in culture medium).
RNA extraction, cDNA synthesis and RT-qPCR of these samples was performed as described earlier [31]. The Cq-values for ADM expression were normalized with data of at least two reference genes (TBP, YWHAZ, B2M, HPRT1 and SDHA) (primer sequences: Supplementary Table 2) using qBasePlus software (Biogazelle).
Evaluation of ADM expression in public mRNA expression datasets
ADM expression levels were evaluated in (1) CLB-GA cells treated with 0.2 μM LDK378, 0.32 μM TAE684, 0.06 μM X396, 0.5 μM crizotinib, 0.05 μM trametinib (MEK-inhibitor), 0.5 μM BEZ-235 (dual PI3K/mTOR inhibitor) and 9.5 μM vandetanib for 6 hours (ArrayExpress accession number E-MTAB-3206) [31], (2) 10 NB cell lines treated with 0.32 μM TAE684 for 6 hours (ArrayExpress accession number E-MTAB-3205) [31], (3) the ALCL TS cell line treated with three different ALK inhibitors for 6 hours (GEO accession number GSE6184) [44], (4) 11 NB cell lines that were cultured under normoxic and hypoxic conditions (1% O2 instead of 20%) for 18 hours (GEO accession number GSE17714) [52] and (5) a cohort of 283 neuroblastoma tumour samples (GEO accession number GSE85047).
Statistical analyses
Statistical significance was calculated with GraphPad Prism7 by unpaired one-way ANOVA with Bonferroni correction when comparing more than two unmatched groups, while (un)-paired t-test was chosen when comparing two groups.
CONCLUSIONS
In summary, dynamic expression profiling following ALK inhibition of ALK mutated neuroblastoma cells revealed (1) unexpected early ADM upregulation with potential implications for design of more effective ALK targeted therapy, (2) an initial increase of MYC(N) activity immediately after ALK inhibition and (3) confirmed inhibition after 1 to 2 hours of the ALK downstream MAPK, PI3K-AKT, RET and MYC(N) pathways.
ACKNOWLEDGMENTS
We thank Jeroen Schacht, Fanny De Vloed, Jolien Van Laere and Els De Smet for their outstanding technical assistance.
CONFLICTS OF INTEREST
The authors declare no conflicts of interest.
FUNDING
S.C. is supported by a pre-doctoral fellowship of the Research Foundation – Flanders (FWO; 11J8313N) and an Emmanuel van der Schueren grant (‘Kom op tegen Kanker’). K.D. is supported by Ghent University (BOF; BOF16/PDO/043) and R.C. by a pre-doctoral fellowship of the Research Foundation – Flanders (FWO). The authors would further like to thank the following funding agencies: the Belgian Foundation against Cancer (project 2014-175) to F.S., Ghent University (BOF10/GOA/019, BOF16/GOA/23) to F.S., the Belgian Program of Interuniversity Poles of Attraction (IUAP Phase VII - P7/03) to F.S., the Fund for Scientific Research Flanders (Research projects G053012N, G050712N, G051516N to F.S) and ‘Stichting Villa Joep’ to F.S.
REFERENCES
1. Louis CU, Shohet JM. Neuroblastoma: molecular pathogenesis and therapy. Annu Rev Med. 2015; 66:49–63. https://doi.org/10.1146/annurev-med-011514-023121.
2. Matthay K, Maris J, Schleiermacher G, Nakagawara A, Mackall C, Diller L, Weiss W. Neuroblastoma. Nat Rev Dis Primers. 2016; 2:16078. https://doi.org/10.1038/nrdp.2016.78.
3. Moreno L, Caron H, Geoerger B, Eggert A, Schleiermacher G, Brock P, Valteau-Couanet D, Chesler L, Schulte JH, De Preter K, Molenaar J, Schramm A, Eilers M, et al. Accelerating drug development for neuroblastoma - New Drug Development Strategy: an Innovative Therapies for Children with Cancer, European Network for Cancer Research in Children and Adolescents and International Society of Paediatric Oncology Europe Neuroblastoma project. Expert Opin Drug Discov. 2017; 12:801–11. https://doi.org/10.1080/17460441.2017.1340269.
4. George R, Sanda T, Hanna M, Fröhling S, Luther W 2nd, Zhang J, Ahn Y, Zhou W, London W, McGrady P, Xue L, Zozulya S, Gregor V, et al. Activating mutations in ALK provide a therapeutic target in neuroblastoma. Nature. 2008; 455:975–8. https://doi.org/10.1038/nature07397.
5. Mossé Y, Laudenslager M, Longo L, Cole K, Wood A, Attiyeh E, Laquaglia M, Sennett R, Lynch J, Perri P, Laureys G, Speleman F, Kim C, et al. Identification of ALK as a major familial neuroblastoma predisposition gene. Nature. 2008; 455:930–5. https://doi.org/10.1038/nature07261.
6. Chen Y, Takita J, Choi Y, Kato M, Ohira M, Sanada M, Wang L, Soda M, Kikuchi A, Igarashi T, Nakagawara A, Hayashi Y, Mano H, et al. Oncogenic mutations of ALK kinase in neuroblastoma. Cah Rev The. 2008; 455:971–4. https://doi.org/10.1038/nature07399.
7. Janoueix-Lerosey I, Lequin D, Brugières L, Ribeiro A, Pontual L, Combaret V, Raynal V, Puisieux A, Schleiermacher G, Pierron G, Valteau-Couanet D, Frebourg T, Michon J, et al. Somatic and germline activating mutations of the ALK kinase receptor in neuroblastoma. Cah Rev The. 2008; 455:967–70. https://doi.org/10.1038/nature07398.
8. Bellini A, Bernard V, Leroy Q, Frio T, Pierron G, Combaret V, Lapouble E, Clement N, Rubie H, Thebaud E, Chastagner P, Defachelles A, Bergeron C, et al. Deep Sequencing Reveals Occurrence of Subclonal ALK Mutations in Neuroblastoma at Diagnosis. Clin Cancer Res. 2015; 21:4913–21. https://doi.org/10.1158/1078-0432.CCR-15-0423.
9. Schleiermacher G, Javanmardi N, Bernard V, Leroy Q, Cappo J, Rio Frio T, Pierron G, Lapouble E, Combaret V, Speleman F, de Wilde B, Djos A, Ora I, et al. Emergence of new ALK mutations at relapse of neuroblastoma. J Clin Oncol. 2014; 32:2727–34. https://doi.org/10.1200/JCO.2013.54.0674.
10. Eleveld TF, Oldridge DA, Bernard V, Koster J, Daage LC, Diskin SJ, Schild L, Bentahar NB, Bellini A, Chicard M, Lapouble E, Combaret V, Legoix-Né P, et al. Relapsed neuroblastomas show frequent RAS-MAPK pathway mutations. Nat Genet. 2015; 47:864–71. https://doi.org/10.1038/ng.3333.
11. Friboulet L, Li N, Katayama R, Lee C, Gainor J, Crystal A, Michellys PY, Awad M, Yanagitani N, Kim S, Pferdekamper A, Li J, Kasibhatla S, et al. The ALK Inhibitor Ceritinib Overcomes Crizotinib Resistance in Non–Small Cell Lung Cancer. Cancer Discov. 2014; 4:662–73. https://doi.org/10.1158/2159-8290.CD-13-0846.
12. Shaw A, Friboulet L, Leshchiner I, Gainor J, Bergqvist S, Brooun A, Burke B, Deng YL, Liu W, Dardaei L, Frias R, Schultz K, Logan J, et al. Resensitization to Crizotinib by the Lorlatinib ALK Resistance Mutation L1198F. New Engl J Medicine. 2016; 374:54–61. https://doi.org/10.1056/NEJMoa1508887.
13. Lovly C, McDonald N, Chen H, Ortiz-Cuaran S, Heukamp L, Yan Y, Florin A, Ozretić L, Lim D, Wang L, Chen Z, Chen X, Lu P, et al. Rationale for co-targeting IGF-1R and ALK in ALK fusion-positive lung cancer. Nat Med. 2014; 20:1027–34. https://doi.org/10.1038/nm.3667.
14. Shaw A, Kim DW, Mehra R, Tan D, Felip E, Chow L, Camidge R, Vansteenkiste J, Sharma S, Pas T, Riely G, Solomon B, Wolf J, et al. Ceritinib in ALK-Rearranged Non–Small-Cell Lung Cancer. New Engl J Medicine. 2014; 370:1189–97. https://doi.org/10.1056/NEJMoa1311107.
15. Shaw A, Kim DW, Nakagawa K, Seto T, Crinó L, Ahn MJ, Pas T, Besse B, Solomon B, Blackhall F, Wu YL, Thomas M, O’Byrne K, et al. Crizotinib versus Chemotherapy in Advanced ALK-Positive Lung Cancer. New Engl J Medicine. 2013; 368:2385–94. https://doi.org/10.1056/NEJMoa1214886.
16. Sakamoto H, Tsukaguchi T, Hiroshima S, Kodama T, Kobayashi T, Fukami T, Oikawa N, Tsukuda T, Ishii N, Aoki Y. CH5424802, a Selective ALK Inhibitor Capable of Blocking the Resistant Gatekeeper Mutant. Cancer Cell. 2011; 19:679–90. https://doi.org/10.1016/j.ccr.2011.04.004.
17. Thomas R. Overcoming Drug Resistance in ALK-Rearranged Lung Cancer. New Engl J Medicine. 2014; 370:1250–1. https://doi.org/10.1056/NEJMe1316173.
18. Mossé Y, Lim M, Voss S, Wilner K, Ruffner K, Laliberte J, Rolland D, Balis F, Maris J, Weigel B, Ingle A, Ahern C, Adamson P, et al. Safety and activity of crizotinib for paediatric patients with refractory solid tumours or anaplastic large-cell lymphoma: a Children’s Oncology Group phase 1 consortium study. The Lancet Oncology. 2013; 14:472–80. https://doi.org/10.1016/S1470-2045(13)70095-0.
19. Guan J, Tucker ER, Wan H, Chand D, Danielson LS, Ruuth K, El Wakil A, Witek B, Jamin Y, Umapathy G, Robinson SP, Johnson TW, Smeal T, et al. The ALK inhibitor PF-06463922 is effective as a single agent in neuroblastoma driven by expression of ALK and MYCN. Dis Model Mech. 2016; 9:941–52. https://doi.org/10.1242/dmm.024448.
20. Amin AD, Li L, Rajan SS, Gokhale V, Groysman MJ, Pongtornpipat P, Tapia EO, Wang M, Schatz JH. TKI sensitivity patterns of novel kinase-domain mutations suggest therapeutic opportunities for patients with resistant ALK+ tumors. Oncotarget. 2016; 7:23715–29. https://doi.org/10.18632/oncotarget.8173.
21. Pall G. The next-generation ALK inhibitors. Curr Opin Oncol. 2015; 27:118. https://doi.org/10.1097/CCO.0000000000000165.
22. Duncan JS, Whittle MC, Nakamura K, Abell AN, Midland AA, Zawistowski JS, Johnson NL, Granger DA, Jordan NV, Darr DB, Usary J, Kuan PF, Smalley DM, et al. Dynamic Reprogramming of the Kinome in Response to Targeted MEK Inhibition in Triple-Negative Breast Cancer. Cell. 2012; 149:307–21. https://doi.org/10.1016/j.cell.2012.02.053.
23. Toyokawa G, Seto T. Updated Evidence on the Mechanisms of Resistance to ALK Inhibitors and Strategies to Overcome Such Resistance: Clinical and Preclinical Data. Oncology Research and Treatment. 2015; 0:291–8. https://doi.org/10.1159/000430852.
24. Bresler SC, Wood AC, Haglund EA, Courtright J, Belcastro LT, Plegaria JS, Cole K, Toporovskaya Y, Zhao H, Carpenter EL, Christensen JG, Maris JM, Lemmon MA, et al. Differential inhibitor sensitivity of anaplastic lymphoma kinase variants found in neuroblastoma. Sci Transl Med. 2011; 3:108ra114. https://doi.org/10.1126/scitranslmed.3002950.
25. Bresler SC, Weiser DA, Huwe PJ, Park JH, Krytska K, Ryles H, Laudenslager M, Rappaport EF, Wood AC, McGrady PW, Hogarty MD, London WB, Radhakrishnan R, et al. ALK Mutations Confer Differential Oncogenic Activation and Sensitivity to ALK Inhibition Therapy in Neuroblastoma. Cancer Cell. 2014; 26:682–94. https://doi.org/10.1016/j.ccell.2014.09.019.
26. Heuckmann J, Hölzel M, Sos M, Heynck S, Balke-Want H, Koker M, Peifer M, Weiss J, Lovly C, Grütter C, Rauh D, Pao W, Thomas R. ALK Mutations Conferring Differential Resistance to Structurally Diverse ALK Inhibitors. Clinical Cancer Research. 2011; 17:7394–401. https://doi.org/10.1158/1078-0432.CCR-11-1648.
27. Yan X, Kennedy C, Tilkens S, Wiedemeier O, Guan H, Park JI, Chan A. Cooperative Cross-Talk between Neuroblastoma Subtypes Confers Resistance to Anaplastic Lymphoma Kinase Inhibition. Genes Cancer. 2011; 2:538–49. https://doi.org/10.1177/1947601911416003.
28. Debruyne D, Bhatnagar N, Sharma B, Luther W, Moore N, Cheung NK, Gray N, George R. ALK inhibitor resistance in ALKF1174L-driven neuroblastoma is associated with AXL activation and induction of EMT. Oncogene. 2015; 35:3681–91. https://doi.org/10.1038/onc.2015.434.
29. Isozaki H, Ichihara E, Takigawa N, Ohashi K, Ochi N, Yasugi M, Ninomiya T, Yamane H, Hotta K, Sakai K, Matsumoto K, Hosokawa S, Bessho A, et al. Non–Small Cell Lung Cancer Cells Acquire Resistance to the ALK Inhibitor Alectinib by Activating Alternative Receptor Tyrosine Kinases. Cancer Res. 2015; 76:1506–16. https://doi.org/10.1158/0008-5472.CAN-15-1010.
30. Lovly C, Shaw A. Molecular Pathways: Resistance to Kinase Inhibitors and Implications for Therapeutic Strategies. Clin Cancer Res. 2014; 20:2249–56. https://doi.org/10.1158/1078-0432.CCR-13-1610.
31. Lambertz I, Kumps C, Claeys S, Lindner S, Beckers A, Janssens E, Carter DR, Cazes A, Cheung BB, De Mariano M, De Bondt A, De Brouwer S, Delattre O, et al. Upregulation of MAPK Negative Feedback Regulators and RET in Mutant ALK Neuroblastoma: Implications for Targeted Treatment. Clin Cancer Res. 2015; 21:3327–39. https://doi.org/10.1158/1078-0432.CCR-14-2024.
32. Schönherr C, Ruuth K, Kamaraj S, Wang CL, Yang HL, Combaret V, Djos A, Martinsson T, Christensen J, Palmer R, Hallberg B. Anaplastic Lymphoma Kinase (ALK) regulates initiation of transcription of MYCN in neuroblastoma cells. Oncogene. 2012; 31:5193–200. https://doi.org/10.1038/onc.2012.12.
33. Heukamp L, Thor T, Schramm A, Preter K, Kumps C, Wilde B, Odersky A, Peifer M, Lindner S, Spruessel A, Pattyn F, Mestdagh P, Menten B, et al. Targeted Expression of Mutated ALK Induces Neuroblastoma in Transgenic Mice. Sci Transl Medicine. 2012; 4:141ra91–141ra91. https://doi.org/10.1126/scitranslmed.3003967.
34. Berry T, Luther W, Bhatnagar N, Jamin Y, Poon E, Sanda T, Pei D, Sharma B, Vetharoy W, Hallsworth A, Ahmad Z, Barker K, Moreau L, et al. The ALKF1174L Mutation Potentiates the Oncogenic Activity of MYCN in Neuroblastoma. Cancer Cell. 2012; 22:117–30. https://doi.org/10.1016/j.ccr.2012.06.001.
35. Valentijn LJ, Koster J, Haneveld F, Aissa RA, van Sluis P, Broekmans ME, Molenaar JJ, van Nes J, Versteeg R. Functional MYCN signature predicts outcome of neuroblastoma irrespective of MYCN amplification. Proc Natl Acad Sci USA. 2012; 109:19190–5. https://doi.org/10.1073/pnas.1208215109.
36. Fredlund E, Ringnér M, Maris JM, Påhlman S. High Myc pathway activity and low stage of neuronal differentiation associate with poor outcome in neuroblastoma. Proc Natl Acad Sci USA. 2008; 105:14094–9. https://doi.org/10.1073/pnas.0804455105.
37. Zhu S, Lee JS, Guo F, Shin J, Perez-Atayde A, Kutok J, Rodig S, Neuberg D, Helman D, Feng H, Stewart R, Wang W, George R, et al. Activated ALK Collaborates with MYCN in Neuroblastoma Pathogenesis. Cancer Cell. 2012; 21:362–73. https://doi.org/10.1016/j.ccr.2012.02.010.
38. Chesler L, Schlieve C, Goldenberg DD, Kenney A, Kim G, McMillan A, Matthay KK, Rowitch D, Weiss WA. Inhibition of phosphatidylinositol 3-kinase destabilizes Mycn protein and blocks malignant progression in neuroblastoma. Cancer Res. 2006; 66:8139–46. https://doi.org/10.1158/0008-5472.CAN-05-2769.
39. De Brouwer S, De Preter K, Kumps C, Zabrocki P, Porcu M, Westerhout E, Lakeman A, Vandesompele J, Hoebeeck J, Van Maerken T, De Paepe A, Laureys G, Schulte J, et al. Meta-analysis of Neuroblastomas Reveals a Skewed ALK Mutation Spectrum in Tumors with MYCN Amplification. Clinical Cancer Research. 2010; 16:4353–62. https://doi.org/10.1158/1078-0432.CCR-09-2660.
40. Fabregat A, Sidiropoulos K, Garapati P, Gillespie M, Hausmann K, Haw R, Jassal B, Jupe S, Korninger F, McKay S, Matthews L, May B, Milacic M, et al. The Reactome pathway Knowledgebase. Nucleic Acids Res. 2016; 44:D481–7. https://doi.org/10.1093/nar/gkv1351.
41. Croft D, Mundo AF, Haw R, Milacic M, Weiser J, Wu G, Caudy M, Garapati P, Gillespie M, Kamdar MR, Jassal B, Jupe S, Matthews L, et al. The Reactome pathway knowledgebase. Nucleic Acids Res. 2014; 42:D472–7. https://doi.org/10.1093/nar/gkt1102.
42. Subramanian A, Tamayo P, Mootha V, Mukherjee S, Ebert B, Gillette M, Paulovich A, Pomeroy S, Golub T, Lander E, Mesirov J. Gene set enrichment analysis: A knowledge-based approach for interpreting genome-wide expression profiles. Proc Natl Acad Sci U S A. 2005; 102:15545–50. https://doi.org/10.1073/pnas.0506580102.
43. Lai AZ, Cory S, Zhao H, Gigoux M, Monast A, Guiot MC, Huang S, Tofigh A, Thompson C, Naujokas M, Marcus VA, Bertos N, Sehat B, et al. Dynamic reprogramming of signaling upon met inhibition reveals a mechanism of drug resistance in gastric cancer. Sci Signal. 2014; 7:ra38. https://doi.org/10.1126/scisignal.2004839.
44. Piva R, Pellegrino E, Mattioli M, Agnelli L, Lombardi L, Boccalatte F, Costa G, Ruggeri BA, Cheng M, Chiarle R, Palestro G, Neri A, Inghirami G. Functional validation of the anaplastic lymphoma kinase signature identifies CEBPB and BCL2A1 as critical target genes. J Clin Invest. 2006; 116:3171–82. https://doi.org/10.1172/JCI29401.
45. Kitamuro T, Takahashi K, Totsune K, Nakayama M, Murakami O, Hida W, Shirato K, Shibahara S. Differential expression of adrenomedullin and its receptor component, receptor activity modifying protein (RAMP) 2 during hypoxia in cultured human neuroblastoma cells. Peptides. 2001; 22:1795–801.
46. Dötsch J, Harmjanz A, Christiansen H, Hänze J, Lampert F, Rascher W. Gene expression of neuronal nitric oxide synthase and adrenomedullin in human neuroblastoma using real-time PCR. Int J Cancer. 2000; 88:172–5.
47. Park SJ, Kim JG, Son T, Yi J, Kim N, Yang K, Heo K. The histone demethylase JMJD1A regulates adrenomedullin-mediated cell proliferation in hepatocellular carcinoma under hypoxia. Biochem Bioph Res Co. 2013; 434:722–7. https://doi.org/10.1016/j.bbrc.2013.03.091.
48. Wang S, Yang WL. Circulating hormone adrenomedullin and its binding protein protect neural cells from hypoxia-induced apoptosis. Biochimica Et Biophysica Acta. 2009; 1790:361–7. https://doi.org/10.1016/j.bbagen.2009.03.012.
49. Larráyoz IM, Martínez-Herrero S, García-Sanmartín J, Ochoa-Callejero L, Martínez A. Adrenomedullin and tumour microenvironment. J Transl Med. 2014; 12:339. https://doi.org/10.1186/s12967-014-0339-2.
50. Sena J, Wang L, Pawlus M, Hu CJ. HIFs Enhance the Transcriptional Activation and Splicing of Adrenomedullin. Mol Cancer Res. 2014; 12:728–41. https://doi.org/10.1158/1541-7786.MCR-13-0607.
51. Keleg S, Kayed H, Jiang X, Penzel R, Giese T, Büchler M, Friess H, Kleeff J. Adrenomedullin is induced by hypoxia and enhances pancreatic cancer cell invasion. Int J Cancer. 2007; 121:21–32. https://doi.org/10.1002/ijc.22596.
52. Fardin P, Barla A, Mosci S, Rosasco L, Verri A, Versteeg R, Caron HN, Molenaar JJ, Ora I, Eva A, Puppo M, Varesio L. A biology-driven approach identifies the hypoxia gene signature as a predictor of the outcome of neuroblastoma patients. Mol Cancer. 2010; 9:185. https://doi.org/10.1186/1476-4598-9-185.
53. Uemura M, Yamamoto H, Takemasa I, Mimori K, Mizushima T, Ikeda M, Sekimoto M, Doki Y, Mori M. Hypoxia-inducible adrenomedullin in colorectal cancer. Anticancer Res. 2011; 31:507–14.
54. Oehler MK, Fischer DC, Orlowska-Volk M, Herrle F, Kieback DG, Rees MC, Bicknell R. Tissue and plasma expression of the angiogenic peptide adrenomedullin in breast cancer. Br J Cancer. 2003; 89:1927–33. https://doi.org/10.1038/sj.bjc.6601397.
55. Wu XY, Hao CP, Ling M, Guo CH, Ma W. Hypoxia-induced apoptosis is blocked by adrenomedullin via upregulation of Bcl-2 in human osteosarcoma cells. Oncol Rep. 2015; 34:787–94. https://doi.org/10.3892/or.2015.4011.
56. Li F, Yang R, Zhang X, Liu A, Zhao Y, Guo Y. Silencing of hypoxiainducible adrenomedullin using RNA interference attenuates hepatocellular carcinoma cell growth in vivo. Mol Med Rep. 2014; 10:1295–302. https://doi.org/10.3892/mmr.2014.2320.
57. Chen P, Huang Y, Bong R, Ding Y, Song N, Wang X, Song X, Luo Y. Tumor-Associated Macrophages Promote Angiogenesis and Melanoma Growth via Adrenomedullin in a Paracrine and Autocrine Manner. Clin Cancer Res. 2011; 17:7230–9. https://doi.org/10.1158/1078-0432.CCR-11-1354.
58. Belloni AS, Albertin G, Forneris ML, Nussdorfer GG. Proadrenomedullin-derived peptides as autocrine-paracrine regulators of cell growth. Histol Histopathol. 2001; 16:1263–74.
59. Qiao F, Fang J, Xu J, Zhao W, Ni Y, Akuo B, Zhang W, Liu Y, Ding F, Li G, Liu B, Wang H, Shao S. The role of adrenomedullin in the pathogenesis of gastric cancer. Oncotarget. 2017; 8:88464–88474. https://doi.org/10.18632/oncotarget.18881.
60. Kogita A, Togashi Y, Hayashi H, Sogabe S, Terashima M, Velasco M, Sakai K, Fujita Y, Tomida S, Takeyama Y, Okuno K, Nakagawa K, Nishio K. Hypoxia induces resistance to ALK inhibitors in the H3122 non-small cell lung cancer cell line with an ALK rearrangement via epithelial-mesenchymal transition. Int J Oncol. 2014; 45:1430–6. https://doi.org/10.3892/ijo.2014.2574.
61. Gao Y, Li J, Qiao N, Meng Q, Zhang M, Wang X, Jia J, Yang S, Qu C, Li W, Wang D. Adrenomedullin blockade suppresses sunitinib-resistant renal cell carcinoma growth by targeting the ERK/MAPK pathway. Oncotarget. 2016; 7:63374–87. https://doi.org/10.18632/oncotarget.11463.
62. Puissant A, Frumm S, Alexe G, Bassil C, Qi J, Chanthery Y, Nekritz E, Zeid R, Gustafson W, Greninger P, Garnett M, McDermott U, Benes C, et al. Targeting MYCN in Neuroblastoma by BET Bromodomain Inhibition. Cancer Discovery. 2013; 3:308–23. https://doi.org/10.1158/2159-8290.CD-12-0418.
63. Coller H, Grandori C, Tamayo P, Colbert T, Lander E, Eisenman R, Golub T. Expression analysis with oligonucleotide microarrays reveals that MYC regulates genes involved in growth, cell cycle, signaling, and adhesion. Proc National Acad Sci. 2000; 97:3260–5. https://doi.org/10.1073/pnas.97.7.3260.
64. Ellwood-Yen K, Graeber TG, Wongvipat J, Iruela-Arispe ML, Zhang J, Matusik R, Thomas GV, Sawyers CL. Myc-driven murine prostate cancer shares molecular features with human prostate tumors. Cancer Cell. 2003; 4:223–38.
65. Zeller K, Jegga A, Aronow B, O’Donnell K, Dang C. An integrated database of genes responsive to the Myc oncogenic transcription factor: identification of direct genomic targets. Genome Biol. 2003; 4:1–10. https://doi.org/10.1186/gb-2003-4-10-r69.
66. Yu D, Cozma D, Park A, Thomas-Tikhonenko A. Functional validation of genes implicated in lymphomagenesis: an in vivo selection assay using a Myc-induced B-cell tumor. Ann N Y Acad Sci. 2005; 1059:145–59. https://doi.org/10.1196/annals.1339.047.
67. Kim Y, Girard L, Giacomini C, Wang P, Hernandez-Boussard T, Tibshirani R, Minna J, Pollack J. Combined microarray analysis of small cell lung cancer reveals altered apoptotic balance and distinct expression signatures of MYC family gene amplification. Oncogene. 2005; 25:130–8. https://doi.org/10.1038/sj.onc.1208997.
68. Yu G, He QY. ReactomePA: an R/Bioconductor package for reactome pathway analysis and visualization. Mol Biosyst. 2015; 12:477–9. https://doi.org/10.1039/C5MB00663E.
69. Yu G, Wang LG, Han Y, He QY. clusterProfiler: an R Package for Comparing Biological Themes Among Gene Clusters. Omics J Integr Biology. 2012; 16:284–7. https://doi.org/10.1089/omi.2011.0118.