
Introduction
Prostate cancer (PrCa) is the most prevalent non-cutaneous cancer diagnosed in men in the United States, with about one in six men developing PrCa during their lifetime [1]. The genetic inflence in PrCa was estimated to be as high as 42-57% [2, 3]. Great efforts have been made during the past several decades to elucidate the underlying etiology of this disease. Among these efforts, genome-wide association studies (GWAS) have been one of the most valuable approaches to discover potential genetic susceptibilities. As of December 4, 2012, a total of 22 PrCa GWA studies have been deposited into the GWAS Catalog at the National Human Genome Research Institute (NHGRI) [4], yielding more than 100 common single nucleotide polymorphisms (SNPs) that potentially contribute to PrCa risk. However, the reported SNPs could only explain a small proportion of the genetic variances that might contribute to this disease and most significantly associated SNPs are located in non-coding regions with unknown functional annotations [4]. Furthermore, the original GWA studies typically reported only a few SNPs that reach the strigent genome-wide significance (i.e., p < 5×10⁻⁸), while neglecting those SNPs with moderate or weak significance (5×10⁻⁸ < p < 0.05).
Considering that a majority of disease-associated SNPs are located in non-coding regions that have unexplained functions, a paradigm has emerged to link associated SNPs discovered in GWAS with regulatory data, such as expression quantitative trait loci (eQTL) [5-11]. For example, Nicolae et al. [12] examined trait-associated SNPs collected from the NHGRI GWAS Catalog [4] and the Wellcome Trust Case Control Consortium (WTCCC) GWAS data (Crohn’s disease, type 1 diabetes, and rheumatoid arthritis) and reported that trait-associated SNPs are more likely to be eQTLs. Additionally, several studies on neuropsychiatric disorders, such as schizophrenia [13, 14], bipolar disorder [15], Tourette’s syndrome [16], obsessive-compulsive disorder [17], and Autism [18], displayed a similar trend that top trait-associated SNPs are more likely to be enriched with regulatory variants in eQTLs or methylation quantitative trait loci (mQTLs). Comparative studies have not been conducted on any single type of cancer yet, though there were numerous cancer GWA studies published recently. It would be interesting to examine whether cancer-associated SNPs function through their regulatory roles in a way that is similar to those in psychiatric diseases. In addition, the recent release of the data from the Encyclopedia of DNA Elements (ENCODE) project provides valuable and comprehensive annotations regarding regulatory variants in the human genome, especially transcription factor binding site (TFBS) data [19, 20].
In this work, we explored top PrCa-associated SNPs for regulatory roles in eQTLs and TFBSs. Specifically, we used two PrCa GWAS datasets: the Cancer Genetic Markers of Susceptibility (CGEMS) [21] and the Multiethnic Cohort (MEC) [22]. Considering that eQTL information relies on specific population, we examined the regulatory roles in three human populations, respectively: Caucasian (CEU), African American (AA), and Japanese (JPT) populations (Figure 1). An enrichment test was performed based on randomization and/or permutation process, whichever was applicable. We incorporated TFBS data as complementary regulation mechanisms. Our observations were further validated by using pan-cancer association SNPs collected from the GWAS Catalog [4]. We further evaluated the enrichment pattern using tissue- and/or population-matched eQTL data in top PrCa-associated SNPs. To the best of our knowledge, this is the first study that investigates the enrichment patterns of eQTL and TFBS in PrCa or any type of cancer. We observed a significant enrichment in the PrCa CEU population. Interestingly, our joint analysis of associated SNPs with eQTL and TFBS data further highlighted two SNPs, rs2861405 and rs4766642, in strong linkage disequilibrium (LD) with the PrCa-associated SNPs. These two SNPs were predicted to affect the expression of their downstream genes, i.e., ZNF791 (by regulation through eQTL) and CREBBP (by regulation through TFBS) for rs2861405, and GLTP (eQTL) and SPI1 (TFBS) for rs4766642. Our finding warrants future investigation of these SNPs’ functions in PrCa.
Results
Enrichment analysis with eQTL
We obtained 678, 1216, and 326 top PrCa-associated SNPs (p < 10-3) in CGEMS-CEU, MEC-AA, and MEC-JPT, respectively. As a comparison, we re-analyzed the International Schizophrenia Consortium (ISC)-CEU GWAS data, which had been demonstrated previously as a significant enrichment of eQTLs in brain data [13]. We included this data for the purpose of validating our methods as well as to compare the effect of eQTL on different diseases. We obtained 1470 schizophrenia-associated SNPs with p < 10-3.
We first examined whether top PrCa-associated SNPs were enriched with lymphoblastoid cell lines (LCL) eQTLs in each population. Both the randomization and permutation tests were performed (see Material and methods). Notably, the number of trans-eQTLs blocks in the original GWAS dataset for the three populations was less than 3 and sometimes the number was 0. This indicates that trans-eQTLs in these datasets may not hava a confident estimation of the significance in the test. Thus, we only focused on cis-eQTLs. As shown in Figure 2, the randomization test did not indicate a significant enrichment in any of the three populations regardless of the LD SNPs being taken into consideration. Specifically, the results not considering LD SNPs were pCEU = 0.720, pAA = 0.867 and pJPT = 0.979 (Figure 2A-C); and considering LD SNPs were pCEU = 0.726, pAA = 0.996 and pJPT = 0.996 (Figure 2D-F, Supplementary Table 2). By applying the permutation tests, as shown in Figure 2G-I, we identified 40, 10, and 16 independent eSNP blocks in CGEMS-CEU, MEC-AA, and MEC-JPT, respectively, while the expected numbers of eSNP blocks were 21.48 (s.d. = 7.68), 10.76 (s.d. = 4.30), and 20.72 (s.d. = 8.10), respectively (Supplementary Table 2). Here, s.d. denotes standard deviation. The empirical p values of the permutation tests were pCEU = 0.019, pAA = 0.463, and pJPT = 0.653 (Supplementary Table 2). The results above indicated that the associated SNPs in CGEMS-CEU were significantly enriched with eSNPs from LCL cis-eQTL data but were not enriched in either the MEC-AA or MEC-JPT population.
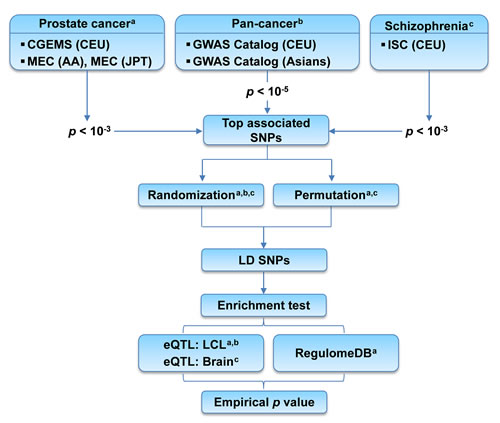
Figure 1: Flow chart of the enrichment analysis of top associated SNPs with prostate cancer. CGEMS: Cancer Genetic Markers of Susceptibility GWAS. MEC: Multiethnic Cohort GWAS. ISC: International Schizophrenia Consortium GWAS. CEU: Caucasians. AA: African Americans. JPT: Japanese. Top associated SNPs: SNPs whose association p-values surpassed the pre-defined cutoff. LD SNPs: SNPs located in the linkage disequilibrium (LD) blocks of the top associated SNPs. LCL: lymphoblastoid cell lines.
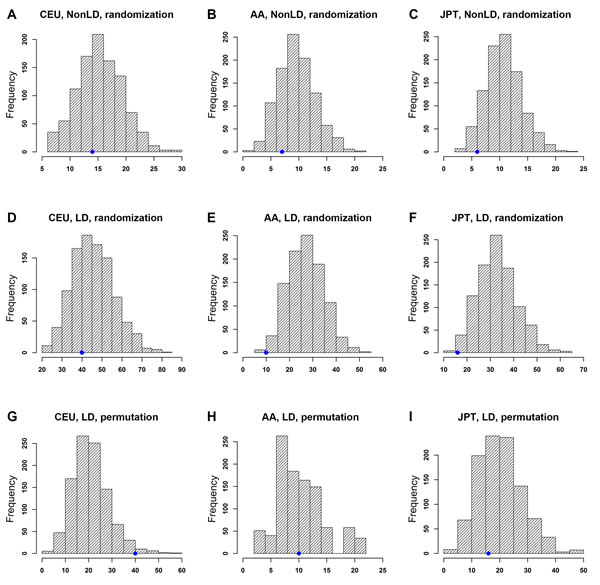
Figure 2: Enrichment analysis of PrCa-associated SNPs with cis-expression quantitative trait loci (eQTLs). X-axis: eSNP block count. Y-axis: frequency of eSNP blocks. The blue dot on each plot indicates the observed number of eSNP blocks. Note that the scales of those plots are different. Distributions of eSNP blocks using a randomization test without considering LD SNPs are shown in (A) CEU, (B) AA, and (C) JPT populations. Distributions using a randomization test considering LD SNPs are shown in (D) CEU, (E) AA, and (F) JPT populations. Distributions using a permutation test considering LD SNPs are shown in (G) CEU, (H) AA, and (I) JPT populations.
As described in the Materials and Methods, the randomization test tends to overestimate the number of expected independent LD blocks because it ignores the LD structure across the genome. Thus, the generated null distribution would likely be inflated with eSNPs and lead to a false negative discovery. On the contrary, the permutation test is expected to be more accurate in identifying regulatory information than the randomization test, though it requires raw genotyping data and is computationally time consuming. To confirm this hypothesis, we applied both randomization and permutation tests to the ISC-CEU data, which has previously shown that trait-associated SNPs in this dataset were significantly enriched with brain eQTL through the randomization test [13]. Our randomization test indeed revealed a pattern that is similar to what was observed in the previous study (Supplementary Figure 1A, B). The permutation test showed a much stronger (Supplementary Figure 1C) enrichment pattern than the randomization test, indicating that the latter might overestimate the expected number of eSNPs (or eSNP blocks). As shown in Table 1, for GWAS data that contains a large proportion of eSNPs among top associated SNPs (e.g., ISC-CEU), we observed a significant enrichment pattern in both randomization and permutation tests (Supplementary Figure 1); however, for GWAS data with a smaller proportion of eSNPs, such as PrCa GWAS, overestimation of eSNPs may lead to a false negative discovery resulting from the randomization test. In both cases, the permutation test seems to have better power to estimate a null distribution reflecting the true association. Therefore, in the following analyses, we applied a permutation approach to evaluate the significance of enrichment, as long as the genotyping data was available.
Table 1: Proportion of expression quantitative trait loci (eQTL) SNPs under different p-value cutoffs in prostate cancer (PrCa) and schizophrenia (SCZ) GWAS. Abbreviations: CGEMS: Cancer Genetic Markers of Susceptibility. CEU: Caucasians. MEC: Multiethnic Cohort. AA: African Americans. JPT: Japanese. ISC: International Schizophrenia Consortium.
Disease |
GWAS dataset |
Population |
p-value cutoff |
|||||||||
1×10⁻⁶ |
5×10⁻⁶ |
1×10⁻⁵ |
5×10⁻⁵ |
1×10⁻⁴ |
5×10⁻⁴ |
1×10⁻³ |
0.01 |
0.1 |
1 |
|||
PrCa |
CGEMS |
CEU |
0 |
0 |
0 |
0 |
0.010 |
0.013 |
0.022 |
0.027 |
0.024 |
0.024 |
PrCa |
MEC |
AA |
0 |
0 |
0 |
0 |
0 |
0.005 |
0.007 |
0.006 |
0.008 |
0.008 |
PrCa |
MEC |
JPT |
0 |
0 |
0 |
0 |
0 |
0.014 |
0.028 |
0.037 |
0.035 |
0.033 |
SCZ |
ISC |
CEU |
0.250 |
0.143 |
0.137 |
0.137 |
0.110 |
0.073 |
0.048 |
0.013 |
0.007 |
0.004 |
Enrichment analysis with transcription factor binding sites
Similar to eQTL enrichment analyses, we examined whether top PrCa-associated SNPs were enriched with tSNPs, i.e. those SNPs in TFBSs retrieved from C1 and C2 categories data of RegulomeDB. As shown in Figure 3, the top PrCa-associated SNPs in CGEMS-CEU were significantly enriched with C2 SNPs (pCEU = 0.014, Figure 3D, Supplementary Table 2), while this significance was slightly above the p < 0.05 threshold when using C1 data (pCEU = 0.068, Figure 3A, Supplementary Table 2). We did not observe any significant enrichment in either the MEC-AA or MEC-JPT population in data either from C1 (pAA = 0.061, Figure 3B; pJPT = 0.603, Figure 3C) or C2 (pAA = 0.230, Figure 3E, pJPT = 0.502, Figure 3F). When we examined the pattern in each subcategory, we found that most signals (94.9% from the observed data and 88.0% (s.d. = 4.1%) from the 1000 permutation sets) in C1 fell into subgroup 1f, which includes eQTL and minimal TF binding/DNase peak evidence [20]. This analysis partially repeated our eQTL enrichment result above but using mixed population of eQTL data, providing confidence in eQTL regulation of the top PrCa-associated SNPs in CGEMS-CEU.
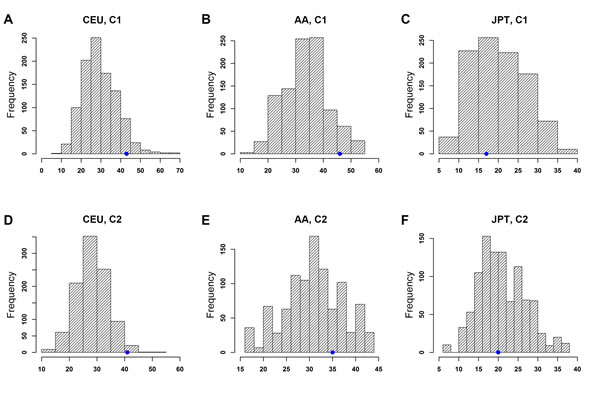
Figure 3: Enrichment analysis of top PrCa-associated SNPs with transcription factor binding sites (TFBSs) of RegulomeDB Category 1 (C1) and Category 2 (C2) using the permutation test. X-axis: tSNP block count. Y-axis: frequency of tSNP blocks. The blue dot on each plot indicates the observed number of tSNP blocks. Note that the scales of those plots are different. Distributions of tSNPs blocks considering LD SNPs are shown in (A) CEU, C1, (B) AA, C1, (C) JPT, C1, (D) CEU, C2, (E) AA, C2, and (F) JPT, C2.
Replication of eQTL and TFBS enrichment using GWAS Catalog SNPs
We collected 254 cancer-associated SNPs from 64 studies of 14 different types of cancer in CEU (Supplementary Table 3). Data for the AA population was not sufficient because only 26 SNPs were deposited in the GWAS Catalog. Considering the small number of cancer-associated SNPs for the JPT population in the GWAS Catalog, we collected 79 cancer-associated SNPs from 19 studies covering 8 different types of cancer in the Asian population (Supplementary Table 4). As shown in Figure 4A and 4C, we found that the cancer-associated SNPs were significantly enriched with cis-eQTLs (p < 0.001) and TFBSs (p = 0.021) in the CEU population (Supplementary Table 2). For the cancer-associated SNPs in the Asian population, we did not observe such a significant enrichment with either cis-eQTLs (Figure 4B) or TFBSs (Figure 4D). Next, we examined the enrichment of prostate cancer GWAS Catalog SNPs with eQTLs and TFBSs. We found 99 and 15 GWAS Catalog SNPs for PrCa in the CEU and Asian populations, respectively. For CEU, the PrCa GWAS Catalog SNPs showed similar enrichment significance with eQTLs (p = 0.012, 21 eSNP blocks) to CGEMS-CEU GWAS data (p = 0.019, 40 eSNP blocks), but not with TFBSs (p = 0.298, 12 tSNP blocks, compared to p = 0.014, 41 tSNP blocks in CGEMS-CEU GWAS data) (Supplementary Table 2). We noted that the number of tSNP blocks (12) based on PrCa CEU GWAS Catalog SNPs might be too small to have a reliable statistical test. Overall, the analysis of GWAS Catalog SNPs indicates that the top associated SNPs are likely to function through regulatory roles (e.g., eQTLs) in CEU PrCa samples. For the PrCa SNPs in Asian population, the number of eSNP/tSNP blocks was 0 and 1, respectively, in all random SNP sets. These numbers are too small to perform a qualified enrichment test. Thus, we did not perform the enrichment test in Asian population.
Due to the lack of appropriate genotyping data, we could not perform the permutation test. As we stated above, the bias in the randomization test leans toward false negative results only. Therefore, the observed positive enrichment pattern in CEU suggests that top cancer-associated SNPs are more likely to function through regulatory roles, i.e., via eQTLs or TFBSs, in CEU PrCa samples. Caution should be taken, however, when a similar pattern is not present in the Asian or other population. Further investigation with more data will help us to better understand this regulatory system among PrCa populations.
Specificities of eQTL enrichment
The above analyses were conducted using LCL cis-eQTL data in the matched population for PrCa-associated SNPs. We further asked whether the enrichment pattern we observed in CGEMS-CEU is conserved among eQTLs with different tissues or different populations. The results were shown in Table 2. First, our results showed that the top PrCa-associated SNPs were significantly enriched with LCL eQTLs but not with brain eQTLs (p = 0.211) or liver eQTLs (p = 0.196), suggesting that the enrichment pattern in CEU might be tissue-specific. Second, the top PrCa-associated SNPs in CEU did not show significant signals that were enriched with eQTLs derived from AA (p = 0.173) or JPT (p = 0.063), further highlighting the necessity to use the population-matched eQTL data for GWAS data analysis.
Table 2: Summary of expression quantitative trait loci (eQTL) enrichment under different scenarios using Cancer Genetic Markers of Susceptibility (CGEMS) prostate cancer GWAS data. Abbreviations: eSNP: eQTL SNP. CEU: Caucasians. LCL: lymphoblastoid cell lines. AA: African Americans. JPT: Japanese.
# observed eSNP blocks |
# expected eSNP blocks (s.d.) |
p-value |
|
CEU, cis-eQTL, LCL |
40 |
21.48 (7.68) |
0.019 |
Tissue specificity |
|||
CEU, cis-eQTL, brain |
4 |
3.00 (2.37) |
0.211 |
CEU, cis-eQTL, liver |
3 |
2.23 (1.52) |
0.196 |
eQTL population specificity |
|||
AA, cis-eQTL, LCL |
10 |
6.71 (3.28) |
0.173 |
JPT, cis-eQTL, LCL |
40 |
26.87 (8.21) |
0.063 |
CEU+AA+JPT, cis-eQTL, LCL |
63 |
36.90 (10.16) |
0.011 |
Combining cis-eQTL and TFBS for better detection of candidate susceptibility loci
We further checked the results from cis-eQTL and TFBS enrichment analyses among all LD SNPs of CGEMS-CEU. Among the identified 131 cis-eSNPs, two were found to be located in the TFBSs: rs4766642 and rs2861405. These two SNPs were not directly genotyped in the CGEMS-CEU GWAS. Rather, they were located in strong LD with the SNPs that were genotyped: rs4766642 is in strong LD with the genotyped SNP rs10850830 (r2 = 0.95; pGWAS = 9.17×10⁻⁴), while rs2861405 is in strong LD with the genotyped SNPs rs4804202 (r2 = 1.00; pGWAS = 2.63×10⁻⁴) and rs8107642 (r2 = 0.91; pGWAS = 1.89×10⁻⁴). Because these two SNPs, rs4766642 and rs2861405, are both eSNPs and tSNPs, they provided candidates for future investigation.
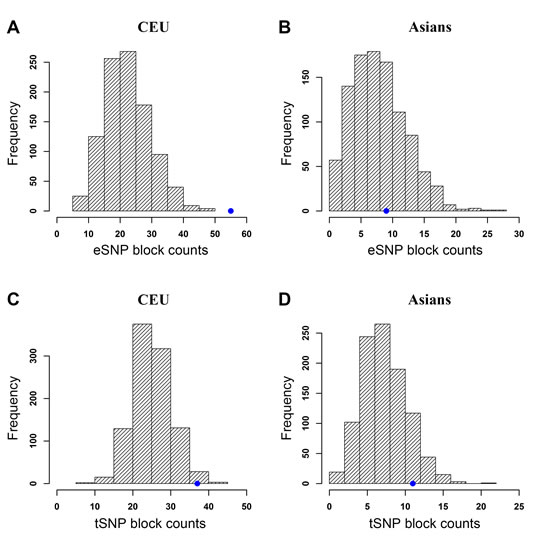
Figure 4: Enrichment analysis of cancer-associated SNPs with cis-expression quantitative trait loci (eQTLs) and transcription factor binding sites (TFBSs) of RegulomeDB Category 2 (C2) using a randomization test. The blue dot on each plot indicates the observed number of eSNP/tSNP blocks. Note that the scales of those plots are different. Distributions of eSNP/tSNP blocks considering LD SNPs are shown in (A) CEU, cis-eQTL, (B) Asians, cis-eQTL, (C) CEU, C2, and (D) Asians, C2.
Discussion
We performed a comprehensive investigation of top PrCa-associated SNPs for their potential roles in regulating gene expression through eQTL and/or TFBS. We attempted to study the regulatory roles for two types of association data: moderately significant SNPs that were associated with PrCa and cancer-associated SNPs from the GWAS Catalog that reached the genome-wide significance level. To our knowledge, this is the first investigation of the enrichment of associated SNPs with eQTLs and TFBS in prostate cancer in different populations.
Our results not only revealed the potential regulatory mechanisms of the top PrCa-associated SNPs, but also highlighted two candidate SNPs that might play important roles in the disease. Notably, in the original CGEMS study [21], no SNP was able to reach the genome-wide significance level (p < 5×10⁻⁸). Through the examination of both eQTL and TFBS data, we identified two regulatory SNPs, rs2861405 and rs4766642, which were not directly genotyped in the GWAS data yet were shown in strong LD with the top associated SNPs. Both of the target genes that were regulated by these two SNPs have been previously reported involving in PrCa, thus, at least to some extent, proving the integrative analysis of eQTL and TFBS might increase the ability to detect true association signals in prostate cancer and other complex diseases. Specifically, ZNF791, whose expression is regulated by rs2861405 through eQTL, encodes a member of the zinc finger protein family that have been reported as associated with prostate cancer at gene expression and protein levels [23, 24]. SNP rs2861405 is located at the TFBS of CREBBP, a gene often considered to be a PrCa biomarker [25, 26]. This gene plays critical roles in the prostate cancer pathway (KEGG ID: has05215) [27]. The other SNP, rs4766642, reportedly regulates the expression of GLTP through eQTL in prostate cancer cells, which could have an important contribution to the regulation of endothelial cell mobility [28]. Moreover, these two SNPs were also mapped in the DNase hypersensitive site of the ENCODE prostate cancer cell line, LNCaP, further supporting their roles in regulating gene expression [19, 20].
This study raised several methodology issues that may complicate the analysis of disease-associated SNPs with eQTL/TFBS data and, thus, provided a reference for similar analyses in future work. First, due to LD structures, the widely used randomization test may result in false negative findings when the enrichment is not strong. Alternatively, the permutation test is robust, but it also requires genotype data and is computationally intensive. Second, the incorporation of LD structure information is important for the discovery of regulatory patterns, especially when the GWA studies and the eQTL studies are conducted on different array platforms. For example, in our study, we observed 26 more eSNP blocks after considering LD SNPs (Supplementary Table 2). Third, a number of confounding factors may influence the comparison of GWAS data with eQTL data, including tissue specificity and population structure (Table 2).
This study has the following limitations, which could be improved in future investigations. First, there has been no eQTL data profiled in prostate tissue; the eQTL data currently available is mainly from LCL, brain, and liver tissues. Our observations were based on LCL eQTL data, the closest tissue we could find for prostate cancer. Prostate tissue-specific eQTL data will likely be generated in the near future, such as from the Genotype-Tissue Expression (GTEx) project. Future studies that utilize the genetic information from disease-specific (i.e., prostate tissue) will make the conclusions solid. Second, the lack of significance in the AA or JPT population in this study is inconclusive and requires replication in future work, as the existing prostate cancer GWAS data and eQTL/TFBS data is currently limited. For example, the amount of eQTL data available for the AA population (# eQTLs = 13,995) is only ~33.1% of that in the CEU population (# eQTLs = 42,301), which reduced the reliability of our observations in the AA data. Notably, the samples used for detection of eQTL in AA were comparable to those in CEU, indicating that AA samples tend to have fewer eQTLs regardless of sample size [33]. As for the JPT population, though the eQTL data is sufficient for our analysis, the sample size in the MEC-JPT GWAS dataset was only 392 (158 cases and 234 controls), which may not have sufficient power to detect PrCa-associated SNPs in the JPT population. Third, the genotyping platforms used in eQTL studies and in GWA studies are often different, which introduces difficulties in forming direct comparisons between eSNPs and disease-associated SNPs. In our work, we employed the LD expansion strategy while, ideally, imputation should be a robust way to eliminate inconsistency among platforms. Due to the heavy computational load, we did not perform imputation on the GWAS data but will include it in our future work.
In summary, we conducted comprehensive enrichment analyses of the top associated SNPs in eQTLs and TFBSs in three populations (CEU, AA, and JPT) from two PrCa GWAS datasets, CGEMS and MEC. Our results supported the hypothesis that prostate cancer risk SNPs in the CEU population may act through cis-regulators in the expression of their target genes, which has not been observed in the AA or JPT population yet. Our preliminary work also revealed that the pattern might be specific to eQTL data in the matched disease-relevant tissue and population. We identified two promising regulartory SNPs (rs2861405 and rs4766642) in PrCa. Our work provides insights and guidance, both biologically and methodologically, for future investigations of the regulatory system of prostate cancer and other complex diseases.
Material and Methods
Genotype datasets
The CGEMS prostate cancer GWAS [21] dataset was generated using Illumina HumanHap300 (Phase 1A) and Illumina HumanHap240 (Phase 1B) arrays, resulting in approximately 550,000 SNPs for 1172 prostate cancer patients and 1157 controls of European ancestry from the Prostate, Lung, Colon and Ovarian (PLCO) Cancer Screening Trial. Data was downloaded from the National Center for Biotechnology Information (NCBI) dbGaP with approved access (request: # 5662-1). Following our previous study [29], we obtained a total of 506,216 SNPs from 2243 samples, and denoted the data hereafter as CGEMS-CEU.
The MEC GWAS were conducted by genotyping using the Illumina Human1M_Duov3_B array or the Human660W_Quad_v1_A array. The samples were collected in men of AA, JPT, and Latino (LTN) populations [22]. We only used samples from AA and JPT, and denoted them as MEC-AA and MEC-JPT, since eQTL data has been very limited so far for the LTN population. For AA samples, we collected 996,050 SNPs genotyped in 1371 cases and 1313 controls using Illumina Human1M_Duov3_B. For JPT samples, we collected 458,616 SNPs genotyped in 158 cases and 234 controls using Human660W_Quad_v1_A. The association test was conducted following the previous study [22].
The schizophrenia GWAS dataset was from the International Schizophrenia Consortium (ISC). We denoted the data hereafter as ISC-CEU. A detailed description can be found in previous studies [30, 31].
HapMap genotype data (release 27, including samples from phase I, II, and III) were downloaded from the HapMap website [32]. The LD data of HapMap samples was downloaded for the CEU, AA, and JPT, respectively.
eQTL and TFBS datasets
We utilized human eQTL association data from a recently developed public database, seeQTL [33], which collected 9 unrelated HapMap studies of lymphoblastoid cell lines [6, 7, 9-11, 34, 35], human cortical samples [5], and monocytes [36]. In the seeQTL database, eQTL data from these previous studies was collected and re-analyzed using a combination of quality control, population stratification, and false discovery rate (FDR) assessement to generate cis- and trans-eQTLs. In our analysis, as shown in Supplementary Table 1, we used the LCL and brain eQTL data by significance (q-value) < 0.2 (default). Here, q-values were obtained by adjusting regression p-values using the Bejaminin-Hochberg correction method [37], as described in [33]. We also incorporated liver eQTL data reported by Innocenti et al. [38], which was retrieved from the eQTL Browser database (http://eqtl.uchicago.edu/help.html).
RegulomeDB [20] is a comprehensive resource for regulatory variants in the human genome, primarily based on the ENCODE data [19], and other resources, such as ChIP-seq data from the NCBI Sequence Read Archive (SRA) and eQTL data from recent publications. Of note, the data collected by RegulomeDB is not specifically distinguished by population or tissue type. RegulomeDB has six categories of functional SNPs with systematic ranking scores. SNPs in C1 mainly contain eQTL and binding affinity signals, with 6 subcategories from 1a to 1f that further classify SNPs by decreasing confidence. SNPs in C2 are annotated as “likely to affect binding.” The other four categories (categories 4-6) represent weak or minimal binding evidence for the functional SNPs [20]. Correspondingly, we only considered category 1 (C1) and category 2 (C2) in our analysis for the enrichment test, which is shown in Supplementary Table 1.
Enrichment tests and evaluation
Due to the lack of significantly associated SNPs surpassing genome-wide significance (p < 5×10⁻⁸) in either of the two original GWAS datasets, we denoted the top PrCa-associated SNPs as those with moderate significance (e.g., p < 10-3) [15]. In this study, we applied two statistical approaches, the randomization and the permutation tests, to build the null distribution of simulated SNPs at random cases for an enrichment test of eQTLs and/or TFBSs. Throughout this work, all enrichment tests were performed in a population-specific way, e.g., significant GWAS SNPs obtained in the CEU population were tested in the corresponding CEU eQTL or TFBS data, unless otherwise specified.
Following the work as described in Nicolae et al. [12], we classified the SNPs to the 10 MAF bins, which were constructed with an interval of 5%, i.e., 0-5%, 5-10%, …, 45-50%. We generated 1000 random SNP sets, in which the same number of disease-associated SNPs with the same distribution of MAF bins as in the actual GWAS dataset was randomly sampled from all the SNPs genotyped on the GWAS platform without replacement. These random SNPs were then mapped to SNPs of eQTLs or located at the TFBSs (hereafter denoted as eSNPs and tSNPs, respectively) to form a null distribution to assess the significance.
Although the randomization test has been widely applied in many diseases [13, 15, 16], one recognized disadvantage is the ignorance of LD structures among SNPs, which may complicate the results and lead to false negative findings in practical cases. In contrast, in a randomization test, the randomly selected SNPs from the genome are more likely to be independent because the randomization process essentially disregards the LD structure. Due to this potential bias, we proposed counting the number of LD blocks instead of using the raw number of eSNPs to estimate the significance level. We define an LD block as a cluster of SNPs that are located in a genomic region in which any two of the SNPs have r2 ≥ 0.5, where r2 is the squared LD correlation coefficient. We used PLINK [39] to calculate the independent blocks of eSNPs and tSNPs. Accordingly, the empirical p value of the randomization test is defined as ![]() , where Φ denotes a randomization dataset.
, where Φ denotes a randomization dataset.
Alternatively, the permutation test generates random datasets by randomly swapping cases and controls while keeping the same number of cases and controls in the population. In this way, the LD structure within individuals remains intact. We generated 1000 sets of phenotype files and conducted an association test using the same statistical strategy [29]. The top associated SNPs in each permutation dataset is similarly defined using the same threshold (e.g., p < 10-3), and the number of blocks is recorded to compute an empirical p value: ![]() , where π denotes a permutation dataset.
, where π denotes a permutation dataset.
For both the randomization and permutation tests, we further extracted “LD SNPs,” which were defined as those with r2 ≥ 0.5 to any of the top disease-associated SNPs according to the LD data derived from the HapMap samples of the same population. Then, we applied a similar approach as described above to calculate the significance level.
As a replication, we examined all the top cancer-associated SNPs deposited in the NHGRI GWAS Catalog [4]. Here, we denoted the top cancer-associated SNPs as those surpassing the genome-wide significance level (p < 10-5) [12]. To collect cancer-associated SNPs, we manually extracted the SNPs deposited in the GWAS Catalog specifically for the European and Asian populations (samples in the AA population were neglected because only two GWA studies were reported) (as of December 4, 2012, http://www.genome.gov/gwastudies/). Since the raw genotype data of these GWA studies are mostly unavailable, we only performed a randomization test. We followed the same procedure as described above; however, we used the combined SNPs from Affymetrix Genome-Wide Human SNP Array 6.0 and Illumina’s High Density Human 1M-Duo as the genotyped SNPs on the GWAS platforms. Cancer-associated SNPs that did not have MAF information in the combined platform were excluded.
Acknowledgments
We thank Dr. Chunyu Liu for valuable suggestions. The genotyping dataset(s) used for the analyses described in this manuscript were obtained from the database of Genotype and Phenotype (dbGaP) found at http://www.ncbi.nlm.nih.gov/gap through dbGaP accession number [phs000207.v1.p1.c1] (data access request #5662-1). The content is solely the responsibility of the authors and does not necessarily represent the official views of the National Institutes of Health. This work was partially supported by National Institutes of Health grants (R01LM011177, R03DE022093, R21HG006037, P50CA095103, P50CA098131, and P30CA068485), Ingram Professorship Funds (to Z.Z.), National Alliance for Research on Schizophrenia and Depression (NARSAD) (to P.J.), and The Robert J. Kleberg, Jr. and Helen C. Kleberg Foundation (to Z.Z.). We gratefully acknowledge the financial support from the National Natural Science Foundation of China grants (91230117 and 31170795) and the program of China Scholarship Council (No. 201206920018).
Statement of author contributions
JJ and PJ contribute equally to the work. JJ and PJ performed the analyses. JJ and PJ prepared all the figures and tables. JJ, PJ, ZZ, and BS wrote the main manuscript. All authors reviewered the manuscript.
Disclosure
None of the authors declare conflicts of interest.
REFERENCES
1. Siegel R, Ward E, Brawley O and Jemal A. Cancer statistics, 2011: the impact of eliminating socioeconomic and racial disparities on premature cancer deaths. CA Cancer J Clin. 2011; 61(4):212-236.
2. Page WF, Braun MM, Partin AW, Caporaso N and Walsh P. Heredity and prostate cancer: a study of World War II veteran twins. Prostate. 1997; 33(4):240-245.
3. Lichtenstein P, Holm NV, Verkasalo PK, Iliadou A, Kaprio J, Koskenvuo M, Pukkala E, Skytthe A and Hemminki K. Environmental and heritable factors in the causation of cancer--analyses of cohorts of twins from Sweden, Denmark, and Finland. N Engl J Med. 2000; 343(2):78-85.
4. Hindorff LA, Sethupathy P, Junkins HA, Ramos EM, Mehta JP, Collins FS and Manolio TA. Potential etiologic and functional implications of genome-wide association loci for human diseases and traits. Proc Natl Acad Sci U S A. 2009; 106(23):9362-9367.
5. Myers AJ, Gibbs JR, Webster JA, Rohrer K, Zhao A, Marlowe L, Kaleem M, Leung D, Bryden L, Nath P, Zismann VL, Joshipura K, Huentelman MJ, Hu-Lince D, Coon KD, Craig DW, et al. A survey of genetic human cortical gene expression. Nat Genet. 2007; 39(12):1494-1499.
6. Spielman RS, Bastone LA, Burdick JT, Morley M, Ewens WJ and Cheung VG. Common genetic variants account for differences in gene expression among ethnic groups. Nat Genet. 2007; 39(2):226-231.
7. Stranger BE, Nica AC, Forrest MS, Dimas A, Bird CP, Beazley C, Ingle CE, Dunning M, Flicek P, Koller D, Montgomery S, Tavare S, Deloukas P and Dermitzakis ET. Population genomics of human gene expression. Nat Genet. 2007; 39(10):1217-1224.
8. Schadt EE, Molony C, Chudin E, Hao K, Yang X, Lum PY, Kasarskis A, Zhang B, Wang S, Suver C, Zhu J, Millstein J, Sieberts S, Lamb J, GuhaThakurta D, Derry J, et al. Mapping the genetic architecture of gene expression in human liver. PLoS Biol. 2008; 6(5):e107.
9. Dimas AS, Deutsch S, Stranger BE, Montgomery SB, Borel C, Attar-Cohen H, Ingle C, Beazley C, Gutierrez Arcelus M, Sekowska M, Gagnebin M, Nisbett J, Deloukas P, Dermitzakis ET and Antonarakis SE. Common regulatory variation impacts gene expression in a cell type-dependent manner. Science. 2009; 325(5945):1246-1250.
10. Montgomery SB, Sammeth M, Gutierrez-Arcelus M, Lach RP, Ingle C, Nisbett J, Guigo R and Dermitzakis ET. Transcriptome genetics using second generation sequencing in a Caucasian population. Nature. 2010; 464(7289):773-777.
11. Pickrell JK, Marioni JC, Pai AA, Degner JF, Engelhardt BE, Nkadori E, Veyrieras JB, Stephens M, Gilad Y and Pritchard JK. Understanding mechanisms underlying human gene expression variation with RNA sequencing. Nature. 2010; 464(7289):768-772.
12. Nicolae DL, Gamazon E, Zhang W, Duan S, Dolan ME and Cox NJ. Trait-associated SNPs are more likely to be eQTLs: annotation to enhance discovery from GWAS. PLoS Genet. 2010; 6(4):e1000888.
13. Richards AL, Jones L, Moskvina V, Kirov G, Gejman PV, Levinson DF, Sanders AR, Purcell S, Visscher PM, Craddock N, Owen MJ, Holmans P and O’Donovan MC. Schizophrenia susceptibility alleles are enriched for alleles that affect gene expression in adult human brain. Mol Psychiatry. 2012; 17(2):193-201.
14. Bacanu SA, Chen J, Sun J, Richardson K, Lai CQ, Zhao Z, O’Donovan MC, Kendler KS and Chen X. Functional SNPs are enriched for schizophrenia association signals. Mol Psychiatry. 2013:1-2.
15. Gamazon ER, Badner JA, Cheng L, Zhang C, Zhang D, Cox NJ, Gershon ES, Kelsoe JR, Greenwood TA, Nievergelt CM, Chen C, McKinney R, Shilling PD, Schork NJ, Smith EN, Bloss CS, et al. Enrichment of cis-regulatory gene expression SNPs and methylation quantitative trait loci among bipolar disorder susceptibility variants. Mol Psychiatry. 2013; 18(3):340-346.
16. Scharf JM, Yu D, Mathews CA, Neale BM, Stewart SE, Fagerness JA, Evans P, Gamazon E, Edlund CK, Service SK, Tikhomirov A, Osiecki L, Illmann C, Pluzhnikov A, Konkashbaev A, Davis LK, et al. Genome-wide association study of Tourette’s syndrome. Mol Psychiatry. 2013; 18(6):721-728.
17. Stewart SE, Yu D, Scharf JM, Neale BM, Fagerness JA, Mathews CA, Arnold PD, Evans PD, Gamazon ER, Davis LK, Osiecki L, McGrath L, Haddad S, Crane J, Hezel D, Illman C, et al. Genome-wide association study of obsessive-compulsive disorder. Mol Psychiatry. 2013; 18(7):788-798.
18. Davis LK, Gamazon ER, Kistner-Griffin E, Badner JA, Liu C, Cook EH, Sutcliffe JS and Cox NJ. Loci nominally associated with autism from genome-wide analysis show enrichment of brain expression quantitative trait loci but not lymphoblastoid cell line expression quantitative trait loci. Mol Autism. 2012; 3(1):3.
19. ENCODE Project Consortium. A user’s guide to the encyclopedia of DNA elements (ENCODE). PLoS Biol. 2011; 9(4):e1001046.
20. Boyle AP, Hong EL, Hariharan M, Cheng Y, Schaub MA, Kasowski M, Karczewski KJ, Park J, Hitz BC, Weng S, Cherry JM and Snyder M. Annotation of functional variation in personal genomes using RegulomeDB. Genome Res. 2012; 22(9):1790-1797.
21. Yeager M, Orr N, Hayes RB, Jacobs KB, Kraft P, Wacholder S, Minichiello MJ, Fearnhead P, Yu K, Chatterjee N, Wang Z, Welch R, Staats BJ, Calle EE, Feigelson HS, Thun MJ, et al. Genome-wide association study of prostate cancer identifies a second risk locus at 8q24. Nat Genet. 2007; 39(5):645-649.
22. Haiman CA, Patterson N, Freedman ML, Myers SR, Pike MC, Waliszewska A, Neubauer J, Tandon A, Schirmer C, McDonald GJ, Greenway SC, Stram DO, Le Marchand L, Kolonel LN, Frasco M, Wong D, et al. Multiple regions within 8q24 independently affect risk for prostate cancer. Nat Genet. 2007; 39(5):638-644.
23. Chang GT, Steenbeek M, Schippers E, Blok LJ, van Weerden WM, van Alewijk DC, Eussen BH, van Steenbrugge GJ and Brinkmann AO. Characterization of a zinc-finger protein and its association with apoptosis in prostate cancer cells. J Natl Cancer Inst. 2000; 92(17):1414-1421.
24. Vanaja DK, Cheville JC, Iturria SJ and Young CY. Transcriptional silencing of zinc finger protein 185 identified by expression profiling is associated with prostate cancer progression. Cancer Res. 2003; 63(14):3877-3882.
25. Majid S, Kikuno N, Nelles J, Noonan E, Tanaka Y, Kawamoto K, Hirata H, Li LC, Zhao H, Okino ST, Place RF, Pookot D and Dahiya R. Genistein induces the p21WAF1/CIP1 and p16INK4a tumor suppressor genes in prostate cancer cells by epigenetic mechanisms involving active chromatin modification. Cancer Res. 2008; 68(8):2736-2744.
26. Heemers HV, Regan KM, Schmidt LJ, Anderson SK, Ballman KV and Tindall DJ. Androgen modulation of coregulator expression in prostate cancer cells. Mol Endocrinol. 2009; 23(4):572-583.
27. Kanehisa M, Goto S, Sato Y, Furumichi M and Tanabe M. KEGG for integration and interpretation of large-scale molecular data sets. Nucleic Acids Res. 2012; 40(Database issue):D109-114.
28. Burger MJ, Tebay MA, Keith PA, Samaratunga HM, Clements J, Lavin MF and Gardiner RA. Expression analysis of delta-catenin and prostate-specific membrane antigen: their potential as diagnostic markers for prostate cancer. Int J Cancer. 2002; 100(2):228-237.
29. Jia P, Liu Y and Zhao Z. Integrative pathway analysis of genome-wide association studies and gene expression data in prostate cancer. BMC Syst Biol. 2012; 6 Suppl 3:S13.
30. Purcell SM, Wray NR, Stone JL, Visscher PM, O’Donovan MC, Sullivan PF and Sklar P. Common polygenic variation contributes to risk of schizophrenia and bipolar disorder. Nature. 2009; 460(7256):748-752.
31. Jia P, Wang L, Fanous AH, Chen X, Kendler KS and Zhao Z. A bias-reducing pathway enrichment analysis of genome-wide association data confirmed association of the MHC region with schizophrenia. J Med Genet. 2012; 49(2):96-103.
32. The International HapMap Consortium. The International HapMap Project. Nature. 2003; 426(6968):789-796.
33. Xia K, Shabalin AA, Huang S, Madar V, Zhou YH, Wang W, Zou F, Sun W, Sullivan PF and Wright FA. seeQTL: a searchable database for human eQTLs. Bioinformatics. 2012; 28(3):451-452.
34. Choy E, Yelensky R, Bonakdar S, Plenge RM, Saxena R, De Jager PL, Shaw SY, Wolfish CS, Slavik JM, Cotsapas C, Rivas M, Dermitzakis ET, Cahir-McFarland E, Kieff E, Hafler D, Daly MJ, et al. Genetic analysis of human traits in vitro: drug response and gene expression in lymphoblastoid cell lines. PLoS Genet. 2008; 4(11):e1000287.
35. Price AL, Patterson N, Hancks DC, Myers S, Reich D, Cheung VG and Spielman RS. Effects of cis and trans genetic ancestry on gene expression in African Americans. PLoS Genet. 2008; 4(12):e1000294.
36. Zeller T, Wild P, Szymczak S, Rotival M, Schillert A, Castagne R, Maouche S, Germain M, Lackner K, Rossmann H, Eleftheriadis M, Sinning CR, Schnabel RB, Lubos E, Mennerich D, Rust W, et al. Genetics and beyond--the transcriptome of human monocytes and disease susceptibility. PLoS One. 2010; 5(5):e10693.
37. Benjamini Y and Hochberg Y. Controlling the false discovery rate: a practical and powerful approach to multiple testing. J Roy Statist Soc Ser B (Methodological) 1995; 57:289-300.
38. Innocenti F, Cooper GM, Stanaway IB, Gamazon ER, Smith JD, Mirkov S, Ramirez J, Liu W, Lin YS, Moloney C, Aldred SF, Trinklein ND, Schuetz E, Nickerson DA, Thummel KE, Rieder MJ, et al. Identification, replication, and functional fine-mapping of expression quantitative trait loci in primary human liver tissue. PLoS Genet. 2011; 7(5):e1002078.
39. Purcell S, Neale B, Todd-Brown K, Thomas L, Ferreira MA, Bender D, Maller J, Sklar P, de Bakker PI, Daly MJ and Sham PC. PLINK: a tool set for whole-genome association and population-based linkage analyses. Am J Hum Genet. 2007; 81(3):559-575.