
INTRODUCTION
At present, Hodgkin lymphoma (HL) is a treatable malignancy for most patients. In economically developed countries, HL presents a bimodal incidence curve with peaks at both 15-30 years of age and over 55 years of age [1]. A 2017 report indicates that in the United States, approximately 8,260 people were diagnosed with HL, with an estimated 1,070 reported deaths from the disease [2]. The 2008 WHO classification criteria recognize two histologic types of HL: “nodular lymphocyte predominant”, which accounts for 5% of cases, and “classic” HL (CHL), which accounts for about 95% of cases. The latter type consists of four subtypes: “lymphocyte-rich”, “mixed cellularity”, “lymphocyte depletion”, and “nodular sclerosis” [3].
In recent years, significant progress has been made in the treatment of patients with HL, and more than 80% of patients have been cured by front-line therapy [4–6]. However, along with the significant increases in the cure rate of HL, there have also been increases in treatment-related long-term toxicities, especially for patients diagnosed with early and medium-stage disease. Conversely, patients with refractory or relapsed disease still have a poor prognosis [7]. Therefore, an accurate prognostic model for predicting survival is needed to reduce over-treatment in low-risk patients, and to guide treatment selection for high-risk patients.
To date, studies have reported that many clinical, histopathological, and laboratory parameters are prognostic factors in this disease [8–10]. HL is commonly staged using the Ann Arbor system. The staging system depends on the region of the malignant tissue and the systemic symptoms of the lymphoma, and it has approximately the same clinical role as the TNM staging of solid tumors [11, 12]. Based on the presence of adverse disease factors, HL patients can be divided into three groups: favorable early stage (stage I-II with no adverse factors), unfavorable early stage (stage I-II with any of the adverse factors), and advanced stage (stage III-IV). Adverse factors include B symptoms, enlarged mediastinal lymph nodes, extranodal involvement, and higher erythrocyte sedimentation rates [13–15]. The most widely used clinical indicator of risk in HL is the International Prognostic Score (IPS), which is based on the number of unfavorable prognostic factors that are present, such as age ≥ 45 years, male gender, Ann Arbor stage IV, serum albumin < 4 g/dL, hemoglobin < 10.5 g/dL, white blood cell count ≥ 15,000/mm3, and lymphocyte count < 600/mm3 [16]. However, the IPS is only beneficial for providing guidance about the clinical strategies and prognosis of stage III-IV patients. In addition, these prognostic systems do not take into consideration the histopathological parameters, which could affect survival rates. Neglecting histopathological parameters or other prognostically significant features may reduce the accuracy of survival predictions. Therefore, an improved prognostic evaluation system that includes histopathology and host status is needed in clinical practice.
A nomogram is a graphical representation of a mathematical model, in which information on several characteristics is combined to predict a specific endpoint. A convenient graphical representation in the form of a nomogram allows predictions to be obtained easily and quickly in practice [17]. By integrating various important factors, a nomogram can provide individualized estimates of the probability of an event, such as a patient’s individual probability of disease recurrence or death. Therefore, the nomogram has become a reliable tool for predicting the clinical outcomes of many types of cancer [18–21].
However, the published literature does not include any nomogram that uses available prognostic factors to predict survival outcomes in patients with CHL. In this study, patient records from the Surveillance, Epidemiology, and End Results (SEER) cancer registries were used to identify risk factors associated with the overall survival (OS) and cancer-specific survival (CSS) of CHL patients. The SEER data were used to establish nomograms that allow graphic-based predictions of the prognosis of these patients.
RESULTS
Clinicopathologic characteristics of the patients
A total of 46,602 CHL patients were identified in the SEER database for this study. Of these, 3272 patients were excluded because of missing data, leaving 43,330 patients for inclusion in our analyses. Patients were randomly divided into a training cohort (n = 30,339) and a validation cohort (n = 12,991). The clinicopathologic characteristics of patients available from the SEER database in the training and validation cohorts are summarized in Table 1. There were no substantive differences between the two cohorts.
Table 1: Characteristics of the training and validation cohorts
Characteristic |
Training cohort |
Validation cohort |
||
|---|---|---|---|---|
No. |
% |
No. |
% |
|
Age at diagnosis, years |
||||
Median ± SD |
36 ± 20.0 |
36 ± 20.1 |
||
Range |
2 - 99 |
1 - 98 |
||
Gender |
||||
Male |
16478 |
54.3 |
7044 |
54.2 |
Female |
13861 |
45.7 |
5947 |
45.8 |
Race |
||||
White |
25518 |
84.1 |
10951 |
84.3 |
Black |
3205 |
10.6 |
1382 |
10.6 |
Othersa |
1616 |
5.3 |
658 |
5.1 |
Ann Arbor stage |
||||
Stage I/II |
18054 |
59.5 |
7734 |
59.5 |
Stage III/IV |
12285 |
40.5 |
5257 |
40.5 |
Histological type |
||||
LR |
1048 |
3.5 |
443 |
3.4 |
MC |
4536 |
15.0 |
1924 |
14.8 |
LD |
471 |
1.5 |
209 |
1.6 |
NS |
18565 |
61.2 |
7924 |
61.0 |
NOS |
5719 |
18.8 |
2491 |
19.2 |
aOthers includes American Indian/Alaskan Native and Asian/Pacific Islander.
Abbreviations: SD, standard deviation; LR, lymphocyte-rich; MC, mixed cellularity; LD, lymphocyte-depleted; NS, nodular sclerosis; NOS, not otherwise specified.
OS and CSS in the training cohort
The median OS was 83 months (range, 1 to 383 months), and the 1-, 5-, and 10-year OS rates were 89.7%, 79.8%, and 72.3%, respectively. The median CSS was 80 months (range, 1 to 383 months), and the 1-, 5-, and 10-year CSS rates were 93.5%, 86.6%, and 83.3%, respectively.
Independent prognostic factors in the training cohort
In the training cohort, 30,339 patients were included in univariate and multivariate analyses to determine predictors of OS and CSS. As shown in Figure 1 and Figure 2, age at diagnosis, gender, race, Ann Arbor stage, and histological type remarkably correlated with OS and CSS in univariate survival analyses using the Kaplan-Meier method, and were further compared using the log-rank test (p < 0.05). Cox proportional hazards regression modeling was used to further explore the influences of all variables. The multivariate analyses of OS and CSS showed elevated hazard ratios (HRs) for the following characteristics: older age, male gender, black race, stage III/IV, and the lymphocyte-depleted histological type (p < 0.05) (Table 2).
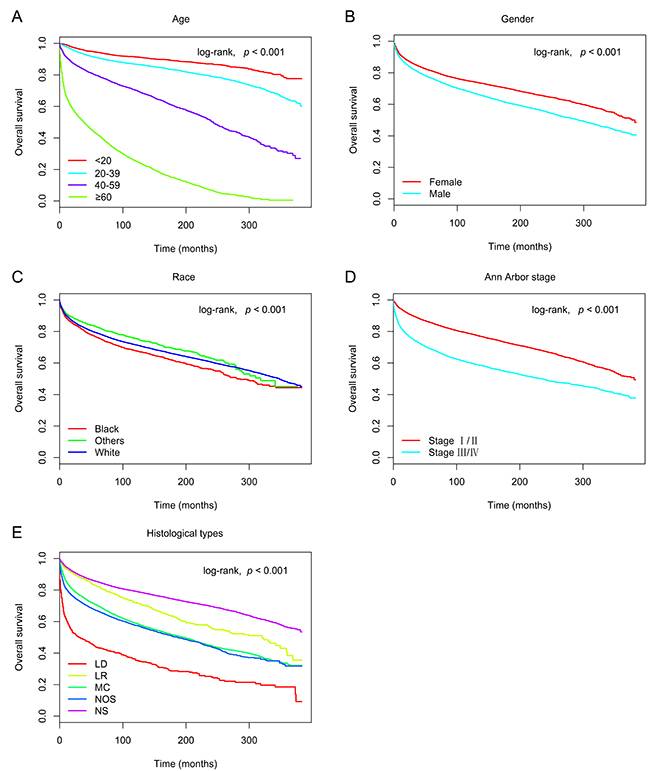
Figure 1: Kaplan-Meier survival curves for overall survival in the training cohort, as stratified by (A) age (log-rank, χ2 = 1.14E+04, p < 0.001), (B) gender (log-rank, χ2 = 2.08E+02, p < 0.001), (C) race (log-rank, χ2 = 3.24E+01, p < 0.001), (D) Ann Arbor stage (log-rank, χ2 = 1.37E+03, p < 0.001), and (E) histological type (log-rank, χ2 = 2.05E+03, p < 0.001). Abbreviations: LD, lymphocyte-depleted; LR, lymphocyte-rich; MC, mixed cellularity; NOS, not otherwise specified; NS, nodular sclerosis.
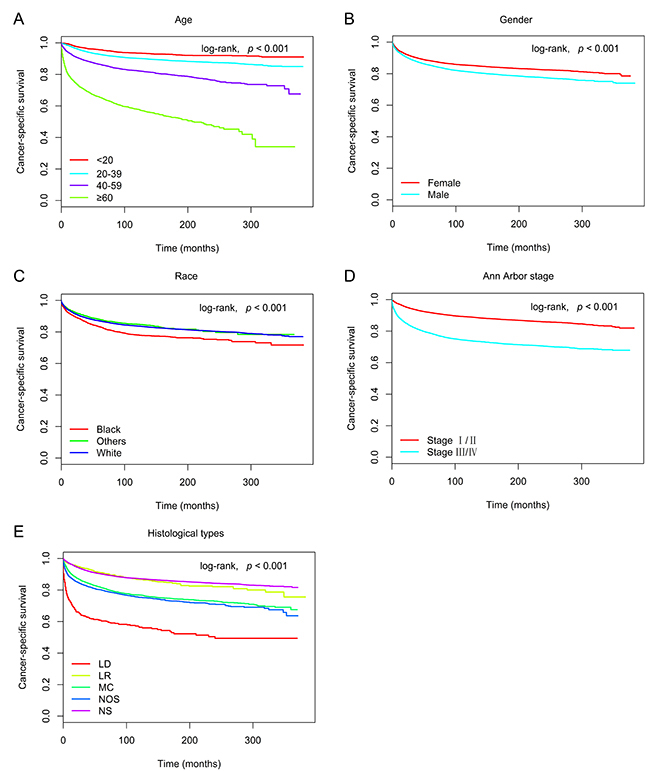
Figure 2: Kaplan-Meier survival curves for cancer-specific survival in the training cohort, as stratified by (A) age (log-rank, χ2 = 3.36E+03, p < 0.001), (B) gender (log-rank, χ2 = 7.98E+01, p < 0.001), (C) race (log-rank, χ2 = 5.24E+01, p < 0.001), (D) Ann Arbor stage (log-rank, χ2 = 1.00E+03, p < 0.001), and (E) histological type (log-rank, χ2 = 9.50E+02, p < 0.001). Abbreviations: LD, lymphocyte-depleted; LR, lymphocyte-rich; MC, mixed cellularity; NOS, not otherwise specified; NS, nodular sclerosis.
Table 2: Multivariate analysis of overall survival and cancer-specific survival in the training cohort
Variable |
OS |
CSS |
||||
|---|---|---|---|---|---|---|
HR |
95% CI |
P |
HR |
95% CI |
P |
|
Age at diagnosis, years |
||||||
< 20 |
ref |
ref |
||||
20-39 |
1.603 |
1.443 to 1.781 |
< 0.001 |
1.521 |
1.334 to 1.735 |
< 0.001 |
40-59 |
3.885 |
3.498 to 4.316 |
< 0.001 |
2.802 |
2.455 to 3.199 |
< 0.001 |
≥ 60 |
13.845 |
12.493 to 15.343 |
< 0.001 |
7.473 |
6.565 to 8.507 |
< 0.001 |
Gender |
||||||
Male |
1.259 |
1.205 to 1.316 |
< 0.001 |
1.191 |
1.121 to 1.264 |
< 0.001 |
Female |
ref |
ref |
||||
Race |
||||||
White |
ref |
ref |
||||
Black |
1.358 |
1.269 to 1.454 |
< 0.001 |
1.481 |
1.357 to 1.616 |
< 0.001 |
Othersa |
0.926 |
0.830 to 1.033 |
0.170 |
1.056 |
0.919 to 1.215 |
0.441 |
Ann Arbor stage |
||||||
Stage I/II |
ref |
ref |
||||
Stage III/IV |
1.705 |
1.632 to 1.781 |
< 0.001 |
2.058 |
1.937 to 2.187 |
< 0.001 |
Histological type |
||||||
LR |
ref |
ref |
||||
MC |
1.401 |
1.237 to 1.587 |
< 0.001 |
1.654 |
1.367 to 2.001 |
< 0.001 |
LD |
2.305 |
1.959 to 2.713 |
< 0.001 |
3.146 |
2.493 to 3.972 |
< 0.001 |
NS |
1.109 |
0.982 to 1.251 |
0.096 |
1.338 |
1.112 to 1.610 |
0.002 |
NOS |
1.535 |
1.355 to 1.739 |
< 0.001 |
1.814 |
1.501 to 2.192 |
< 0.001 |
aOthers includes American Indian/Alaskan Native and Asian/Pacific Islander.
Abbreviations: OS, overall survival; CSS, cancer-specific survival; HR, hazard ratio; CI, confidence interval; LR, lymphocyte-rich; MC, mixed cellularity; LD, lymphocyte-depleted; NS, nodular sclerosis; NOS, not otherwise specified; ref, reference.
Prognostic nomograms for OS and CSS
The prognostic nomograms included all the significant independent factors in Cox proportional hazards regression in the training cohort. The prognostic nomogram for 1-, 5-, and 10-year OS is shown in Figure 3A. The prognostic nomogram for 1-, 5-, and 10-year CSS is shown in Figure 3B. By adding up the scores associated with each variable, and projecting total scores to the bottom scale, probabilities can be estimated for 1-, 5-, and 10-year OS and CSS.
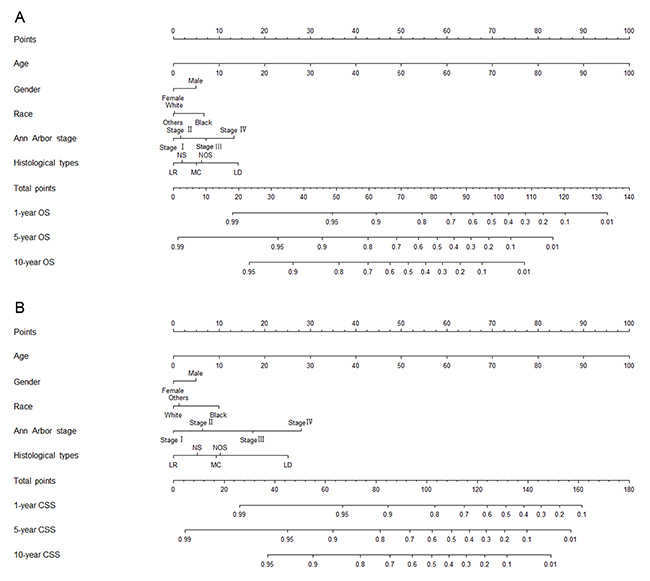
Figure 3: Nomograms for predicting the 1-, 5-, and 10-year (A) overall survival and (B) cancer-specific survival of classical Hodgkin lymphoma patients. Abbreviations: OS, overall survival; CSS, cancer-specific survival; LD, lymphocyte-depleted; LR, lymphocyte-rich; MC, mixed cellularity; NOS, not otherwise specified; NS, nodular sclerosis.
In general, both the OS and CSS rates were better for women, relatively younger patients, patients with Ann Arbor stage I/II disease, patients of non-black race, and patients with the lymphocyte-rich histological type of CHL. With the aid of nomograms, it was possible to effectively predict prognosis according to individual patient characteristics.
Validation of the nomograms
Validation of nomograms was performed using bootstrap analyses with 1000 resamples, processed both internally and externally. Analysis of the internal validation cohort (training cohort) showed C-index values of 0.794 (95% CI, 0.789-0.799) for nomogram predictions of OS and 0.760 (95% CI, 0.753-0.767) for nomogram predictions of CSS. Similarly, in the external validation cohort, the C-index values for predicting OS and CSS were 0.787 (95% CI, 0.779-0.795) and 0.769 (95% CI, 0.758-0.780), respectively (Table 3). These findings indicate that the nomogram models were reasonably accurate. The internal and external calibration curves demonstrated excellent agreement between predicted and observed values of 1-, 5-, and 10-year OS and CSS, in both the training and validation cohorts (Figure 4 and Figure 5).
Table 3: C-indexes for the nomogram to predict overall survival and cancer-specific survival
Group |
OS |
CSS |
||
|---|---|---|---|---|
C-index |
95% CI |
C-index |
95% CI |
|
Training cohort |
0.794 |
0.789 to 0.799 |
0.760 |
0.753 to 0.767 |
Validation cohort |
0.787 |
0.779 to 0.795 |
0.769 |
0.758 to 0.780 |
Abbreviations: OS, overall survival; CSS, cancer-specific survival; C-index, index of concordance; CI, confidence interval.
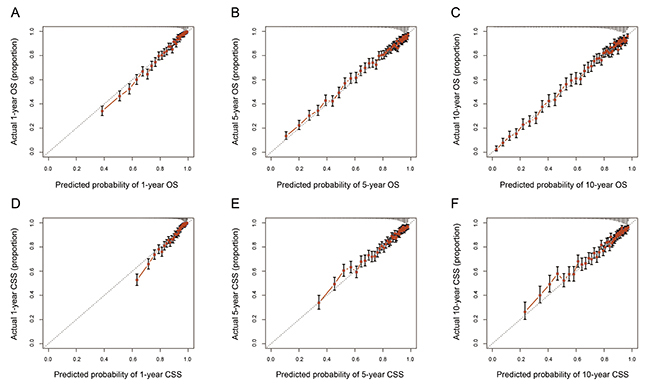
Figure 4: The calibration curves for predictions of overall survival (A-C) and cancer-specific survival (D-F) in the training cohort at 1, 5, and 10 years after diagnosis. The dashed line represents perfect agreement between the nomogram-predicted probability (x-axis) and the actual probability calculated from a Kaplan-Meier analysis (y-axis). A perfectly accurate nomogram prediction model would result in a plot where the actual and predicted probabilities, for the given groups, fall along the 45° line. The distance between the pairs and the 45° line is a measure of the absolute error of the nomogram’s prediction. Abbreviations: OS, overall survival; CSS, cancer-specific survival.
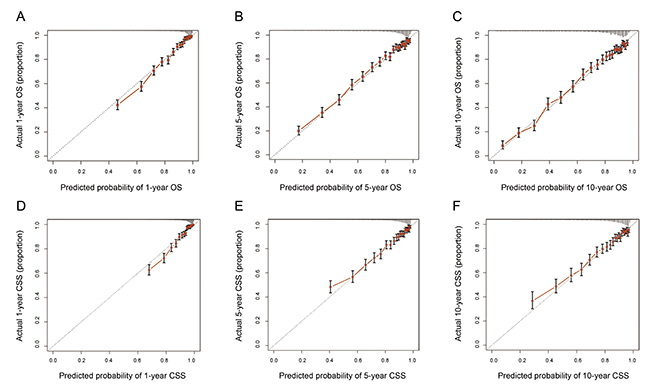
Figure 5: The calibration curves for predictions of overall survival (A-C) and cancer-specific survival (D-F) in the validation cohort at 1, 5, and 10 years after diagnosis. The dashed line represents perfect correspondence between the nomogram-predicted probability (x-axis) and the actual probability calculated from a Kaplan-Meier analysis (y-axis). A perfectly accurate nomogram prediction model would result in a plot where the actual and predicted probabilities, for the given groups, fall along the 45° line. The distance between the pairs and the 45° line is a measure of the absolute error of the nomogram’s prediction. Abbreviations: OS, overall survival; CSS, cancer-specific survival.
DISCUSSION
The nomogram is a graphic representation of a mathematical model that combines biological and clinical variables to determine the probabilities of clinical events. Nomograms are widely used in medicine. Some researchers have analyzed the survival outcomes of different tumors, using the SEER database. Compared to the current tumor staging system, the nomogram showed better prediction accuracy and prognostic value [22–25].
As the SEER program consists of 18 cancer registries, covering almost thousands of hospitals and nearly 30% of the country’s total population, the wide range of data included in our nomograms should allow the nomograms to be used widely for decision making in clinical practice.
Considering the relatively long-term survival potential of HL, deaths in patients with HL often occur because of non-HL causes. Thus, OS may not provide an accurate reflection of the long-term survival implications of HL. Therefore, taking other causes of death into consideration is necessary when estimating the CSS of HL.
In the present study, nomograms were developed based on 30,339 cases from the SEER database. The nomograms were used to predict the 1-, 5-, and 10-year OS and CSS rates of patients with CHL, based on five significant factors: age at diagnosis, gender, race, Ann Arbor stage, and histological type. The objective was to effectively and visually predict prognosis from specific patient characteristics. The discriminative performance of the nomograms was evaluated using an internal bootstrap resampling method. The C-index demonstrated the capacity of nomograms to predict the 1-, 5-, and 10-year OS and CSS rates of CHL patients.
As shown in the nomograms that we have presented, age at diagnosis had a strong prognostic association with OS and CSS. On an average, a 60-year old patient had 5-year OS and CSS rates reduced by 50% and 41%, as compared to a 30-year old patient who had the same exposure to other risk factors. Age has been demonstrated to be a significant predictive and prognostic factor in previous studies too [8, 26].
The different histological subtypes of HL are associated with significant biological and prognostic differences [27–30]. Therefore, in the present study, histological type was added to the prognostic factors that were included in nomograms. In the SEER data, nearly one in five patients had a histological type of “not otherwise specified” (NOS). Sally et al. suggested that an increase in the proportion of NOS in recent years is related to the prevalence of non-excisional biopsies, with an insufficiency of biopsy specimens for histologic diagnosis. Although NOS lacks a biological definition, it should be included as a subtype in HL research, since it is the second most common CHL category [31]. Therefore, our nomogram prognostic models included the NOS histological type.
As shown in the nomograms, histological type, which is not included in current staging systems, was an important predictive factor of OS and CSS. Therefore, we suggest the inclusion of histological type in future CHL prognostic evaluation systems.
This study has several limitations. First, as a retrospective study, it is subject to inherent, unavoidable biases. Thus, to confirm the results, large randomized controlled studies may be required. Second, data on important therapies, such as chemotherapy and radiation therapy, were not accessible in the SEER database. Finally, there are many other factors that may influence prognosis, such as B symptoms, extranodal involvement, and some molecular markers. The SEER cancer registry did not provide information about these factors, and these potential prognostic factors were therefore not included in the nomogram. Despite these limitations, the present study is the first to apply nomogram model to predict the survival of CHL patients.
The present study showed that age, gender, race, Ann Arbor stage, and histological types were independent risk factors for survival in patients with CHL. Nomograms were developed to accurately predict the 1-, 5-, and 10-year OS and CSS rates of these patients, based on patient-specific characteristics. These predictive tools could help clinicians identify high-risk patients and obtain more precise evaluations of patient survival.
MATERIALS AND METHODS
Data sourceData used in this study were retrieved from the SEER registry database of the National Cancer Institute. The SEER database is a collection of information about cancer incidence, prevalence, mortality, population-based variables, primary tumor characteristics, and treatment in 18 registries within the United States (http://seer.cancer.gov/).
Study population
Data for patients diagnosed between 1983 and 2014 were examined using SEER*Stat software (Version 8.3.2). Patients with CHL were included in this analysis. The following information was obtained for each patient: year of diagnosis, age at diagnosis, gender, race, Ann Arbor stage, histological type, survival information, and cause of death. Patients with missing data on any of these characteristics were excluded. A total of 43,330 CHL patients were randomized to two groups (training cohort, n = 30,339 and validation cohort, n = 12,991). Patients whose race was recorded as American Indian/Alaskan Native or Asian/Pacific Islander in SEER were assigned to an “others” race category for analysis.
Construction of the nomograms
A training cohort was used to establish nomograms. One of our primary endpoints of interest was OS, which was defined as the time from diagnosis to death from any cause. In the analysis of OS, patients who were alive at the last follow-up were counted as censored observations. The other primary endpoint of interest was CSS, which was defined as the time from diagnosis to death attributed to CHL. In the analysis of CSS, patients who died of other causes or were alive at the last follow-up were counted as censored observations.
The Kaplan-Meier method and Cox proportional hazards regression model were used to determine survival-related factors. The factors that were observed to have significant associations with survival in univariate or multivariate analyses (P < 0.05) were used to build the nomograms for OS and CSS.
Validation of the nomograms
Nomograms were subjected to 1000 bootstrap resamples for internal validation in the training cohort and external validation in the validation cohort, respectively. Marginal estimates and model-average prediction probabilities were used to create calibration curves. In a perfectly calibrated model, the predictions should fall on the diagonal 45° line of the calibration plot. Predictive performance was assessed using the C-index, which resembles the area under the curve (AUC), but appears to be better-suited for censored data [32]. Unlike the maximum value of the C-index of 0.5, which indicates a random chance to correctly discriminate outcome with the model, the maximum value of the C-index obtained was 1.0, indicating a perfect discrimination. A larger C-index indicates more accurate prognostic predictions [33].
Statistical analysis
The statistical analysis was performed using IBM SPSS statistics 22 software (SPSS Inc, Chicago, IL, USA) and R version 3.2.2 software (Institute for Statistics and Mathematics, Vienna, Austria; http://www.r-project.org/). The “rms” R library (cran.r-project.org/web/packages/rms) was used to construct survival models [34]. P values were two-sided and P < 0.05 was regarded as indicating statistical significance.
Ethical statement
According to the guidelines of the government of the United States, data released through the SEER database does not require informed patient consent.
Abbreviations
CHL, classical Hodgkin lymphoma; CI, confidence interval; CSS, cancer-specific survival; HL, Hodgkin lymphoma; HR, hazard ratio; IPS, International Prognostic Score; LD, lymphocyte-depleted; LR, lymphocyte-rich; MC, mixed cellularity; NOS, not otherwise specified; NS, nodular sclerosis; OS, overall survival; SEER, Surveillance, Epidemiology, and End Results.
Author contributions
Conception and design: Y.Z and H.B.Z.
Administrative support: H.B.Z.
Collection and assembly of data: Y.Z, J.Z, H.Z and X.H.Z.
Data analysis and interpretation: Y.Z.
Manuscript writing: All authors.
Final approval of manuscript: All authors.
CONFLICTS OF INTEREST
The authors declare no conflicts of interest.
REFERENCES
1. Hoppe RT, Advani RH, Ai WZ, Ambinder RF, Aoun P, Bello CM, Benitez CM, Bernat K, Bierman PJ, Blum KA, Chen R, Dabaja B, Forero A, et al. Hodgkin Lymphoma Version 1.2017, NCCN Clinical Practice Guidelines in Oncology. J Natl Compr Canc Netw. 2017; 15:608-38.
2. Siegel RL, Miller KD, Jemal A. Cancer Statistics, 2017. CA Cancer J Clin. 2017; 67:7-30.
3. Sabattini E, Bacci F, Sagramoso C, Pileri SA. WHO classification of tumours of haematopoietic and lymphoid tissues in 2008: an overview. Pathologica. 2010; 102:83-7.
4. Engert A, Haverkamp H, Kobe C, Markova J, Renner C, Ho A, Zijlstra J, Kral Z, Fuchs M, Hallek M, Kanz L, Dohner H, Dorken B, et al. Reduced-intensity chemotherapy and PET-guided radiotherapy in patients with advanced stage Hodgkin’s lymphoma (HD15 trial): a randomised, open-label, phase 3 non-inferiority trial. Lancet. 2012; 379:1791-9.
5. Gordon LI, Hong F, Fisher RI, Bartlett NL, Connors JM, Gascoyne RD, Wagner H, Stiff PJ, Cheson BD, Gospodarowicz M, Advani R, Kahl BS, Friedberg JW, et al. Randomized phase III trial of ABVD versus Stanford V with or without radiation therapy in locally extensive and advanced-stage Hodgkin lymphoma: an intergroup study coordinated by the Eastern Cooperative Oncology Group (E2496). J Clin Oncol. 2013; 31:684-91.
6. Viviani S, Zinzani PL, Rambaldi A, Brusamolino E, Levis A, Bonfante V, Vitolo U, Pulsoni A, Liberati AM, Specchia G, Valagussa P, Rossi A, Zaja F, et al. ABVD versus BEACOPP for Hodgkin’s lymphoma when high-dose salvage is planned. N Engl J Med. 2011; 365:203-12.
7. Arai S, Fanale M, DeVos S, Engert A, Illidge T, Borchmann P, Younes A, Morschhauser F, McMillan A, Horning SJ. Defining a Hodgkin lymphoma population for novel therapeutics after relapse from autologous hematopoietic cell transplant. Leuk Lymphoma. 2013; 54:2531-3.
8. Zander T, Wiedenmann S, Wolf J. Prognostic factors in Hodgkin’s lymphoma. Ann Oncol. 2002; 13:67-74.
9. Ferry JA, Linggood RM, Convery KM, Efird JT, Eliseo R, Harris NL. Hodgkin disease, nodular sclerosis type. Implications of histologic subclassification. Cancer. 1993; 71:457-63.
10. Steidl C, Lee T, Shah SP, Farinha P, Han G, Nayar T, Delaney A, Jones SJ, Iqbal J, Weisenburger DD, Bast MA, Rosenwald A, Muller-Hermelink HK, et al. Tumor-associated macrophages and survival in classic Hodgkin’s lymphoma. N Engl J Med. 2010; 362:875-85.
11. Carbone PP, Kaplan HS, Musshoff K, Smithers DW, Tubiana M. Report of the Committee on Hodgkin’s Disease Staging Classification. Cancer Res. 1971; 31:1860-1.
12. Cheson BD, Fisher RI, Barrington SF, Cavalli F, Schwartz LH, Zucca E, Lister TA. Recommendations for initial evaluation, staging, and response assessment of Hodgkin and non-Hodgkin lymphoma: the Lugano classification. J Clin Oncol. 2014; 32:3059-68.
13. Lister TA, Crowther D, Sutcliffe SB, Glatstein E, Canellos GP, Young RC, Rosenberg SA, Coltman CA, Tubiana M. Report of a committee convened to discuss the evaluation and staging of patients with Hodgkin’s disease: Cotswolds meeting. J Clin Oncol. 1989; 7:1630-6.
14. Henry-Amar M, Friedman S, Hayat M, Somers R, Meerwaldt JH, Carde P, Burgers JM, Thomas J, Monconduit M, Noordijk EM, Bron D, Regnier R, de Pauw BE, et al. Erythrocyte sedimentation rate predicts early relapse and survival in early-stage Hodgkin disease. The EORTC Lymphoma Cooperative Group. Ann Intern Med. 1991; 114:361-5.
15. Tubiana M, Henry-Amar M, Hayat M, Burgers M, Qasim M, Somers R, Sizoo W, Van der Schueren E. Prognostic significance of the number of involved areas in the early stages of Hodgkin’s disease. Cancer. 1984; 54:885-94.
16. Hasenclever D, Diehl V. A prognostic score for advanced Hodgkin’s disease. International Prognostic Factors Project on Advanced Hodgkin’s Disease. N Engl J Med. 1998; 339:1506-14.
17. Balachandran VP, Gonen M, Smith JJ, DeMatteo RP. Nomograms in oncology: more than meets the eye. Lancet Oncol. 2015; 16:e173-80.
18. Liang W, Zhang L, Jiang G, Wang Q, Liu L, Liu D, Wang Z, Zhu Z, Deng Q, Xiong X, Shao W, Shi X, He J. Development and validation of a nomogram for predicting survival in patients with resected non-small-cell lung cancer. J Clin Oncol. 2015; 33:861-9.
19. Shi X, Hu WP, Ji QH. Development of comprehensive nomograms for evaluating overall and cancer-specific survival of laryngeal squamous cell carcinoma patients treated with neck dissection. Oncotarget. 2017; 8:29722-40. https://doi.org/10.18632/oncotarget.15414.
20. Tang LQ, Li CF, Li J, Chen WH, Chen QY, Yuan LX, Lai XP, He Y, Xu YX, Hu DP, Wen SH, Peng YT, Zhang L, et al. Establishment and Validation of Prognostic Nomograms for Endemic Nasopharyngeal Carcinoma. J Natl Cancer Inst. 2016; 108.
21. Ayubi E, Safiri S. Nomogram predicting long-term survival after the diagnosis of intrahepatic recurrence of hepatocellular carcinoma following an initial liver resection: methodological issues. Int J Clin Oncol. 2017; 22:803-4.
22. Liu J, Su M, Hong S, Gao H, Zheng X, Wang S. Nomogram predicts survival benefit from preoperative radiotherapy for non-metastatic breast cancer: A SEER-based study. Oncotarget. 2017; 8:49861-68. https://doi.org/10.18632/oncotarget.17991.
23. Wang ZX, Qiu MZ, Jiang YM, Zhou ZW, Li GX, Xu RH. Comparison of prognostic nomograms based on different nodal staging systems in patients with resected gastric cancer. Journal of Cancer. 2017; 8:950.
24. Zhang ZY, Luo QF, Yin XW, Dai ZL, Basnet S, Ge HY. Nomograms to predict survival after colorectal cancer resection without preoperative therapy. Bmc Cancer. 2016; 16:658.
25. Zhang ZY, Gao W, Luo QF, Yin XW, Basnet S, Dai ZL, Ge HY. A nomogram improves AJCC stages for colorectal cancers by introducing CEA, modified lymph node ratio and negative lymph node count. Scientific Reports. 2016; 6:39028.
26. Moccia AA, Donaldson J, Chhanabhai M, Hoskins PJ, Klasa RJ, Savage KJ, Shenkier TN, Slack GW, Skinnider B, Gascoyne RD, Connors JM, Sehn LH. International Prognostic Score in advanced-stage Hodgkin’s lymphoma: altered utility in the modern era. J Clin Oncol. 2012; 30:3383-8.
27. Eberle FC, Mani H, Jaffe ES. Histopathology of Hodgkin’s lymphoma. Cancer J. 2009; 15:129-37.
28. Tiacci E, Doring C, Brune V, van Noesel CJ, Klapper W, Mechtersheimer G, Falini B, Kuppers R, Hansmann ML. Analyzing primary Hodgkin and Reed-Sternberg cells to capture the molecular and cellular pathogenesis of classical Hodgkin lymphoma. Blood. 2012; 120:4609-20.
29. Mathas S, Hartmann S, Kuppers R. Hodgkin lymphoma: Pathology and biology. Semin Hematol. 2016; 53:139-47.
30. Agostinelli C, Pileri S. Pathobiology of hodgkin lymphoma. Mediterr J Hematol Infect Dis. 2014; 6:e2014040.
31. Glaser SL, Clarke CA, Keegan TH, Chang ET, Weisenburger DD. Time Trends in Rates of Hodgkin Lymphoma Histologic Subtypes: True Incidence Changes or Evolving Diagnostic Practice? Cancer Epidemiol Biomarkers Prev. 2015; 24:1474-88.
32. Harrell FE Jr, Lee KL, Mark DB. Multivariable prognostic models: issues in developing models, evaluating assumptions and adequacy, and measuring and reducing errors. Stat Med. 1996; 15:361-87.
33. Huitzil-Melendez FD, Capanu M, O’Reilly EM, Duffy A, Gansukh B, Saltz LL, Abou-Alfa GK. Advanced hepatocellular carcinoma: which staging systems best predict prognosis? J Clin Oncol. 2010; 28:2889-95.
34. Nunez E, Steyerberg EW, Nunez J. [Regression modeling strategies]. [Article in Spanish]. Rev Esp Cardiol. 2011; 64:501-7.