
INTRODUCTION
Lung cancer is the most common cancer among men worldwide in terms of incidence and mortality, and among women has the third highest incidence and is second after breast cancer in mortality [1]. American Cancer Society has estimated that there will be 222,500 new cases and 155,870 deaths caused by lung cancer in United States in 2017 [2]. Although the development of newer, advanced treatment has improved the outcomes of patients, lung cancer remains the leading cause of cancer-related mortality in the United States. The 5-year relative survival rate from 1995 to 2001 for lung cancer patients were only 15.7%, much lower than other cancers [3].
Non-small cell lung cancer (NSCLC) is any type of epithelial lung cancer other than small cell lung cancer, and accounts for about 85% of all lung cancer cases [4]. A variety of clinicopathologic factors have been identified of the prognostic importance, such as the presence of pulmonary symptoms, non-squamous histology, larger tumor size, vascular invasion, etc. The influence of many demographic factors such as age and sex on the prognosis have also been investigated. During the year 2006-2008, Kumi et al. conducted researches on the relationship between marital status and survival in NSCLC patients in Japan [5, 6]; and Jatoi et al. investigated into the impact of marital status on NSCLC patients’ survival and quality of life [7]. The three studies found no evidence supporting marital status was associated with survival in all NSCLC patients. However, in recent years, many researches have demonstrated that marital status independently predicts the survival of a series of cancers including gastric cancer [8–10], colorectal cancer [11, 12], liver cancer [13], pancreatic cancer [14], and several other types of cancer [15–18], with larger population from the US Surveillance, Epidemiology and End Results (SEER) cancer database.
Therefore, in this study, we aim to perform a comprehensive population-based analysis using SEER database to clarify the prognosis significance of marital status on the survival of NSCLC patients. We used data from 2004 to 2012 to investigate the risk of overall survival and cancer-specific survival associated with marital status and further analyzed the risk according to different stages.
RESULTS
Patient baseline characteristics
A total of 70006 eligible NSCLC patients were identified during the study period (from 2004 to 2012) in the SEER database, including 37074(52.96%) male and 32932(47.04%) female patients. Among them, 37209(53.15%) were married, 10108(14.44%) were divorced or separated, 13251(18.93%) were widowed, and 9438(13.48%) were never married. Table 1 represents the summary of the subgroups of each variable and the relationship between each variable and marital status. Significant differences were observed in all subgroups. Specifically, married group had the highest proportion of male patients (62.34%), while widowed group had the highest proportion of female patients (73.29%). Widowed patients were more likely to be over 80 years (40.92%), while most of the never married patients were less than 60 4142(43.89%). White patients accounted for the majority of each marital group, but the proportion of black patients were higher in never married group (28.63%) than that in other groups. Never married patients were more likely to be stage IV (50.94%), and married patients were more likely to receive surgery (29.29%), compared with other groups.
Table 1: Baseline characteristics of NSCLC patients
Characteristics |
Total |
Married |
Divorced/ |
Widowed |
Never married |
P value |
|---|---|---|---|---|---|---|
70006(100) |
37209(53.15) |
10108(14.44) |
13251(18.93) |
9438(13.48) |
||
Gender |
<0.0001 |
|||||
Male |
37074(52.96) |
23197(62.34) |
4936(48.83) |
3540(26.71) |
5401(57.23) |
|
Female |
32932(47.04) |
14012(37.66) |
5172(51.17) |
9711(73.29) |
4037(42.77) |
|
Age |
<0.0001 |
|||||
<60 |
16297(23.28) |
8498(22.84) |
3086(30.53) |
571(4.31) |
4142(43.89) |
|
60-69 |
20697(29.56) |
12073(32.45) |
3711(36.71) |
2101(15.86) |
2812(29.79) |
|
70-79 |
21087(30.12) |
11609(31.20) |
2571(25.44) |
5157(38.92) |
1750(18.54) |
|
≥80 |
11925(17.03) |
5029(13.52) |
740(7.32) |
5422(40.92) |
734(7.78) |
|
Race |
<0.0001 |
|||||
White |
54400(77.71) |
29838(80.19) |
7809(77.26) |
10689(80.67) |
6064(64.25) |
|
Black |
8695(12.42) |
2884(7.75) |
1717(16.99) |
1392(10.50) |
2702(28.63) |
|
Others |
6911(9.87) |
4487(12.06) |
582(5.76) |
1170(8.83) |
672(7.12) |
|
Diagnosis year |
<0.0001 |
|||||
2004-2008 |
37086(52.98) |
19825(53.28) |
5179(51.24) |
7230(54.56) |
4852(51.41) |
|
2009-2012 |
32920(47.02) |
17384(46.72) |
4929(48.76) |
6021(45.44) |
4586(48.59) |
|
Median household income |
<0.0001 |
|||||
Quartile 4 |
17719(25.31) |
9167 (24.64) |
2667 (26.39) |
3239 (24.44) |
2646 (28.04) |
|
Quartile 3 |
18935(27.05) |
10154(27.29) |
2833 (28.03) |
3592 (27.11) |
2356 (24.96) |
|
Quartile 2 |
16263(23.23) |
8766 (23.56) |
2497 (24.70) |
3209 (24.22) |
1791 (18.98) |
|
Quartile 1 |
17089(24.41) |
9122 (24.52) |
2111 (20.88) |
3211 (24.23) |
2645 (28.03) |
|
Grade |
<0.0001 |
|||||
I |
3870(5.53) |
2253(6.05) |
440(4.35) |
773(5.83) |
404(4.28) |
|
II |
12649(18.07) |
7042(18.93) |
1809(17.90) |
2221(16.76) |
1577(16.71) |
|
III |
18919(27.02) |
10332(27.77) |
2753(27.24) |
3228(24.36) |
2606(27.61) |
|
IV |
1345(1.92) |
746(2.00) |
197(1.95) |
229(1.73) |
173(1.83) |
|
Unknown |
33223(47.46) |
16836(45.25) |
4909(48.57) |
6800(51.32) |
4678(49.57) |
|
TNM stage |
<0.0001 |
|||||
I |
16037(22.91) |
8681(23.33) |
2204(21.80) |
3380(25.51) |
1772(18.78) |
|
II |
3678(5.25) |
2070(5.56) |
527(5.21) |
609(4.60) |
472(5.00) |
|
III |
18166(25.95) |
9510(25.56) |
2659(26.31) |
3611(27.25) |
2386(25.28) |
|
IV |
32125(45.89) |
16948(45.55) |
4718(46.68) |
5651(42.65) |
4808(50.94) |
|
Histology |
<0.0001 |
|||||
adenocarcinoma |
32981(47.11) |
18370(49.37) |
4620(45.71) |
5592(42.20) |
4399(46.61) |
|
squamous carcinoma |
15892(22.70) |
8271(22.23) |
2451(24.25) |
3072(23.18) |
2098(22.23) |
|
Others |
21133(30.19) |
10568(28.40) |
3037(30.05) |
4587(34.62) |
2941(31.16) |
|
Surgery |
<0.0001 |
|||||
Yes |
18372(26.24) |
10900(29.29) |
2608(25.80) |
2740(20.68) |
2124(22.50) |
|
No |
51634(73.76) |
26309(70.71) |
7500(74.20) |
10511(79.32) |
7314(77.50) |
|
Radiotherapy |
<0.0001 |
|||||
Yes |
31144(44.49) |
16940(45.53) |
4781(47.30) |
4976(37.55) |
4447(47.12) |
|
No |
38862(55.51) |
20269(54.47) |
5327(52.70) |
8275(62.45) |
4991(52.88) |
Effect of marital status on overall and cause-specific survival
The results of Kaplan-Meier tests and multivariate Cox analysis of the effect of marital status and covariates on OS and CSS were shown in Table 2 and Table 3, respectively. The median OS was 14 months for the married, 11 months for the divorced/separated and the never married, and 10 months for the widowed (log-rank test p<0.0001) (Figure 1). After adjusting for other factors with Cox regression, marital status was found to be an independent prognostic factor of OS. Divorced/separated (HR=1.15, 95%CI: 1.12-1.18), widowed (HR=1.16, 95%CI: 1.14-1.19), and never married (HR=1.15, 95%CI: 1.12-1.18) patients had an increased risk of mortality compared with married patients. In terms of CSS, the median CSS was 16 months for married patients, 13 months for divorced/separated patients, 12 months for widowed and never married patients (log-rank test p<0.0001) (Figure 2). Similarly, after adjusting all covariates, marital status was still identified as significantly associated with the CSS. Divorced/separated (HR=1.14, 95%CI: 1.11-1.17), widowed (HR=1.15, 95%CI: 1.12-1.18), and never married (HR=1.13, 95%CI: 1.10-1.16) patients had an increased risk of NSCLC cause-specific mortality compared with married patients. Besides, female was associated with better OS and CSS and other races was a protective factor for NSCLC compared with white patients. However, age over 60, higher and unknown grade, higher TNM stage, squamous carcinoma and other histological types, lower median household income (Quartile 1 and 2 compared with Quartile 4), no surgery, and no radiotherapy were identified as risk factors of both OS and CSS.
Table 2: Univariate and multivariate analyses of overall survival (OS)
Characteristics |
Median OS |
Univariate analysis |
Multivariate analysis |
||
|---|---|---|---|---|---|
Log-rank |
P |
HR(95%CI) |
P |
||
Marital status |
544.62 |
<.0001 |
|||
Married |
14 |
Ref. |
|||
Divorced/separated |
11 |
1.15(1.12, 1.18) |
<.0001 |
||
Widowed |
10 |
1.16(1.14, 1.19) |
<.0001 |
||
Never married |
11 |
1.15(1.12, 1.18) |
<.0001 |
||
Gender |
530.73 |
<.0001 |
|||
Male |
11 |
Ref. |
|||
Female |
14 |
0.81(0.80, 0.83) |
<.0001 |
||
Age |
1486.10 |
<.0001 |
|||
<60 |
14 |
Ref. |
|||
60-69 |
14 |
1.13(1.11, 1.16) |
<.0001 |
||
70-79 |
12 |
1.34(1.30, 1.37) |
<.0001 |
||
≥80 |
8 |
1.65(1.61, 1.70) |
<.0001 |
||
Race |
131.47 |
<.0001 |
|||
White |
12 |
Ref. |
|||
Black |
10 |
1.01(0.98, 1.03) |
0.5546 |
||
Others |
14 |
0.87(0.84, 0.89) |
<.0001 |
||
Diagnosis year |
53.38 |
<.0001 |
|||
2004-2008 |
12 |
Ref. |
|||
2009-2012 |
13 |
0.93(0.91, 0.95) |
<.0001 |
||
Median household income |
116.53 |
<.0001 |
|||
Quartile 4 |
13 |
Ref. |
|||
Quartile 3 |
13 |
0.99(0.97, 1.02) |
0.6257 |
||
Quartile 2 |
12 |
1.05(1.03, 1.08) |
<.0001 |
||
Quartile 1 |
11 |
1.05(1.02, 1.07) |
0.0003 |
||
Grade |
8018.64 |
<.0001 |
|||
I |
64 |
Ref. |
|||
II |
32 |
1.35(1.28, 1.42) |
<.0001 |
||
III |
13 |
1.55(1.47, 1.63) |
<.0001 |
||
IV |
10 |
1.66(1.54, 1.79) |
<.0001 |
||
Unknown |
8 |
1.49(1.42, 1.57) |
<.0001 |
||
TNM stage |
21640.45 |
<.0001 |
|||
I |
63 |
Ref. |
|||
II |
30 |
1.60(1.53, 1.67) |
<.0001 |
||
III |
13 |
1.85(1.79, 1.90) |
<.0001 |
||
IV |
6 |
3.23(3.13, 3.33) |
<.0001 |
||
Histology |
2490.73 |
<.0001 |
|||
adenocarcinoma |
16 |
Ref. |
|||
squamous carcinoma |
13 |
1.14(1.11, 1.16) |
<.0001 |
||
Others |
8 |
1.15(1.13, 1.18) |
<.0001 |
||
Surgery |
19418.35 |
<.0001 |
|||
Yes |
71 |
Ref. |
|||
No |
8 |
2.67(2.59, 2.76) |
<.0001 |
||
Radiotherapy |
1563.04 |
<.0001 |
|||
Yes |
10 |
Ref. |
|||
No |
15 |
1.14(1.12, 1.16) |
<.0001 |
||
Table 3: Univariate and multivariate analyses of NSCLC cause-specific survival (CSS)
Characteristics |
Median CSS |
Univariate analysis |
Multivariate analysis |
||
|---|---|---|---|---|---|
Log-rank |
P |
HR(95%CI) |
P |
||
Marital status |
338.87 |
<.0001 |
|||
Married |
16 |
Ref. |
|||
Divorced/separated |
13 |
1.14(1.11, 1.17) |
<.0001 |
||
Widowed |
12 |
1.15(1.12, 1.18) |
<.0001 |
||
Never married |
12 |
1.13(1.10, 1.16) |
<.0001 |
||
Gender |
408.42 |
<.0001 |
|||
Male |
12 |
Ref. |
|||
Female |
17 |
0.83(0.81, 0.84) |
<.0001 |
||
Age |
707.69 |
<.0001 |
|||
<60 |
15 |
Ref. |
|||
60-69 |
16 |
1.10(1.07, 1.13) |
<.0001 |
||
70-79 |
14 |
1.25(1.22, 1.28) |
<.0001 |
||
≥80 |
9 |
1.51(1.46, 1.55) |
<.0001 |
||
Race |
115.70 |
<.0001 |
|||
White |
14 |
Ref. |
|||
Black |
12 |
0.99(0.96, 1.02) |
0.3895 |
||
Others |
17 |
0.85(0.82, 0.88) |
<.0001 |
||
Diagnosis year |
51.66 |
<.0001 |
|||
2004-2008 |
13 |
Ref. |
|||
2009-2012 |
15 |
0.93(0.91, 0.94) |
<.0001 |
||
Median household income |
96.96 |
<.0001 |
|||
Quartile 4 |
15 |
Ref. |
|||
Quartile 3 |
15 |
0.99(0.96, 1.02) |
0.5201 |
||
Quartile 2 |
14 |
1.05(1.02, 1.07) |
0.0009 |
||
Quartile 1 |
12 |
1.04(1.01, 1.07) |
0.0032 |
||
Grade |
7661.50 |
<.0001 |
|||
I |
72.23* |
Ref. |
|||
II |
43 |
1.42(1.34, 1.51) |
<.0001 |
||
III |
15 |
1.65(1.56, 1.75) |
<.0001 |
||
IV |
11 |
1.78(1.63, 1.93) |
<.0001 |
||
Unknown |
9 |
1.57(1.48, 1.66) |
<.0001 |
||
TNM stage |
23688.82 |
<.0001 |
|||
I |
81.40* |
Ref. |
|||
II |
38 |
1.96(1.86, 2.06) |
<.0001 |
||
III |
15 |
2.39(2.30, 2.47) |
<.0001 |
||
IV |
6 |
4.37(4.22, 4.53) |
<.0001 |
||
Histology |
2048.99 |
<.0001 |
|||
adenocarcinoma |
19 |
Ref. |
|||
squamous carcinoma |
15 |
1.11(1.08, 1.13) |
<.0001 |
||
Others |
9 |
1.12(1.10, 1.15) |
<.0001 |
||
Surgery |
18624.76 |
<.0001 |
|||
Yes |
80.20* |
Ref. |
|||
No |
9 |
2.74(2.65, 2.84) |
<.0001 |
||
Radiotherapy |
1787.39 |
<.0001 |
|||
Yes |
11 |
Ref. |
|||
No |
19 |
1.11(1.09, 1.13) |
<.0001 |
||
* represents the mean survival month since the median survival month is not available.
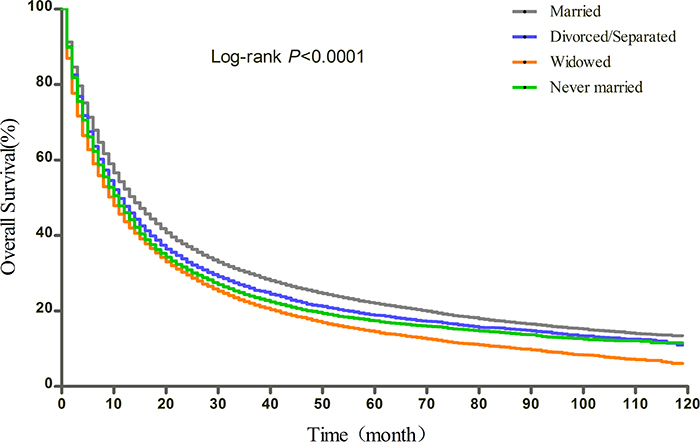
Figure 1: Kaplan-Meier curves of the effect of marital status on overall survival (OS).
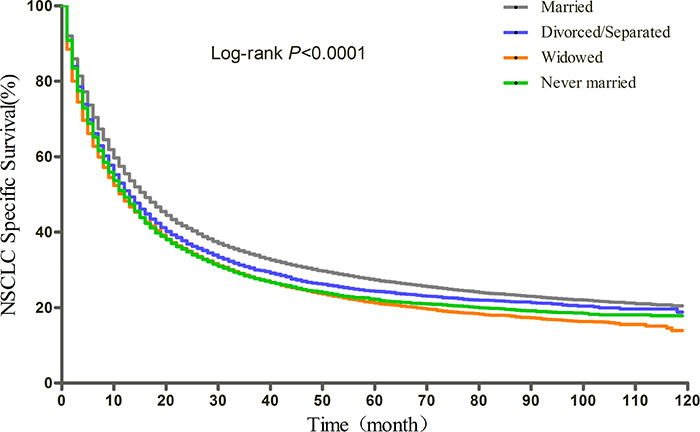
Figure 2: Kaplan-Meier curves of the effect of marital status on NSCLC cause-specific survival (CSS).
Subgroup analyses of patients with surgery stratified by TNM stage
Prognosis of NSCLC varies much according to TNM stage and surgery condition. Therefore, we further explored the effect of marital status on OS and CSS, stratified by TNM, in patients who received surgery. The log-rank tests of the OS and CSS differences among different marital status were shown in Figure 3 and Figure 4, respectively. The results were summarized in Table 4 for OS and Table 5 for CSS. After adjusting other covariates in Cox regression, divorced/separated, widowed, and never married had greater risk of overall mortality compared with married patients at Stage I and Stage III. Widowed patients and married patients had poorer prognosis compared with married patients at Stage II, and only widowed patients showed poorer prognosis at Stage IV. In the context of CSS, compared with married patients, divorced/separated showed greater hazard ratio of mortality at Stage I, widowed patients had poorer prognosis at Stage I, III and IV, and never married patients had higher risk of mortality at Stage II and III. Besides, female patients had better OS and CSS than male patients at all stages. Age over 70 was risk factor at every stage. For Stage I, II, and IV patients with surgery, not receiving radiotherapy was identified as a protective factor for OS and CSS.
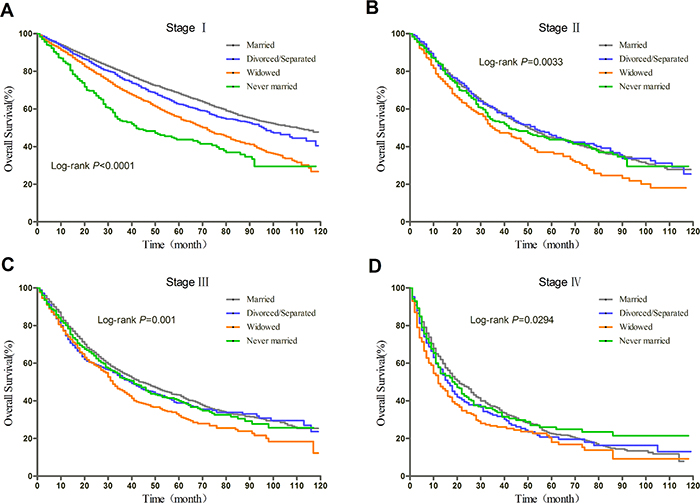
Figure 3: Kaplan-Meier curves of the effect of marital status on OS for patients with surgery by stage.
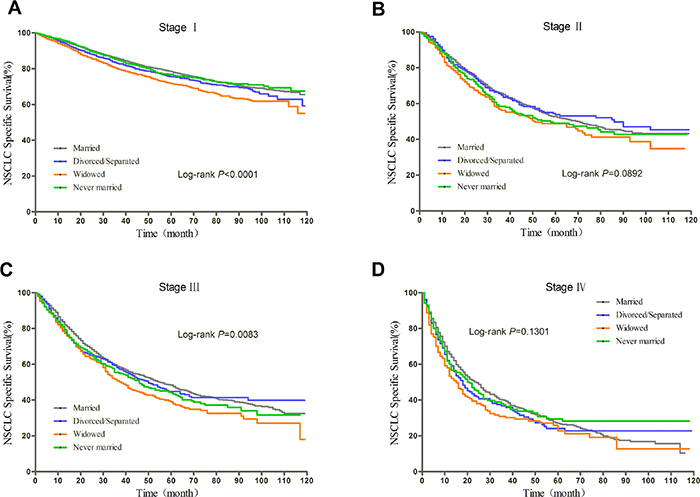
Figure 4: Kaplan-Meier curves of the effect of marital status on CSS for patients with surgery by stage.
Table 4: Subgroup analyses stratified by TNM stage for NSCLC patients with surgery (OS)
Characteristics |
Stage I |
Stage II |
Stage III |
Stage IV |
|---|---|---|---|---|
Marital status |
||||
Married |
Ref. |
Ref. |
Ref. |
Ref. |
Divorced/separated |
1.31(1.19, 1.44)a |
1.11(0.94, 1.32) |
1.20(1.06, 1.37)a |
1.14(0.95, 1.37) |
Widowed |
1.36(1.24, 1.48)a |
1.23(1.04, 1.47)b |
1.25(1.08, 1.44)a |
1.36(1.12, 1.66)a |
Never married |
1.17(1.04, 1.31)a |
1.24(1.04, 1.47)b |
1.19(1.03, 1.38)b |
0.94(0.77, 1.16) |
Gender |
||||
Male |
Ref. |
Ref. |
Ref. |
Ref. |
Female |
0.67(0.63, 0.72)a |
0.76(0.68, 0.86)a |
0.76(0.69, 0.84)a |
0.76(0.67, 0.87)a |
Age |
||||
<60 |
Ref. |
Ref. |
Ref. |
Ref. |
60-69 |
1.48(1.33, 1.65)a |
1.16(1.00, 1.35) |
1.05(0.94, 1.18) |
1.09(0.93, 1.27) |
70-79 |
2.20(1.98, 2.45)a |
1.75(1.50, 2.05)a |
1.47(1.30, 1.66)a |
1.25(1.04, 1.49)b |
≥80 |
3.37(2.97, 3.81)a |
2.10(1.69, 2.61)a |
1.85(1.54, 2.23)a |
1.48(1.15, 1.89)a |
Race |
||||
White |
Ref. |
Ref. |
Ref. |
Ref. |
Black |
1.15(1.02, 1.29)b |
0.83(0.67, 1.01) |
0.93(0.79, 1.09) |
1.14(0.94, 1.40) |
Others |
0.89(0.78, 1.01) |
0.75(0.61, 0.92)a |
0.90(0.76, 1.06) |
0.93(0.73, 1.19) |
Diagnosis year |
||||
2004-2008 |
Ref. |
Ref. |
Ref. |
Ref. |
2009-2012 |
0.90(0.84, 0.97)a |
0.99(0.87, 1.12) |
0.88(0.80, 0.97)a |
0.90(0.79, 1.02) |
Median household income |
||||
Quartile 4 |
Ref. |
Ref. |
Ref. |
Ref. |
Quartile 3 |
1.14(1.04, 1.26)a |
1.01(0.86, 1.20) |
1.16(1.01, 1.33)b |
1.08(0.90, 1.29) |
Quartile 2 |
1.14(1.05, 1.25)a |
0.91(0.78, 1.06) |
1.08(0.95, 1.22) |
1.06(0.89, 1.26) |
Quartile 1 |
1.01(0.92, 1.12) |
0.89(0.76, 1.05) |
0.97(0.85, 1.10) |
0.93(0.77, 1.13) |
Grade |
||||
I |
Ref. |
Ref. |
Ref. |
Ref. |
II |
1.48(1.33, 1.65)a |
1.07(0.82, 1.40) |
1.63(1.31, 2.03)a |
1.22(0.94, 1.59) |
III |
1.68(1.50, 1.88)a |
1.24(0.95, 1.62) |
1.90(1.53, 2.37)a |
1.57(1.22, 2.04)a |
IV |
1.69(1.35, 2.12)a |
1.15(0.77, 1.71) |
2.50(1.80, 3.46)a |
1.69(1.14, 2.51)a |
Unknown |
1.43(1.23, 1.66)a |
1.30(0.94, 1.80) |
1.70(1.33, 2.17)a |
1.60(1.22, 2.10)a |
Histology |
||||
adenocarcinoma |
Ref. |
Ref. |
Ref. |
Ref. |
squamous carcinoma |
1.20(1.12, 1.30)a |
0.95(0.84, 1.08) |
1.06(0.95, 1.18) |
1.09(0.92, 1.30) |
Others |
1.16(1.05, 1.29)a |
1.16(0.98, 1.36) |
0.98(0.86, 1.12) |
1.21(1.03, 1.43)b |
Radiotherapy |
||||
Yes |
Ref. |
Ref. |
Ref. |
Ref. |
No |
0.47(0.41, 0.53)a |
0.79(0.69, 0.90)a |
1.00(0.91, 1.10) |
0.75(0.66, 0.86)a |
a: P<0.01; b: P<0.05.
Table 5: Subgroup analyses stratified by TNM stage for NSCLC patients with surgery (CSS)
Characteristics |
Stage I |
Stage II |
Stage III |
Stage IV |
|---|---|---|---|---|
Marital status |
||||
Married |
Ref. |
Ref. |
Ref. |
Ref. |
Divorced/separated |
1.24(1.10, 1.40)a |
1.04(0.86, 1.26) |
1.13(0.98, 1.31) |
1.11(0.92, 1.35) |
Widowed |
1.27(1.13, 1.42)a |
1.15(0.94, 1.40) |
1.21(1.04, 1.42)b |
1.31(1.06, 1.62)b |
Never married |
1.14(0.99, 1.32) |
1.26(1.04, 1.53)b |
1.23(1.05, 1.43)b |
0.95(0.77, 1.18) |
Gender |
||||
Male |
Ref. |
Ref. |
Ref. |
Ref. |
Female |
0.70(0.64, 0.77)a |
0.83(0.72, 0.94)a |
0.80(0.72, 0.88)a |
0.79(0.69, 0.90)a |
Age |
||||
<60 |
Ref. |
Ref. |
Ref. |
Ref. |
60-69 |
1.34(1.18, 1.52)a |
1.09(0.92, 1.29) |
0.99(0.87, 1.12) |
1.07(0.91, 1.26) |
70-79 |
1.75(1.54, 1.99)a |
1.55(1.31, 1.85)a |
1.37(1.20, 1.57)a |
1.22(1.01, 1.47)b |
≥80 |
2.48(2.12, 2.91)a |
1.86(1.45, 2.38)a |
1.78(1.46, 2.17)a |
1.48(1.14, 1.92)a |
Race |
||||
White |
Ref. |
Ref. |
Ref. |
Ref. |
Black |
1.10(0.95, 1.28) |
0.83(0.66, 1.04) |
0.93(0.79, 1.11) |
1.10(0.89, 1.35) |
Others |
0.88(0.75, 1.03) |
0.68(0.53, 0.86)a |
0.93(0.78, 1.11) |
0.91(0.71, 1.18) |
Diagnosis year |
||||
2004-2008 |
Ref. |
Ref. |
Ref. |
Ref. |
2009-2012 |
0.89(0.81, 0.98)b |
0.98(0.86, 1.13) |
0.86(0.78, 0.96)a |
0.89(0.78, 1.02) |
Median household income |
||||
Quartile 4 |
Ref. |
Ref. |
Ref. |
Ref. |
Quartile 3 |
1.10(0.97, 1.24) |
1.08(0.89, 1.30) |
1.13(0.97, 1.31) |
1.03(0.85, 1.24) |
Quartile 2 |
1.12(0.99, 1.25) |
0.89(0.75, 1.07) |
1.02(0.89, 1.18) |
1.02(0.85, 1.22) |
Quartile 1 |
0.98(0.87, 1.11) |
0.93(0.78, 1.12) |
0.96(0.84, 1.11) |
0.92(0.75, 1.13) |
Grade |
||||
I |
Ref. |
Ref. |
Ref. |
Ref. |
II |
1.79(1.55, 2.06)a |
1.14(0.84, 1.55) |
1.83(1.43, 2.35)a |
1.28(0.97, 1.70) |
III |
2.11(1.82, 2.46)a |
1.35(0.99, 1.83) |
2.16(1.69, 2.77)a |
1.67(1.27, 2.21)a |
IV |
1.97(1.47, 2.64)a |
1.24(0.79, 1.95) |
2.75(1.91, 3.95)a |
1.72(1.12, 2.63)b |
Unknown |
1.60(1.31, 1.95)a |
1.41(0.97, 2.04) |
1.90(1.45, 2.51)a |
1.74(1.30, 2.33)a |
Histology |
||||
adenocarcinoma |
Ref. |
Ref. |
Ref. |
Ref. |
squamous carcinoma |
1.04(0.94, 1.15) |
0.83(0.71, 0.96)b |
1.01(0.90, 1.14) |
1.08(0.90, 1.30) |
Others |
1.13(0.99, 1.28) |
1.18(0.99, 1.41) |
0.99(0.86, 1.14) |
1.22(1.03, 1.45)b |
Radiotherapy |
||||
Yes |
Ref. |
Ref. |
Ref. |
Ref. |
No |
0.39(0.33, 0.45)a |
0.75(0.64, 0.87)a |
0.96(0.87, 1.06) |
0.72(0.63, 0.83)a |
a: P<0.01; b: P<0.05.
Subgroup analyses of patients without surgery stratified by TNM stage
We also explored the effect of marital status on OS and CSS, stratified by TNM, in patients who did not receive surgery. The log-rank tests of the OS and CSS differences among different marital status were shown in Figure 5 and Figure 6, respectively. The results were summarized in Table 6 for OS and Table 7 for CSS. For patients at Stage I, divorced/separated and widowed patients had greater risk of mortality than married patients. For patients at Stage III and Stage IV, all three unmarried groups had poorer OS and CSS than married group. For patients at Stage II, however, the marital status had no relationship with the OS and CSS. Age over 60 was independent prognostic factor at all stages for OS and CSS. Contrary to the findings for patients who received surgery, not receive radiotherapy was found to be a risk factor for both OS and CSS for patients who did not receive surgery. Besides, the relationship between histology type and the OS and CSS of patients without surgery seemed to be stronger than that of patients with surgery since squamous carcinoma and other histology types were identified as independent risk factors at all stages.
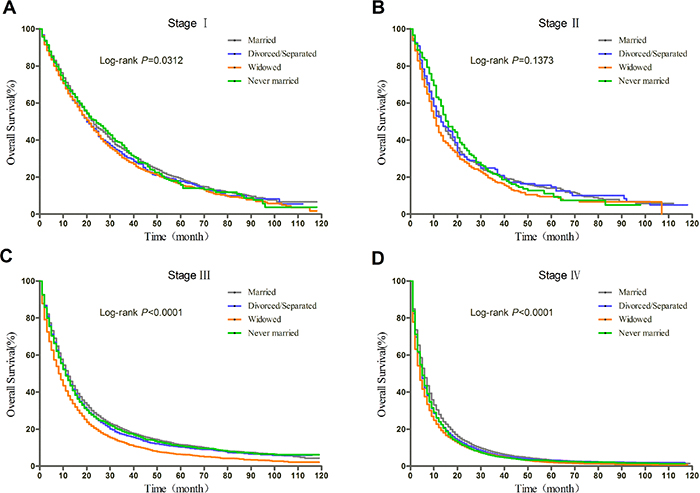
Figure 5: Kaplan-Meier curves of the effect of marital status on OS for patients without surgery by stage.
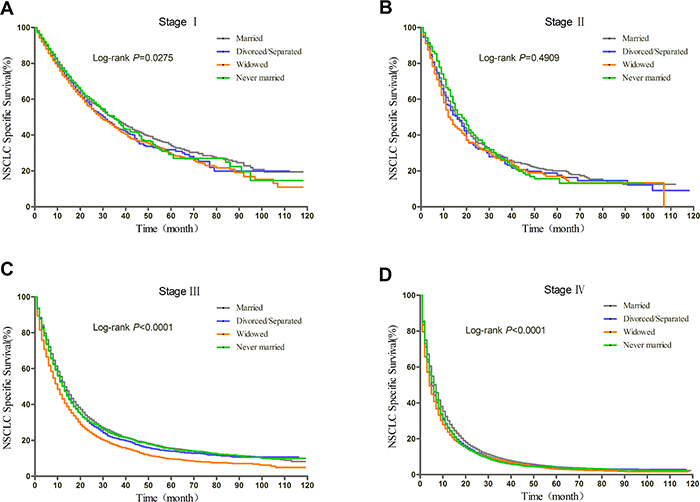
Figure 6: Kaplan-Meier curves of the effect of marital status on CSS for patients without surgery by stage.
Table 6: Subgroup analyses stratified by TNM stage for NSCLC patients without surgery (OS)
Characteristics |
Stage I |
Stage II |
Stage III |
Stage IV |
|---|---|---|---|---|
Marital status |
||||
Married |
Ref. |
Ref. |
Ref. |
Ref. |
Divorced/separated |
1.20(1.08, 1.34)a |
1.03(0.86, 1.24) |
1.14(1.08, 1.21)a |
1.13(1.09, 1.17)a |
Widowed |
1.10(1.01, 1.20)b |
1.14(0.97, 1.34) |
1.17(1.12, 1.23)a |
1.13(1.10, 1.17)a |
Never married |
1.02(0.91, 1.14) |
1.04(0.85, 1.26) |
1.13(1.07, 1.20)a |
1.15(1.11, 1.19)a |
Gender |
||||
Male |
Ref. |
Ref. |
Ref. |
Ref. |
Female |
0.80(0.75, 0.86)a |
0.82(0.72, 0.94)a |
0.83(0.80, 0.86)a |
0.84(0.82, 0.86)a |
Age |
||||
<60 |
Ref. |
Ref. |
Ref. |
Ref. |
60-69 |
1.20(1.03, 1.39)b |
1.28(1.03, 1.60)b |
1.13(1.07, 1.20)a |
1.12(1.09, 1.16)a |
70-79 |
1.42(1.23, 1.64)a |
1.43(1.16, 1.76)a |
1.31(1.24, 1.38)a |
1.26(1.22, 1.31)a |
≥80 |
1.63(1.41, 1.89)a |
1.84(1.47, 2.29)a |
1.65(1.56, 1.76)a |
1.49(1.43, 1.55)a |
Race |
||||
White |
Ref. |
Ref. |
Ref. |
Ref. |
Black |
1.02(0.91, 1.13) |
1.06(0.87, 1.28) |
0.99(0.94, 1.05) |
1.01(0.97, 1.04) |
Others |
0.95(0.83, 1.09) |
1.06(0.83, 1.35) |
0.88(0.83, 0.94)a |
0.85(0.81, 0.88)a |
Diagnosis year |
||||
2004-2008 |
Ref. |
Ref. |
Ref. |
Ref. |
2009-2012 |
0.86(0.80, 0.92)a |
0.96(0.84, 1.09) |
0.93(0.90, 0.96)a |
0.95(0.93, 0.97)a |
Median household income |
||||
Quartile 4 |
Ref. |
Ref. |
Ref. |
Ref. |
Quartile 3 |
0.97(0.88, 1.07) |
1.28(1.06, 1.54)b |
1.05(0.99, 1.10) |
1.02(0.99, 1.06) |
Quartile 2 |
0.91(0.82, 1.01) |
1.13(0.93, 1.38) |
1.08(1.03, 1.14)a |
1.04(1.01, 1.08)b |
Quartile 1 |
0.98(0.89, 1.08) |
1.26(1.04, 1.53)b |
1.03(0.98, 1.09) |
0.99(0.95, 1.02) |
Grade |
||||
I |
Ref. |
Ref. |
Ref. |
Ref. |
II |
1.36(1.16, 1.61)a |
1.40(0.93, 2.10) |
1.19(1.04, 1.35)a |
1.26(1.15, 1.38)a |
III |
1.39(1.18, 1.63)a |
1.51(1.01, 2.24)b |
1.23(1.09, 1.39)a |
1.51(1.39, 1.64)a |
IV |
1.34(0.96, 1.87) |
1.47(0.84, 2.57) |
1.32(1.11, 1.58)a |
1.61(1.43, 1.82)a |
Unknown |
1.20(1.03, 1.40)b |
1.43(0.97, 2.11) |
1.19(1.05, 1.34)a |
1.45(1.34, 1.58)a |
Histology |
||||
adenocarcinoma |
Ref. |
Ref. |
Ref. |
Ref. |
squamous carcinoma |
1.41(1.29, 1.54)a |
1.33(1.13, 1.56)a |
1.20(1.14, 1.25)a |
1.10(1.06, 1.14)a |
Others |
1.26(1.15, 1.37)a |
1.27(1.07, 1.50)a |
1.15(1.10, 1.20)a |
1.17(1.14, 1.20)a |
Radiotherapy |
||||
Yes |
Ref. |
Ref. |
Ref. |
Ref. |
No |
1.90(1.77, 2.03)a |
1.74(1.52, 1.98)a |
1.69(1.63, 1.75)a |
0.99(0.97, 1.01) |
a: P<0.01; b: P<0.05.
Table 7: Subgroup analyses stratified by TNM stage for NSCLC patients without surgery (CSS)
Characteristics |
Stage I |
Stage II |
Stage III |
Stage IV |
|---|---|---|---|---|
Marital status |
||||
Married |
Ref. |
Ref. |
Ref. |
Ref. |
Divorced/separated |
1.21(1.07, 1.37)a |
1.11(0.91, 1.35) |
1.13(1.07, 1.20)a |
1.13(1.09, 1.17)a |
Widowed |
1.14(1.03, 1.27)b |
1.09(0.91, 1.31) |
1.17(1.11, 1.23)a |
1.12(1.08, 1.17)a |
Never married |
1.03(0.89, 1.18) |
1.09(0.89, 1.35) |
1.11(1.04, 1.18)a |
1.13(1.09, 1.17)a |
Gender |
||||
Male |
Ref. |
Ref. |
Ref. |
Ref. |
Female |
0.81(0.75, 0.89)a |
0.89(0.77, 1.03) |
0.83(0.80, 0.87)a |
0.85(0.83, 0.87)a |
Age |
||||
<60 |
Ref. |
Ref. |
Ref. |
Ref. |
60-69 |
1.20(1.00, 1.44) |
1.31(1.03, 1.66)b |
1.08(1.02, 1.14)a |
1.11(1.07, 1.14)a |
70-79 |
1.37(1.15, 1.63)a |
1.36(1.09, 1.71)a |
1.22(1.15, 1.29)a |
1.22(1.18, 1.26)a |
≥80 |
1.50(1.26, 1.79)a |
1.80(1.42, 2.30)a |
1.51(1.41, 1.60)a |
1.41(1.35, 1.47)a |
Race |
||||
White |
Ref. |
Ref. |
Ref. |
Ref. |
Black |
0.96(0.85, 1.09) |
1.03(0.83, 1.27) |
1.00(0.94, 1.05) |
0.98(0.95, 1.02) |
Others |
0.93(0.79, 1.09) |
1.10(0.84, 1.44) |
0.88(0.82, 0.94)a |
0.82(0.79, 0.86)a |
Diagnosis year |
||||
2004-2008 |
Ref. |
Ref. |
Ref. |
Ref. |
2009-2012 |
0.81(0.74, 0.88)a |
0.90(0.78, 1.03) |
0.93(0.90, 0.97)a |
0.95(0.92, 0.97)a |
Median household income |
||||
Quartile 4 |
Ref. |
Ref. |
Ref. |
Ref. |
Quartile 3 |
1.00(0.89, 1.13) |
1.32(1.07, 1.61)a |
1.04(0.98, 1.10) |
1.02(0.98, 1.06) |
Quartile 2 |
0.91(0.81, 1.03) |
1.13(0.91, 1.40) |
1.08(1.02, 1.14)a |
1.04(1.01, 1.08)b |
Quartile 1 |
0.93(0.82, 1.05) |
1.21(0.98, 1.50) |
1.04(0.99, 1.10) |
0.99(0.95, 1.02) |
Grade |
||||
I |
Ref. |
Ref. |
Ref. |
Ref. |
II |
1.51(1.23, 1.85)a |
1.42(0.91, 2.22) |
1.23(1.07, 1.41)a |
1.29(1.17, 1.41)a |
III |
1.51(1.24, 1.85)a |
1.50(0.97, 2.32) |
1.30(1.14, 1.49)a |
1.54(1.41, 1.69)a |
IV |
1.36(0.90, 2.06) |
1.54(0.84, 2.83) |
1.45(1.20, 1.74)a |
1.65(1.46, 1.87)a |
Unknown |
1.24(1.02, 1.50)b |
1.41(0.92, 2.16) |
1.24(1.09, 1.41)a |
1.48(1.35, 1.61)a |
Histology |
||||
adenocarcinoma |
Ref. |
Ref. |
Ref. |
Ref. |
squamous carcinoma |
1.49(1.34, 1.66)a |
1.33(1.11, 1.58)a |
1.18(1.12, 1.23)a |
1.09(1.05, 1.13)a |
Others |
1.22(1.10, 1.36)a |
1.23(1.02, 1.48)b |
1.09(1.04, 1.14)a |
1.15(1.12, 1.18)a |
Radiotherapy |
||||
Yes |
Ref. |
Ref. |
Ref. |
Ref. |
No |
2.01(1.85, 2.18)a |
1.63(1.41, 1.88)a |
1.67(1.60, 1.74)a |
0.97(0.95, 0.99)b |
a: P<0.01; b: P<0.05.
DISCUSSION
In this study, we found that unmarried patients, including divorced/separated, widowed and never married, are at significantly greater risk of poorer prognosis. After adjusting for demographics, grade, histology, stage, and treatment, marriage is still associated with a reduction in the risk of death. When we analyzed the effect of marital status on OS and CSS according to stage and surgery, the results differed on different conditions. Specifically, widowed patients who underwent surgery had poorer OS at all stages, compared with other marital status. Unmarried patients who were at Stage III and Stage IV and did not receive surgery had poorer OS and CSS, compared with married patients at the same stages.
The main findings of this study are consistent with the findings of previous observational studies conducted on other types of cancer [12, 19–21], that unmarried patients had survival disadvantage over married patients. However, the significance of this study is that we analyzed the effect of marital status on the OS and CSS according to different stages and different surgery conditions and further found that non-surgical unmarried patients had even worse prognosis when diagnosed at advanced stages and that surgical widowed patients had the worst survival at all stages, which had never been investigated for NSCLC before. Moreover, the study did not verify the conclusion drawn from several relative studies that married patients are more likely to be diagnosed with early stage, in the population of NSCLC patients, but we did find that married patients are more likely to receive surgery, which had also been demonstrated in studies.
Many explanations exist for the vital question of why unmarried status is associated with poorer overall survival and cancer-specific survival after adjustment for demographics, stage, histology, and treatment. One of the most likely reason is that unmarried patients had worse adherence to the prescribed treatments than married patients [22]. Many researches had demonstrated that adherence improves the outcome of cancer patients. For example, Li et al. found that noncompliance translated into a significant increase in the failure rate of breast-conservation therapy [23]; Mccowan et al. examined tamoxifen adherence and its relationship to mortality in women with breast cancer and concluded women who have a low adherence to tamoxifen are at increased risk of death [24]; and in head/neck cancers, delayed or missed radiotherapy is related to increased risk of locoregional recurrence and death [25].
The benefit of marriage is more than that. Psychologically, marriage can relieve a patient of the depression and anxiety caused by cancer, for a spouse can share the emotional burden and provide strong social support [26]. Depression and anxiety, in part, may be a mediator of the association between marital status and the adherence of treatment, and between adherence of treatments and outcomes. Studies have demonstrated a strong relationship between marriage and the depression degree, and that the depression has a negative relationship with the adherence to treatment [27, 28]. Besides, a spouse may motivate a patient’s desire to live so the patient is more likely to take the courage to receive certain progressive therapy such as surgery. Physiologically, marriage has been found to be beneficial for endocrine, cardiovascular, and the function of immune system, though the effect magnitude primarily depends on the quality of marriage [29]. Moreover, adequate social support may lower the level of cortisol, which have been linked with natural-killer cell count and survival in cancer patients [30–32], providing a hypothesis of the basis mechanism explaining why marriage has survival advantages over ones who are not married.
The SEER database provides us the opportunity to perform large, population-based studies. However, there are several limitations that should be addressed and the results of the study should be interpreted with caution. An obvious limitation of the SEER database is the relative lack of control variables beyond simple demographics and clinical factors. For example, the database is unable to provide important confounding variables such as smoking habit, comorbidity of patients, and other treatment procedures. Secondly, marital status is not a static entity, which means marriage dissolve and reform with the progress of time. This is particularly true for elderly NSCLC patients who may have been “married” at the time of diagnosis, but “widowed” at the time of death. Thirdly, “married” may not necessarily mean “harmony” and “support”. The quality of marriage and the satisfaction degree that patients get from the marriage also have key importance on the outcome. But the database does not contain such information. Finally, this study is a retrospective observational study, so it has all the inherent limitations that an observational study may have.
Despite these potential limitations, our study indicates that unmarried patients including divorced/separated, widowed, and never married, are at greater risk of overall death and NSCLC cause-specific death. The relationship seems stronger for widowed patients and patients at advanced stages. When caring for the unmarried cancer patients, doctors should make more efforts to emphasize to patients the importance of following the advice of doctors and pay more attention to abnormity of susceptible systems during the treatment. Health care systems should take measurements to provide social support for this population to minimize the risk of death caused by marital status.
MATERIALS AND METHODS
Data source
The data utilized in this study was obtained from SEER program, which consists of 18 registries covering approximately 28 percent of the US people and routinely collects information of cancer patients including demographics, primary tumor site, cancer stage, treatment and the follow up information for survival. The database is an authoritative source of information on the incidence and survival of cancer in the United States and it has been used for many studies on the research of prognostic factors associated with various cancers [33–36].
Inclusion criteria
Patients with ICD-O-3 (International Classification of Diseases for Oncology, 3rd edition) site code C34.0-C34.9 from 2004 to 2012 was extracted from the SEER database. The inclusion criteria were as follows: (a) ICD-O-3 morphology code did not indicates small cell lung cancer (8041, 8042, 8043, 8044, and 8045);(b) age at diagnosis was older than 18 years; (c) marital status was known; (d) diagnosed with NSCLC only or multiple primary cancers but NSCLC was the first; (e) known survival time and survival time was greater than 0 month; (f) known cause of death;(g) definite AJCC TNM stage (h) known surgery and radiotherapy information.
Study variables and outcomes
Study variables in this study included gender, age at diagnosis, race, year of diagnosis, tumor grade, histologic type, AJCC TNM stage, surgical information and radiotherapy information. The patients were divided into four groups according to age (<60, 60-69,70-79, and ≥80). Race was grouped by white, black, and others (including American Indian/Alaska native, Asian/Pacific Islanders, etc.). Year of diagnosis was divided into 2004-2008 and 2009-2012. Histologic type was classified as adenocarcinoma, squamous carcinoma and others. Tumor grade I-IV represented well differentiated, moderately differentiated, poorly differentiated, and undifferentiated, respectively. Surgery and radiation were both categorized as yes (received) and no (did not receive). The “no” of the variable Surgery represented no surgery of primary site or autopsy only; while the “yes” included local tumor destruction or excision, excision or resection of less than one lobe, lobe or bilobectomy, lobe or bilobectomy extended, pneumonectomy, and extended pneumonectomy. We also included county-level median household income using the Census American Community Survey data to represent patients’ socioeconomic status. The variable was divided into quartiles: Quartile 1(<US $51250), Quartile 2(US $51250-62230), Quartile 3(US $62231-71180), and Quartile 4(>US $71180). Marital status was classified as married, divorced or separated, widowed, and never married (including single, unmarried or domestic partner).
The primary outcomes were overall survival (OS) and NSCLC cause-specific survival (CSS). OS was calculated as the number of month from diagnosis to death due to any cause. CSS was calculated as the number of month from diagnosis to death due to NSCLC. Patients who died from other causes or were still alive at the end of the study period were defined as censored.
Statistical analyses
The baseline characteristics of patients with different marital status were summarized and compared using chi-square test. Kaplan-Meier log-rank test was adopted to compare the difference of OS and CSS between subgroups of each variable. Multivariate Cox analysis was conducted to compare the OS and CSS of patients with different marital status after adjusting various covariates. We further conducted subgroup analyses, stratified by different AJCC TNM stage and whether the patient received surgery, to assess the risk of marital status and other variables on OS and CSS more specifically. All P values were two-sided, and the values less than 0.05 were considered statistically significant. All analyses were performed using SAS version 9.4 (SAS Institute Inc., Cary, NC, USA).
Abbreviations
NSCLC: Non-small cell lung cancer; OS: Overall survival; CSS: Cause-specific survival; AJCC: American Joint Committee on Cancer.
Author contributions
XG and AZ designed the study. AZ and WY analyzed and interpreted the data, and WY was a major contributor in writing the manuscript. All authors read and approved the final manuscript.
CONFLICTS OF INTEREST
The authors declare that they have no competing interests.
FUNDING
The research was supported by National Natural Science Foundation of China (Grant Number 81703322 to Ying Wu) and China Postdoctoral Science Foundation (2017M610279 to Ying Wu).
REFERENCES
1. Stewart BW, Kleihues P. World Cancer Report 2014. World Health Organization. 2015. pp. Chapter 1.1.
2. Siegel RL, Miller KD, Jemal A. Cancer statistics, 2017. CA Cancer J Clin. 2017; 67:7-30.
3. Ries L, Eisner M, Kosary C, Hankey B, Miller B, Clegg L, Mariotto A, Feuer E, Edwards B. (2005). SEER Cancer Statistics Review, 1975-2002. Bethesda, MD: National Cancer Institute.
4. Dela Cruz CS, Tanoue LT, Matthay RA. Lung cancer: epidemiology, etiology, and prevention. Clin Chest Med. 2011; 32:605-644.
5. Saito-Nakaya K, Nakaya N, Fujimori M, Akizuki N, Yoshikawa E, Kobayakawa M, Nagai K, Nishiwaki Y, Tsubono Y, Uchitomi Y. Marital status, social support and survival after curative resection in non-small-cell lung cancer. Cancer Sci. 2006; 97:206-213.
6. Saito-Nakaya K, Nakaya N, Akechi T, Inagaki M, Asai M, Goto K, Nagai K, Nishiwaki Y, Tsugane S, Fukudo S, Uchitomi Y. Marital status and non-small cell lung cancer survival: the Lung Cancer Database Project in Japan. Psychooncology. 2008; 17:869-876.
7. Jatoi A, Novotny P, Cassivi S, Clark MM, Midthun D, Patten CA, Sloan J, Yang P. Does marital status impact survival and quality of life in patients with non-small cell lung cancer? Observations from the Mayo Clinic Lung Cancer Cohort. Oncologist. 2007; 12:1456-1463.
8. Shi R, Chen Q, Yang Z, Pan G, Zhang Z, Wang WH, Liu S, Zhang D, Jiang D, Liu W. Marital status independently predicts gastric cancer survival after surgical resection--an analysis of the SEER database. Oncotarget. 2016; 7:13228-13235. https://doi.org/10.18632/oncotarget.7107.
9. Qiu M, Yang D, Xu R. Impact of marital status on survival of gastric adenocarcinoma patients: results from the Surveillance Epidemiology and End Results (SEER) Database. Sci Rep. 2016; 6:21098.
10. Zhang J, Gan L, Wu Z, Yan S, Liu X, Guo W. The influence of marital status on the stage at diagnosis, treatment, and survival of adult patients with gastric cancer: a population-based study. Oncotarget. 2017; 8:22385-22405. https://doi.org/10.18632/oncotarget.7399.
11. Li Q, Lu G, Liang L, Li X, Cai S. The influence of marital status on stage at diagnosis and survival of patients with colorectal cancer. Oncotarget. 2015; 6:985-988. https://doi.org/10.18632/oncotarget.3129.
12. Wang L, Wilson SE, Stewart DB, Hollenbeak CS. Marital status and colon cancer outcomes in US Surveillance, Epidemiology and End Results registries: does marriage affect cancer survival by gender and stage? Cancer Epidemiol. 2011; 35:417-422.
13. He XK, Lin ZH, Qian Y, Xia D, Jin P, Sun LM. Marital status and survival in patients with primary liver cancer. Oncotarget. 2017; 8:64954-64963. https://doi.org/10.18632/oncotarget.11066.
14. Wang XD, Qian JJ, Bai DS, Li ZN, Jiang GQ, Yao J. Marital status independently predicts pancreatic cancer survival in patients treated with surgical resection: an analysis of the SEER database. Oncotarget. 2016; 7:24880-24887. https://doi.org/10.18632/oncotarget.8467.
15. Chen Z, Pu L, Gao W, Zhang L, Han G, Zhu Q, Li X, Wu J, Wang X. Influence of marital status on the survival of adults with extrahepatic/intrahepatic cholangiocarcinoma. Oncotarget. 2017; 8:28959-28970. https://doi.org/10.18632/oncotarget.16330.
16. Li M, Dai CY, Wang YN, Chen T, Wang L, Yang P, Xie D, Mao R, Chen C. Marital status is an independent prognostic factor for tracheal cancer patients: an analysis of the SEER database. Oncotarget. 2016; 7:77152-77162. https://doi.org/10.18632/oncotarget.12809.
17. Shi X, Zhang TT, Hu WP, Ji QH. Marital status and survival of patients with oral cavity squamous cell carcinoma: a population-based study. Oncotarget. 2017; 8:28526-28543. https://doi.org/10.18632/oncotarget.16095.
18. Wu C, Chen P, Qian JJ, Jin SJ, Yao J, Wang XD, Bai DS, Jiang GQ. Effect of marital status on the survival of patients with hepatocellular carcinoma treated with surgical resection: an analysis of 13,408 patients in the surveillance, epidemiology, and end results (SEER) database. Oncotarget. 2016; 7:79442-79452. https://doi.org/10.18632/oncotarget.12722.
19. Aizer AA, Chen MH, Mccarthy EP, Mendu ML, Koo S, Wilhite TJ, Graham PL, Choueiri TK, Hoffman KE, Martin NE. Marital status and survival in patients with cancer. J Clin Oncol. 2013; 31:3869.
20. Adekolujo OS, Tadisina S, Koduru U, Gernand J, Smith SJ, Kakarala RR. Impact of marital status on tumor stage at diagnosis and on survival in male breast cancer. Am J Mens Health. 2016.
21. Shi RL, Qu N, Lu ZW, Liao T, Gao Y, Ji QH. The impact of marital status at diagnosis on cancer survival in patients with differentiated thyroid cancer. Cancer Med. 2016; 5:2145-2154.
22. Cohen SD, Sharma T, Acquaviva K, Peterson RA, Patel SS, Kimmel PL. Social support and chronic kidney disease: an update. Adv Chronic Kidney Dis. 2007; 14:335-344.
23. Li BD, Brown WA, Ampil FL, Burton GV, Yu H, Mcdonald JC. Patient compliance is critical for equivalent clinical outcomes for breast cancer treated by breast-conservation therapy. Ann Surg. 2000; 231:883-889.
24. Mccowan C, Shearer J, Donnan PT, Dewar JA, Crilly M, Thompson AM, Fahey TP. Cohort study examining tamoxifen adherence and its relationship to mortality in women with breast cancer. Br J Cancer. 2011; 20:327.
25. Pajak TF, Laramore GE, Marcial VA, Fazekas JT, Cooper J, Rubin P, Curran WJ Jr, Davis LW. Elapsed treatment days--a critical item for radiotherapy quality control review in head and neck trials: RTOG report. Int J Radiat Oncol Biol Phys. 1991; 20:13-20.
26. Goldzweig G, Andritsch E, Hubert A, Brenner B, Walach N, Perry S, Baider L. Psychological distress among male patients and male spouses: what do oncologists need to know? Ann Oncol. 2010; 21:877-883.
27. Dimatteo MR, Lepper HS, Croghan TW. Depression is a risk factor for noncompliance with medical treatment: meta-analysis of the effects of anxiety and depression on patient adherence. Arch Intern Med. 2000; 160:2101-2107.
28. Weissman MM, Bland RC, Canino GJ, Faravelli C, Greenwald S, Hwu HG, Joyce PR, Karam EG, Lee CK, Lellouch J. Cross-national epidemiology of major depression and bipolar disorder. JAMA. 1900; 276:293-299.
29. Gallo LC, Troxel WM, Matthews KA, Kuller LH. Marital status and quality in middle-aged women: associations with levels and trajectories of cardiovascular risk factors. Health Psychol. 2003; 22:453.
30. Herberman RB, Ortaldo JR. Natural killer cells: their roles in defenses against disease. Science. 1981; 214:24-30.
31. Faqih SA. 514 Diurnal cortisol rhythm as a predictor of breast cancer survival. EJC Suppl. 2010; 8:210.
32. Sephton SE, Sapolsky RM, Kraemer HC, Spiegel D. Diurnal cortisol rhythm as a predictor of breast cancer survival. J Natl Cancer Inst. 2000; 92:994-1000.
33. Koay EJ, Teh BS, Paulino AC, Butler EB. A Surveillance, Epidemiology, and End Results analysis of small cell carcinoma of the bladder: epidemiology, prognostic variables, and treatment trends. Cancer. 2011; 117:5325-5333.
34. Hamid MS, Shameem R, Gafoor K, George J, Mina B, Sullivan K. Non-small-cell lung cancer clinicopathologic features and survival outcomes in Asian Pacific Islanders residing in the United States: a SEER analysis. J Cancer Epidemiol. 2015; 2015:269304.
35. Datta GD, Neville BA, Kawachi I, Datta NS, Earle CC. Marital status and survival following bladder cancer. J Epidemiol Community Health. 2009; 63:807-813.
36. Khan HM, Gabbidon K, Saxena A, Abdool-Ghany F, Dodge JM 3rd, Lenzmeier T. Disparities in cervical cancer characteristics and survival between White Hispanics and White Non-Hispanic women. J Womens Health. 2016; 25:1052-1058.