
INTRODUCTION
Cervical cancer is the fourth most common gynecologic malignancy, and the fourth leading cause of cancer related deaths in women all over the world [1]. Although the standard treatment concurrent chemo-radiotherapy (CCRT) greatly extended the overall survival time of women with advanced diseases, approximately 40% of those patients would undergo recurrence [2, 3]. If there is a reliable prognostic biomarker before or at early stage of therapy, individualized therapeutic regimens can be developed, and more intensive follow-up or clinical trials can be under consideration for patients with probably poor prognosis.
The predictive efficiency of morphological indexes such as maximal tumor diameter (MTD) seemed limited based on previous studies, since treatment induced morphologic alterations occurred after tumor molecular and biological changes [4]. Functional sequences such as diffusion weighted (DW) imaging has been incorporated into routine protocols of pelvic MR imaging nowadays. It measures water molecular diffusion in terms of apparent diffusion coefficient (ADC) value and brings a better understanding into tumor microstructures noninvasively [5]. It was reported that cervical cancers with lower pre-treatment ADC values were at a higher risk of recurrence [6, 7]. And a lower rise of ADC values in early stage of CCRT may help predict a poor prognosis in patients with cervical cancers [8, 9].
However, only mean ADC value obtained from one region of interest (ROI) was used in most previous studies. A whole-lesion histogram-based approach could derive a series of features and reflect the microstructural heterogeneity of tumors by classifying portions with different diffusivities [10]. Some retrospective studies have shown that pretreatment ADCmean and ADC percentiles were significantly lower in cervical cancers with recurrence compared to those without recurrence [4, 11-12].
Texture analysis based on ADC maps is an emerging modality to extract texture features describing local and regional relationships between pixels within the ROIs, which can better reflect intratumoral heterogeneity [13]. A recent study demonstrated the efficacy of texture analysis for predicting treatment response to chemoradiotherapy in nasopharyngeal carcinoma [14]. To the best of our knowledge, applications of this technique in predicting the prognosis of cervical cancer have not been reported yet.
Hence, the purpose of this study was to investigate whether pre- and mid-treatment ADC parameters including histogram features and texture features can serve as effective biomarkers for predicting tumor recurrence of patients with cervical cancers treated with CCRT.
RESULTS
Follow-up results
During a mean follow-up of 25 months (range, 11 ~ 43), 10 patients (10/36, 27.8%; mean age, 51.1 years) were classified into the recurrence group (5 local recurrences, 5 deaths caused by cervical cancer), and the remaining 26 patients (26/36, 72.2%; mean age, 53.5 years) belonged to the nonrecurrence group. FIGO stages in the recurrence group included IIA (n = 1), IIB (n = 3), IIIB (n = 3) and IVA (n = 3). FIGO stages in the nonrecurrence group included IIA (n = 5), IIB (n = 10), IIIA (n = 2), IIIB (n = 5) and IVA (n = 4). The recurrence incidence of high FIGO staging (stage III or above) group (6/17, 35.3%) seemed higher than that of low FIGO staging (stage IIA, IIB) group (4/19, 21.0%), yet without significance (P = 0.281). FIGO staging is not sufficient to accurately predict therapeutic response or prognosis of cervical cancer [15]. Hence, we did not use FIGO staging as a prognostic factor in this study.
Since none of the patients underwent surgical lymphadenectomy, we used size (short axis > 8–10 mm) as the main imaging criterion for discriminating normal from metastatic pelvic lymph node (PLN). Among 11 patients in PLN positive group, 6 patients had tumor recurrence. Among 25 patients in PLN negative group, 4 patients had tumor recurrence. The incidence of recurrence was significantly higher in the PLN positive group compared to the PLN negative group (54.5% vs. 16.0%, P = 0.026). Due to the low sensitivity of determining lymph node status on MR imaging, we also did not use lymph node status as a prognostic factor in this study.
Representative cases of cervical cancer that showed significant difference of ADC histogram between patients with different prognosis before and at the end of 2nd week of CCRT are shown in Figure 1.
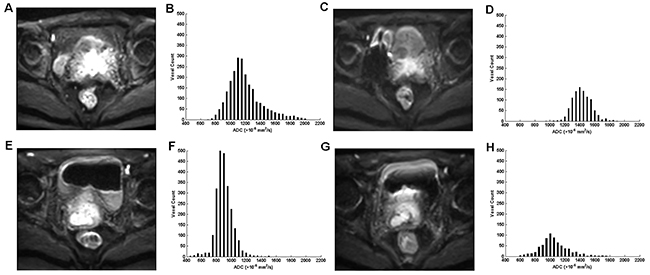
Figure 1:Diffusion weighted (DW) magnetic resonance images (b = 800 s/mm2) and the corresponding apparent diffusion coefficient (ADC) histograms of two representative patients. (A-D) A 52-year-old woman with advanced cervical cancer (the international federation of gynecology and obstetrics (FIGO) stage IIIB) receiving concurrent chemo-radiotherapy (CCRT) achieved complete remission in the follow-up process. (E-H) A 53-year-old woman with advanced cervical cancer (FIGO stage IIIB) receiving CCRT died six months after CCRT completion. (A, E) DW images before CCRT; (B, F) ADC histograms before CCRT show significant difference between the two patients; (C, G) DW images at the end of 2nd week of CCRT; (D, H) ADC histograms at the end of 2nd week of CCRT show significant difference between the two patients.
Predictive value of morphological parameters
As shown in Table 1, pre- and mid-CCRT MTD, area and volume showed no statistical differences between the recurrence and nonrecurrence group (all P > 0.05).
Table 1: Comparison of pre- and mid-CCRT morphological parameters between the recurrence and nonrecurrence group of patients with cervical cancers treated with CCRT
Time point |
Parameters |
Nonrecurrence group |
Recurrence group |
P value |
|---|---|---|---|---|
MTD |
50.88 ± 12.18 |
46.43 ± 12.69 |
0.338 |
|
pre-CCRT |
area |
7158.69 ± 4799.17 |
4629.76 ± 3682.28 |
0.143 |
volume |
37722.58 ± 24177.35 |
25585.26 ± 22700.66 |
0.179 |
|
MTD |
38.19 ± 14.53 |
39.01 ± 15.32 |
0.891 |
|
mid-CCRT |
area |
3784.85 ± 3888.81 |
2799.83 ± 3168.86 |
0.511 |
volume |
19566.62 ± 20111.85 |
14221.14 ± 15742.34 |
0.488 |
Note: Data are presented as mean ± standard deviation. CCRT = concurrent chemo-radiotherapy; MTD = maximal tumor diameter.
Predictive value of ADC first-order statistics
As shown in Table 2, pre- and mid-CCRT ADCmean of the recurrence group were significantly lower than those of the nonrecurrence group (P = 0.018, 0.002, respectively). ROC analysis showed that pre-CCRT ADCmean could not predict prognosis (P = 0.061) while mid-CCRT ADCmean had a good prognostic value (P = 0.006).
Table 2: Comparison of pre- and mid-CCRT ADC histogram features between the recurrence and nonrecurrence group of patients with cervical cancers treated with CCRT and their diagnostic performance
Time point |
Parameters |
Nonrecurrence group |
Recurrence group |
P value# |
Sensitivity |
Specificity |
Accuracy |
AUC (95% CI) |
P value+ |
|---|---|---|---|---|---|---|---|---|---|
pre-CCRT |
ADCmean |
1064.76 ± 67.44 |
983.71 ± 127.25 |
0.018* |
84.6 |
60.0 |
77.8 |
0.704 (0.495, 0.913) |
0.061 |
5th |
726.38 ± 134.77 |
699.90 ± 170.40 |
0.627 |
65.4 |
50.0 |
61.1 |
0.521 (0.292, 0.751) |
0.846 |
|
10th |
784.54 ± 121.82 |
752.60 ± 160.58 |
0.524 |
69.2 |
50.0 |
63.9 |
0.538 (0.313, 0.764) |
0.724 |
|
25th |
876.00 ± 109.89 |
838.10 ± 145.96 |
0.404 |
53.8 |
70.0 |
58.3 |
0.606 (0.395, 0.817) |
0.331 |
|
50th |
999.31 ± 90.45 |
943.10 ± 136.08 |
0.157 |
57.7 |
70.0 |
61.1 |
0.633 (0.419, 0.846) |
0.223 |
|
75th |
1201.46 ± 73.89 |
1090.10 ± 125.99 |
0.002** |
96.2 |
50.0 |
83.4 |
0.781 (0.602, 0.960) |
0.010* |
|
90th |
1448.50 ± 146.79 |
1273.30 ± 122.28 |
0.002** |
69.2 |
90.0 |
75.0 |
0.819 (0.680, 0.959) |
0.003* |
|
skewness |
2.23 ± 1.11 |
1.91 ± 0.79 |
0.411 |
69.2 |
60.0 |
66.6 |
0.615 (0.405, 0.825) |
0.289 |
|
kurtosis |
12.93 ± 9.22 |
11.14 ± 5.05 |
0.567 |
38.5 |
80.0 |
50.0 |
0.535 (0.327, 0.742) |
0.751 |
|
entropy |
6.23 ± 0.58 |
6.10 ± 0.27 |
0.507 |
69.2 |
70.0 |
69.4 |
0.658 (0.480, 0.835) |
0.148 |
|
mid-CCRT |
ADCmean |
1333.24 ± 123.96 |
1171.21 ± 108.11 |
0.002** |
90.0 |
66.7 |
82.8 |
0.822 (0.662, 0.983) |
0.006* |
5th |
975.60 ± 204.60 |
833.33 ± 169.51 |
0.080 |
60.0 |
88.9 |
69.0 |
0.700 (0.503, 0.897) |
0.090 |
|
10th |
1054.70 ± 184.67 |
902.44 ± 146.32 |
0.038* |
55.0 |
88.9 |
65.5 |
0.711 (0.518, 0.905) |
0.073 |
|
25th |
1161.75 ± 159.14 |
1006.89 ± 132.06 |
0.017* |
55.0 |
88.9 |
65.5 |
0.764 (0.581, 0.947) |
0.025* |
|
50th |
1292.55 ± 135.23 |
1147.67 ± 116.64 |
0.010* |
90.0 |
66.7 |
82.8 |
0.794 (0.615, 0.974) |
0.012* |
|
75th |
1472.70 ± 121.57 |
1297.00 ± 111.84 |
0.001** |
65.0 |
100.0 |
75.9 |
0.850 (0.712, 0.988) |
0.003* |
|
90th |
1665.95 ± 140.67 |
1482.67 ± 196.97 |
0.008* |
85.0 |
77.8 |
82.8 |
0.822 (0.621, 1.000) |
0.006* |
|
skewness |
1.38 ± 1.09 |
1.14 ± 1.30 |
0.613 |
85.0 |
44.4 |
72.4 |
0.567 (0.320, 0.814) |
0.572 |
|
kurtosis |
8.99 ± 6.82 |
8.17 ± 7.04 |
0.769 |
50.0 |
77.8 |
58.6 |
0.561 (0.324, 0.798) |
0.604 |
|
entropy |
5.75 ± 0.93 |
5.68 ± 0.69 |
0.844 |
30.0 |
100.0 |
51.7 |
0.572 (0.364, 0.780) |
0.540 |
Note: Data are presented as mean ± standard deviation; ADCmean and all percentile values are in unit of × 10-6 mm2/s; CCRT, concurrent chemo-radiotherapy; ADC, apparent diffusion coefficient; AUC, area under receiver operating characteristic (ROC) curve; CI, confidence interval; P value#, with independent samples t test; P value+, with ROC analysis; * P value < 0.05; ** P value < 0.005 (adjusted significance level).
Before CCRT, only two ADC percentiles (75th and 90th) differed significantly between patients with different prognosis (P = 0.002). After two weeks of treatment, up to five ADC percentiles (10th, 25th, 50th, 75th, 90th) were significantly lower in the recurrence group (all P < 0.05).
Nevertheless, ADC histogram shape related parameters, including skewness, kurtosis and entropy, showed no statistical differences between patients with different prognosis (all P > 0.05).
Predictive value of ADC texture features
As shown in Table 3, before CCRT, correlation and autocorrelation showed significant differences between patients with different prognosis (P = 0.026, 0.006, respectively). After 2 weeks of CCRT, only one texture feature autocorrelation could distinguish between the recurrence and nonrecurrence group (P = 0.002).
Table 3: Comparison of pre- and mid-CCRT ADC texture features between the recurrence and nonrecurrence group of patients with cervical cancers treated with CCRT and their diagnostic performance
Time point |
Parameters |
Nonrecurrence group |
Recurrence group |
P value# |
Sensitivity |
`Specificity |
Accuracy |
AUC (95% CI) |
P value+ |
|---|---|---|---|---|---|---|---|---|---|
pre-CCRT |
correlation |
8.76 (6.17, 12.59) |
23.98 (12.73, 34.98) |
0.026* |
80.0 |
73.1 |
75.0 |
0.742 (0.547, 0.938) |
0.026* |
autocorrelation |
88689.45 (73619.12, 101094.67) |
62330.77 (55900.31, 71437.64) |
0.006** |
76.9 |
80.0 |
77.8 |
0.792 (0.598, 0.986) |
0.007* |
|
entropy(H) |
11.31 (9.07, 12.18) |
11.30 (10.43, 11.75) |
0.903 |
100.0 |
34.6 |
52.8 |
0.515 (0.329, 0.702) |
0.888 |
|
homogeneity |
8561.20 (6976.18, 10457.48) |
9823.74 (6774.34, 10661.50) |
0.689 |
50.0 |
73.1 |
66.9 |
0.546 (0.317, 0.776) |
0.672 |
|
mid-CCRT |
correlation |
14.87 (6.65, 24.34) |
23.78 (20.25, 39.13) |
0.116 |
77.8 |
60.0 |
65.5 |
0.689 (0.472, 0.906) |
0.109 |
autocorrelation |
119709.75 (104566.62, 137939.81) |
93120.65 (73795.97, 106326.00) |
0.002** |
95.0 |
66.7 |
86.2 |
0.844 (0.686, 1.000) |
0.003* |
|
entropy(H) |
10.20 (7.55, 11.50) |
9.92 (8.69, 11.66) |
0.982 |
50.0 |
66.7 |
55.2 |
0.506 (0.289, 0.722) |
0.962 |
|
homogeneity |
7150.19 (6082.49, 8873.28) |
9071.10 (7078.09, 10696.41) |
0.167 |
66.7 |
75.0 |
72.4 |
0.667 (0.444, 0.889) |
0.157 |
Note: Data are presented as median (interquartile range); Correlation and homogeneity values are in unit of × 10-5 mm2/s and autocorrelation are in unit of × 10-6 mm2/s; CCRT, concurrent chemo-radiotherapy; ADC, apparent diffusion coefficient; AUC, area under receiver operating characteristic (ROC) curve; CI, confidence interval; P value#, with independent samples t test; P value+, with ROC analysis; * P value < 0.05; ** P value < 0.013 (adjusted significance level).
After performing test correction, pre-CCRT 75th, pre-CCRT 90th, pre-CCRT autocorrelation, mid-CCRT ADCmean, mid-CCRT 75th and mid-CCRT autocorrelation could still distinguish patients with different prognosis, and we included those parameters in the multivariate stepwise logistic regression analysis. The results showed that the two independent differentiating variables were pre-CCRT 90th (P = 0.0002) and mid-CCRT 75th (P = 0.0005). Using the cutoff of 1376.50 × 10-6 mm2/s for the pre-CCRT 90th percentile, ADC histogram analysis had an accuracy of 86.1 % and made accurate predictions for 31 of the 36 patients. Using the cutoff of 1428.50 × 10-6 mm2/s for the mid-CCRT 75th percentile, ADC histogram analysis had an accuracy of 83.3 % and made accurate predictions for 30 of the 36 patients.
Mid-CCRT 75th, autocorrelation, ADCmean and pre-CCRT 90th showed the largest AUCs in the prediction of tumor recurrence; the AUCs were 0.850, 0.844, 0.822 and 0.819, respectively (all P < 0.01). The ROC curves as well as Box-and-whisker plots of those important parameters were shown as Figure 2 and Figure 3.
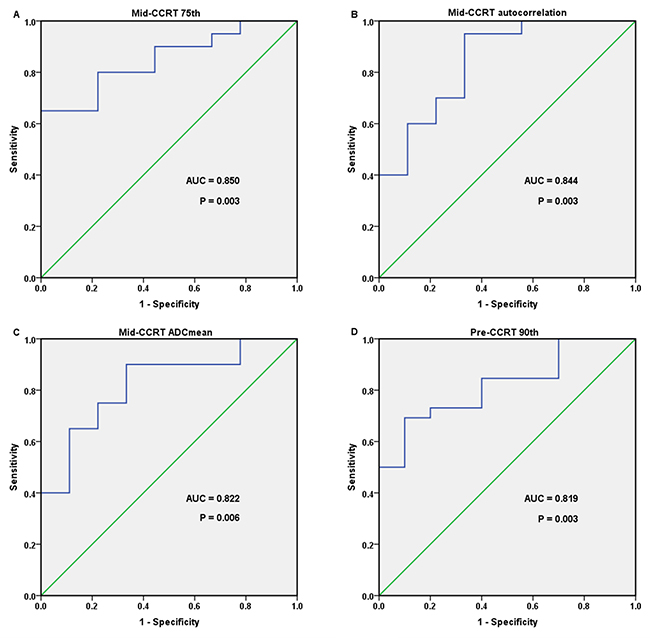
Figure 2: Receiver operating characteristic (ROC) curves of four important parameters that showed the largest area under the curves (AUCs) in the prediction of cervical cancer recurrence treated with concurrent chemo-radiotherapy (CCRT). (A) mid-CCRT 75th, with an AUC of 0.850; (B) mid-CCRT autocorrelation, with an AUC of 0.844; (C) mid-CCRT ADCmean, with an AUC of 0.822; (D) pre-CCRT 90th, with an AUC of 0.819.
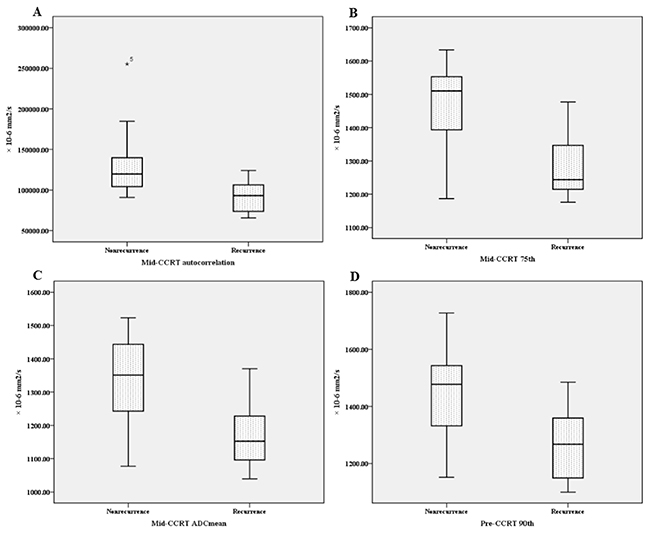
Figure 3: Box-and-whisker plots of four important parameters which all differed significantly between cervical cancer patients with different prognosis after undergoing concurrent chemo-radiotherapy (CCRT). (A) mid-CCRT autocorrelation; (B) mid-CCRT 75th; (C) mid-CCRT ADCmean; (D) pre-CCRT 90th.
Predictive value of parameters change rates
The change rates of three morphological parameters showed no significant differences between the recurrence and nonrecurrence group. Similarly, no change rate index of ADC histogram or texture features at the end of 2nd week of CCRT was proved useful in prognostic prediction (all P > 0.05). The details were shown in the Supplementary Table 1.
Inter-observer reproducibility
As shown in Table 4, the inter-observer agreements achieve at least good for all the ADC histogram and texture parameters.
Table 4: Inter-observer agreements for the ADC histogram and texture parameters of cervical cancer patients
Parameter |
ICC (pre-CCRT) |
ICC (mid-CCRT) |
|---|---|---|
ADCmean |
0.86 (0.79 - 0.96) |
0.94 (0.77 - 0.98) |
5th |
0.99 (0.97 - 0.99) |
0.99 (0.96 - 0.99) |
10th |
0.99 (0.98 - 0.99) |
0.99 (0.96 - 0.99) |
25th |
0.98 (0.94 - 0.99) |
0.89 (0.74 - 0.98) |
50th |
0.94 (0.78 - 0.98) |
0.96 (0.85 - 0.99) |
75th |
0.79 (0.62 - 0.94) |
0.89 (0.77 - 0.97) |
90th |
0.79 (0.611 - 0.895) |
0.86 (0.77 - 0.97) |
skewness |
0.85 (0.41 - 0.96) |
0.70 (0.22 - 0.93) |
kurtosis |
0.94 (0.72 - 0.98) |
0.75 (0.03 - 0.94) |
entropy |
0.61 (0.36 - 0.90) |
0.92 (0.69 - 0.98) |
correlation |
0.93 (0.73 - 0.98) |
0.88 (0.66 - 0.97) |
autocorrelation |
0.86 (0.70 - 0.97) |
0.97 (0.88 - 0.99) |
entropy(H) |
0.88 (0.64 - 0.97) |
0.96 (0.83 - 0.99) |
homogeneity |
0.71 (0.63 - 0.93) |
0.93 (0.74 - 0. 98) |
Note: ADC, apparent diffusion coefficient; CCRT, concurrent chemo-radiotherapy; ICC, intra-class correlation coefficient; ICC, 0.00 - 0.40 poor; 0.41 - 0.60 fair; 0.61 - 0.80 good; 0.81 - 1.00 excellent. Contents in parentheses are 95% confidence interval.
DISCUSSION
In this study, we demonstrated that ADC histogram and texture parameters before and at the early stage of CCRT could predict tumor recurrence of patients with advanced cervical cancers.
Morphological parameters MTD, area, volume and their change rates between pre- and mid-CCRT showed no statistical differences between the recurrence and nonrecurrence group, indicating that the prognostic value of ADC histogram and texture features is superior to traditional morphological parameters for cervical cancer underwent CCRT.
ADCmean is the most basic and commonly used parameter. We found that patients with tumor recurrence showed lower pre-CCRT ADCmean, but we found it helpless to predict long-term outcome. Erbay et al. [12] also found that ADCmean before CCRT was significantly lower in cervical cancer patients with tumor recurrence compared with those without recurrence. However, Heo et al. [4] reported just the opposed results. Somoye et al. [8] and Bae et al. [9] also reported that pre-treatment ADCmean did not show any differences between good and poor long-term prognoses in cervical cancers. This discrepancy may be due to the following explanations: (1) the ROI placement with or without necrotic area in the tumors, while our study drew VOIs of the whole tumor (including cystic and necrotic areas) instead of traditional ROI (only one slice); (2) tumor heterogeneity, while our study contains various ADC histogram and texture parameters which can reflect the tumor heterogeneity. For example, the low and high ADC percentiles represent different components of the tumor and higher autocorrelation indicates less heterogeneous the tumor is; and (3) different MR protocols and parameters, which need to be standardized in the future. Thus, pre-treatment ADCmean may not be an eligible prognostic biomarker for cervical cancer. Fortunately, we found that mid-CCRT ADCmean had a good prognostic value for patients with cervical cancers. Bae et al. [9] also reported that mid-treatment ADCmean was significantly lower in tumor recurrence group and could serve as a useful prognostic biomarker.
Our results showed that pre-CCRT 75th and 90th ADC percentiles were significantly lower in the recurrence group. Erbay et al. [12] also found that patients with tumor recurrence showed lower pre-treatment 75th and 90th ADC percentiles, which were independent prognostic factors for both overall survival and disease-free survival. It was raised that lower 75th and 90th ADC percentiles might represent less cystic or necrotic regions within the tumor, namely a greater proportion of solid tumor may indicate a higher risk of recurrence. After 2 weeks of CCRT, more ADC percentiles showed significant differences between different prognosis in our study.
Another interesting finding about ADC percentiles was that the high ADC percentiles (75th, 90th) showed higher AUCs than the low ADC percentiles (10th, 25th, 50th). And pre-CCRT 90th and mid-CCRT 75th were the two independent differentiating variables. Heo et al. [4] also demonstrated pre-treatment 75th ADC percentile was a significant predictor for cervical cancer recurrence while 25th and 50th had no prognostic value. We speculated that the high ADC percentiles are related with tumor necrosis while the low percentiles are mainly determined by tumor cell density. Necrotic tumors are prone to progression and recurrence after chemo-radiotherapy on account of hypoxia and poor perfusion [16]. However, other tumors did not follow this rule. For instance, Song et al. [17] reported that 5th ADC percentile was the most promising parameter for differentiating true progression from pseudoprogression of glioblastomas treated with CCRT. And Donati et al. [18] found that 10th ADC percentile correlated with Gleason score better than other ADC parameters in prostate cancer.
ADC texture analysis is mainly applied in distinction between benign and malignant tumors and differentiating tumor grades [19-24], seldom in prognosis prediction. We found that pre-CCRT correlation and autocorrelation could differentiate between the recurrence and nonrecurrence group. Yun et al. [23] reported that pre-treatment correlation could help to determine intratumoral spatial heterogeneity of necrotic patterns, which may be the basis for its predictive value. Autocorrelation reflected the similarity of the ADC pairs. The higher autocorrelation was, the less heterogeneous the tumor was. In this study, both pre- and mid-CCRT autocorrelation were significantly lower in the recurrence group, indicating that tumor recurrence was associated with greater heterogeneity within the tumor.
Due to our limited sample size (only 36 patients), we used all the cases as modeling group. For internal validation, we retrospectively analyzed 10 patients with advanced cervical squamous cell carcinomas treated with CCRT. All those 10 patients underwent routine pelvic MR examination including DWI before CCRT. During follow-up (median, 20 months; range, 17 ~ 34 months), 3 patients reported pelvic tumor recurrence and the others achieved complete remission. We performed ADC histogram and texture analysis for pre-CCRT MR imaging and the relevant parameters for prognosis are listed in the Supplementary Table 2. According to our thresholds established from the previous 36 modeling patients, we found that 9/10 (90%) patients were accurately predicted by using 75th percentile and 8/10 (80%) patients were accurately predicted by using 90th percentile or correlation. Since those 10 patients did not undergo MR examination 2 weeks after the initiation of CCRT, the predictive power of mid-CCRT parameters could not be validated. In the future, we will continue to collect more cases for further internal validation, and try our best to perform external validation.
Our study had several limitations. Firstly, only 36 patients with squamous carcinomas were included, which might cause some bias. Yet it was enough for a pilot prospective study. A larger cohort with multiple pathological subtypes is required to confirm the findings in this study. Secondly, the follow-up was relatively short and there might be a few additional recurrences with a longer follow-up. Thirdly, only two b values of 0 and 800 s/mm2 were applied in the DW sequence of the current study and the use of b0 may cause inaccuracy when calculating ADC values. Acquiring DW images using a range of b values or using a multi-exponential fit could provide more accurate estimation of tumor cellularity [24].
In summary, whole-lesion ADC histogram and texture analysis hold great potential in predicting tumor recurrence in cervical cancer treated with CCRT. Pre-CCRT 90th and mid-CCRT 75th were considered to be the two most important and independent factors associated with the prognosis. This technique could be applied to identify patients at higher risks of recurrence before or at early stage of treatment, which may help to optimize therapeutic regimens or undertake more intensive follow-ups.
MATERIALS AND METHODS
Patients
This prospective study was approved by the local ethics committee, and written informed consent was obtained from all patients. From April 2013 to August 2015, 40 women with histologically proven untreated cervical cancer (International Federation of Gynecology and Obstetrics (FIGO) IIA ~ IVA), scheduled to undergo CCRT were consecutively recruited. 4 patients were excluded for the following reasons: patients who failed to complete MR examinations or the full course of CCRT due to personal reasons (n = 2); poor quality of DW images due to patient motion or magnetic susceptibility artifacts (n = 2). Finally, a total of 36 women (all cervical squamous carcinomas, mean age, 53 years; age range, 25 ~ 77) were included in this study (Figure 4). The FIGO stage was determined by clinical evaluation consensus with MRI evaluation. The FIGO stages included IIA (n = 6), IIB (n = 13), IIIA (n = 2), IIIB (n = 8), IVA (n = 7).
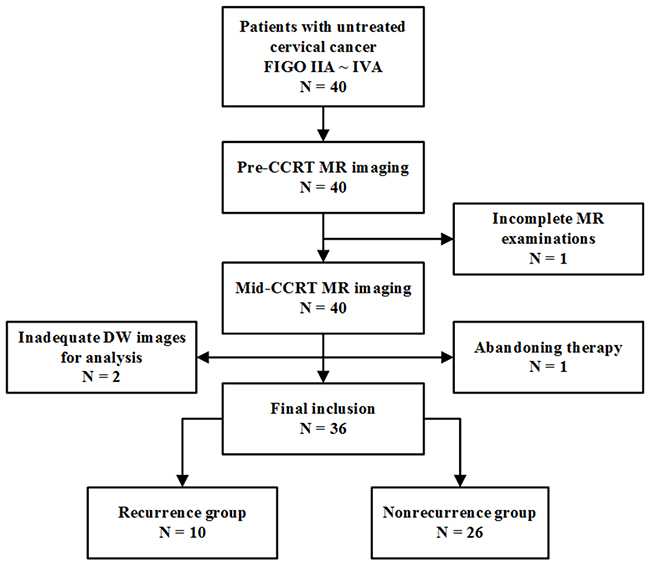
Figure 4: Flowchart of the study population. FIGO = International Federation of Gynecology and Obstetrics, CCRT = concurrent chemo-radiotherapy.
All patients underwent 5-weeks external beam radiation therapy (EBRT) followed by 3-weeks intracavitary brachytherapy (ICBT). EBRT was delivered to the whole pelvis at 1.8-2.0 Gy daily with a total dose of 45-50 Gy. ICBT was given to point A at a fraction dose of 5 Gy with a total dose of 30-40 Gy. Six cycles of weekly nedaplatin or four cycles of bi-weekly nedaplatin plus paclitaxel/docetaxel was given concomitantly.
MR imaging
All patients were scheduled to undergo MR examination twice: within 2 weeks before CCRT (pre-CCRT) and at the end of 2nd week during CCRT (mid-CCRT). All examinations were performed on a 3.0-T MR scanner (Ingenia 3.0 T, Philips Healthcare, Best, the Netherlands) with a 16-channel torso phased-array body coil. The scan range was set to cover the whole pelvis. All patients were asked to take clyster 2-3 hours before the MR examination in order to reduce artifacts induced by gas and feces within the rectum. The standard MR scan protocol was kept identical each time as follows: axial T1-weighted turbo spin-echo (TSE) sequence (repetition time (TR) = 500 ms, echo time (TE) = 12 ms, matrix size = 282 × 400, field of view (FOV) = 35 cm × 40 cm, slice thickness = 4 mm, intersection gap = 0.5 mm, number of signal averages (NSA) = 1), axial T2-weighted TSE sequence (TR = 4,500 ms, TE = 90 ms, matrix size = 308 × 402, FOV = 20 cm × 24 cm, slice thickness = 4 mm, intersection gap = 0.5 mm, NSA = 1), sagittal T2-weighted TSE sequence (TR = 4500 ms, TE = 90 ms, matrix size = 480 × 354, FOV = 20 × 24 cm, slice thickness = 4 mm, intersection gap = 0.5 mm, NSA = 1), axial DW free-breathing spin-echo echo-planar-imaging sequence (TR = 3523-6000 ms, TE = shortest ms, matrix size = 132 × 157, FOV = 24 cm × 24 cm, slice thickness = 4 mm, intersection gap = 1 mm, NSA = 2, b value = 0 and 800 s /mm2). axial and sagittal contrast enhancerd-T1 high resolution isotropic volume examination (e-THRIVE) sequences (TR = shortest ms, TE = shortest ms, matrix size = 256 × 194, FOV = 30 × 40cm, slice thickness = 1.5 mm, intersection gap = 0 mm, NSA = 1) was also acquired after intravenous injection of 0.2 mL per kilogram of body weight Gadodiamide (Omniscan, GE Healthcare, Shanghai, China).
Image analysis
Axial DW images were loaded into a workstation (Extended MR Workspace 2.6.3.4; Philips Medical Systems, Best, the Netherlands) and ADC maps were generated automatically using the mono-exponential model. Then DW images and the corresponding ADC maps were imported into our in-house software (Image Analyzer 1.0, Nanjing, China). The whole-lesion analysis was performed by two radiologists (*BLINDED*, with 5 and 8 years’ experience in gynecological imaging, respectively) independently, who were unaware of patients’ outcomes. Cervical cancers presented as hypointense on ADC maps, hyperintense on T2-weighted and DW images, with remarkable enhancement on e-THRIVE images. ROIs were manually drawn slice by slice on the DW images (b = 800 s/mm2) to include as much tumor area as possible including cystic and necrotic areas with reference to other sequences. The outlines of ROIs drawn on each slice would be automatically copied to the exact same location of the corresponding ADC maps in our software in real time.
All the ROIs that covered the entire tumor were selected to derive the volume of interest (VOI). Then a button was clicked in our software, and 3 kinds of parameters were generated automatically: (1) morphological parameters, including maximal tumor diameter (MTD), area (the area of all the ROIs) and volume; (2) ADC histogram features, including ADCmean, ADC percentiles (5th, 10th, 25th, 50th, 75th and 90th percentiles), skewness, kurtosis and entropy; (3) ADC texture features, including correlation, autocorrelation, entropy(H) and homogeneity.
ADC histogram features have been commonly described in previous studies [10, 25]. Such parameters refer to the frequency of the intensity of gray levels without considering the spatial relationship between them. Texture features in our study were derived from the gray level co-occurrence matrix (GLCM) within the VOI. A GLCM is a constructed matrix in which P(i, j) describes the probability of a pair of gray levels (i and j) occurring in an image. Every pair of gray levels is separated by a certain distance in a certain direction. In our work, the GLCMs were calculated with distance of one voxel and direction angles of 0, 45, 90 and 135, respectively. We took average values of GLCMs in the four directions as the final values of texture features. The formulas of texture features in this study were listed as follows:
Where G is the number of gray levels within the VOI, σ is the standard deviation of GLCM element, and μ is the mean of P(i, j). Definitions and demonstrations of ADC parameters above are shown in Table 5.
Table 5: Definitions and demonstrations of apparent diffusion coefficient (ADC) parameters
Definition |
Demonstration for a higher value of a parameter |
||
|---|---|---|---|
ADC histogram features |
skewness |
a measure of the asymmetry of distribution |
increased asymmetry from the normal distribution |
Kurtosis |
a measure of the tailedness of distribution |
a sharper peak and wider tails of the distribution of ADC values |
|
Entropy |
a measure of the randomness of ADC values in an ADC map |
more random distribution of gray levels, more heterogeneous |
|
ADC texture features |
entropy(H) |
a measure of the randomness of ADC pairs in an ADC map considering the spatial information |
more random distribution of paired gray levels, more heterogeneous |
homogeneity |
a measure of the uniform of the ADC pairs |
increased uniformity of the texture, less heterogeneous |
|
correlation |
a measure of the linear dependencies of gray levels |
increased uniformity of the texture, less heterogeneous |
|
autocorrelation |
a measure of the similarity of the ADC pairs |
a higher extent of similarity of ADC values, less heterogeneous |
We also calculated change rates of all kinds of parameters by the following formulas:
MTD [area or volume] response (%) = (pre-CCRT MTD [area or volume] – mid-CCRT MTD [area or volume])/pre-CCRT MTD [area or volume] * 100.
ADC response (%) = |mid-CCRT ADC – pre-CCRT ADC|/pre-CCRT ADC * 100.
Long-term outcome evaluation
After the completion of CCRT, follow-ups were performed 1 month, 3 months and afterwards every 6 months. Each visit contained medical records review, gynecological examinations and serum tumor markers detection. MR examinations were also performed for suspected tumor recurrence. Patients’ outcomes were divided into 2 groups: recurrence group, including recurrences, which were considered to be biopsy-proven or clinically diagnosed (by gynaecologists) replaces including pelvic recurrence and distant metastasis, or any lesion that was significantly enlarged at the latest follow-up, or deaths caused by cervical cancer; nonrecurrence group, that is, any patient who showed negative physical examination, negative tissue biopsy or negative imaging findings within the normal range of tumor markersin the follow-up process.
Statistical analyses
Statistical analyses were performed using SPSS 22.0 software (SPSS Inc., Chicago, IL, USA). Independent samples t test was used to compare ADC histogram parameters and their change rates between the recurrence and nonrecurrence group. As some ADC texture parameters groups did not verify the normality assumption after performing Shapiro-Wilk test, Mann–Whitney U test was used to compare ADC texture parameters between the recurrence and nonrecurrence group. The predictive values of those parameters were tested by receiver operating characteristic (ROC) analysis, and were compared by multivariate stepwise logistic regression analysis. Two-tailed P values less than 0.05 were considered statistically significant. Dunn-Sidák correction was performed to adjust the significance level for ADC histogram parameters and texture features. Inter-observer reproducibility of ADC parameters was measured by calculating the intra-class correlation coefficient (ICC) with 95% confidence interval.
Abbreviations
CCRT, concurrent chemo-radiotherapy; MTD, maximal tumor diameter; DW, diffusion weighted; ADC, apparent diffusion coefficient; ROI, region of interest; FIGO, International Federation of Gynecology and Obstetrics; EBRT, external beam radiotherapy; ICBT, intracavitary brachytherapy; TR/TE, repetition time/echo time; FOV, field of view; VOI, volume of interest; GLCM, the gray level co-occurrence matrix; ROC, receiver operating characteristic; PLN, pelvic lymph node; AUC, area under the curve.
Author contributions
Conception and design: Zhengyang Zhou, Yun Ge and Baorui Liu.
Analysis and interpretation: Jian He, Song Liu, Jie Meng and Yue Guan.
Data collection: Jie Meng, Lijing Zhu, Li Zhu, Li Xie, Huanhuan Wang and Jing Yan.
Writing the article: Jie Meng.
Final approval of the article: Zhengyang Zhou.
Statistical analysis: Jian He, Xiaofeng Yang and Jie Meng.
Overall responsibility: Zhengyang Zhou.
CONFLICTS OF INTEREST
The Authors do not have any conflicts of interest.
FUNDING
This work was supported by the National Natural Science Foundation of China (ID: 81371516, 81501441,81671751), Social Development Foundation of Jiangsu Province (BE2015605), Foundation of National Health and Family Planning Commission of China (W201306), the Natural Science Foundation of Jiangsu Province (ID: BK20150109, BK20150102), Jiangsu Province Health and Family Planning Commission Youth Scientific Research Project (ID: Q201508), Six Talent Peaks Project of Jiangsu Province (ID: 2015-WSN-079) and Key Project supported by Medical Science and technology development Foundation, Nanjing Department of Health (YKK15068).
REFERENCES
1. Torre LA, Siegel RL, Ward EM, Jemal A. Global Cancer Incidence and Mortality Rates and Trends--An Update. Cancer Epidemiol Biomarkers Prev. 2016;25: 16-27.
2. Kirwan JM, Symonds P, Green JA, Tierney J, Collingwood M, Williams CJ. A systematic review of acute and late toxicity of concomitant chemoradiation for cervical cancer. Radiother Oncol. 2003;68: 217-26.
3. Markman M. Chemoradiation in the management of cervix cancer: current status and future directions. Oncology. 2013;84: 246-50.
4. Heo SH, Shin SS, Kim JW, Lim HS, Jeong YY, Kang WD, Kim SM, Kang HK. Pre-treatment diffusion-weighted MR imaging for predicting tumor recurrence in uterine cervical cancer treated with concurrent chemoradiation: value of histogram analysis of apparent diffusion coefficients. Korean J Radiol. 2013;14:616-25.
5. Dhanda S, Thakur M, Kerkar R, Jagmohan P. Diffusion-weighted imaging of gynecologic tumors: diagnostic pearls and potential pitfalls. Radiographics. 2014;34: 1393-416.
6. Nakamura K, Joja I, Nagasaka T, Fukushima C, Kusumoto T, Seki N, Hongo A, Kodama J, Hiramatsu Y. The mean apparent diffusion coefficient value (ADCmean) on primary cervical cancer is a predictive marker for disease recurrence. Gynecol Oncol. 2012;127: 478-83.
7. Onal C, Erbay G, Guler OC. Treatment response evaluation using the mean apparent diffusion coefficient in cervical cancer patients treated with definitive chemoradiotherapy. J Magn Reson Imaging. 2016;44: 1010-9.
8. Somoye G, Harry V, Semple S, Plataniotis G, Scott N, Gilbert FJ, Parkin D. Early diffusion weighted magnetic resonance imaging can predict survival in women with locally advanced cancer of the cervix treated with combined chemo-radiation. Eur Radiol. 2012;22:2319-27.
9. Bae JM, Kim CK, Park JJ, Park BK. Can diffusion-weighted magnetic resonance imaging predict tumor recurrence of uterine cervical cancer after concurrent chemoradiotherapy? Abdom Radiol (NY). 2016;41: 1604-10.
10. Kyriazi S, Collins DJ, Messiou C, Pennert K, Davidson RL, Giles SL, Kaye SB, Desouza NM. Metastatic ovarian and primary peritoneal cancer: assessing chemotherapy response with diffusion-weighted MR imaging--value of histogram analysis of apparent diffusion coefficients. Radiology. 2011;261:182-92.
11. Gladwish A, Milosevic M, Fyles A, Xie J, Halankar J, Metser U, Jiang H, Becker N, Levin W, Manchul L, Foltz W, Han K. Association of Apparent Diffusion Coefficient with Disease Recurrence in Patients with Locally Advanced Cervical Cancer Treated with Radical Chemotherapy and Radiation Therapy. Radiology. 2016;279: 158-66.
12. Erbay G, Onal C, Karadeli E, Guler OC, Arica S, Koc Z. Predicting tumor recurrence in patients with cervical carcinoma treated with definitive chemoradiotherapy: value of quantitative histogram analysis on diffusion-weighted MR images. Acta Radiol. 2017;58:481-8.
13. Barry B, Buch K, Soto JA, Jara H, Nakhmani A, Anderson SW. Quantifying liver fibrosis through the application of texture analysis to diffusion weighted imaging. Magn Reson Imaging. 2014;32: 84-90.
14. Liu J, Mao Y, Li Z, Zhang D, Zhang Z, Hao S, Li B. Use of texture analysis based on contrast-enhanced MRI to predict treatment response to chemoradiotherapy in nasopharyngeal carcinoma. J Magn Reson Imaging. 2016;44: 445-55.
15. Kosary CL. FIGO stage, histology, histologic grade, age and race as prognostic factors in determining survival for cancers of the female gynecological system: an analysis of 1973-87 SEER cases of cancers of the endometrium, cervix, ovary, vulva, and vagina. Semin Surg Oncol. 1994;10: 31-46.
16. Vaupel P, Mayer A. Hypoxia in cancer: significance and impact on clinical outcome. Cancer Metastasis Rev. 2007;26: 225-39.
17. Song YS, Choi SH, Park CK, Yi KS, Lee WJ, Yun TJ, Kim TM, Lee SH, Kim JH, Sohn CH, Park SH, Kim IH, Jahng GH, et al. True progression versus pseudoprogression in the treatment of glioblastomas: a comparison study of normalized cerebral blood volume and apparent diffusion coefficient by histogram analysis. Korean J Radiol. 2013;14: 662-72.
18. Donati OF, Mazaheri Y, Afag A, Vargas HA, Zheng J, Moskowitz CS, Hricak H, Akin O. Prostate cancer aggressiveness: assessment with whole-lesion histogram analysis of the apparent diffusion coefficient. Radiology. 2014;271: 143-52.
19. Ryu YJ, Choi SH, Park SJ, Yun TJ, Kim JH, Sohn CH. Glioma: application of whole-tumor texture analysis of diffusion-weighted imaging for the evaluation of tumor heterogeneity. PLoS One. 2014;9: e108335.
20. Guan Y, Li W, Jiang Z, Chen Y, Liu S, He J, Zhou Z, Ge Y. Whole-Lesion Apparent Diffusion Coefficient-Based Entropy-Related Parameters for Characterizing Cervical Cancers: Initial Findings. Acad Radiol. 2016;23: 1559-67.
21. Kierans AS, Rusinek H, Lee A, Shaikh MB, Triolo M, Huang WC, Chandarana H. Textural differences in apparent diffusion coefficient between low- and high-stage clear cell renal cell carcinoma. AJR Am J Roentgenol. 2014;203: W637-644.
22. Wibmer A, Hricak H, Gondo T, Matsumoto K, Veeraraghavan H, Fehr D, Zheng J, Goldman D, Moskowitz C, Fine SW, Reuter VE, Eastham J, Sala E, et al. Haralick texture analysis of prostate MRI: utility for differentiating non-cancerous prostate from prostate cancer and differentiating prostate cancers with different Gleason scores. Eur Radiol. 2015;25: 2840-50.
23. Yun BL, Cho N, Li M, Jang MH, Park SY, Kang HC, Kim B, Song IC, Moon WK. Intratumoral heterogeneity of breast cancer xenograft models: texture analysis of diffusion-weighted MR imaging. Korean J Radiol. 2014;15: 591-604.
24. Xue H, Ren C, Yang J, Sun Z, Li S, Jin Z, Shen K, Zhou W. Histogram analysis of apparent diffusion coefficient for the assessment of local aggressiveness of cervical cancer. Arch Gynecol Obstet. 2014;290:341-8.
25. Guan Y, Shi H, Chen Y, Liu S, Li W, Jiang Z, Wang H, He J, Zhou Z, Ge Y. Whole-Lesion Histogram Analysis of Apparent Diffusion Coefficient for the Assessment of Cervical Cancer. J Comput Assist Tomogr. 2016;40:212-7.