
INTRODUCTION
Thyroid cancer is the most common endocrine malignancy, and its incidence has rapidly increased (more than 5% per year in both men and women). An estimated 64300 new thyroid cancer cases were diagnosed in the United States in 2016 according to Siegel et al. [1]. However, whether the increasing incidence of thyroid cancer is a result of the growing frequency of cancer detection procedures, such as high-resolution ultrasound, or is an actual increase in incidence is still controversial. Despite this uncertainty, the increasing rate of thyroid cancer is becoming a concerning issue.
Thyroid cancer has many histological subtypes; the most common of which are papillary thyroid cancer (PTC) and follicular thyroid cancer (FTC). Although many studies have focused on the morphological and clinicopathological risks as well as prognosis of PTC and FTC [2–9], mixed subtype thyroid cancer (MSTC), that is, adenocarcinoma combined with other types of carcinoma in the thyroid have rarely been investigated.
The Surveillance, Epidemiology, and End Results (SEER) Program has been established by the National Cancer Institute and is supported by the Surveillance Research Program to reduce the cancer burden, including that of thyroid cancer, among the US population. The SEER is a premier source of cancer surveillance data as well as analytical tools and is a leader in methodological expertise in collecting, analyzing, interpreting, and disseminating reliable population-based statistics.
In this study, we investigated the prognosis, that is, cancer-specific mortality and all-cause mortality, of MSTC compared with PTC and FTC using propensity score matching based on the SEER database. Our finding would provide a reference for further understanding and treatment of MSTC.
RESULTS
Demographic and clinical features
This study assessed data from 98888 patients with thyroid cancer to analyze the prognosis of MSTC. Of these patients, 92963 had PTC, 5865 had FTC, and 60 had MSTC. The mean age and follow-up duration according to different histological subtypes are shown in Table 1. No significant differences were noted in terms of the age between patients with MSTC and those with PTC or FTC.
Table 1: Characteristics for Patients with different histological types
Covariate |
level |
Histological types |
||||
|---|---|---|---|---|---|---|
MSTC(n=60) |
PTC (n=92963) |
P value |
FTC (n=5865) |
P value |
||
Age (year) |
|
53.66±18.13 |
49.36±15.29 |
0.085 |
51.33±17.20 |
0.397 |
Sex |
Female |
46(76.7%) |
71785(77.2%) |
0.919 |
4137(70.5%) |
0.300 |
|
Male |
16(23.3%) |
21178(22.8%) |
|
1728(29.5%) |
|
Race |
White |
49(81.7%) |
76038(82.9%) |
0.033 |
4529(78.3%) |
0.471 |
|
Black |
8(13.3%) |
5704(6.2%) |
|
695(12.0%) |
|
|
Other |
3(5.0%) |
9987(10.9%) |
|
558(9.7%) |
|
T stage |
T1 |
17(28.8%) |
55606(62.2%) |
<0.001 |
1283(23.8%) |
<0.001 |
|
T2 |
12(20.3%) |
13811(15.5%) |
|
2174(40.2%) |
|
|
T3 |
17(28.8%) |
16407(18.4%) |
|
1747(32.4%) |
|
|
T4 |
13(22.1%) |
3463(3.9%) |
|
194(3.6%) |
|
N-stage |
N0 |
42(72.4%) |
69465(79.0%) |
0.218 |
5370(97.0%) |
<0.001 |
|
N1 |
16(27.6%) |
18460(21.0%) |
|
168(3.0%) |
|
M-stage |
M0 |
52(91.2%) |
89658(98.8%) |
<0.001 |
5377(94.2%) |
0.334 |
|
M1 |
5(8.8%) |
1132(1.2%) |
|
329(5.8%) |
|
Multifocality |
No |
28(50.0%) |
52324(58.3%) |
0.205 |
4735(85.6%) |
<0.001 |
|
Yes |
28(50.0%) |
37350(41.7%) |
|
797(14.4%) |
|
Extension |
No |
37(62.7%) |
75994(83.7%) |
<0.001 |
5114(90.5%) |
<0.001 |
|
Yes |
22(37.3%) |
14847(16.3%) |
|
539(9.5%) |
|
Radiation |
None or refused |
23(38.3%) |
46761(51.5%) |
0.006 |
2573(45.0%) |
0.211 |
|
Radiation Beam or Rdioactive implants |
4(6.7%) |
1705(1.9%) |
|
177(3.1%) |
|
|
Radioisotopes or Radiation beam plus isotopes or implants |
33(55.0%) |
42296(46.6%) |
|
2970(51.9%) |
|
Surgery |
Lobectomy |
6(10.3%) |
12688(14.2%) |
<0.001 |
1300(23.6%) |
0.037 |
|
Subtotal or near-total thyroidectomy |
2(3.4%) |
3337(3.7%) |
|
303(5.5%) |
|
|
Total thyroidectomy |
50(86.2%) |
73162(82.1%) |
|
3911(70.9%) |
|
Survival months (month) |
|
41.63±37.44 |
49.09±33.76 |
0.041 |
53.12±34.33 |
0.006 |
MSTC: mixed subtype thyroid cancer; PTC: papillary thyroid cancer; FTC: follicular thyroid carcinoma.
Cancer-specific and all-cause mortality rates of different histological subtypes
Upon follow-up on December 2013, the number of cancer-specific death was 7 in the MSTC group, 996 in the PTC group, and 190 in the FTC group. The cancer-specific mortality rates per 1000 person-years for MSTC, PTC, and FTC were 28.823 (95% confidence interval [CI]: 12.949–64.156), 2.403 (95% CI: 2.252–2.564), and 6.509 (95% CI: 5.598–7.569), respectively (Table 2). In addition, during the follow-up period, the number of patients who died from all-cause death in the MSTC, PTC, and FTC group was 11, 4388, and 538, respectively. The all-cause mortality rates per 1000 person-years for MSTC, PTC, and FTC were 48.038 (95% CI: 25.8547–89.281), 11.068 (95% CI: 10.739–11.408), and 19.337 (95% CI: 17.717–21.104), respectively (Table 2).
Table 2: Hazard Ratios of different histological types for the cancer specific deaths and all cause deaths of thyroid cancer
Histological types |
Cancer-Specific Deaths, |
% |
Cancer-Specific Deaths per |
95% CI |
All Cause Deaths, |
% |
All Cause Deaths per |
95% CI |
|---|---|---|---|---|---|---|---|---|
No. |
1,000 Person-Years |
No. |
1,000 Person-Years |
|||||
MSTC |
7 |
11.7 |
28.823 |
12.949-64.156 |
11 |
18.33 |
48.038 |
25.847-89.281 |
PTC |
966 |
1.04 |
2.403 |
2.252-2.564 |
4388 |
4.72 |
11.068 |
10.739-11.408 |
FTC |
190 |
3.24 |
6.509 |
5.598-7.569 |
538 |
9.17 |
19.337 |
17.717-21.104 |
MSTC: mixed subtypes thyroid cancer; PTC: papillary thyroid cancer; FTC: follicular thyroid carcinoma.
Risk factors for cancer-specific and all-cause mortality
The results of the univariate Cox regression analyses demonstrated that cancer-specific mortality was associated with age; sex; race; histological type; tumor, node, and metastases (TNM) stage; extension; radiation treatment; and surgical approach. Moreover, all-cause mortality was also found to be associated with age, sex, race, histological type, TNM stage, multifocality, extension, radiation treatment, and surgical approach. Meanwhile, multivariate Cox regression model showed that histological subtypes were not an independent risk factor for cancer-specific and all-cause mortality (Table 3).
Table 3: Risk factors for survival: outcome of thyroid cancer specific mortality and all-cause mortality
Covariate |
level |
Thyroid Cancer specific mortality |
|
All cause mortality |
|||||
|---|---|---|---|---|---|---|---|---|---|
Univariate Cox regression |
Multivariate Cox regression |
Univariate Cox regression |
Multivariate Cox regression |
||||||
Hazard Ratio (95% CI) |
p-value |
Hazard Ratio (95% CI) |
p-value |
Hazard Ratio (95% CI) |
p-value |
Hazard Ratio (95% CI) |
p-value |
||
Age |
|
1.097(1.092-1.102) |
<0.001 |
1.067(1.061-1.073) |
<0.001 |
1.087(1.085-1.089) |
<0.001 |
1.077(1.074-1.080) |
<0.001 |
Sex |
Female |
ref |
|
ref |
|
ref |
|
ref |
|
|
Male |
2.765(2.463-3.103) |
<0.001 |
1.407(1.201-1.647) |
<0.001 |
2.466(2.330-2.609) |
<0.001 |
1.662(1.549-1.783) |
<0.001 |
Race |
White |
ref |
|
ref |
|
ref |
|
ref |
|
|
Black |
1.077(0.853-1.359) |
0.533 |
1.129(0.803-1.586) |
0.486 |
1.295(1.170-1.435) |
<0.001 |
1.417(1.248-1.608) |
<0.001 |
|
Other |
1.472(1.249-1.733) |
<0.001 |
0.896(0.712-1.129) |
0.353 |
0.958(0.872-1.053) |
0.375 |
0.791(0.698-0.896) |
<0.001 |
histological types |
MSTC |
ref |
|
ref |
|
ref |
|
ref |
|
|
PTC |
0.077(0.037-0.163) |
<0.001 |
0.474(0.151-1.489) |
0.201 |
0.221(0.123-0.400) |
<0.001 |
0.494(0.221-1.105) |
0.086 |
|
FTC |
0.229(0.108-0.487) |
<0.001 |
0.866(0.271-2.767) |
0.808 |
0.400(0.220-0.726) |
0.003 |
0.623(0.0.277-1.401) |
0.252 |
T-stage T-stage |
T1 |
ref |
|
ref |
|
ref |
|
ref |
|
|
T2 |
2.881(2.164-3.836) |
<0.001 |
2.145(1.524-3.020) |
<0.001 |
1.087(0.992-1.191) |
0.075 |
1.093(0.982-1.217) |
0.102 |
|
T3 |
7.763(6.173-9.763) |
<0.001 |
3.574(2.494-5.122) |
<0.001 |
1.580(1.461-1.709) |
<0.001 |
1.168(1.015-1.343) |
0.030 |
|
T4 |
86.012(69.700-106.142) |
<0.001 |
13.459(8.952-20.234) |
<0.001 |
7.577(6.999-8.203) |
<0.001 |
2.687(2.233-3.233) |
<0.001 |
N stage |
N0 |
ref |
|
ref |
|
ref |
|
ref |
|
|
N1 |
4.661(4.104-5.293) |
<0.001 |
1.992(1.658-2.393) |
<0.001 |
1.662(1.555-1.777) |
<0.001 |
1.497(1.364-1.644) |
<0.001 |
M-stage |
M0 |
ref |
|
ref |
|
ref |
|
ref |
|
|
M1 |
50.222(44.405-56.800) |
<0.001 |
6.865(5.691-8.281) |
<0.001 |
13.519(12.422-14.713) |
<0.001 |
3.926(3.435-4.488) |
<0.001 |
Multifocality |
No |
ref |
|
ref |
|
ref |
|
ref |
|
|
Yes |
0.893(0.783-1.019) |
0.092 |
0.781(0.666-0.915) |
0.002 |
0.883(0.830-0.939) |
<0.001 |
0.968(0.901-1.041) |
0.38 |
Extension |
No |
ref |
|
ref |
|
ref |
|
ref |
|
|
Yes |
12.895(11.270-14.755) |
<0.001 |
1.574(1.137-2.178) |
0.006 |
2.603(2.446-2.770) |
<0.001 |
1.121(0.958-1.310) |
0.153 |
Radiation |
None or refused |
ref |
|
ref |
|
ref |
|
ref |
|
|
Radiation Beam or Rdioactive implants |
14.149(12.142-16.486) |
<0.001 |
2.964(2.335-3.763) |
<0.001 |
3.460(3.109-3.850) |
<0.001 |
1.496(1.280-1.747) |
<0.001 |
|
Radioisotopes or Radiation beam+ isotopes/implants |
0.902(0.790-1.030) |
0.126 |
0.825(0.682-0.996) |
0.046 |
0.584(0.550-0.621) |
<0.001 |
0.696(0.644-0.753) |
<0.001 |
Surgery |
Lobectomy |
ref |
|
ref |
|
ref |
|
ref |
|
|
Subtotal or near-total thyroidectomy |
1.896(1.355-2.653) |
<0.001 |
1.190(0.786-1.801) |
0.412 |
1.023(0.880-1.190) |
0.764 |
1.021(0.862-1.209) |
0.812 |
|
Total thyroidectomy |
1.385(1.118-1.717) |
0.003 |
1.041(0.793-1.367) |
0.772 |
0.820(0.755-0.889) |
<0.001 |
0.967(0.879-1.064) |
0.493 |
MSTC: mixed subtypes thyroid cancer; PTC: papillary thyroid cancer; FTC: follicular thyroid carcinoma;
Adjusting for patient characteristics using propensity score matching
Without matching any factors, the cancer-specific and all-cause mortality rates between that of MSTC and that of PTC and FTC were significantly different (both p < 0.001, Figure 1A–1D). Thus, to minimize selection bias, propensity score matching (PSM) was performed for age, sex, race, TNM stage, multifocality, extension, and radiation treatment. After PSM for demographic data, such as age, sex, and race, the cancer-specific mortality rate between MSTC and PTC and FTC decreased (p=0.195 and 0.067, respectively; Figure 2A, 2B). After PSM for age, sex, race, and clinicopathological features (TNM stage, multifocality, and extension), the cancer-specific mortality rate between MSTC and PTC and FTC was still not significantly different (p=0.077 and p=0.260, respectively; Figure 3A, 3B). After PSM for all relevant factors including radiation and surgery treatment, the cancer-specific mortality rate for MSTC remained not significantly different compared with PTC (p=0.077) and FTC (p=0.242) (Figure 4A, 4B).
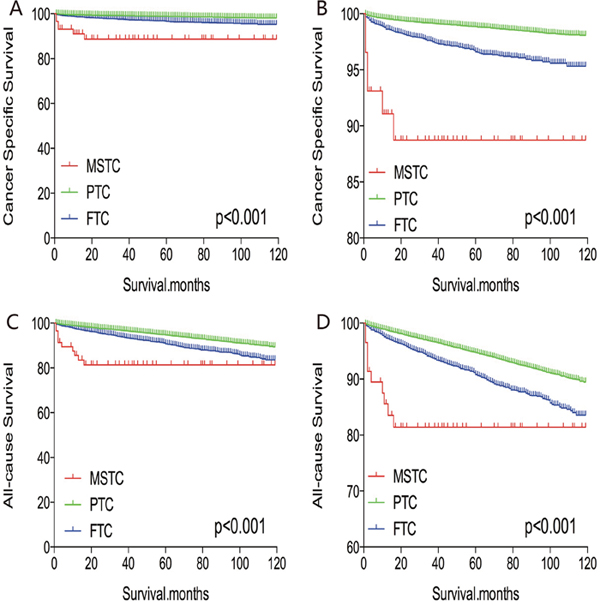
Figure 1: Kaplan Meier curves among patients stratified by subtype for cancer-specific mortality (A, B) and all-cause mortality (C, D).
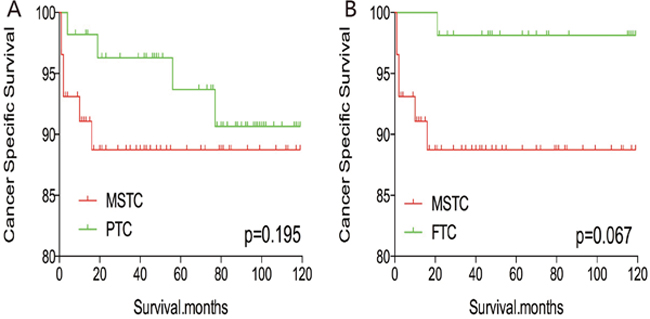
Figure 2: Kaplan Meier curves of cancer-specific mortality for matched subtype pairs. Age, sex and race matching between MSTC and PTC (A), MSTC and FTC (B).
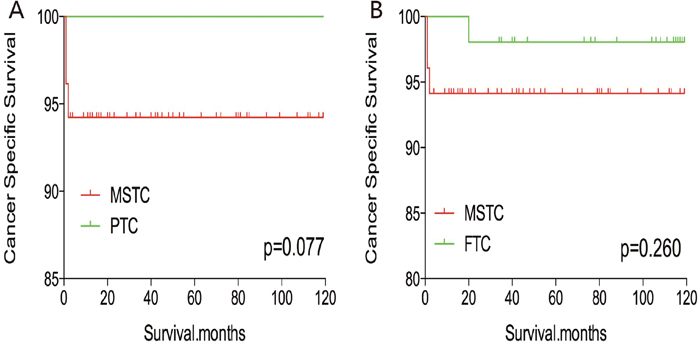
Figure 3: Kaplan Meier curves of cancer-specific mortality for matched subtype pairs. Age, sex, race, T/N/M stage, multifocality, extension matched between MSTC and PTC (A), MSTC and FTC (B).
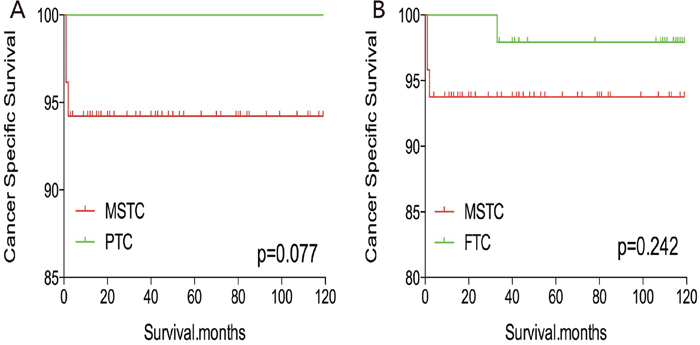
Figure 4: Kaplan Meier curves of cancer-specific mortality for matched Subtype pairs. Age, sex, race, T/N/M stage, multifocality, extension, surgery and radiation treatment matched between MSTC and PTC (A), MSTC and FTC (B).
After PSM for demographic data (age, sex, and race), the all-cause mortality rate for MSTC was similar to that of PTC and FTC (p=0.457 and 0.153, respectively; Figure 5A, 5B). However, after PSM for age, sex, race, and clinicopathological factors (TNM stage, multifocality, and extension) (Figure 6A, 6B), MSTC showed a lower all-cause survival than PTC (p=0.009) and a similar all-cause survival compared with FTC (p=0.183). similar results were obtained after PSM for all relevant factors including radiation and surgery treatment: MSTC was associated with a lower all-cause survival rate compared with PTC (p=0.009) and a similar all-cause survival when compared with FTC (p=0.079) (Figure 7A, 7B).
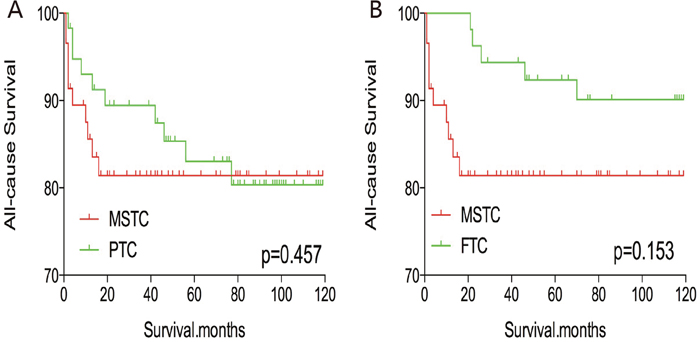
Figure 5: Kaplan Meier curves of all-cause mortality for matched Subtype pairs. Age, sex and race matching between MSTC and PTC (A), MSTC and FTC (B).
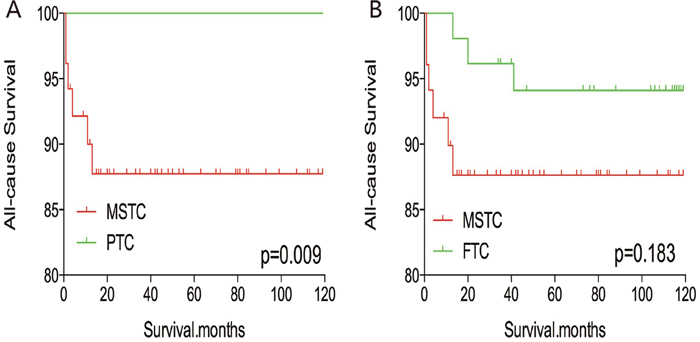
Figure 6: Kaplan Meier curves of all-cause mortality for matched Subtype pairs. Age, sex, race, T/N/M stage, multifocality, extension matching between MSTC and PTC (A), MSTC and FTC (B).
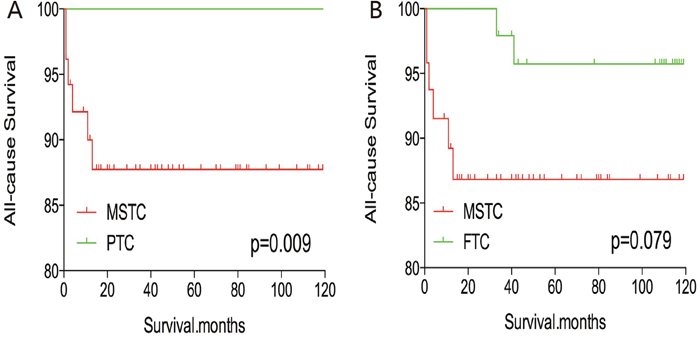
Figure 7: Kaplan Meier curves of all-cause mortality for matched Subtype pairs. Age, sex, race, T/N/M stage, multifocality, extension, surgery and radiation treatment matching between MSTC and PTC (A), MSTC and FTC (B).
DISCUSSION
The histogenetic and pathogenetic origin of MSTC has been a topic of interest and has remained controversial. Volante et al. suggested “the hostage hypothesis” that stipulates that MSTC originate from different cells [10]. In their study, they suggested that MSTC are not derived from a single stem cell because the clonality analysis shows that different subtypes exhibit different patterns of molecular mutations and X-chromosomal inactivation.
In addition, whether MSTC has unique biologic behaviors compared with other subtypes is still unclear. Currently, only few investigations focus on the prognosis of MSTC [10-12]. Furthermore, the discussion of the American Thyroid Committee guideline on the biological behavior, molecular features, and prognosis of MSTC is limited.
In our study, analysis results of information obtained from the SEER database showed that histological subtype was not an independent factor for cancer-specific and all-cause mortality rates of MSTC. Before matching risk factors, MSTC had worse cancer-specific and all-cause mortality compared with PTC and FTC. However, after matching for all influencing factors, including radiation treatment, MSTC had similar prognosis to PTC and FTC. These results indicate that if patients with MSTC had similar demographic features, clinicopathological factors, and radiation treatment with those of patients with PTC and FTC, the survival rate would not be significantly different. Such results would be helpful for clinicians during the decision-making process.
One dilemma of MSTC is the diagnosis by fine-needle aspiration cytology. For example, mixed medullary-follicular thyroid carcinoma characterized by coexistence of morphological features of both follicular thyroid cancer and medullary thyroid cancer. It is difficult to identify without immunocytochemical examinations. When fine-needle aspiration cytology is preferred to diagnose such malignancy, adequate specimen and determination of serum calcitonin and thyroglobulin levels would be help for establishing an accurate diagnosis [13-17].
Notably, whether the type of treatment, including surgical approaches and radiation, affects the prognosis of MSTC still lacks adequate evidence [10-12, 17-20]. In our study, radiation was more frequently performed in patients with MSTC (61.7%) than in patients with PTC (48.5%). Moreover, MSTC patients (86.2%) were more likely to undergo total thyroidectomy than patients with PTC (82.1%) and FTC (70.9%). Therefore, the similar cancer-specific mortality of MSTC to PTC and FTC after matching for treatment approaches may suggest that patients with MSTC require aggressive treatment. It means that the difference of cancer-specific mortality between MSTC and PTC, FTC was shrink down may due to the aggressive treatment of MSTC.
Our study has some limitations. First, the lack of information on recurrence may cause overestimation bias when evaluating cancer-specific and all-cause mortality. Furthermore, we cannot differentiate the specific subtypes. Clonality analysis of mixed type thyroid cancer was also not performed; thus, analysis for each type compared with PTC and FTC separately could not be performed. In addition, BRAF mutation, TERT promoter mutation, and other molecular markers were not investigated in our study or matched for analysis.
In conclusion, we have shown the prognosis of MSTC compared with PTC and FTC. Our result would be beneficial for developing a personalize and accurate treatment guideline and understanding of MSTC.
MATERIALS AND METHODS
Ethical considerations, study population and data collection
This study’s retrospective protocol was approved by Union hospital’s ethical review board and complied with the ethical standards of the Declaration of Helsinki, as well as the relevant national and international guidelines.
The present study evaluated SEER data (2004–2013) from patients with thyroid cancer according to their subtype (MSTC, PTC, and FTC) using code C73.9 from the International Classification of Diseases for Oncology(i.e., thyroid, papillary, and/or follicular histology). The eligible diagnostic codes were: “papillary carcinoma”, “papillary adenocarcinoma”, “follicular adenocarcinoma”, “papillary carcinoma, follicular variant”, and “papillary & follicular adenocarcinoma” “adenocarcinoma with mixed subtypes”. Cases without American Joint Committee on Cancer staging information (version 6) were excluded to ensure accurate analyses. Cases without information of follow up time were also excluded. The three histological subtypes were compared according to age, sex, race, TNM stage, multifocality, extension, and radiation treatment (i.e., none or refused, external beam radiation therapy, or RAI).
Statistical analyses
The quantitative variables were expressed as mean ± standard deviation (SD), while the categorical ones were presented as percentages. Patient survival curves for thyroid cancer-specific mortality and all-cause mortality were examined by Kaplan-Meier analyses with the log-rank test. Cox proportional hazard regression analyses were using to estimate hazard ratios and 95% CIs, in order to quantify the effects of the different histological subtypes on cancer-specific and all-cause mortality. PSM was also used to further adjust for potential baseline confounding factors. All p-values were 2-sided, and p-values < .05 were considered significant. Analyses were performed using SPSS version 23.0, Stata/SE version 12 (Stata Corp.), and GraphPad Prism version 6 (GraphPad Software Inc.).
Abbreviations
MSTC: Mixed subtype thyroid cancer; PTC: Papillary thyroid cancer; FTC: Follicular thyroid cancer (FTC); SEER: Surveillance, Epidemiology, and End Results; CI: Confidence interval; TNM, tumor, node, and metastases; PSM: Propensity score matching
Author contributions
All authors contributed to the design of the study and writing of the manuscript C.P.L and Q.Y.Z undertook the research and performed the analyses. All authors reviewed and approved the final version of the manuscript.
CONFLICTS OF INTEREST
The authors declare no conflicts of interest.
FUNDING
No.
REFERENCES
1. Siegel RL, Miller KD, Jemal A. Cancer statistics, 2016. CA Cancer J Clin. 2016; 66:7–30.
2. Xing M, Liu R, Liu X, Murugan AK, Zhu G, Zeiger MA, Pai S, Bishop J. BRAF V600E and TERT promoter mutations cooperatively identify the most aggressive papillary thyroid cancer with highest recurrence. J Clin Oncol. 2014; 32:2718–26.
3. Wang F, Yu X, Shen X, Zhu G, Huang Y, Liu R, Viola D, Elisei R, Puxeddu E, Fugazzola L, Colombo C, Jarzab B, Czarniecka A, et al. The Prognostic Value of Tumor Multifocality in Clinical Outcomes of Papillary Thyroid Cancer. J Clin Endocrinol Metab. 2017; 102:3241–50.
4. Liu R, Bishop J, Zhu G, Zhang T, Ladenson PW, Xing M. Mortality Risk Stratification by Combining BRAFV600E and TERTPromoter Mutations in Papillary Thyroid Cancer. JAMA Oncol. 2017; 3:202–07.
5. Liu C, Wang S, Zeng W, Guo Y, Liu Z, Huang T. Total tumour diameter is superior to unifocal diameter as a predictor of papillary thyroid microcarcinoma prognosis. Sci Rep. 2017; 7:1846.
6. Tulchinsky M, Lui Z, Huang T. Papillary thyroid microcarcinoma and active surveillance. Lancet Diabetes Endocrinol. 2016; 4:974–75.
7. Stenson G, Nilsson IL, Mu N, Larsson C, Lundgren CI, Juhlin CC, Höög A, Zedenius J. Minimally invasive follicular thyroid carcinomas: prognostic factors. Endocrine. 2016; 53:505–11.
8. Lastra RR, LiVolsi VA, Baloch ZW. Aggressive variants of follicular cell-derived thyroid carcinomas: a cytopathologist’s perspective. Cancer Cytopathol. 2014; 122:484–503.
9. Sobrinho-Simões M, Eloy C, Magalhães J, Lobo C, Amaro T. Follicular thyroid carcinoma. Mod Pathol. 2011 (Suppl 2); 24:S10–18.
10. Volante M, Papotti M, Roth J, Saremaslani P, Speel EJ, Lloyd RV, Carney JA, Heitz PU, Bussolati G, Komminoth P. Mixed medullary-follicular thyroid carcinoma. Molecular evidence for a dual origin of tumor components. Am J Pathol. 1999; 155:1499–509.
11. Jain M, Verma D, Thomas S, Chauhan R. Mixed medullary - papillary carcinoma thyroid: an uncommon variant of thyroid carcinoma. J Lab Physicians. 2014; 6:133–35.
12. Zoroquiain P, Torres J, Goñi I, Fernández L, Solar A. True mixed medullary papillary carcinoma of the thyroid: a case report with low blood calcitonin levels. Endocr Pathol. 2012; 23:168–71.
13. Tohidi M, Pourbehi G, Bahmanyar M, Eghbali SS, Kalantar Hormozi M, Nabipour I. Mixed medullary-follicular carcinoma of the thyroid. Case Rep Endocrinol. 2013; 2013:571692–93.
14. Ben Salah R, Mekni A, Doghri R, Kchir N, Haouet S, Besbes G, Bouchoucha S, Zitouna M. A mixed medullary-follicular thyroid carcinoma discovered by fine needle aspiration. Tunis Med. 2012; 90:488–90.
15. Papotti M, Negro F, Carney JA, Bussolati G, Lloyd RV. Mixed medullary-follicular carcinoma of the thyroid. A morphological, immunohistochemical and in situ hybridization analysis of 11 cases. Virchows Arch. 1997; 430:397–405.
16. Dusková J, Janotová D, Svobodová E, Novák Z, Tretiník P. Fine needle aspiration biopsy of mixed medullary-follicular thyroid carcinoma. A report of two cases. Acta Cytol. 2003; 47:71–77.
17. Hanna AN, Michael CW, Jing X. Mixed medullary-follicular carcinoma of the thyroid: diagnostic dilemmas in fine-needle aspiration cytology. Diagn Cytopathol. 2011; 39:862–65.
18. Nangue C, Bron L, Portmann L, Volante M, Ris HB, Monnier P, Andrejevic-Blant S. Mixed medullary-papillary carcinoma of the thyroid: report of a case and review of the literature. Head Neck. 2009; 31:968–74.
19. Kostoglou-Athanassiou I, Athanassiou P, Vecchini G, Gogou L, Kaldrymides P. Mixed medullary-follicular thyroid carcinoma. Report of a case and review of the literature. Horm Res. 2004; 61:300–04.
20. Gao ZB, Wang ZP, Zhao Y, Yu XR. [Mixed medullary-papillary thyroid carcinoma: report of a case]. Zhonghua Bing Li Xue Za Zhi. 2008; 37:716–17.