
INTRODUCTION
Esophageal carcinoma is the sixth leading cause of cancer-related mortality and the eighth most common cancer worldwide [1]. In China, the incidence is approximately 478, 000, and the mortality is 375,000 in 2015, being the third most commonly diagnosed cancers and fourth leading causes of cancer death [2]. And more than 95% of all esophageal cancers in China are esophageal squamous cell carcinomas (ESCC) [3]. Although the advance of surgery, radiotherapy, and chemotherapy has improved the survival of ESCC patients in recent years, the long-term survival rate still needs to be improved. Although TNM classification lays the foundation for ESCC prognostic management, it does not provide sufficient information about biological tumor progression [1]. There is demand for revealing molecular markers that could predict patients’ survival.
To limit or circumvent apoptosis is recognized as one of the fundamental features of cancer. B-cell lymphoma 2 (Bcl-2) family proteins have preeminent importance in the mitochondrial apoptotic pathway and are characterized by the presence of anti-apoptotic and pro-apoptotic proteins [4]. Myeloid cell leukemia sequence 1 (MCL1), located in 1q21.2, is a Bcl2 anti-apoptotic member, which could block apoptosis induced by various apoptosis-inducing stressors, such as DNA damage, hypoxia or oncogenic signaling [5]. Studies using targeted gene deletion, RNA interference or inducible expression have shown that Mcl1 is essential for the growth of diverse tumors, including acute myeloid leukaemia [6], lymphomas [7], papillary thyroid carcinoma [8], breast cancers [9], oral squamous cell carcinomas [10], and non-small-cell lung carcinoma [11]. These results provided information to substantiate the possibility of Mcl1 as a clinically useful indicator in the prognosis of cancer.
Mcl1 alteration occurs through various mechanisms, including chromosomal translocation, gene amplification, and signal transduction alterations associated with transformation [12]. Gene copy number gain or amplification of MCL1 is frequently found in solid tumors [13]. What is more, MCL1 copy number variations have been reported to be associated with cancer prognosis in papillary thyroid carcinoma [8] and non-small-cell lung carcinoma [11]. Nevertheless, there have been rare studies addressing the roles of MCL1 copy number variations in ESCC outcomes.
In this study, we detected MCL1 copy number variation in 262 ESCC using tissue microarrays, and searched for correlations between MCL1 copy number gain and prognosis in ESCC; additionally, we compared it in patients with different lymph node status and clinical stage.
RESULTS
Clinicopathologic characteristics of ESCC patients
The clinicopathologic features of a total of 262 cases of ESCC were summarized in Table 1. Briefly, median age was 62 years (range 37–83), with frequencies between women (16.4%, 43 out of 262) and men (83.6%, 219 out of 262). Former or current smokers represented 40.8% of all patients. The location of the tumor in 49.4% of patients was middle esophagus, in lower was 45.5% and in upper was only 5.1%. On the basis of the AJCC Staging Manual (seventh edition), 58.4% cases were histologically graded as well to moderately differentiated, and 41.6% were poorly differentiated. Vessel and nerve involvement were identified in 47 (17.9%) and 70 (26.7%) tumors, respectively. Lymph node metastasis was identified in 127 (48.5%) patients. Stage I-II cases accounted for 59.5% (156 out of 262), while stage III-IVa cases were 40.5% (106 out of 262), respectively.
Table 1: Correlation between high MCL1 gain and clinico-pathological features in full cohort of ESCC
Number |
High MCL1 gain |
||
|---|---|---|---|
Yes |
P value |
||
Sex |
0.894 |
||
Female |
43 |
13 |
|
Male |
219 |
64 |
|
Age |
0.404 |
||
<60 |
109 |
29 |
|
≥60 |
153 |
48 |
|
Grade |
0.415 |
||
I+II |
153 |
42 |
|
III |
109 |
35 |
|
Invasive depth |
0.518 |
||
I |
13 |
2 |
|
II |
68 |
20 |
|
III |
181 |
55 |
|
Vessel involvement |
0.260 |
||
No |
215 |
60 |
|
Yes |
47 |
17 |
|
Nerve involvement |
0.457 |
||
No |
192 |
54 |
|
Yes |
70 |
23 |
|
Lymph node metastasis |
0.930 |
||
No |
135 |
40 |
|
Yes |
127 |
37 |
|
Site |
0.314 |
||
up |
13 |
3 |
|
middle |
125 |
33 |
|
down |
115 |
40 |
|
Smoking |
0.500 |
||
No |
155 |
48 |
|
Yes |
107 |
29 |
|
Clinical stage |
0.610 |
||
I-II |
156 |
44 |
|
III-IVa |
106 |
33 |
|
Disease progression |
0.729 |
||
No |
108 |
33 |
|
Yes |
154 |
44 |
|
Death of esophageal cancer |
0.445 |
||
No |
113 |
36 |
|
Yes |
149 |
41 |
|
Invasive Depth, I confined to submucosal layer; II invasion of muscular layer, III beyond the muscularis.
MCL1 copy number variation in ESCC
Of the 262 tumors, 77 tumors (29.4%), 95 tumors (36.3%) and 90 tumors (34.3%) had >5.0, 2.5 to 5 and <2.5 average MCL1 copies/nucleus, respectively. Figure 1 illustrates representative FISH signal patterns of select MCL1 anomalies including high MCL1 gain (>5.0 average MCL1 gene copies/nucleus), low MCL1 gain (2.5 to 5 average MCL1 copies/nucleus), and normal or loss of MCL1. Table 1 shows the relationships between MCL1 status and the clinicopathological parameters in ESCC. Sex, age, grade, invasive depth, vessel involvement, nerve involvement, lymph node metastasis, tumor site, smoking and clinical stage were not statistically correlated with high MCL1 gain (P>0.05).
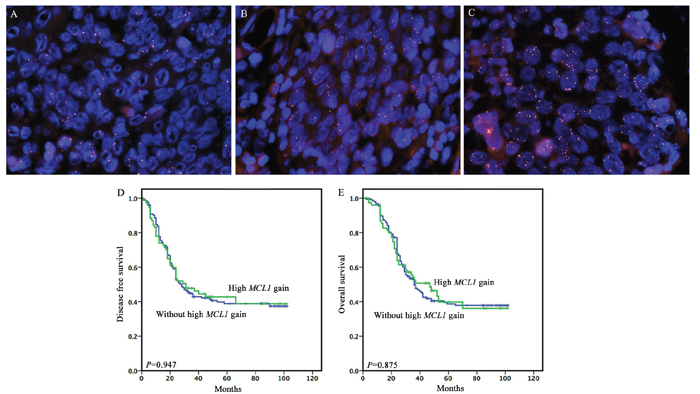
Figure 1: Representative fluorescence in situ hybridization (FISH) signal patterns of select MCL1 anomalies and the prognostic significance of high MCL1 gain in full cohort. (A) Normal or loss of MCL1, (B) low MCL1 gain (2.5 to 5 average MCL1 copies/nucleus), (C) High MCL1 gain (>5.0 average MCL1 gene copies/nucleus), (D and E) High MCL1 gain for DFS and OS.
Survival outcomes
The median follow-up period was 33.0 months (95 % CI 38.33–45.25). There was 154 (58.8%) disease progression documented, and 149 patients (56.9%) died of ESCC during the follow up.
To clarify whether the MCL1 gain could have a prognostic value, univariate and multivariate survival analyses were performed in all cases. Our univariate analysis revealed that MCL1 gain wasn’t associated with postoperative outcome (Figure 1). The invasive depth, vessel involvement, lymph node metastasis and clinical stage were significantly associated with postoperative outcome. In the multivariate analysis, lymph node metastasis (HR: 3.236, P<0.001 for DFS; HR: 3.501, P<0.001 for OS) and clinical stage (HR: 3.388, P<0.001 for DFS; HR: 3.616, P<0.001 for OS) were identified as independent worse prognostic factors as shown in Table 2.
Table 2: Univariate and mutivariate survival analysis for disease-free survival and overall survival in full cohort of ESCC
DFS |
OS |
|||
|---|---|---|---|---|
P value |
Hazard ratio (CI 95%) |
P value |
Hazard ratio (CI 95%) |
|
Univariate analysis |
||||
Sex |
0.825 |
1.049 (0.684-1.611) |
0.787 |
1.062 (0.686-1.644) |
Age |
0.412 |
1.145 (0.829-1.583) |
0.366 |
1.163 (0.838-1.615) |
Grade |
0.137 |
1.272 (0.927-1.747) |
0.204 |
1.232 (0.893-1.701) |
Invasive Depth |
0.003 |
1.607 (1.174-2.199) |
0.001 |
1.738 (1.251-2.415) |
Vessel involement |
0.001 |
1.830 (1.266-2.643) |
0.001 |
1.937 (1.333-2.814) |
Nerve involvement |
0.948 |
0.989 (0.697-1.403) |
0.877 |
0.972 (0.678-1.393) |
Lymph node metastasis |
<0.001 |
3.236 (2.307-4.540) |
<0.001 |
3.501 (2.477-4.947) |
Site |
0.097 |
0.803 (0.620-1.041) |
0.157 |
0.825 (0.633-1.076) |
Clinical stage |
<0.001 |
3.388 (2.447-4.691) |
<0.001 |
3.616 (2.597-5.036) |
Smoking |
0.320 |
1.175 (0.855-1.615) |
0.236 |
1.216 (0.880-1.679) |
High MCL1 gain |
0.948 |
0.989 (0.697-1.403) |
0.877 |
0.972 (0.678-1.393) |
Mutivariate analysis |
||||
Invasive Depth |
0.350 |
1.181 (0.833-1.672) |
0.219 |
1.258 (0.872-1.815) |
Vessel involement |
0.999 |
1.000 (0.676-1.479) |
0.949 |
1.013 (0.681-1.508) |
Lymph node metastasis |
0.005 |
2.001 (1.236-3.240) |
0.002 |
2.169 (1.331-3.533) |
Clinical stage |
0.010 |
1.929 (1.173-3.172) |
0.013 |
1.891 (1.142-3.132) |
Survival analyses based on lymph node status
In patients with lymph node metastasis (n=127), high MCL1 gain tended to associate with poorer DFS (P=0.098) and OS (P=0.133) (Figure 2). Among 37 patients with high MCL1 gain, a poorer prognosis was observed, with a median DFS and OS of 18.0 and 23.0 months compared to 20.0 and 26.0 months for 90 patients without high MCL1 gain. However, in patients without lymph node metastasis (n=135), high MCL1 gain tended to associate with better DFS (P=0.090) and OS (P=0.081) (Figure 2).
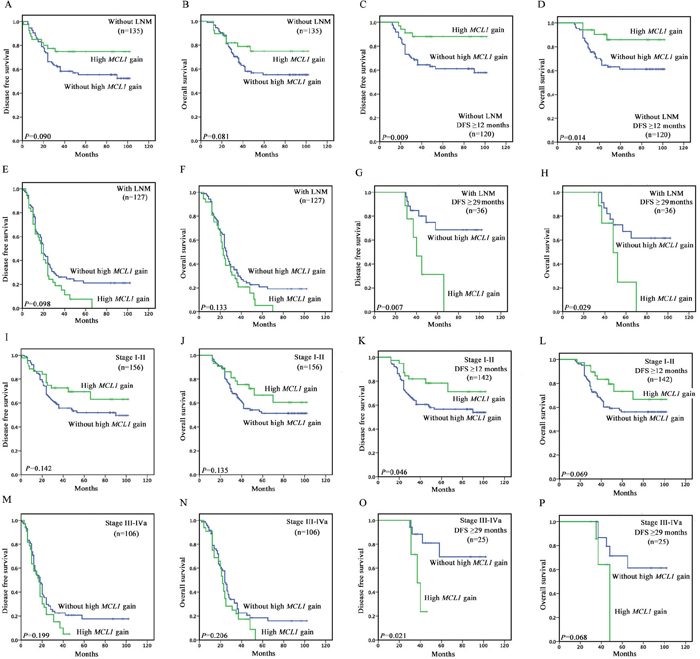
Figure 2: Kaplan–Meier survival curves illustrating prognostic effects of high MCL1 gain in different subgroup of ESCC patients. (A and B) In patients without lymph node metastasis (n=135), high MCL1 gain tended to associate with better DFS (P=0.090) and OS (P=0.081). (C and D) In patients without lymph node metastasis and with disease free survival time greater than or equal to 12 months (n=120), high MCL1 gain was associated with better DFS (P=0.009) and OS (P=0.014). (E and F) In patients with lymph node metastasis (n=127), high MCL1 gain tended to associate with poorer DFS (P=0.098) and OS (P=0.133). (G and H) In patients with lymph node metastasis and with disease free survival time greater than or equal to 29 months (n=36), high MCL1 gain tended to associate with poorer DFS (P=0.007) and OS (P=0.029). (I and J) In stage I-II patients (n=156), high MCL1 gain tended to associate with better DFS (P=0.142) and OS (P=0.135). (K and L) In stage I-II patients with disease free survival time greater than or equal to 12 months (n=142), high MCL1 gain tended to be associated with better DFS (P=0.046) and OS (P=0.069). (M and N) In stage III-IVa (n=106) patients, high MCL1 gain tended to be associated with poorer DFS (P=0.199) and OS (P=0.206). (O and P) In stage III-IVa patients with disease free survival time greater than or equal to 29 months (n=25), high MCL1 gain tended to associate with poorer DFS (P=0.021) and OS (P=0.068).
Based on the primary survival curves, we made further analysis, and found significant time point for the bidirectional prognostic value of high MCL1 gain. In patients without lymph node metastasis and with disease free survival time greater than or equal to 12 months (n=120), high MCL1 gain was associated with better DFS (P=0.009) and OS (P=0.014) (Figure 2). In patients with lymph node metastasis and with disease free survival time greater than or equal to 29 months (n=36), high MCL1 gain tended to associate with poorer DFS (P=0.007) and OS (P=0.029) (Figure 2 and 3) (Table 3). Among 9 patients with high MCL1 gain, a significantly poorer prognosis was observed, with a median DFS and OS of 40.0 and 48.0 months compared to non-reached median survival for 27 patients without high MCL1 gain.
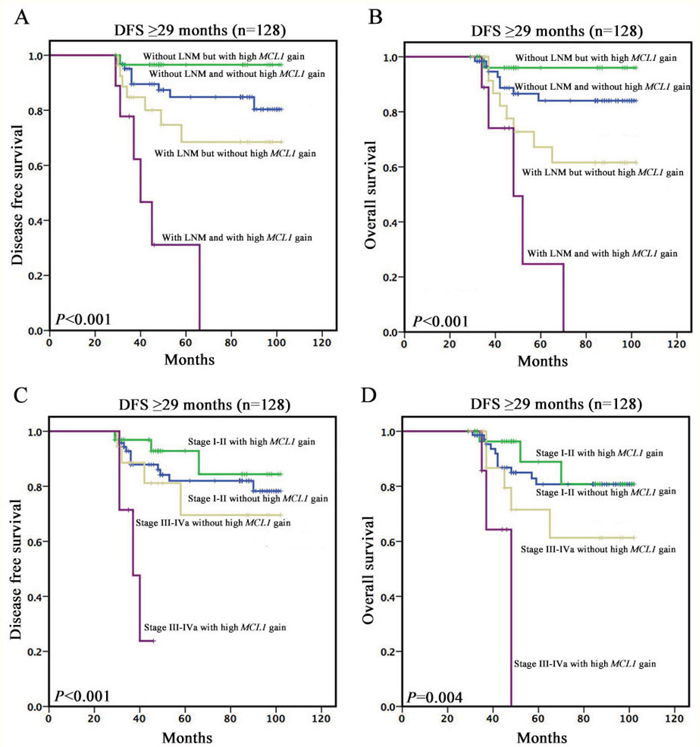
Figure 3: Kaplan–Meier survival curves among patients with disease free survival time greater than or equal to 29 months. (A and B) Survivalanalyses based on lymph node status and high MCL1 gain. (C and D) Survivalanalyses based on clinical stage and high MCL1 gain.
Table 3: Univariate survival analysis for the prognostic significance of FGF4 amplification in different subgroup of ESCC patients
DFS |
OS |
|||
|---|---|---|---|---|
P value |
Hazard ratio (CI 95%) |
P value |
Hazard ratio (CI 95%) |
|
Univariate analysis |
||||
Patients without LNM |
0.099 |
0.559 (0.280-1.115) |
0.090 |
0.534 (0.259-1.102) |
Patients with LNM |
0.111 |
1.400 (0.925-2.118) |
0.144 |
1.370 (0.898-2.091) |
Patients without LNM (<12 months) |
0.399 |
1.615 (0.531-4.915) |
0.250 |
2.049 (0.603-6.967) |
Patients without LNM (≥12 months) |
0.016 |
0.279 (0.099-0.788) |
0.022 |
0.297 (0.105-0.842) |
Patients with LNM (<12 months) |
0.656 |
1.184 (0.563-2.488) |
0.682 |
1.174 (0.545-2.532) |
Patients with LNM (≥12 months) |
0.146 |
1.452 (0.878-2.400) |
0.173 |
1.426 (0.856-2.375) |
Patients without LNM (<29 months) |
0.553 |
1.252 (0.596-2.629) |
0.552 |
1.272 (0.576-2.810) |
Patients without LNM (≥29 months) |
0.199 |
0.258 (0.033-2.043) |
0.220 |
0.272 (0.034-2.181) |
Patients with LNM (<29 months) |
0.515 |
1.163 (0.738-1.832) |
0.831 |
1.052 (0.662-1.672) |
Patients with LNM (≥29 months) |
0.013 |
4.206 (1.362-12.987) |
0.041 |
3.288 (1.048-10.318) |
I-II stage |
0.151 |
0.649 (0.360-1.170) |
0.143 |
0.634 (0.345-1.166) |
III-IVa Stage |
0.218 |
1.323 (0.848-2.065) |
0.222 |
1.328 (0.842-2.096) |
I-II stage (<12 months) |
0.276 |
2.003 (0.575-6.978) |
0.477 |
1.568 (0.453-5.421) |
I-II Stage (≥12 months) |
0.054 |
0.494 (0.241-1.013) |
0.077 |
0.522 (0.254-1.073) |
III-IVa stage (<12 months) |
0.625 |
1.197 (0.581-2.467) |
0.556 |
1.255 (0.589-2.672) |
III-IVa Stage (≥12 months) |
0.315 |
1.341 (0.757-2.375) |
0.340 |
1.328 (0.742-2.378) |
I-II stage (<29 months) |
0.987 |
0.994 (0.506-1.952) |
0.786 |
0.907 (0.451-1.827) |
I-II Stage (≥29 months) |
0.470 |
0.627 (0.176-2.228) |
0.535 |
0.667 (0.185-2.398) |
III-IVa stage (<29 months) |
0.430 |
1.211 (0.753-1.948) |
0.368 |
1.252 (0.767-2.044) |
III-IVa Stage (≥29 months) |
0.037 |
5.234 (1.105-24.798) |
0.099 |
3.665 (0.785-17.115) |
Survival analyses based on clinical stage
In stage III-IVa (n=106) patients, high MCL1 gain tended to be associated with poorer DFS (P=0.199) and OS (P=0.206) (Figure 2). Among 33 patients with high MCL1 gain, a poorer prognosis was observed, with a median DFS and OS of 17.0 and 22.0 months compared to 18.0 and 24.0 months for 73 patients without high MCL1 gain. However, in stage I-II patients (n=156), high MCL1 gain tended to associate with better DFS (P=0.142) and OS (P=0.135) (Figure 2).
With the same analytic method we used in lymph node status mentioned above, we found similar results and time point as the lymph node status. In stage I-II patients with disease free survival time greater than or equal to 12 months (n=142), high MCL1 gain tended to be associated with better DFS (P=0.046) and OS (P=0.069) (Figure 2). In stage III-IVa patients with disease free survival time greater than or equal to 29 months (n=25), high MCL1 gain tended to associate with poorer DFS (P=0.021) and OS (P=0.068) (Figure 2 and 3) (Table 3). Among 7 patients with high MCL1 gain, a significantly poorer prognosis was observed, with a median DFS and OS of 37.0 and 48.0 months compared to non-reached median survival for 18 patients without high MCL1 gain.
DISCUSSION
In the present retrospective study with FISH method, we investigated the clinicopathologic significance of MCL1 copy number gain in ESCC. Herein, we firstly observed high MCL1 copy number gain was bidirectional correlated with DFS and OS in ESCC patients with different lymph node status and clinical stage.
The importance of MCL1
MCL1 was discovered by Ruth Craig and colleagues in 1993, which was originally identified as a gene up-regulated early in the differentiation of a human myeloid leukemia cell line [14]. As the anti-apoptotic Bcl-2 family member, Mcl1 prevents pro-apoptotic proteins Bcl-2 homologous antagonist killer (Bak) and Bcl-2-associated protein X (Bax) from forming pores in the mitochondrial membrane. Then cytochrome c couldn’t be released into the cytoplasm, which inhibits the subsequent activation of a family of cysteine proteases (caspases). Caspases are responsible for much of the macromolecular degradation observed during apoptosis [15]. Mcl1 has wide but particular tissue distribution, shown to be associated with the survival and development of diverse cell-types [16, 17]. Along with its roles in apoptosis and differentiation, Mcl1 is also known to influence cell cycle progression [18, 19]. An extensive genomic analysis of somatic copy number amplification (SCNA) in more than 3,000 cancer specimens representing 26 histological type, identified MCL1 is enriched among regions of focal SCNA, and MCL1 amplification is found in more than 10% of cancers across multiple tissue types, including breast cancer, lung adenocarcinoma and melanoma [13]. As previous study, Mcl1 contributes to tumorigenesis, particularly in solid cancers [20], and second generation Mcl1 antagonists are actively being sought [10, 21], distinguishing it as a potentially important molecular marker of tumor progress. However, to date and to the best of our knowledge, there have been rare studies addressing whether MCL1 amplification develops in ESCC. In this study, we detected MCL1 copy number variation in TMA from ESCC tumor tissues in a Chinese population, additionally, conducted survival analyses to analyze prognostic values of MCL1 copy number gain on survival.
MCL1 amplification and FISH
Gene amplification can be detected by several methods, such as FISH, Southern blotting, Chromogenic in situ hybridization, Comparative genomic hybridization, and Real-time q-PCR. Most studies assessing MCL gene amplification have been performed using PCR techniques [8, 11]. It may suffer from normal cell contamination of the tumor sample, resulting in large fluctuations in copy number. FISH, removing the variable of normal cell contamination, has been generally accepted as the standard method for detection of gene amplification [22–24].
Therefore, we analyzed MCL1 chromosomal alterations via the “gold standard”, FISH, in a cohort of ESCC patients. We found 29.4% of cases showed high copy number gain and 36.3% showed low copy number gain. The copy number analysis of 1q21.2 or MCL1 locus inevitably raises important issues about how to define the ‘MCL1 gain/amplification’ and whether to include the ‘low-level gain’ in the MCL1 gain or not [8]. However, there is also no clear consensus as to the definition of MCL1 amplification exanimated by FISH.
Given that MCL1 gain criteria by using RT-PCR might not be directly applied to the FISH method in recent studies, MYC gain/ amplification criteria of FISH method was applied in our study. We found a poorer prognosis was observed in patients with high MCL1 copy number gain, not low copy number gain. High MCL1 copy number gain could lead to the aggressive biology of ESCC, it might be possible that the high gain of 1q21.2 or MCL1 locus could enhance MCL1 activity at certain level, which might be sufficient to effectively trigger amplification of transcription involving a various set of genes in tumor cells. However, the clinical meaning of MCL1 high copy number gain or low copy number gain needs to be validated in prospective and larger scale study.
The prognostic significance of MCL1
Lymph node metastasis is one of the major prognostic factors for esophageal cancer [25–28]. Some researchers, aiming to optimize the lymphadenectomy during esophagectomy for better survival, found that different patients with similar lymph node status may not share equal prognosis. They speculated some factors, together with lymph node metastasis, might contribute to the development and the progression of cancer [29–31].
Our study categorized the lymph node status with the combined analysis of MCL1 copy number variation, and to examine this classification method in predicting the prognosis of ESCC patients. High MCL1 copy number gain was found in 29.1% of 127 ESCC patients with lymph node metastasis and 29.6% of 135 ESCC patients without lymph node metastasis. High MCL1 gain was associated with better survival in patients without lymph node metastasis 12 months later, and poorer survival in patients with lymph node metastasis 29 months later. In this study, we report for the first time that high MCL1 gain was delayed bidirectional prognostic factor, and its prognostic significance was different in patients with different status of lymph node metastasis.
The prognostic significance of high MCL1 gain was also compared in both stage I-II and III-IVa patients. We further certified that high MCL1 gain was delayed prognostic factor, and similar to lymph node status, its prognostic significance was different in earlier stage and later stage ESCC patients. The mechanism research and external validations need to be extensively investigated in the future.
In conclusion, we observed that high MCL1 gain was poorer prognostic factor for DFS and OS in later stage of ESCC patients (with lymph node metastasis or stage III-IVa) 29 months later. However, it was better prognostic factor for DFS and OS in earlier stage of ESCC patients (without lymph node metastasis or stage I-II) 12 months later. These findings might provide MCL1 as the useful way of detailed risk stratification in patients with ESCC, and an insight into pathogenesis and mechanism of progression in ESCC.
MATERIALS AND METHODS
Patients and samples
A total of 262 ESCC patients were enrolled in this retrospective study. All patients had undergone primary surgical resection (radical transthoracic or transhiatal esophagectomy with lymphadenectomy) at Zhongshan Hospital, Fudan University between 2007 and 2010. None of these patients had received prior anti-tumor therapy (neither chemotherapy nor radiochemotherapy). The study was reviewed and approved by the local institution’s Ethics Committee in accordance with the Declaration of Helsinki. Written informed consent was obtained from each patient for surgical specimen analyses.
The clinicopathological characteristics such as age, sex, smoking, location, and clinical stage were obtained from medical records and pathology reports. Hematoxylin and eosin (HE)-stained slides were reviewed by two pathologists to determine the histological subtypes, differentiation, invasion depth, lymph node metastasis, vessels and nerve involvement.
Tissue microarrays (TMA)
The TMA blocks were manufactured as previously described [32]. Briefly, HE-stained slides were reviewed and the representative areas of interest with a high density of tumor cells were circled. The corresponding regions were marked on archival formalin-fixed, paraffin-embedded (FFPE) tissue blocks. The core of 2 mm wide and 6 mm long was extracted, vertically planted into the recipient block and then aggregated on the aggregation instrument.
Fluorescence in situ hybridization (FISH)
To evaluate the copy number of MCL1, FISH assay was performed on the TMA sections of 5 mm thickness by using MCL1 probe (Abbott Molecular, Abbott Park, IL, USA) that hybridize to 1q21.2 (MCL1) with spectrum gold signal, and Hybridization instrument (Abbott Molecular), according to manufacturer’s instruction as previously described [33].
The FISH slides were interpreted by two independent and certified pathologists without information about the clinicopathologic characteristics. Tumor tissue was scanned to detect hot spots for MCL1 copy numbers by using ×400 magnification. If the MCL1 signals were homogeneously distributed, then random areas were selected to count the signals. Twenty non-overlapping tumor nuclei from three hot spots or random areas (60 nuclei per case) were evaluated, and the numbers of MCL1 signals were counted at ×1000 magnification. An identical protocol is used at our institution for the evaluation of MYC copy number variation [34], with respect to the number of counted nuclei: (1) high MCL1 gain (>5.0 average MCL1 gene copies/nucleus); (2) low MCL1 gain (2.5 to 5 average MCL1 copies/nucleus); and (3) normal or loss of MCL1 (<2.5 average MCL1 copies/nucleus).
Statistical analysis
Overall survival (OS) was defined as the time from surgery to the date of death from esophageal cancer; patients who were not reported as having died at the time of the analysis were censored at the date they were last known to be alive. Disease free survival (DFS) was defined as the time from surgery to first local, regional, or distant recurrence or death from any cause, whichever came first. Patients who were alive and did not experience recurrence at the time of the analysis were censored at the last disease assessment date.
The association between the clinicopathologic features and MCL1 status was analyzed using the chi-square or Fisher’ s exact test, as appropriate. The patients’ survival was analyzed by using the Kaplan-Meier method and the log-rank test was used to determine if there were any significant differences between the survival curves. Univariate and multivariate regression analyses were performed by using Cox’s proportional hazards model to determine the hazard ratio and 95% confidence intervals for each factor. P values<0.05 was considered as statistically significant (two-tailed). All statistical analyses were performed by SPSS21.0 (SPSS Inc, Chicago, IL, USA).
ACKNOWLEDGMENTS
We gratefully acknowledge the support of the patients and their families who agreed to contribute to this research program.
CONFLICTS OF INTEREST
Authors have no conflicts to disclose for this study/manuscript.
FUNDING
This work was supported by Shanghai Municipal Commission of Health and Family Planning, Key-developing disciplines (No.2015ZB0201).
REFERENCES
1. Pennathur A, Gibson MK, Jobe BA, Luketich JD. Oesophageal carcinoma. Lancet. 2013; 381: 400-412. https://doi.org/10.1016/s0140-6736(12)60643-6.
2. Chen W, Zheng R, Baade PD, Zhang S, Zeng H, Bray F, Jemal A, Yu XQ, He J. Cancer statistics in China, 2015. CA: Cancer J Clin. 2016; 66:115-132. https://doi.org/10.3322/caac.21338.
3. Arnold M, Soerjomataram I, Ferlay J, Forman D. Global incidence of oesophageal cancer by histological subtype in 2012. Gut. 2015; 64: 381-387. https://doi.org/10.1136/gutjnl-2014-308124.
4. Hanahan D, Weinberg RA. Hallmarks of cancer: the next generation. Cell. 2011; 144: 646-674. https://doi.org/10.1016/j.cell.2011.02.013.
5. Graidist P, Phongdara A, Fujise K. Antiapoptotic protein partners fortilin and MCL1 independently protect cells from 5-fluorouracil-induced cytotoxicity. Journal Biol Chem. 2004; 279: 40868-40875. https://doi.org/10.1074/jbc.M401454200.
6. Glaser SP, Lee EF, Trounson E, Bouillet P, Wei A, Fairlie WD, Izon DJ, Zuber J, Rappaport AR, Herold MJ, Alexander WS, Lowe SW, Robb L, Strasser A. Anti-apoptotic Mcl-1 is essential for the development and sustained growth of acute myeloid leukemia. Genes Dev. 2014; 26: 120-125. https://doi.org/10.1101/gad.182980.111.
7. Spinner S, Crispatzu G, Yi JH, Munkhbaatar E, Mayer P, Hockendorf U, Muller N, Li Z, Schader T, Bendz H, Hartmann S, Yabal M, Pechloff K, et al. Re-activation of mitochondrial apoptosis inhibits T-cell lymphoma survival and treatment resistance. Leukemia. 2016; 30: 1520-1530. https://doi.org/10.1038/leu.2016.49.
8. Duquette M, Sadow PM, Husain A, Sims JN, Antonello ZA, Fischer AH, Song C, Castellanos-Rizaldos E, Makrigiorgos GM, Kurebayashi J, Nose V, Van Hummelen P, Bronson RT, et al. Metastasis-associated MCL1 and P16 copy number alterations dictate resistance to vemurafenib in a BRAFV600E patient-derived papillary thyroid carcinoma preclinical model. Oncotarget. 2015; 6: 42445-42467. https://doi.org/10.18632/oncotarget.6442.
9. Goodwin CM, Rossanese OW, Olejniczak ET, Fesik SW. Myeloid cell leukemia-1 is an important apoptotic survival factor in triple-negative breast cancer. Cell Death Diff. 2015; 22: 2098-2106. https://doi.org/10.1038/cdd.2015.73.
10. Maji S, Samal SK, Pattanaik L, Panda S, Quinn BA, Das SK, Sarkar D, Pellecchia M, Fisher PB, Dash R. Mcl-1 is an important therapeutic target for oral squamous cell carcinomas. Oncotarget. 2015; 6: 16623-16637. https://doi.org/10.18632/oncotarget.3932.
11. Yin J, Li Y, Zhao H, Qin Q, Li X, Huang J, Shi Y, Gong S, Liu L, Fu X, Nie S, Wei S. Copy-number variation of MCL1 predicts overall survival of non-small-cell lung cancer in a Southern Chinese population. Cancer Med. 2016; 5: 2171-2179. https://doi.org/10.1002/cam4.774.
12. Akgul C. Mcl-1 is a potential therapeutic target in multiple types of cancer. Cell Mol Life Sci. 2016; 66: 1326-1336. https://doi.org/10.1007/s00018-008-8637-6.
13. Beroukhim R, Mermel CH, Porter D, Wei G, Raychaudhuri S, Donovan J, Barretina J, Boehm JS, Dobson J, Urashima M, McHenry KT, Pinchback RM, Ligon AH, et al. The landscape of somatic copy-number alteration across human cancers. Nature. 2010; 463: 899-905. https://doi.org/10.1038/nature08822.
14. Kozopas KM, Yang T, Buchan HL, Zhou P, Craig RW. MCL1, a gene expressed in programmed myeloid cell differentiation, has sequence similarity to BCL2. Pro Nat Acad Sci USA. 1993; 90: 3516-3520.
15. Thomas LW, Lam C, Edwards SW. Mcl-1; the molecular regulation of protein function. FEBS Letters. 2010; 584: 2981-2989. https://doi.org/10.1016/j.febslet.2010.05.061.
16. Yang T, Kozopas KM, Craig RW. The intracellular distribution and pattern of expression of Mcl-1 overlap with, but are not identical to, those of Bcl-2. J Cell Biol. 1995; 128: 1173-1184.
17. Peperzak V, Vikstrom I, Walker J, Glaser SP, LePage M, Coquery CM, Erickson LD, Fairfax K, Mackay F, Strasser A, Nutt SL, Tarlinton DM. Mcl-1 is essential for the survival of plasma cells. Nature Immunol. 2013; 14: 290-297. https://doi.org/10.1038/ni.2527.
18. Jamil S, Sobouti R, Hojabrpour P, Raj M, Kast J, Duronio V. A proteolytic fragment of Mcl-1 exhibits nuclear localization and regulates cell growth by interaction with Cdk1. Biochem J. 2005; 387: 659-667. https://doi.org/10.1042/bj20041596.
19. Jamil S, Mojtabavi S, Hojabrpour P, Cheah S, Duronio V. An essential role for MCL-1 in ATR-mediated CHK1 phosphorylation. Mol Biol Cell. 2008; 19: 3212-3220. https://doi.org/10.1091/mbc.E07-11-1171.
20. Ertel F, Nguyen M, Roulston A, Shore GC. Programming cancer cells for high expression levels of Mcl1. EMBO Rep. 2013; 14:328-336. https://doi.org/10.1038/embor.2013.20.
21. Kotschy A, Szlavik Z, Murray J, Davidson J, Maragno AL, Le Toumelin-Braizat G, Chanrion M, Kelly GL, Gong JN, Moujalled DM, Bruno A, Csekei M, Paczal A, et al. The MCL1 inhibitor S63845 is tolerable and effective in diverse cancer models. Nature. 2016; 538: 477-482. https://doi.org/10.1038/nature19830.
22. Singhi AD, Cimino-Mathews A, Jenkins RB, Lan F, Fink SR, Nassar H, Vang R, Fetting JH, Hicks J, Sukumar S, De Marzo AM, Argani P. MYC gene amplification is often acquired in lethal distant breast cancer metastases of unamplified primary tumors. Mod Pathol. 2011; 25: 378-387. https://doi.org/10.1038/modpathol.2011.171.
23. Yaziji H, Goldstein LC, Barry TS, Werling R, Hwang H, Ellis GK, Gralow JR, Livingston RB, Gown AM. HER-2 testing in breast cancer using parallel tissue-based methods. JAMA. 20014; 291: 1972-1977. https://doi.org/10.1001/jama.291.16.1972.
24. Tong JH, Yeung SF, Chan AW, Chung LY, Chau SL, Lung RW, Tong CY, Chow C, Tin EK, Yu YH, Li H, Pan Y, Chak WP, et al. MET Amplification and Exon 14 Splice Site Mutation Define Unique Molecular Subgroups of Non-Small Cell Lung Carcinoma with Poor Prognosis. Clin Cancer Res. 2013; 22:3048-3056.
25. Rice TW, Ishwaran H, Ferguson MK, Blackstone EH, Goldstraw P. Cancer of the Esophagus and Esophagogastric Junction: An 8th Edition Staging Primer. J Thorac Oncol. 2005; 12: 36-42.
26. Lin Z, Chen W, Chen Y, Peng X, Zhu K, Lin Y, Lin Q, Hu Z. A new classification of lymph node metastases according to the lymph node stations for predicting prognosis in surgical patients with esophageal squamous cell carcinoma. Oncotarget. 2016; 7: 76261-76273. https://doi.org/10.18632/oncotarget.12842.
27. Seton-Rogers S. Oesophageal cancer: Model refinement. Nature Rev Cancer. 2015; 15: 511.
28. Izbicki JR, Hosch SB, Pichlmeier U, Rehders A, Busch C, Niendorf A, Passlick B, Broelsch CE, Pantel K. Prognostic value of immunohistochemically identifiable tumor cells in lymph nodes of patients with completely resected esophageal cancer. New Engl J Med. 1997; 337: 1188-1194.
29. Wen J, Luo KJ, Liu QW, Wang G, Zhang MF, Xie XY, Yang H, Fu JH, Hu Y. The epithelial-mesenchymal transition phenotype of metastatic lymph nodes impacts the prognosis of esophageal squamous cell carcinoma patients. Oncotarget. 2016; 7: 37581-37588. https://doi.org/10.18632/oncotarget.9036.
30. Cheng C, Cui H, Zhang L, Jia Z, Song B, Wang F, Li Y, Liu J, Kong P, Shi R, Bi Y, Yang B, Wang J, et al. Genomic analyses reveal FAM84B and the NOTCH pathway are associated with the progression of esophageal squamous cell carcinoma. Gigascience. 2016; 5:1. https://doi.org/10.1186/s13742-015-0107-0.
31. Song Y, Li L, Ou Y, Gao Z, Li E, Li X, Zhang W, Wang J, Xu L, Zhou Y, Ma X, Liu L, Zhao Z, et al. Identification of genomic alterations in oesophageal squamous cell cancer. Nature. 2014; 509: 91-95. https://doi.org/10.1038/nature13176.
32. Shi Y, He D, Hou Y, Hu Q, Xu C, Liu Y, Jiang D, Su J, Zeng H, Tan Y. An alternative high output tissue microarray technique. Diag Pathol. 2013; 8: 9. https://doi.org/10.1186/1746-1596-8-9.
33. Jiang D, Li X, Wang H, Shi Y, Xu C, Lu S, Huang J, Xu Y, Zeng H, Su J, Hou Y, Tan L. The prognostic value of EGFR overexpression and amplification in Esophageal squamous cell Carcinoma. BMC Cancer. 2015; 15: 377. https://doi.org/10.1186/s12885-015-1393-8.
34. Perez EA, Jenkins RB, Dueck AC, Wiktor AE, Bedroske PP, Anderson SK, Ketterling RP, Sukov WR, Kanehira K, Chen B, Geiger XJ, Andorfer CA, McCullough AE, et al. C-MYC alterations and association with patient outcome in early-stage HER2-positive breast cancer from the north central cancer treatment group N9831 adjuvant trastuzumab trial. J Clin Oncol. 2011; 29: 651-659. https://doi.org/10.1200/jco.2010.30.2125.