
INTRODUCTION
Telomeres are specific DNA regions at the ends of chromosomes that prevent DNA damage and promote genomic stability [1, 2]. Telomeric DNA consists of tandem repeats of TTAGGG and is bound to a six subunit protein complex, referred to as shelterin or telosome, composed of TRF1, TRF2, TIN2, POT1, TPP1 and hRap1 [3]. Telomeres shorten with each round of DNA replication until a critical phase when they become dysfunctional, resulting in genomic instability [1-6]. Genomic alterations observed in cancers can be caused by inappropriate DNA repair at dysfunctional telomeres leading to chromosomal rearrangements, aneuploidy, and repression of DNA damage checkpoints [7]. To proliferate beyond the senescence checkpoint, cells must restore their telomere length (TL) [8]. Tumor cells maintain TL by reactivating human telomerase reverse transcriptase (hTERT), a ribonucleoprotein that catalyzes the synthesis and elongation of telomeres using an RNA template [8]. Moreover, an intratelomeric recombination mechanism known as alternative lengthening of telomeres (ALT) may be employed by tumor cells in order to ensure their replicative potential [9]. Telomeres in ALT cells are heterogeneous in length due to rapid deletions and elongations, which are thought to occur through high rates of inter-chromosomal recombination including a process termed telomere sister chromatid exchange (TSCE) [10]. In some primary tumors and cancer cell lines ALT-mechanism may substitute for or coexist with hTERT [11-13].
Neuroblastoma (NB), a pediatric malignancy of neuroectodermal origin, includes biologically and clinically heterogeneous tumors [14-15]. Tumor stage [14], age at diagnosis [18], tumor histology [19], MYCN amplification (MNA) [20], and ploidy [21] are the main prognostic factors for NB patients. MNA is strongly associated with rapid progression and poor prognosis irrespective of age and disease stage [22, 23].
hTERT is a prognostic marker in various adult and pediatric tumors, including NB [23-25], in which unchanged or long telomeres and high levels of telomerase expression/activity were found to predict poor outcome [26-29].
Here we have investigated TL and the involvement of hTERT and ALT-mechanism in TL maintenance in a series of NB tumors.
RESULTS
Diversity of Telomere Length in individual Neuroblastoma tumors
The IQ-FISH procedure on tissue sections is a suitable approach for the assessment of TL in relation to cell type, and in the context of tissue architecture [30-36]. TL was measured in 102 primary NB tumors by a modified IQ-FISH assay with ploidy correction that showed high sensitivity (0.1 kb of telomere repeats) and accuracy (99%) (Fig 1 A-C). Seventy NB cases (68.6%) displayed homogeneous TL, of which 42 were short, 25 long, and 3 normal. In the remaining 32 NB cases (31.4%), single cell analysis revealed the coexistence in the same tumor of two cancer cell subpopulations with differing TL, and namely i) normal and short telomeres, or ii) long and short telomeres, or iii) normal and long telomeres. These 32 NB cases displaying heterogeneous TL showed stage and age distribution, risk group, favorable or unfavorable histology, frequency of MNA and ploidy comparable to cases with homogeneous TL (Table S1).
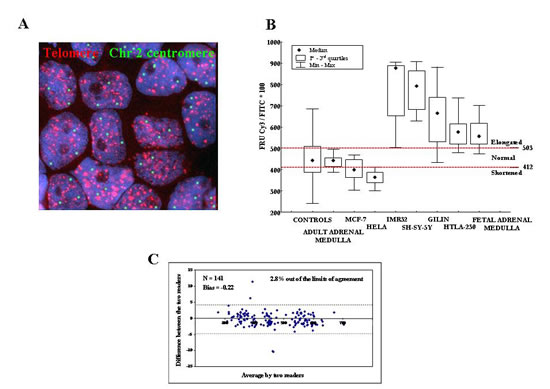
Figure 1: A: Interphase Quantitative Fluorescence in situ Hybridization (IQ-FISH) using pan-telomere (red) and chromosome 2 centromeric (green) peptide nucleic acid (PNA) probes in paraffin embedded NB tissue section. The nuclei are stained with DAPI (blue). Magnification x100. B: Calibration of IQ-FISH for TL measurements using four NB cell lines (IMR32, SHSY-5Y, GILIN and HTLA-230) and fetal adrenal medulla as long telomere controls, HeLa and MCF-7 cell lines as short telomere controls, peripheral blood mononuclear cells from adult healthy donors as well as adult adrenal medulla as normal telomere controls. We defined the minimum and maximum cut-off values of fluorescence ratio units (FRU) as 412 and 503, respectively. C: FRU values analyzed by two readers by means of the Bland and Altman’s plot. Except for four data points (4/141; 2.8%) all values fell within 95% of the limits of agreement.
The 102 NB samples were arbitrarily classified in five groups based upon TL: 1) 100% short TL (n=35); 2) higher than 50% short TL (n=6); 3) 100% normal TL or higher than 50% normal TL (n=12); 4) higher than or equal to 50% long TL (n=17); 5) 100% long TL (n=32). NB cases belonging to group 5 had significantly lower EFS (Figure 2A) and OS (Fig 2B) than cases belonging to group 1 after Bonferroni’s correction (PB<0.0001 and PB<0.0001, respectively).
NB cases with heterogeneous TL belonging to group 2 (i.e. predominance of short TL) had EFS and OS super-imposable to those of cases with homogeneously short TL belonging to group 1 (PB=0.90 and 0.99, respectively) (Fig 2A and 2B). Likewise, NB cases with heterogeneous TL belonging to group 4 (i.e. predominance of long TL) had EFS and OS super-imposable to those of cases with homogeneously long TL belonging to group 5 (PB=0.96 and 0.99, respectively) (Fig 2A and 2B).
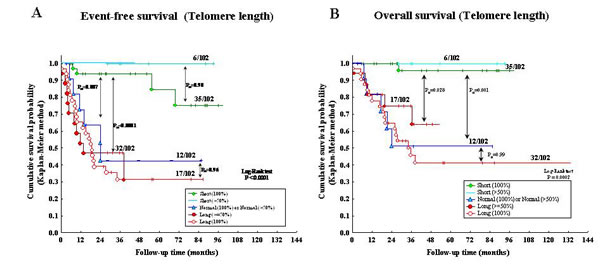
Figure 2: A: Kaplan-Meier Event-Free Survival curve for five patient groups based upon telomere length (TL). B: Kaplan-Meier Overall Survival curve for five groups based upon TL.
In contrast, significantly better EFS and OS were detected in cases with short (group 1) vs normal (PB=0.007 and 0.001, respectively) (group 3) or vs long (group 4) TL (PB<0.0001 and 0.028, respectively). Finally, EFS and OS curves of cases with heterogeneously (group 4) or homogeneously (group 5) long TL were super-imposable (PB=0.96 and 0.99, respectively) (Fig 2A and 2B).
Based upon the above results, cases belonging to groups 1 and 2 (i.e. short TL) or to groups 3, 4 and 5 (i.e. long/normal TL) were clustered in two groups in order to assess the prognostic impact of hTERT expression and ALT mechanism in relation to TL (see below).
Detection of ALT and h-TERT in tumor tissues
Telomere elongation is operated by telomerase and ALT mechanism, that is based on recombination of telomeric sequences and might cause heterogeneous TL in single cancer cells [10-12]. ALT was detected by FISH analysis [37-39] in 60/102 NB samples tested; one representative experiment is shown in Fig 3A. Sixteen out of 32 (50%) tumors with heterogeneous TL and 44/70 (62.9%) tumors with homogeneous TL were ALT positive (P=0.22).Variable expression of hTERT was detected by immunofluorescence in 99/102 (97%) NB specimens tested (Fig 3B). Thirty-one out of 99 (31.3%) tumors displayed high hTERT expression [(>0.398 units of fluorescence intensity (FI) while 68/99 (68.7%) showed low hTERT expression (≤0.398 FI). Twenty of 31 cases with high hTERT expression (64.5%) and 40/68 with low hTERT expression (58.8%) were ALT positive, indicating lack of correlation between ALT mechanism and hTERT expression levels (P=0.59).
The weighted means of the FRU values detected in each of the 32 tumors showing heterogeneous TL were used for the analyses reported in Fig 3 C, D, and E, as well as for Cox regression model. Two-ways analysis of TL variance in relation to presence or absence of ALT and high or low hTERT expression showed that the two mechanisms of telomere elongation operated independently each other (Fig 3C). A statistically non significant trend to longer telomeres in ALT positive vs ALT negative cases independent of the levels of hTERT expression was observed (Fig 3C).
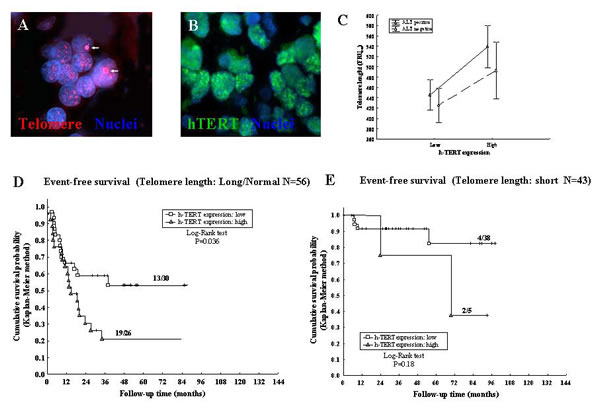
Figure 3: A: ALT positive NB cells showing ALT-associated bright intra-nuclear foci of telomere FISH signals (red) (arrows). Nuclear DNA was counterstained with DAPI (blue). B: Immunofluorescence nuclear labeling for the catalytic subunit of telomerase hTERT (green). C: Variance analysis of TL in relation to presence or absence of ALT and to high or low hTERT expression. D: Kaplan-Meier Event-Free Survival curve for long/normal TL and hTERT expression. E: Kaplan-Meier Event-Free Survival curve for short TL and hTERT expression.
Event-Free and Overall Survival analysis
EFS and OS analyses, with details about incidence rates of relapses and/or death, with 95% CI, HRs and P values are shown in Table 1. There was a significant relationship between all variables reported in Table 1 and the occurrence of relapse or death. In particular, normal TL patients showed higher incidence rate of relapse/death (27.7× 1000 pm) with respect to short TL patients (3.3 1000 pm) (P<0.0001); the same higher incidence rate was observed in long TL patients (22.7× 1000 pm).
The same variables that were related to EFS influenced OS, with the exception of ploidy that was not statistically significant. In contrast, ALT-mechanism emerged as a significant prognostic factor since OS was reduced in ALT positive vs ALT negative patients (P=0.035) (Table 1).
Prognostic impact of hTERT expression and ALT mechanism in relation to Telomere Length
Positivity or negativity for ALT-mechanism had no effect on TL-related EFS, as assessed by Kaplan-Meyer analyses (Table 1). EFS of NB patients with long/normal TL (Fig 3D) was significantly reduced when hTERT expression was high vs low (P=0.036), whereas EFS of patients with short TL (Fig 3E) was unaffected by hTERT expression levels (P=0.18). We next subdivided NB patients into four groups based upon positivity/negativity for ALT and high/low hTERT tumor expression, i.e. i) hTERT low/ALT-negative, ii) hTERT low/ALT-positive, iii) hTERT high/ALT-negative, and hTERT high/ALT-positive.
Table 1: Incidence Rates and Hazard Ratios (HR) for Event-Free Survival (EFS) and Overall Survival (OS); (N=102)
N |
Number (%) of relapses or deaths |
Incidence Rates |
HR |
Number (%) of deaths |
Incidence Rates |
HR |
|
Age |
|||||||
≥ 18 months |
44 |
25 (56.8%) |
19.4 (13.1-28.7) |
2.45 (P=0.017) |
19 (43.2%) |
12.3 (7.9-19.3) |
3.2 (P=0.006) |
< 18 months (reference) |
58 |
16 (27.6%) |
7.9 (4.8-12.9) |
9 (15.5%) |
3.9 (2.0-7.5) |
||
Stage |
|||||||
4 |
31 |
20 (64.5%) |
19.2 (12.4-29.8) |
2.1 (P=0.004) |
18 (58.1%) |
15.1 (9.5-24.0) |
4.0 (P<0.0001) |
1, 2, 3, 4s (reference) |
71 |
21 (29.6%) |
9.2 (6.0-14.2) |
10 (14.1%) |
3.7 (2.0-7.0) |
||
MYCN status |
|||||||
Amplified |
44 |
25 (56.8%) |
22.6 (15.3-33.4) |
3.1 (P=0.004) |
21 (47.7%) |
17.1 (11.2-26.2) |
6.4 (P<0.0001) |
Not amplified (reference) |
58 |
16 (27.6%) |
7.25 (4.4-11.8) |
7 (12.1%) |
2.7 (1.3-5.6) |
||
Ploidy |
|||||||
Diploid |
49 |
26 (53.1%) |
16.6 (11.3-24.4) |
1.9 (P=0.029) |
17 (34.7%) |
9.0 (5.6-14.5) |
1.6 (P=0.10) |
Hyperdiploid (reference) |
53 |
15 (28.3%) |
8.6 (5.2-14.2) |
11 (20.7%) |
5.6 (3.1-10.1) |
||
Histology |
|||||||
Unfavorable histology |
50 |
30 (60.0%) |
19.3 (13.5-27.7) |
3.1 (P=0.001) |
24 (48.0%) |
13.2 (8.8-19.6) |
6.7 (P<0.0001) |
Favorable histology (reference) |
52 |
11 (21.1%) |
6.2 (3.45-11.3) |
4 (7.7%) |
2.0 (0.7-5.2) |
||
Risk Group (N=86) |
|||||||
High/Intermediate |
58 |
33 (56.9%) |
19.4 (13.5-27.7) |
4.8 (P=0.002) |
27 (46.6%) |
13.8 (9.5-20.1) |
15.2 (P=0.0003) |
Low (reference) |
28 |
4 (14.3%) |
4.0 (1.5-10.7) |
1 (3.6%) |
0.9 (0.1-6.5) |
||
Telomere length |
|||||||
Long |
46 |
27 (58.7%) |
22.7 (15.6-33.2) |
7.0 (P<0.0001) |
19 (41.3%) |
12.2 (7.8-19.1) |
7.8 (P=0.0006) |
Normal |
13 |
8 (61.5%) |
27.75 (13.9-55.5) |
8.5 |
6 (46.1%) |
16.0 (7.2-35.6) |
10.2 |
Short (reference) |
43 |
6 (13.9%) |
3.26 (1.5-7.3) |
3 (7.0%) |
1.6 (0.5-4.8) |
||
h-TERT (N=99) |
|||||||
> 0.398 (> 0.205) |
31 |
21 (67.7%) |
26.1 (17.0-40.1) |
3.8 (P<0.0001) |
23/61 (37.7%) |
10.6 (7.0-16.0) |
5.9 (P=0.003) |
≤ 0.398 (≤ 0.205) |
68 |
17 (25.0%) |
6.8 (4.3-11.0) |
3/38 (7.9%) |
1.8 (0.6-5.7) |
||
ALT mechanism |
|||||||
Positive |
60 |
28 (46.7%) |
15.1 (10.4-21.9) |
1.7 (P=0.11) |
21 (35.0%) |
9.5 (6.2-14.5) |
2.2 (P=0.035) |
Negative |
42 |
13 (30.9%) |
8.9 (5.2-15.3) |
7 (16.7%) |
4.3 (2.0-9.0) |
P values refer to the Log-Rank test.
hTERT expression combined with ALT-mechanism influenced significantly OS, as assessed by Kaplan-Meier analyses (P=0.0026) (Fig 4A). Thus, NB patients with high hTERT/ALT positivity showed significantly lower OS than patients with low hTERT/ALT-negativity (PB=0.017). Finally, OS of patients with low hTERT expression did not significantly differ in ALT positive vs negative cases.
Since age is the most important prognostic factor in NB [18], we next evaluated EFS of the following patient groups, i) hTERT low/age ≤18 months, ii) hTERT low/age >18 months, iii) hTERT high/age ≤18 months, and iv) hTERT high/age >18 months. Patients older than 18 months with high hTERT had a significantly reduced EFS compared to patients <18 months with low hTERT (PB =0.0004) (Fig 4B).
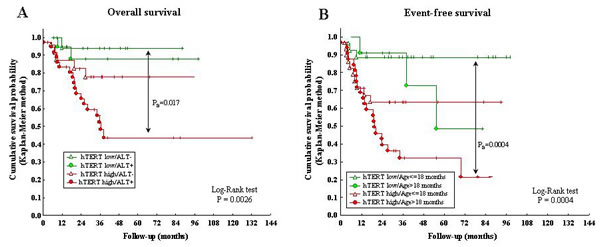
Figure 4: A: Kaplan-Meier Overall Survival curve for ALT positivity/negativity and hTERT high/low expression. B: Kaplan-Meier Event-Free Survival curve for hTERT high/low expression and age at diagnosis (> or ≤18 months).
Finally, we performed best fitted Cox regression model for EFS and OS of our NB patient cohort. Long or normal TL was the best independent predictor of relapse (P=0.003), followed by tumor stage 4 (P=0.03) and high hTERT expression (P=0.03). Stage 4 and MNA were the best independent predictors of relapse (P<0.0001 and 0.0002, respectively), followed by high hTERT expression (P=0.002) (Table 2).
Table 2: Best fitted Cox regression model for Event-Free Survival (EFS) and Overall Survival (OS)
HRAdj |
(95% CI) |
P |
|
Event-Free Survival (EFS) (n. events/total: 38/99; 38.4%) |
|||
Telomere length: Long vs Short (reference) |
4.0 |
1.6 – 10.3 |
0.003 |
Normal vs Short (reference) |
4.3 |
1.4 – 13.4 |
|
Stage = 4 vs 1, 2, 3, 4s (reference) |
2.1 |
1.1 – 4.0 |
0.03 |
h-TERT: > 0.398 vs ≤ 0.398 (reference) |
2.1 |
1.1 – 4.1 |
0.03 |
Overall Survival (OS) (n. events/total: 26/99; 26.3%) |
|||
Stage = 4 vs 1, 2, 3, 4s (reference) |
5.4 |
2.3 – 12.5 |
<0.0001 |
MYCN status: Amplified vs Not amplified (reference) |
4.6 |
1.9 – 11.1 |
0.0002 |
h-TERT: > 0.205 vs ≤ 0.205 (reference) |
5.7 |
1.7 – 19.1 |
0.002 |
P values refer to the Log-Likelihood Ratio test.
DISCUSSION
We have shown that one third of NB tumors contained two cancer cell subpopulations with different TL, as assessed by NB-tailored IQ-FISH with data normalization for DNA ploidy [33]. This latter step is critical to minimize misinterpretations due to the abnormal number of chromosomes possibly present in the nucleus of cancer cells.Our results are consistent with a model whereby genomic crisis generated due to telomere attrition induces subclonal heterogeneity, potentially leading to TL heterogeneity [40].The translational impact of the results obtained is highlighted by the finding that patients with predominantly (>50%) long/normal TL had the same unfavorable EFS and OS as patients with homogenously long/normal TL. Thus, the former patients might belong to a novel risk category. Failure of previous studies on NB patients to identify heterogeneous TL in individual tumors likely depends on the need for i) single cells analysis using methods as IQ-FISH or flow FISH, and ii) ploidy normalization.
Telomeres in ALT cells are highly heterogeneous in length and are maintained through a mechanism involving recombination [10], whose pathway remains to be elucidated. We investigated ALT-mechanism and hTERT expression, that correlates with the catalytic activity of telomerase [24], in NB cases with heterogeneous vs homogeneous TL. ALT-mechanism, that was detected in more than half of the tumors investigated, was unrelated to TL. Other investigators have correlated ALT-mechanism with long TL in NB, but the patient groups analyzed were too small to draw any definitive conclusion [29].
In our study, ALT-mechanism and hTERT operated independently each other. Presence or absence of ALT-mechanism had no prognostic relevance in NB cases with low hTERT expression, but coexistence of high hTERT and ALT reduced significantly OS compared to cases with high hTERT and absence of ALT. These latter findings suggest that hTERT and ALT may cooperate in promoting NB progression.
Here we show for the first time that ALT-mechanism and hTERT were co-expressed in approximately 60% of individual NB tumors. Whether ALT-mechanism and hTERT expression occur in mutually exclusive tumor cell subsets or rather in the same cell population warrants further investigation. In this respect, ALT-mechanism and hTERT expression were detected in discrete subpopulations of primary osteosarcoma cells [41].
Cox regression analysis showed that high hTERT expression was a robust independent predictor of EFS and OS for our NB patients, consistent with most, but not all, previous reports [27, 41-44]. Nonetheless, we found that high hTERT expression showed only a moderate correlation with TL (R=0.48), suggesting that the unfavorable prognosis of NB patients with high hTERT expression may be related to telomerase functions other than telomere elongation [6], such as i) transcriptional modulation of Wnt/ β-catenin signaling pathway [45]; ii) enhancement of cell proliferation and/or resistance to apoptosis [45]; iii) involvement in DNA-damage repair [46]; iv) activity as RNA-dependent RNA polymerase [47]. Moreover, when telomeres become critically short, they activate a DNA damage response and trigger the induction of replicative cellular senescence that can be suppressed by over-expression of hTERT [3].
We finally investigated the prognostic impact of high/low hTERT expression in relation to age at diagnosis lower or higher than 18 months [18]. Patients older than 18 months with high hTERT expression had worse EFS than patients of the same age with low hTERT expression. Likewise, patients younger than 18 months with high hTERT expression showed worse EFS than patients of the same age group with low hTERT expression. Taken together, these results demonstrate that high hTERT expression represents an unfavorable prognostic factor irrespective of patient age.
In conclusion, diversity of TL in individual NB tumors was strongly associated with disease progression and death. High hTERT associated with ALT-mechanism may represent a novel biomarker of poor prognosis.
METHODS
Patients and Clinical Follow-up
A retrospective series of primary tumors from 102 NB patients was collected at the Istituto Giannina Gaslini, Genova (90 patients), Italy and at the Medical School of the University of Valencia, Spain (12 patients), from January 2000 to December 2008. Table S1 shows the demographic characteristics of the patients investigated. The study was approved by the Institutional Review Boards of the two participating Institutions and informed consent was obtained from patients or their legal guardians.
Patients were classified according to the International Neuroblastoma Staging System [14] and to the International NB Risk Group (INRG) [22] classifications. Eligibility criteria for inclusion in the analytic cohort were diagnosis of bona fide NB and lack of any treatment at study. Twenty-eight patients died of disease. Seventy-four survivors were followed-up and categorized at the time of their last clinical examination. Clinical follow-up was performed for all patients with a median follow-up time of 3.6 years, with a minimum follow-up duration, in surviving patients, of 3.1 months. Event-Free Survival (EFS) was calculated from diagnosis to last follow-up or event (first occurrence of relapse, progression, or death). Overall Survival (OS) was calculated from diagnosis to last follow-up or death.
Tumor Specimens
Formalin-fixed, paraffin-embedded tissue sections from 102 NB tumors were studied. Each tumor area tested for TL contained malignant cells, as assessed by histological examination. Quantification of telomere fluorescence intensity was performed on serial tumor tissue sections, thus allowing telomere quantification in tumor areas selected by the pathologist. Tumor cells were distinguished in the samples using NB-specific marker NB84 [47]. All tumors were evaluated at the time of diagnosis prior to any treatment other than surgery.
Telomere Length Measurement
Interphase Quantitative Fluorescence In Situ Hybridization (IQ-FISH) [30-36] was performed on 4-μm-thick paraffin-embedded NB tissue sections. The Cy3-labeled PNA probe specific for telomeric sequences (Telomere PNA FISH Kit/Cy3, Dako) and, as internal reference, the FITC-labelled PNA probe specific for chromosome 2 centromere (kindly provided by Dako), were used. To define cut-off values the following samples were tested, i) peripheral blood mononuclear cells (PBMC) from nine human healthy subjects, obtained after informed consent and isolated on Ficoll-Hypaque gradients, ii) the MCF7 and HeLa human tumor cell lines with known TL of 4.07 Kb 3.44 Kb, respectively [32], iii) cytospins of PBMC fractions and IMR32, SHSY-5Y, GILIN and HTLA-230 NB cell lines that had been fixed in 0.5% paraformaldehyde for 20 min to simulate formalin-fixed tissues [31, 32], and iv) paraffin-embedded tissue sections from adult and fetal adrenal medulla.
Telomere and centromere fluorescence signals were automatically quantified on serial tumor tissue sections selected by the pathologist by using the fluorescence-based microscopic scanning system E-1000 Nikon with appropriate filters set and a high-resolution CCD camera, and the image analysis software Genikon (Nikon, Tokyo, Japan). A nuclear area for each cell was manually selected by the operator to measure centromere and telomere fluorescence intensities in the FITC and Cy3 images, respectively (Fig 1A). These latter fluorescence intensities were analyzed by scanning three consecutive serial images in order to avoid the loss of portions of the nucleus. The slide scanning and cell analysis procedures were performed by using a 100x objective (Nikon). We measured Cy3 pan-telomeric probe and chromosome 2 FITC centromeric probe fluorescence signal intensities in single nuclei and expressed the ratio between the former and the latter intensity values arbitrary fluorescence ratio units (FRU). A minimum of 20 nuclei were scanned and the mean value of the FRU was calculated. FRU values corresponded to TL and were corrected for ploidy as reported [33].
In order to define cut-off points for TL measurement by IQ-FISH, NB cell lines (IMR32, SHSY-5Y, GILIN and HTLA-230) [27] and fetal adrenal medulla samples were used as long telomere controls (coded as 1), HeLa and MCF-7 cell lines as short telomere controls [34], PBMCs from adult healthy donors and adult adrenal medulla as normal telomere controls. We determined the minimum and maximum cut-off values of FRU as 411.9 and 503.3, respectively (Fig 1B). Cut-off points were determined by means of the ROC curve analysis in two steps; the first cut-off was determined defining as “abnormally long” TL populations coded as 1, and the remaining cells lines (short and normal) coded as 0, obtaining, in the first ROC curve, the value of 503.3. The second cut-off was determined defining as “abnormally short” HeLa and MCF-7 cell lines (coded as 1) versus all the remaining cell lines, obtaining the value of 411.9.
Reproducibility of Telomere Length Measurement
Effects of the fixation procedure on determination of FRU
To evaluate the potential deleterious effect of nuclear truncation induced by cut sections [31, 32] we compared TL assessed by IQ-FISH on intact nuclei from four paraformaldehyde-fixed tumor touch preparations and four paired paraffin-embedded tissue sections to simulate standard pathology slide preparation procedures. IQ-FISH gave strong nuclear signals on both tissue sections and touch preparations. The IQ-FISH coefficient of variation (CV) ranges were 5.79%-8.95% for formalin-fixed tissue sections and 3.3%-13.9% for paraformaldehyde-fixed touch preparations. These differences were not significant, indicating that the fixation procedure did not affect FRU.
Inter-assay variation
To estimate the reproducibility of IQ-FISH, serial tissue sections from the same specimen were processed in different experiments at different time points. The best CV observed was 2.3% and the worst was 15.5% with a median CV of 7.1%, indicating a good reproducibility of the assay.
Telomere Length Measurement by two independent investigators
We compared the FRU values (i.e. the ratio between telomere and centromere fluorescence intensities indicating TL) of all specimens analyzed and of all controls determined by two investigators using the Bland and Altman’s plot. Except for four data points (4/141; 2.8%), all values fell within 95% of the limits of agreement (Fig 1C) and the bias value was good (Bias=-0.22). The Intra-class Correlation Coefficient was excellent (ICC=0.999).
ALT assessment
ALT mechanism was detected as large ultra-bright intra-nuclear foci of telomere FISH signals [37-39] following hybridization with Cy3 pan-telomeric probe. Tumors containing ≥1% tumor cells displaying ALT-associated telomeric foci were considered ALT-positive [37-39].
Quantification of hTERT Expression
Paraffin-embedded NB tissue sections were stained overnight at 4° C using indirect immunofluorescence with a monoclonal antibody anti-hTERT (1:100; Lab Vision, Fremont, CA, USA). The slides were incubated with FITC-labeled secondary antibody (1:1000) at 37° for 1 h. hTERT fluorescence intensity was quantified using the Genikon software. Results were expressed as mean fluorescence intensity (FI) from at least 20 nuclei.
Statistical Analysis
Descriptive statistics were firstly performed and data were reported in terms of median values and 1st and 3rd quartiles (1st – 3rd q) for quantitative variables, in terms of absolute frequencies and percentages for categorical variables. The IQ-FISH inter-assay variation was estimated calculating the coefficient of variation (CV), i.e. standard deviation divided by the mean Fluorescence Ratio Unit (FRU) and multiplied by 100. The FDA recommended limit for CV% is <15% [48]. Bland and Altman’s plot was used to assess the agreement between the two investigators’ readings of FRU; this plot shows the differences of the two measurements (Y-axis) with respect to the their means (X-axis). The bias (mean of all differences) should be close to zero. Moreover the agreement between the two readings was evaluated by means of the Intra-class Correlation Coefficient (ICC) [49].
Categorical data were reported in terms of absolute frequencies and percentages (Table 1) and compared by the Chi-square test or by the Fisher’s Exact test whenever expected frequencies were less than 5.
Receiver operating characteristic (ROC) curves were used to determine the best cut-off point for defining high/low h-TERT expression using event-free status as the main outcome variable; a value=0.398 was obtained; a second cut-off point for h-TERT expression (obtained by the same ROC curve method) was calculated for OS (considering only life status as outcome of interest); in this case a value=0.205 was obtained. Two-ways analysis of variance was used to evaluate telomere length in relation to presence/absence of ALT and high/low hTERT expression. As some tumors showed heterogeneous TL, the weighted mean of the FRU values was calculated and used for the analyses reported in Fig 3 C, D, and E, as well as in survival analyses.
EFS and OS curves were drawn categorizing for a series of demographic and clinical variables; these curves were estimated using the Kaplan-Meier method and compared by the log-rank test with P<0.05 considered statistically significant.
For each category of the demographic and clinical variables, the absolute number of relapses or deaths, the incidence rates expressed × 1000 person-months (pm) with 95% Confidence Intervals (95% CI), Hazard Ratios (HRs) and statistical significance obtained from the Log Rank test were calculated and reported. Factors significantly associated with higher probability of observing relapse or death were then tested in a Cox proportional hazards regression model. The Log-Likelihood Ratio test (LR test) was used for comparisons.
The statistical packages used were the Statistica (version 9.0, StatSoft Corp., Tulsa, OK, USA) for bivariate analyses and the Stata release 7 (Stata Corporation, Texas, USA) for multivariate analyses.
Acknowledgments
This study was supported by Fondazione Italiana Neuroblastoma, and Project Ricerca Finalizzata, Ministero della Salute “The primary and metastatic cancer stem cells microenvironment in neuroectodermal tumors: studies in human neuroblastoma and melanoma” (grant number G21J11000040001),“5 per mille IRPEF Finanziamento della Ricerca Sanitaria”, and Finanziamento Ricerca Corrente. We thank Dr Samuel Navarro to provide study materials of NB patients from the Medical School of the University of Valencia, Spain. Dr Giovanni Erminio is fellow of the Fondazione Italiana Neuroblastoma.
Disclosure of potential conflicts of interest
The authors declare no competing financial interests.
REFERENCES
1. Blackburn EH. Structure and function of telomeres. Nature 1991;350:569-573.
2. Zhou J, Richardson M, Reddy V, Menon M, Barrack ER, Reddy GP, Kim SH. Structural and functional association of androgen receptor with telomeres in prostate cancer cells. Aging (Albany NY). 2013;5:3-17.
3. Mitchell TR, Zhu XD. Methylated TRF2 associates with the nuclear matrix and serves as a potential biomarker for cellular senescence. Aging (Albany NY). 2014;6:248-263.
4. Blackburn EH. Telomere states and cell fates. Nature 2000;408: 53e6.
5. Blasco MA. Telomeres and human disease: ageing, cancer and beyond. Nature 2005;6:611-622.
6. Hanahan D, Weinberg RA. Hallmarks of cancer: the next generation. Cell 2011;144:646-674.
7. Nakamura AJ, Redon CE, Bonner WM, Sedelnikova OA. Telomere-dependent and telomere-independent origins of endogenous DNA damage in tumor cells. Aging (Albany NY). 2009;1:212-218.
8. Cong Y, Shay JW. Actions of human telomerase beyond telomeres. Cell Res 2008;18:725-732.
9. Muntoni A, Reddel RR. The first molecular details of ALT in human tumor cells. Hum Mol Genet 2005;2:191-196.
10. Li B, Reddy S, Comai L. Depletion of Ku70/80 reduces the levels of extrachromosomal telomeric circles and inhibits proliferation of ALT cells. Aging (Albany NY). 2011;3:395-406.
11. Bryan TM, Englezou A, Dalla-Pozza L, Dunham MA, Reddel RR. Evidence for an alternative mechanism for maintaining telomere length in human tumors and tumor-derived cell lines. Nat Med 1997;3:1271-1274.
12. Cerone MA, Londono-Vallejo JA, Bacchetti S. Telomere maintenance by telomerase and by recombination can coexist in human cells. Hum Mol Genet 2001;10:1945-1952.
13. Tomaska L, Nosek J. Telomere heterogeneity: taking advantage of stochastic events. FEBS Lett 2009;583:1067-1071.
14. Brodeur GM, Pritchard J, Berthold F, Carlsen NL, Castel V, Castelberry RP, De Bernardi B, Evans AE, Favrot M, Hedborg F. Revisions of the international criteria for neuroblastoma diagnosis, staging, and response to treatment. J Clin Oncol 1993;11:1466-1477.
15. Brodeur GM. Neuroblastoma: biological insights into a clinical enigma. Nat Rev Cancer 2003;3:203-216.
16. Maris JM. Recent advances in neuroblastoma. N Engl J Med 2010;362:2202-2211.
17. Cheung NK, Dyer MA. Neuroblastoma: developmental biology, cancer genomics and immunotherapy. Nat Rev Cancer 2013;13:397-411.
18. Moroz V, Machin D, Faldum A, Hero B, Iehara T, Mosseri V, Ladenstein R, De Bernardi B, Rubie H, Berthold F, Matthay KK, Monclair T, Ambros PF, Pearson AD, Cohn SL, London WB. Changes over three decades in outcome and the prognostic influence of age-at-diagnosis in young patients with neuroblastoma: a report from the International Neuroblastoma Risk Group Project. Eur J Cancer 2011;47:561-571.
19. Shimada H, Ambros IM, Dehner LP, Hata J, Joshi VV, Roald B, Stram DO, Gerbing RB, Lukens JN, Matthay KK, Castleberry RP. The International Neuroblastoma Pathology Classification (the Shimada system). Cancer 1999;86:364-372.
20. Schneiderman J, London WB, Brodeur GM, Castleberry RP, Look AT, Cohn SL. Clinical significance of MYCN amplification and ploidy in favorable-stage neuroblastoma: a report from the Children’s Oncology Group. J Clin Oncol 2008;26:913-918.
21. Look AT, Hayes FA, Shuster JJ, Douglass EC, Castleberry RP, Bowman LC, Smith EI, Brodeur GM. Clinical relevance of tumor cell ploidy and N-myc gene amplification in childhood neuroblastoma: a Pediatric Oncology Group study. J Clin Oncol 1991;9:581-591.
22. Cohn SL, Pearson AD, London WB, Monclair T, Ambros PF, Brodeur GM, Faldum A, Hero B, Iehara T, Machin D, Mosseri V, Simon T, Garaventa A, Castel V, Matthay KK; INRG Task Force. The International Neuroblastoma Risk Group (INRG) Classification System: An INRG task force report. J Clin Oncol 2009;27:289-297.
23. Monclair T, Brodeur GM, Ambros PF, Brisse HJ, Cecchetto G, Holmes K, Kaneko M, London WB, Matthay KK, Nuchtern JG, von Schweinitz D, Simon T, Cohn SL, Pearson AD; INRG Task Force. The International Neuroblastoma Risk Group (INRG) staging system: an INRG Task Force report. J Clin Oncol 2009;27:298-303.
24. Poremba C, Scheel C, Hero B, Christiansen H, Schaefer KL, Nakayama Ji, Berthold F, Juergens H, Boecker W, Dockhorn-Dworniczak B. Telomerase activity and telomerase subunits gene expression patterns in neuroblastoma: a molecular and immunohistochemical study establishing prognostic tools for fresh-frozen and paraffin-embedded tissues. J Clin Oncol 2000;18:2582-2592.
25. Hiyama E, Hiyama K. Telomerase as tumor marker. Cancer Lett 2003;194:221-233.
26. Hiyama E, Hiyama K, Yokoyama T, Ichikawa T, Matsuura Y. Length of telomeric repeats in neuroblastoma: Correlation with prognosis and other biological characteristics. J Cancer Res 1992;83:159-164.
27. Binz N, Shalaby T, Rivera P, Shin-ya K, Grotzer MA. Telomerase inhibition, telomere shortening, cell growth suppression and induction of apoptosis by telomestatin in childhood neuroblastoma cells. Eur J Cancer 2005;41:2873-2881.
28. Ohali A, Avigad S, Ash S, Goshen Y, Luria D, Feinmesser M, Zaizov R, Yaniv I. Telomere length is a prognostic factor in neuroblastoma. Cancer 2006;107:1391-1399.
29. Lundberg G, Sehic D, Länsberg JK, Øra I, Frigyesi A, Castel V, Navarro S, Piqueras M, Martinsson T, Noguera R, Gisselsson D. Alternative lengthening of telomeres-an enhanced chromosomal instability in aggressive non-MYCN amplified and telomere elongated neuroblastomas. Genes Chromosomes Cancer 2011;50:250-262.
30. Martens UM, Zijlmans JM, Poon SS, Dragowska W, Yui J, Chavez EA, Ward RK, Lansdorp PM. Short telomeres on human chromosome 17p. Nat Genet 1998;18:76-80.
31. Ferlicot S, Youssef N, Feneux D, Delhommeau F, Paradis V, Bedossa P. Measurement of telomere length on tissue sections using quantitative fluorescence in situ hybridization (Q-FISH). J Pathol. 2003;200:661-666.
32. O’Sullivan JN, Finley JC, Risques RA, Shen WT, Gollahon KA, Moskovitz AH, Gryaznov S, Harley CB, Rabinovitch PS. Telomere length assessment in tissue sections by quantitative FISH: image analysis algorithms. Cytometry A 2004;58:120-131.
33. Narath R, Lörch T, Greulich-Bode KM, Boukamp P, Ambros PF. Automatic Telomere Length Measurements in Interphase Nuclei by IQ-FISH. Cytometry A 2005;68:113-120.
34. Canela A, Vera E, Klatt P, Blasco MA. High-throughput telomere length quantification by FISH and its application to human population studies. Proc Natl Acad Sci USA 2007;104:5300-5305.
35. Cafueri G, Parodi F, Pistorio ABertolotto M, Ventura F, Gambini C, Bianco P, Dallegri F, Pistoia V, Pezzolo A, Palombo D. Endothelial and smooth muscle cells from abdominal aortic aneurysm have increased oxidative stress and telomere attrition. PLoS One 2012;7:e35312.
36. Vera E, Blasco MA. Beyond average: potential for measurement of short telomeres. Aging (Albany NY). 2012;4:379-392. Review.
37. Heaphy CM, de Wilde RF, Jiao Y, Klein AP, Edil BH, Shi C, Bettegowda C, Rodriguez FJ, Eberhart CG, Hebbar S, Offerhaus GJ, McLendon R, Rasheed BA, He Y, Yan H, Bigner DD, Oba-Shinjo SM, Marie SK, Riggins GJ, Kinzler KW, Vogelstein B, Hruban RH, Maitra A, Papadopoulos N, Meeker AK. Altered telomeres in tumors with ATRX and DAXX mutations. Science 2011;333:425.
38. Heaphy CM, Subhawong AP, Hong SM, Goggins MG, Montgomery EA, Gabrielson E, Netto GJ, Epstein JI, Lotan TL, Westra WH, Shih IeM, Iacobuzio-Donahue CA, Maitra A, Li QK, Eberhart CG, Taube JM, Rakheja D, Kurman RJ, Wu TC, Roden RB, Argani P, De Marzo AM, Terracciano L, Torbenson M, Meeker AK. Prevalence of the alternative lengthening of telomeres telomere maintenance mechanism in human cancer subtypes. Am J Pathol. 2011;179:1608-1615.
39. Cheung NK, Zhang J, Lu C, Parker M, Bahrami A, Tickoo SK, Heguy A, Pappo AS, Federico S, Dalton J, Cheung IY, Ding L, Fulton R, Wang J, Chen X, Becksfort J, Wu J, Billups CA, Ellison D, Mardis ER, Wilson RK, Downing JR, Dyer MA. Association of age at diagnosis and genetic mutations in patients with neuroblastoma. JAMA 2012;307:1062-1071.
40. Campbell PJ. Telomeres and cancer: from crisis to stability to crisis to stability. Cell 2012;148:633-635.
41. Gocha AR, Nuovo G, Iwenofu OH, Groden J. Human sarcomas are mosaic for telomerase-dependent and telomerase-independent telomere maintenance mechanisms: implications for telomere-based therapies. Am J Pathol 2013;182:41-48.
42. Tabori U, Wong V, Ma Jet, Shago M, Alon N, Rutka J, Bouffet E, Bartels U, Malkin D, Hawkins C. Telomere maintenance and dysfunction predict recurrence in pediatric ependymoma. British Journal of Cancer 2008;99:1129-1135.
43. Nguyen DN, Heaphy CM, de Wilde RF, Orr BA, Odia Y, Eberhart CG, Meeker AK, Rodriguez FJ. Molecular and morphologic correlates of the alternative lengthening of telomeres phenotype in high-grade astrocytomas. Brain Pathol 2013;23:237-243.
44. von Stedingk K, Koster J, Piqueras M, Noguera R, Navarro S, Påhlman S, Versteeg R, Ora I, Gisselsson D, Lindgren D, Axelson H. snoRNPs Regulate Telomerase Activity in Neuroblastoma and Are Associated with Poor Prognosis. Transl Oncol 2013;6:447-457.
45. Park JI, Venteicher AS, Hong JY, Choi J, Jun S, Shkreli M, Chang W, Meng Z, Cheung P, Ji H, McLaughlin M, Veenstra TD, Nusse R, McCrea PD, Artandi SE. Telomerase modulates Wnt signalling by association with target gene chromatin. Nature 2009;460:66-72.
46. Masutomi K, Possemato R, Wong JM, Currier JL, Tothova Z, Manola JB, Ganesan S, Lansdorp PM, Collins K, Hahn WC. The telomerase reverse transcriptase regulates chromatin state and DNA damage responses. Proc Natl Acad Sci U S A 2005;102:8222-8227.
47. Miettinen M, Chatten J, Paetau A, Stevenson A. Monoclonal antibody NB84 in the differential diagnosis of neuroblastoma and other small round cell tumors. Am J Surg Pathol 1998;22:327-332.
48. Guidance for industry: Bioanalytical Method Validation, US Department of Health and Human Services, Food and Drug Administration, Center for Drug Evaluation and Research (CDER), Center for Biologics Evaluation and Research (CBER), May 2001;Rockville
49. Deyo RA, Diehr P, Patrick DL. Reproducibility and responsiveness of health status measures. Statistics and strategies for evaluation. Controlled Clinical Trials 1991;12:142S-158S.