
INTRODUCTION
Breast cancer is one of serious diseases threatening health in women and is also the major cause of death among women [1, 2]. Annually, about 1.38 million new cases and 458, 000 deaths happen worldwide [3]. Moreover, the occurrence rate of this cancer has risen in recent years. Early detection and diagnosis contribute to reducing mortality and improving prognosis. It is urgent to develop efficient detection technology for breast cancer.
Mammographic screening is a valuable tool for early detection of breast cancer [4]. However, the increase in breast tissue density significantly reduces the diagnostic accuracy [5]. Among other imaging methods, gray-scale ultrasonography is a valuable adjunct technique. It shows highly sensitive detection of benign breast lesions from malignant ones [6–8]. The Breast Imaging Reporting and Data System (BI-RADS) along with ultrasonography contribute to understanding the standardized terminology about ultrasonography features, assessments and recommendations [9, 10]. Nevertheless, this technique is subjective and poorly specific [10–12]. Ultrasound elastography emerges as an efficient tool to detect malignant solid lesions through measuring the stiffness. It exhibits 86.5% sensitivity, 89.8% specificity and 88.3% accuracy in discriminating benign and malignant breast lesions [13]. In the ultrasound elastography test, the performance was conducted with freehand compression. The elasticity map largely depends on the the extent of tissue compression and organ’s compressibility limits. Moreover, the differences in skill of the operator may result in distinct results.
Shear wave elastography (SWE), a newly developed technology, could overcome these above mentioned problems. It is performed by remotely inducing mechanical vibrations via acoustic radiation force produced by a focused ultrasound beam. The displacement induced at the focus produces shear wave which delivers information about viscoelastic properties of the tissue, thus generates the quantitative assessment to elasticity values. Until now, there has been many studies investigating the diagnostic role of SWE in discriminating benign and malignant breast lesions, however, no consistent results were obtained.
The meta-analysis was initiated to get more accurate results, which contributes to the early diagnosis of breast cancer and improvement on the treatments.
MATERIALS AND METHODS
Article retrieval
The articles were retrieved in Pubmed, Embase and Cochrane databases. The following search terms were used to retrieve articles: “shear wave elastography”, “SWE”, “acoustic radiation force impulse”, “ARFI”, “virtual touch tissue quantification (VTTQ)”, “VTTQ” and “breast”. The references of retrieved articles were carefully checked for potential ones. Only the articles in English were considered.
Inclusion criteria
The studies were included if they met the following criteria: (1) The study investigated the role of SWE in the diagnosis of malignant and benign breast lesions. (2) Pathological biopsy or cytological (fine-needle aspiration) test was adopted as gold standard. (3) The data of true-positive (TP), false-positive (FP), false-negative (FP) and true-negative (TN) were provided. The study with larger sample size was included for the studies with overlapping data.
Information extraction
The following information was extracted by two independent authors: name of first author, sample size, number of breast lesions, number of malignant and benign breast lesions, gold standard, SWE parameters, TP, FP, FN and TN. The ambiguity was solved with discussion.
Statistics
All the analysis was completed in Stata 12.0 (StataCorp LP, College Station, TX, USA) software. Summary sensitivity and specificity were estimated with DerSimonian and Laird random effects model. Besides, summary receiver operating characteristic (sROC) curve was created according to the odds ratios (ORs) weight of sensitivity and specificity. Meanwhile, area under curve (AUC) with corresponding 95% confidence interval (CI) was analyzed to evaluate the diagnostic accuracy of SWE. P value was adopted to evaluate the heterogeneity between studies. P < 0.05 indicated significant heterogeneity. Deek’s funnel plot was used to assess the publication bias. Subgroup analysis based on ethnicity, technology and SWE parameters (maximum stiffness, mean stiffness and stiffness ratio) were also conducted.
RESULTS
Studies selection and characteristics of included studies
The retrieved studies were selected according to inclusion criteria. The selection process was showed in Figure 1. Total of 188 studies were retrieved from databases. Then, 124 studies were excluded for combination of SWE and other technology, review studies, not SWE analysis and comparison with SWE and other technology. Finally, 25 studies [14–38] were included after exclusion of studies for without available data and virtual touch tissue imaging (VTTI) analysis (Table 1). The meta-analysis included 4128 patients and 4546 breast lesions. In the present meta-analysis, 18 articles were for Asian population, while 7 for Caucasian population. 6 articles were based on virtual touch tissue quantification (VTTQ) technology and 19 based on SWE. In the articles of SWE, 13 articles adopted maximum stiffness and 10 adopted mean stiffness.
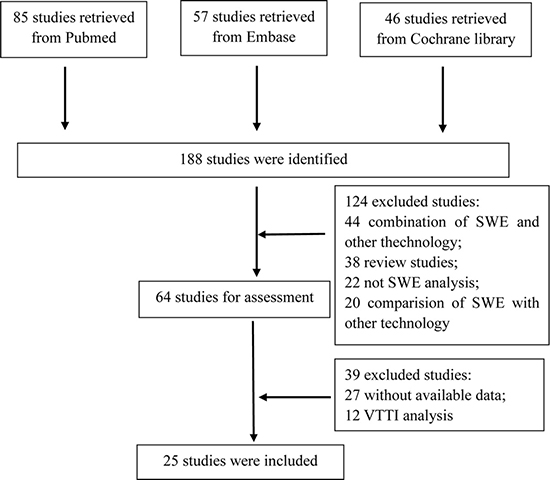
Figure 1: Flow chart of articles selection.
Table 1: Basic characteristics of included studies
Author |
Year |
Country |
Patients, n |
Lesion,n |
Benign, n |
Malignant,n |
Gold standard |
Technology |
Parameters |
|---|---|---|---|---|---|---|---|---|---|
Lo |
2015 |
China |
81 |
88 |
57 |
31 |
Pathology |
SWE |
- |
Xiao |
2014 |
China |
93 |
125 |
81 |
44 |
Pathology |
SWE |
- |
Sobczak |
2015 |
Poland |
76 |
84 |
43 |
41 |
Pathology |
SWE |
Emean |
Zhang |
2015 |
China |
125 |
161 |
106 |
55 |
Pathology |
SWE |
Emax |
Klotz |
2014 |
France |
142 |
167 |
65 |
102 |
Pathology |
SWE |
Emax, Emean |
Au |
2014 |
Canada |
112 |
123 |
79 |
44 |
Pathology |
SWE |
Emax, Emean, Eratio |
Yao |
2014 |
China |
146 |
206 |
163 |
43 |
Pathology |
VTTQ |
SWV |
Olgun |
2014 |
Turkey |
109 |
115 |
83 |
32 |
Pathology |
SWE |
Emax, Emean, Emin, Eratio |
Zhou |
2014 |
China |
193 |
193 |
137 |
56 |
Pathology |
SWE |
Emax, Emean, Emin |
Bai |
2012 |
China |
108 |
143 |
102 |
41 |
Pathology |
VTTQ |
SWV |
Jin |
2012 |
China |
95 |
122 |
66 |
56 |
Pathology |
VTTQ |
SWV |
Meng |
2011 |
China |
86 |
92 |
65 |
27 |
Pathology |
VTTQ |
- |
Tamaki |
2013 |
Japan |
180 |
182 |
26 |
156 |
Pathology |
VTTQ |
- |
Tozaki |
2012 |
Japan |
158 |
161 |
70 |
91 |
Pathology |
VTTQ |
SWV |
Evans |
2010 |
UK |
52 |
53 |
23 |
30 |
Pathology |
SWE |
Emax, Emean, SD |
Chang |
2011 |
Korea |
158 |
182 |
93 |
89 |
Pathology |
SWE |
Emean |
Berg |
2012 |
England |
939 |
939 |
650 |
289 |
Pathology |
SWE |
Emax |
Chang |
2013 |
Korea |
129 |
150 |
79 |
71 |
Pathology |
SWE |
- |
Gweon |
2013 |
Korea |
119 |
133 |
97 |
36 |
Pathology |
SWE |
SD |
Lee-a |
2013 |
Korea |
139 |
156 |
120 |
36 |
Pathology |
SWE |
Emax |
Lee-b |
2013 |
Korea |
134 |
144 |
77 |
67 |
Pathology |
SWE |
Emax, Emean, Eratio |
Yoon-a |
2013 |
Korea |
199 |
222 |
175 |
47 |
Pathology |
SWE |
Emax |
Yoon-b |
2013 |
Korea |
236 |
267 |
208 |
59 |
Pathology |
SWE |
Emax, Emean, Eratio |
Youk |
2013 |
Korea |
146 |
163 |
115 |
48 |
Pathology |
SWE |
Emax |
Evans |
2012 |
UK |
173 |
175 |
64 |
111 |
Pathology |
SWE |
Emax, Emean |
Note: maximum stiffness, Emax; mean stiffness, Emean; minimum stiffness, Emin; standard deviation, SD; ratio of stiffness of the mass to the background, Eratio; shear wave velocity, SWV; VTTQ, virtual touch tissue quantification; SWE, shear wave elastography.
Summary sensitivity and specificity analysis
The diagnostic sensitivity and specificity of SWE were analyzed, and the results focused on the subgroup analysis based on ethnicity, technology and SWE parameters in Table 2 and Figures 2, 3. In the analysis of ethnicity, the detection sensitivity and specificity of SWE in Asian population were 0.84 (0.79–0.88) and 0.87 (0.84–0.90), the data in Caucasians were 0.92 (0.86–0.96) and 0.89 (0.84–0.92) (Figure 2). So the detection sensitivity and specificity of SWE in Caucasians were higher than that in Asians. According to SROC, AUC was 0.92 (0.90–0.94) in Asians and 0.95 (0.93–0.97) in Caucasians (Figure 4). Therefore, we found that the accuracy rate of diagnosis of SWE in benign and malignant breast lesions identification was also higher in Caucasian than in Asian populations. The subgroup analysis by technology, the results showed the detection sensitivity and specificity of VTTQ were 0.85 (0.77–0.91) and 0.93 (0.88–0.96), meanwhile, the detection sensitivity and specificity of SWE were 0.88 (0.84–0.91) and 0.87 (0.84–0.89) (Figure 3) respectively. We can see the detection sensitivity of SWE was high, but the specificity was low, compared with VTTQ. Based on SROC, AUC of VTTQ was 0.95 (0.93–0.97) and in SWE was 0.93 (0.90–0.95). the accuracy rate of diagnosis of VTTQ was slightly higher than that of SWE, but the difference was not significant. In addition, we investigated the diagnostic role of SWE parameters (maximum stiffness, mean stiffness and stiffness ratio). According to our synthesized data, maximum stiffness exhibited higher detection sensitivity than both stiffness ratio and mean stiffness (0.91 vs. 0.88 vs. 0.85, respectively); while stiffness ratio showed higher specificity than maximum stiffness and mean stiffness (0.88 vs. 0.84 for both comparisons).
Table 2: Subgroup analysis of meta-analysis
Subgroup |
Sensitivity (95% CI) |
Ph |
Specificity (95% CI) |
Ph |
|---|---|---|---|---|
Ethnicity |
||||
Asian |
0.84 (0.79–0.88) |
0.00 |
0.87 (0.84–0.90) |
0.00 |
Caucasian |
0.92 (0.86–0.96) |
0.00 |
0.89 (0.84–0.92) |
0.00 |
Technology |
||||
SWE |
0.88 (0.84–0.91) |
0.00 |
0.87 (0.84–0.89) |
0.00 |
VTTQ |
0.85 (0.77–0.91) |
0.00 |
0.93 (0.88–0.96) |
0.00 |
SWE Parameters |
||||
Emax |
0.91 (0.87–0.94) |
0.00 |
0.84 (0.80–0.87) |
0.00 |
Emean |
0.85 (0.71–0.93) |
0.00 |
0.84 (0.79–0.88) |
0.01 |
Eratio |
0.88 (0.80–0.93) |
0.02 |
0.88 (0.77–0.94) |
0.00 |
Notes: Ph, P value for heterogeneity.
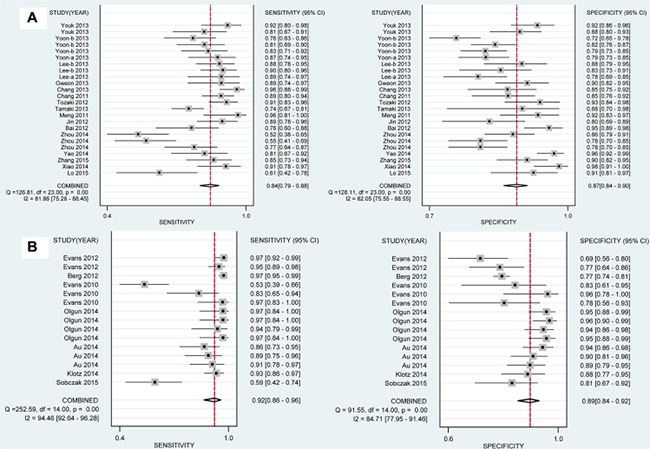
Figure 2: Analysis of the capability for SWE in discriminating breast malignant lesions from benign lesions in subgroup analysis by ethnicity. (A) Sensitivity [0.84 (0.79–0.88)] and specificity [0.87 (0.84–0.90)] in Asian population. (B) Sensitivity [0.92 (0.86–0.96)] and specificity [0.89 (0.84–0.92)] in Caucasian population. SWE shows higher sensitivity and specificity in Caucasians than in Asians.
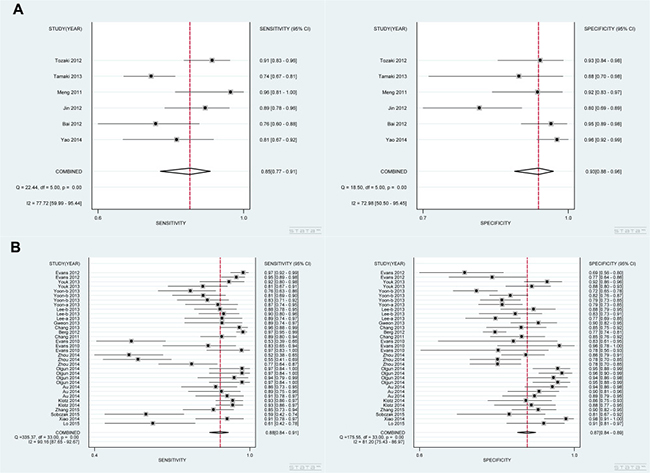
Figure 3: Analysis of the capability for SWE in discriminating breast malignant lesions from benign lesions in subgroup analysis by technology. (A) Sensitivity [0.85 (0.77–0.91)] and specificity [0.93 (0.88–0.96)] for VTTQ. (B) Sensitivity [0.88 (0.84–0.91)] and specificity [0.87 (0.84–0.89)] for SWE. VTTQ shows lower diagnostic sensitivity than SWE, but demonstrates higher specificity than SWE.
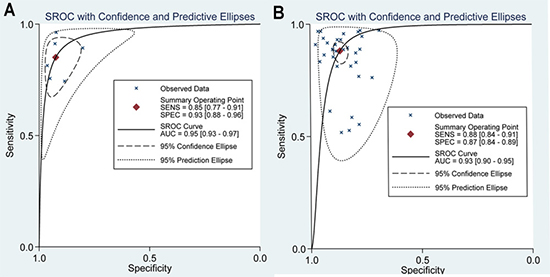
Figure 4: SROC analysis in subgroup analysis by technology. (A) SROC results for VTTQ. (B) SROC results for SWE. The value of AUC is higher for VTTQ [0.95 (0.93–0.97)] than for SWE [0.93 (0.90–0.95)].
Sensitivity and publication bias analysis
Sensitivity analysis was performed by deleting one study each time to observe the changes of results. The analysis indicated that the results were stable. Moreover, no publication bias was found in the meta-analysis (VTTQ: P = 0.216; SWE: P = 0.08, Figure 5).
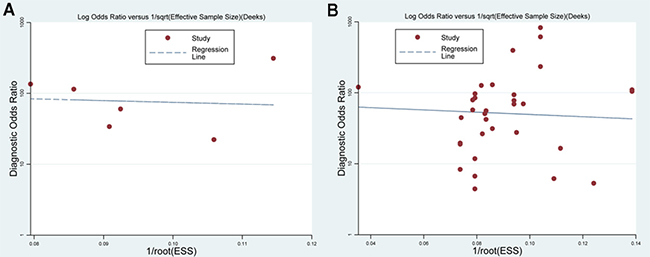
Figure 5: Deek’s funnel plot in subgroup analysis of technology. (A) Funnel plot for VTTQ (P = 0.216). (B) Funnel plot of SWE (P = 0.080).
DISCUSSION
SWE is a highly reproducible technology [39]. It determines the propagation velocity of shear waves within the tissues to quantify the stiffness in kPa or m/s [29, 40]. Many tissue elasticity characters can be determined within the region-of-interest (ROI), including maximum (Emax), mean (Emean) and minimum (Emin) stiffness, standard deviation (SD) and ratio of stiffness of the mass to the background (Eratio). Qualitative SWE pattern classification is also reported to show good diagnostic performances [30, 32]. Emax and Emean refers to the general stiffness of the mass, while Eratio represent the relative stiffness of the mass to the fat tissue, the elasticity value of which is 3 kPa [28]. SD and pattern classification illustrate the internal heterogeneity of the mass [32], as the malignant masses are almost histologically heterogeneous. The quantitative measurements of SWE have been recognized as more objective information about the breast mass [39, 40].
Among the included studies, the evaluation about SWE in discriminating malignant and benign breast lesions was controversial. In the study of Zhou et al. [22], 193 women with 193 breast lesions were included to analyze the diagnostic performance of SWE in discriminating benign and malignant breast lesions, in which Emax, Emean and Emin were adopted to represent tissue stiffness. However, the diagnostic sensitivity (0.52, 0.55 and 0.77) and specificity (0.86, 0.78 and 0.78) of these three parameters were all low compared with other studies. Meanwhile, Youk et al. [37] reported high detection sensitivity (0.92) and specificity (0.92) of SWE, in which Emax represent tissue elasticity. Evans et al. (2012) [38] found that the detection sensitivity of SWE was 0.97 (0.92–0.99), while specificity was only 0.69 (0.56–0.80). On the contrary, Evans et al. (2010) [28] reported 0.53 detection sensitivity and 0.83 detection specificity. The variances in results may lie on the differences in characters of patients, ethnicity or SWE parameters.
Subgroup analysis based on ethnicity, technology and SWE parameters was performed in our analysis. The diagnostic sensitivity, specificity and AUC of SWE in Caucasian population were all higher than in Asian population. As we all know, acoustic radiation force impulse (ARFI) includes VTTI and VTTQ. The result of VTTI is featured by elastographic image, while the result of VTTQ is quantitated by SWV (m/s). Soft tissue shows slow SWV, compared to hard tissue [41]. VTTQ has been used for diagnosis in thyroid, prostate, pancreas, liver and breast [42–46]. In our study, subgroup analysis according to technology (VTTQ and SWE) was conducted. VTTQ showed higher detection specificity and accuracy than SWE, but its sensitivity was lower than SWE. So, the result is usually unsatisfactory using single technique for breast lesions identification and combination of SWE and VTTQ may be a good technique. In terms of SWE parameters, Emax showed higher diagnostic sensitivity than Emean and Eratio, and Eratio possessed higher specificity than the other two parameters.
Due to the different study population, sample size, exploration factors or examinee-level errors of measurement, the diagnosis results presented in every eligible study were inconsistent. Thus the meta-analysis was the common method to solve the controversy as much as possible. This meta-analysis was based on 4128 patients and 4546 breast lesions. The results were reliable and stable. However, some defects must be pointed out. The number of articles based on Caucasian population was much less than that of Asian population. The accuracy of results on Caucasian population might be affected. In our analysis, the performance of SWE seemed to be better in Caucasians than in Asians, especially for sensitivity, and this phenomenon need to be explored in future special researches, considering the interested topic and space limitation in the present meta-analysis. In previous study, the diagnosis technique of breast lesions distinguish was also different by ethnicity. The diagnostic accuracy of breast lesions based on ultrasound elastography (UE) was 88.4% in Japanese [47] and the percentage was 80.6% in Chinese. Therefore, the diagnosis accuracy difference of the same technique by different races have to be allowed to exist because of variant genetic background and relative environmental factors. In addition, there existed significant heterogeneity between studies. The heterogeneity might result from multiple internal and external factors, such as different threshold values adopted in individual studies, uneven patients’ number, various basic features of patients and diverse test conditions. However, limited to confined information from our included studies, further subgroup analyses based on age and other potentially relevant factors were not performed, so possible sources for the heterogeneity were not identified in this meta-analysis.
Our meta-analysis demonstrates that SWE is an accurate and reliable diagnostic tool in discriminating malignant and benign breast lesions. The outcome is significant in clinic, which contributes to the early diagnostic of breast cancer.
ACKNOWLEDGMENTS
None.
CONFLICTS OF INTEREST
None.
GRANT SUPPORT
None.
REFERENCES
1. Sakorafas GH, Farley DR, Peros G. Recent advances and current controversies in the management of DCIS of the breast. Cancer treatment reviews. 2008; 34:483–497.
2. Chen DR, Chang RF, Kuo WJ, Chen MC, Huang YL. Diagnosis of breast tumors with sonographic texture analysis using wavelet transform and neural networks. Ultrasound in medicine & biology. 2002; 28:1301–1310.
3. Ferlay J, Shin HR, Bray F, Forman D, Mathers C, Parkin DM. Estimates of worldwide burden of cancer in 2008: GLOBOCAN 2008. International journal of cancer. 2010; 127:2893–2917.
4. Tabar L, Vitak B, Chen TH, Yen AM, Cohen A, Tot T, Chiu SY, Chen SL, Fann JC, Rosell J, Fohlin H, Smith RA, Duffy SW. Swedish two-county trial: impact of mammographic screening on breast cancer mortality during 3 decades. Radiology. 2011; 260:658–663.
5. Checka CM, Chun JE, Schnabel FR, Lee J, Toth H. The relationship of mammographic density and age: implications for breast cancer screening. AJR American journal of roentgenology. 2012; 198:W292–295.
6. Zonderland HM, Coerkamp EG, Hermans J, van de Vijver MJ, van Voorthuisen AE. Diagnosis of breast cancer: contribution of US as an adjunct to mammography. Radiology. 1999; 213:413–422.
7. Lister D, Evans AJ, Burrell HC, Blamey RW, Wilson AR, Pinder SE, Ellis IO, Elston CW, Kollias J. The accuracy of breast ultrasound in the evaluation of clinically benign discrete, symptomatic breast lumps. Clinical radiology. 1998; 53:490–492.
8. Stavros AT, Thickman D, Rapp CL, Dennis MA, Parker SH, Sisney GA. Solid breast nodules: use of sonography to distinguish between benign and malignant lesions. Radiology. 1995; 196:123–134.
9. Berg WA. Supplemental screening sonography in dense breasts. Radiologic clinics of North America. 2004; 42:845–851, vi.
10. Mendelson EB, Berg WA, Merritt CR. Toward a standardized breast ultrasound lexicon, BI-RADS: ultrasound. Seminars in roentgenology. 2001; 36:217–225.
11. Corsetti V, Ferrari A, Ghirardi M, Bergonzini R, Bellarosa S, Angelini O, Bani C, Ciatto S. Role of ultrasonography in detecting mammographically occult breast carcinoma in women with dense breasts. La Radiologia medica. 2006; 111:440–448.
12. Houssami N, Irwig L, Simpson JM, McKessar M, Blome S, Noakes J. Sydney Breast Imaging Accuracy Study: Comparative sensitivity and specificity of mammography and sonography in young women with symptoms. AJR American journal of roentgenology. 2003; 180:935–940.
13. Itoh A, Ueno E, Tohno E, Kamma H, Takahashi H, Shiina T, Yamakawa M, Matsumura T. Breast disease: clinical application of US elastography for diagnosis. Radiology. 2006; 239:341–350.
14. Lo CM, Lai YC, Chou YH, Chang RF. Quantitative breast lesion classification based on multichannel distributions in shear-wave imaging. Computer methods and programs in biomedicine. 2015; 122:354–61.
15. Xiao Y, Zeng J, Niu L, Zeng Q, Wu T, Wang C, Zheng R, Zheng H. Computer-aided diagnosis based on quantitative elastographic features with supersonic shear wave imaging. Ultrasound in medicine & biology. 2014; 40:275–286.
16. Dobruch-Sobczak K, Nowicki A. Role of shear wave sonoelastography in differentiation between focal breast lesions. Ultrasound in medicine & biology. 2015; 41:366–374.
17. Zhang Q, Xiao Y, Chen S, Wang C, Zheng H. Quantification of elastic heterogeneity using contourlet-based texture analysis in shear-wave elastography for breast tumor classification. Ultrasound in medicine & biology. 2015; 41:588–600.
18. Klotz T, Boussion V, Kwiatkowski F, Dieu-de Fraissinette V, Bailly-Glatre A, Lemery S, Boyer L. Shear wave elastography contribution in ultrasound diagnosis management of breast lesions. Diagnostic and interventional imaging. 2014; 95:813–824.
19. Au FW, Ghai S, Moshonov H, Kahn H, Brennan C, Dua H, Crystal P. Diagnostic performance of quantitative shear wave elastography in the evaluation of solid breast masses: determination of the most discriminatory parameter. AJR American journal of roentgenology. 2014; 203:W328–336.
20. Yao M, Wu J, Zou L, Xu G, Xie J, Wu R, Xu H. Diagnostic value of virtual touch tissue quantification for breast lesions with different size. BioMed research international. 2014; 2014:142504.
21. Cebi Olgun D, Korkmazer B, Kilic F, Dikici AS, Velidedeoglu M, Aydogan F, Kantarci F, Yilmaz MH. Use of shear wave elastography to differentiate benign and malignant breast lesions. Diagn Interv Radiol. 2014; 20:239–244.
22. Zhou J, Zhan W, Chang C, Zhang X, Jia Y, Dong Y, Zhou C, Sun J, Grant EG. Breast lesions: evaluation with shear wave elastography, with special emphasis on the “stiff rim” sign. Radiology. 2014; 272:63–72.
23. Bai M, Du L, Gu J, Li F, Jia X. Virtual touch tissue quantification using acoustic radiation force impulse technology: initial clinical experience with solid breast masses. Journal of ultrasound in medicine. 2012; 31:289–294.
24. Jin ZQ, Li XR, Zhou HL, Chen JX, Huang X, Dai HX, Li JW, Chen XD, Xu XH. Acoustic radiation force impulse elastography of breast imaging reporting and data system category 4 breast lesions. Clinical breast cancer. 2012; 12:420–427.
25. Meng W, Zhang G, Wu C, Wu G, Song Y, Lu Z. Preliminary results of acoustic radiation force impulse (ARFI) ultrasound imaging of breast lesions. Ultrasound in medicine & biology. 2011; 37:1436–1443.
26. Tamaki K, Tamaki N, Kamada Y, Uehara K, Miyashita M, Ishida T, Sasano H. A non-invasive modality: the US virtual touch tissue quantification (VTTQ) for evaluation of breast cancer. Japanese journal of clinical oncology. 2013; 43:889–895.
27. Tozaki M, Isobe S, Sakamoto M. Combination of elastography and tissue quantification using the acoustic radiation force impulse (ARFI) technology for differential diagnosis of breast masses. Japanese journal of radiology. 2012; 30:659–670.
28. Evans A, Whelehan P, Thomson K, McLean D, Brauer K, Purdie C, Jordan L, Baker L, Thompson A. Quantitative shear wave ultrasound elastography: initial experience in solid breast masses. Breast cancer research. 2010; 12:R104.
29. Chang JM, Moon WK, Cho N, Yi A, Koo HR, Han W, Noh DY, Moon HG, Kim SJ. Clinical application of shear wave elastography (SWE) in the diagnosis of benign and malignant breast diseases. Breast cancer research and treatment. 2011; 129:89–97.
30. Berg WA, Cosgrove DO, Dore CJ, Schafer FK, Svensson WE, Hooley RJ, Ohlinger R, Mendelson EB, Balu-Maestro C, Locatelli M, Tourasse C, Cavanaugh BC, Juhan V, et al. Shear-wave elastography improves the specificity of breast US: the BE1 multinational study of 939 masses. Radiology. 2012; 262:435–449.
31. Chang JM, Won JK, Lee KB, Park IA, Yi A, Moon WK. Comparison of shear-wave and strain ultrasound elastography in the differentiation of benign and malignant breast lesions. AJR American journal of roentgenology. 2013; 201:W347–356.
32. Gweon HM, Youk JH, Son EJ, Kim JA. Visually assessed colour overlay features in shear-wave elastography for breast masses: quantification and diagnostic performance. European radiology. 2013; 23:658–663.
33. Lee EJ, Jung HK, Ko KH, Lee JT, Yoon JH. Diagnostic performances of shear wave elastography: which parameter to use in differential diagnosis of solid breast masses? European radiology. 2013; 23:1803–1811.
34. Lee SH, Chang JM, Kim WH, Bae MS, Cho N, Yi A, Koo HR, Kim SJ, Kim JY, Moon WK. Differentiation of benign from malignant solid breast masses: comparison of two-dimensional and three-dimensional shear-wave elastography. European radiology. 2013; 23:1015–1026.
35. Yoon JH, Jung HK, Lee JT, Ko KH. Shear-wave elastography in the diagnosis of solid breast masses: what leads to false-negative or false-positive results? European radiology. 2013; 23:2432–2440.
36. Yoon JH, Ko KH, Jung HK, Lee JT. Qualitative pattern classification of shear wave elastography for breast masses: how it correlates to quantitative measurements. European journal of radiology. 2013; 82:2199–2204.
37. Youk JH, Gweon HM, Son EJ, Chung J, Kim JA, Kim EK. Three-dimensional shear-wave elastography for differentiating benign and malignant breast lesions: comparison with two-dimensional shear-wave elastography. European radiology. 2013; 23:1519–1527.
38. Evans A, Whelehan P, Thomson K, Brauer K, Jordan L, Purdie C, McLean D, Baker L, Vinnicombe S, Thompson A. Differentiating benign from malignant solid breast masses: value of shear wave elastography according to lesion stiffness combined with greyscale ultrasound according to BI-RADS classification. British journal of cancer. 2012; 107:224–229.
39. Cosgrove DO, Berg WA, Dore CJ, Skyba DM, Henry JP, Gay J, Cohen-Bacrie C. Shear wave elastography for breast masses is highly reproducible. European radiology. 2012; 22:1023–1032.
40. Athanasiou A, Tardivon A, Tanter M, Sigal-Zafrani B, Bercoff J, Deffieux T, Gennisson JL, Fink M, Neuenschwander S. Breast lesions: quantitative elastography with supersonic shear imaging–preliminary results. Radiology. 2010; 256:297–303.
41. Tozaki M, Isobe S, Fukuma E. Preliminary study of ultrasonographic tissue quantification of the breast using the acoustic radiation force impulse (ARFI) technology. European journal of radiology. 2011; 80:e182–187.
42. Mateen MA, Muheet KA, Mohan RJ, Rao PN, Majaz HM, Rao GV, Reddy DN. Evaluation of ultrasound based acoustic radiation force impulse (ARFI) and eSie touch sonoelastography for diagnosis of inflammatory pancreatic diseases. JOP. 2012; 13:36–44.
43. Marginean CO, Branzaniuc K, Marginean C, Azamfirei L, Pitea AM. Elastography, progression factor in liver ultrasound. Revista medico-chirurgicala a Societatii de Medici si Naturalisti din Iasi. 2010; 114:764–770.
44. Zheng X, Ji P, Mao H, Hu J. A comparison of virtual touch tissue quantification and digital rectal examination for discrimination between prostate cancer and benign prostatic hyperplasia. Radiology and oncology. 2012; 46:69–74.
45. Zhang YF, Xu HX, He Y, Liu C, Guo LH, Liu LN, Xu JM. Virtual touch tissue quantification of acoustic radiation force impulse: a new ultrasound elastic imaging in the diagnosis of thyroid nodules. PloS one. 2012; 7:e49094.
46. Wojcinski S, Brandhorst K, Sadigh G, Hillemanns P, Degenhardt F. Acoustic radiation force impulse imaging with Virtual Touch tissue quantification: mean shear wave velocity of malignant and benign breast masses. International journal of women’s health. 2013; 5:619–627.
47. Xiao Y, Zeng J, Zhang X, Niu LL, Qian M, Wang CZ, Zheng HR, Zheng RQ. Ultrasound Strain Elastography for Breast Lesions: Computer-Aided Evaluation with Quantifiable Elastographic Features. Journal of ultrasound in medicine. 2017; 36:1089–1100.