
INTRODUCTION
Acute promyelocytic leukemia (APL) is a well-defined type of acute myeloid leukemia (AML), characterized by the balanced t(15,17) chromosomal translocation, resulting in the fusion of the promyelocytic leukemia (PML) and retinoic acid receptor-α (RARA) genes. The aberrant oncogenic protein PML-RARA blocks myeloid differentiation at the promyelocyte stage by exerting dominant negative effects on wild-type RARA and PML genes, through transcriptional and post-transcriptional mechanisms. In particular, PML-RARA constitutively represses RA-target genes by recruiting chromatin remodelling proteins such as DNA methyltransferases, histone methyltransferases and methyl-binding domain proteins [1]. The differentiation block is further accomplished by binding to RA-response elements in the promoter region of myeloid transcription factor PU.1, the tumor suppressor PTEN, and stimulating transcription of pro-leukemogenic genes driven by hypoxia-induced factors (HIFs) [2–4]. Disruption of nuclear bodies, and blunting of the p53 response to DNA damage through p53 deacetylation have been reported as further mechanisms of cell immortalization [5].
Forkhead box (FOX) genes encode transcriptional factors which act as regulators of embryogenesis, and are involved in fundamental processes of cell differentiation in adults [6–7]. FOX genes are deregulated in solid tumors and their overexpression has been correlated with poor differentiation and unfavourable prognosis [8–11]. In particular, in melanoma cells and tissues, the promoter region of the family member FOXC1 is hypomethylated compared to normal tissues and this leads to upregulation of its expression [12]. Accordingly, hypomethylating treatment of the M219 and M15 melanoma cell lines upregulated FOXC1 protein expression [12].
Overexpression of FOXC1 has been reported in nearly 20% of primary AML samples, where FOXC1 has been shown to be involved in the monocyte/macrophage differentiation block and in the increased clonogenic potential of AML cells [13–14]. In the normal hematopoietic system, FOXC1 is essential for development and maintenance of the mesenchymal niche for stem and progenitor cells [15]. The role of FOX genes in APL is currently unknown.
We analysed FOXC1 gene expression and protein levels in APL primary samples, as compared to other AML subtypes and normal hematopoietic cells. In addition, we investigated, using cell line models, the mechanisms of FOXC1 deregulation in APL.
RESULTS
Characterization of FOXC1 expression in APL and other AML subtypes
FOXC1 RNA expression was significantly downregulated in APL, compared to other AML subtypes (n = 27 APL vs 27 AML, p = 0.0001, Figure 1A). These data were confirmed by revising the published TCGA data set (http://cancergenome.nih.gov/dataportal/data/about), where FOXC1 expression in APL was 10-fold lower than that of other AML samples (Supplementary Figure 1). In APL, MNC from patients with a high-risk disease, classified according to the "Sanz score", tended to express FOXC1 at levels lower than those from patients with a low-intermediate risk APL, though the low number of high-risk APL tested might be too low to draw any conclusions (data not shown) [16]. Normal CD34+ hematopoietic cells isolated from cord blood (n = 2) or BM (n = 3) expressed FOXC1 at levels similar to those observed in AML, but significantly higher than those detected in APL (p = 0.0061, Figure 1A). FOXC1 expression significantly increased in the BM-MNC of patients with APL, collected after consolidation treatment according to the AIDA2000 or APL0406 protocols (p < 0.0001, Figure 1A) [17–18]. FOXC1 expression was similar in all other cell subsets, including normal BM-MNC, mature PB-monocytes and granulocytes (Figure 1A).
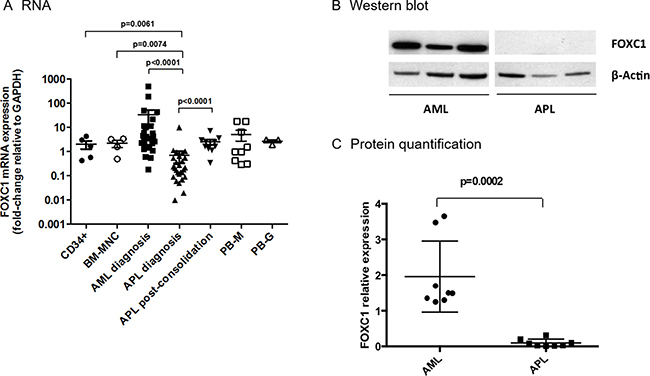
Figure 1: FOXC1 expression in AML, APL and controls. (A) Expression of FOXC1 mRNA was studied in CD34+ cells isolated from cord blood (n = 2) and BM (n = 3), in normal BM-MNC (n = 4), in the BM-MNC of patients with AML (n = 27), or APL (n = 27), collected at the time of initial diagnosis, and of APL patients (n = 11), at the post-consolidation phase. Mature PB-monocytes (M) and granulocytes (G) served as further controls. (B) Western blot showing FOXC1 and β-Actin protein expression in six representative primary AML and APL samples collected at the time of initial diagnosis (western blot images are assembled for figure usability in respect of original image acquisition and no specific features are obscured, moved, removed, or introduced). (C) Quantification of FOXC1 protein expression in BM-MNC samples from patients with AML (n = 8), or APL (n = 8), at the time of initial diagnosis.
Down-regulation of FOXC1 in APL was confirmed at the protein level. Using western blot, we found that FOXC1 protein expression was very low/undetectable in 8 APL samples when compared to 8 non-APL AMLs (p = 0.0002, Figure 1B and 1C).
FOXC1 methylation in AML and APL
Since FOXC1 expression has been shown to be regulated by DNA methylation [19], we quantitatively analysed FOXC1 methylation in the DNA region spanning bp +354 to +568 from the TSS, using a specific pyrosequencing assay. Methylation of FOXC1 was significantly higher in APL samples compared to non-APL AML (mean methylation 11% in 23 APL, vs 6% in 24 AML p = 0.010, Figure 2A), and decreased after consolidation treatment in all APL tested (16 APL, mean 5%, p = 0.0001, Figure 2A). In these APL samples collected at the time of complete remission, methylation levels were similar to that of cord blood CD34+ cells and BM-MNC samples collected from healthy donors (2 CD34+ and 5 BM-MNC samples), as well as to that of AML samples at diagnosis (Figure 2A). A significant inverse correlation between FOXC1 expression and methylation levels was confirmed in 19 APL and 14 AML samples with available data (R= –0.35, p = 0.05, Figure 2B). Overall, our data show that FOXC1 expression is downregulated by DNA hypermethylation in APL.
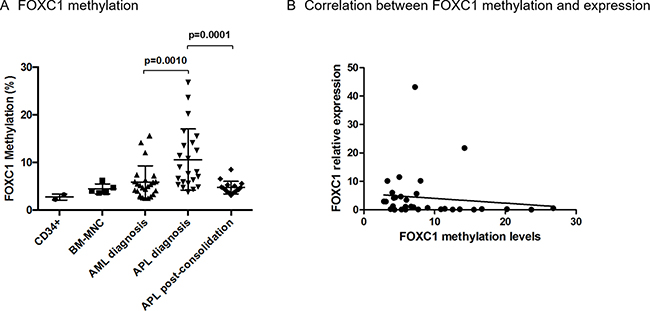
Figure 2: FOXC1 methylation levels. (A) FOXC1 methylation levels in DNA extracted from cord blood CD34+ samples (n = 2), BM-MNC samples from healthy donors (n = 5), AML and APL patients at initial diagnosis (n = 24 and n = 23 samples, respectively), and from APL patients after consolidation treatment (n = 16). (B) Correlation between FOXC1 methylation and mRNA expression in individual patients with APL (n = 19) and AML (n = 14).
Modulation of FOXC1 expression during the process of normal granulocytic differentiation
Since APL is characterized by a maturation block at the promyelocyte stage, removed by ATRA, we investigated the kinetics of FOXC1 expression during the early phases of normal granulocytic differentiation, using an in vitro differentiation model starting from CD34+ cells. FOXC1 expression studied by quantitative RT-PCR initially decreased, and subsequently increased on day 16. Western blot analysis of FOXC1 protein expression confirmed this pattern. Different from APL, FOXC1 downregulation during the early phases of granulocytic differentiation was not associated to changes in FOXC1 methylation levels (Figure 3). On the other hand, the kinetics of FOXC1 expression during in vitro differentiation along the erythroid, megakaryocytic and monocytic lineages were characterized by a decrease of FOXC1 mRNA expression levels (Supplementary Figure 3).
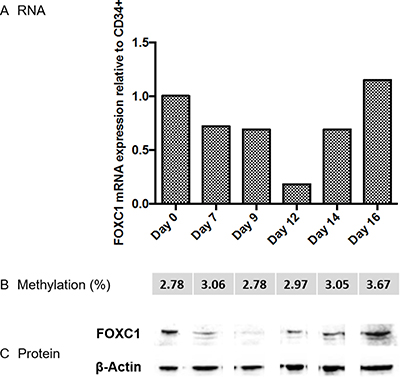
Figure 3: FOXC1 expression during normal granulocytic differentiation. FOXC1 mRNA and protein relative expression and methylation level (indicated as average percent methylation of 9 CpG sites (met %)) in cord blood CD34+ cell samples, at time 0 and after differentiation along the granulocytic lineage. Specific time points during granulocytic differentiation are indicated in the graph. Western blot images are assembled for figure usability in respect of original image acquisition and no specific features are obscured, moved, removed, or introduced.
Characterization of FOXC1 expression in leukemic cell lines
We then used the APL leukemic cell line NB4, the myeloblastic and monoblastic cell lines HL60 and PR9 (derivative of U937, with zinc-inducible PML/RARA), and the non-hematopoietic cell line HEK, to characterize the regulation of FOXC1 expression. In agreement with the observations made using primary APL blasts, we detected lower FOXC1 mRNA levels in NB4, HL60 cells (PML/RARA-negative) and PR9 cells, while HEK cells displayed markedly higher FOXC1 expression (Supplementary Figure 2A). Similar differences were observed at the protein level. Correspondingly, FOXC1 methylation levels were lower in HEK cells (2%), than in NB4, HL60 and U937 cells (61%, 48%, and 48%, respectively, Supplementary Figure 2B).
Modulation of FOXC1 expression by PML-RARA
We then explored the effects of the PML-RARA fusion gene on FOXC1 expression. In the PR9 cell line, induction of PML-RARA by addition of Zn2+ down-modulated the level of FOXC1 mRNA and protein expression (Figure 4A and 4B). However, pyrosequencing assays showed that FOXC1 methylation status did not significantly change following induction of PML/RARA expression.
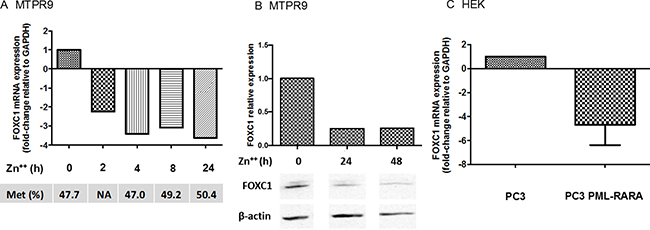
Figure 4: Expression of FOXC1 in cell lines transfected with PML-RARA. In MTPR9 cells, a monoblastic cell line (U937) expressing PML-RARA under the control of a Zn2+ -inducible promoter, FOXC1 mRNA (A) and protein (B) expression were evaluated after transfection of PML-RARA constructs (western blot images are assembled for figure usability in respect of original image acquisition and no specific features are obscured, moved, removed, or introduced). Corresponding FOXC1 methylation status is also shown. FOXC1 mRNA expression was also studied in embryonic kidney (HEK) cells transfected with an empty pSG5 vector or with a pSG5 vector containing the PML-RARA fusion gene (C).
To further explore the effects of PML/RARA on FOXC1, we transfected the human HEK kidney cell line with a pSG5 vector containing the PML-RARA gene, or with an empty pSG5 vector as a negative control. Again in these cells, transfection of PML-RARA markedly decreased FOXC1 levels compared to the control (Figure 4C). Similar to PR9 cells, transfection of PML-RARA did not significantly impact on FOXC1 methylation.
We then tested the binding of PML-RARA to the promoter region of FOXC1 using the NB4 cell line, and anti-PML or anti-RARA antibodies. PML-RARA bound to motif –398 to –391 of the FOXC1 promoter and negatively regulated its expression. In this context, addition of ATRA was associated to a decrease of PML-RARA binding to the FOXC1 promoter (Figure 5A). These data were confirmed in PR9 cells, where induction of PML-RARA expression by addition of Zn++ increased the binding of PML-RARA to the FOXC1 promoter region (Figure 5B). These results indicate that differentiation of APL induced by ATRA treatment unlocks FOXC1 promoter, inducing upregulation of its expression.
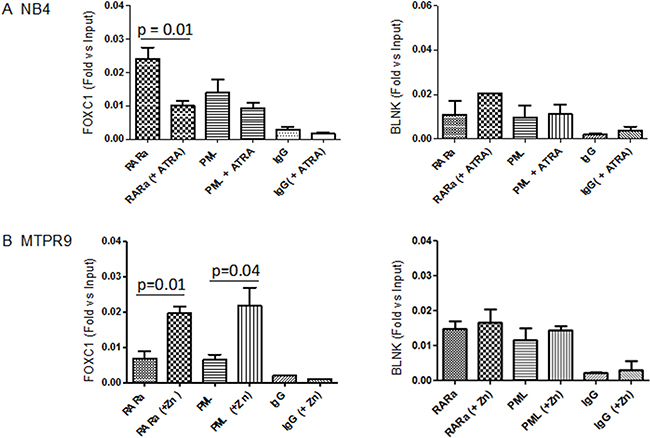
Figure 5: Binding of PML-RARA to the FOXC1 promoter region. (A) PML and RARA binding to FOXC1 DNA, as measured in NB4 cells by a quantitative ChIP assay, followed by amplification of the FOXC1 promoter region by RT-qPCR, before and after treatment with ATRA. A rabbit polyclonal IgG antibody was used as control. (B) PML-RARA binding to FOXC1 DNA in PR9 cells treated with Zn(SO4), which induces PML-RARA overexpression. Data are shown as fold enrichment of ChIP DNA versus input DNA, and are representative of at least three independent experiments. The promoter region of the BLNK gene was used as negative control. The p-value was calculated by the unpaired t-test.
Pharmacological modulation of FOXC1 expression in vitro
Treatment of the NB4 and HL60 cell lines with the hypomethylating agent decitabine (DAC 1 μM), induced a moderate decrease of FOXC1 methylation compared to baseline (mean 53% and 37% in DAC-treated vs 61% and 37% in NB4 and HL60 control cells, respectively, Figure 6C). This was associated to upregulation of FOXC1 mRNA expression (fold-change 3.6, p = 0.04 and 2.0, p = 0.05 in NB4 and HL60 cells, respectively, Figure 6A). FOXC1 protein levels were only slightly upregulated (Figure 6B). Altogether, our data show that FOXC1 regulation by methylation is functional in hematopoietic cell lines, similarly to primary APL samples.
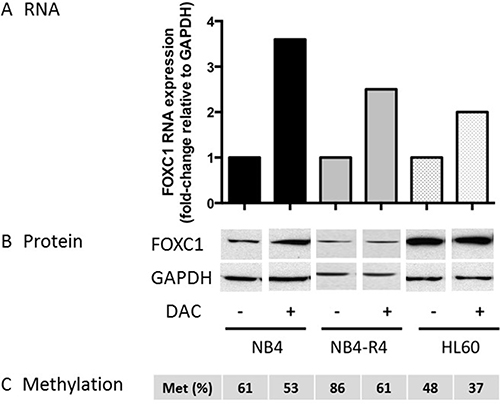
Figure 6: FOXC1 expression after decitabine treatment. (A) FOXC1 mRNA and protein (B) expression in ATRA-treated versus untreated cells. GAPDH was used as control for protein quantification (three different western blot images, NB4 treated and untreated, NB4-R4 treated and untreated and HL60 treated and untreated cells, are assembled for figure usability in respect of original image acquisition and no specific features are obscured, moved, removed, or introduced). (C) FOXC1 DNA methylation level (%).
Granulocytic differentiation can be induced in NB4 and HL-60 cell lines by ATRA. We then studied the regulation of FOXC1 expression after ATRA treatment (Figure 7). ATRA induced marked upregulation of FOXC1 both at mRNA (fold-change 7.2, p = 0.0129, and 6.6, p = 0.0443, in NB4 and HL60 cells, respectively, Figure 7A) and protein levels (Figure 7B). However, this was not associated with changes in FOXC1 methylation (Figure 7C), indicating a methylation-independent mechanism in ATRA-treated NB4 and HL-60 cells.
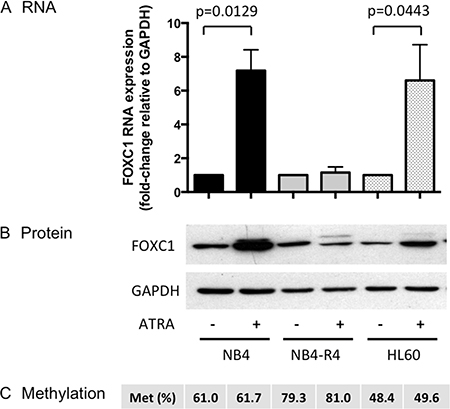
Figure 7: FOXC1 expression after ATRA treatment. (A) FOXC1 mRNA and protein (B) expression in ATRA-treated versus untreated cells. GAPDH was used as control for protein quantification (western blot images are assembled for figure usability in respect of original image acquisition and no specific features are obscured, moved, removed, or introduced). (C) FOXC1 DNA methylation level (%).
The combination of ATRA and decitabine treatment was not synergic on induction of FOXC1 mRNA expression, compared to either agents alone (Supplementary Figure 4). Also, treatment with arsenic trioxide, which is a very active drug in patients with APL, did not affect FOXC1 expression in NB4 cells (Supplementary Figure 5).
Of note, upregulation of FOXC1 did not occur upon ATRA treatment of ATRA-resistant NB4-R4 cells [20] (Figure 7A–7C), whereas decitabine treatment was able to induce FOXC1 demethylation and mRNA up-regulation also in this cell line (fold-change 2.5, p = 0.04, Figure 6A–6C). These data show that ATRA regulates FOXC1 expression through the RA receptor and decitabine treatment may restore FOXC1 expression in ATRA-resistant APL cells.
DISCUSSION
We show here that FOXC1 mRNA and protein expression are significantly downregulated in APL, compared to other AML subtypes. Our findings were confirmed by interrogating the TCGA data sets, where APL displayed 10-fold lower FOXC1 expression than the majority of non-APL AML. Previous studies reported functional overexpression of FOXC1 in about 20% of primary AML samples [13], but a specific analysis on APL cases had not been reported so far.
Interestingly, FOXC1 expression in the majority of AML was similar to that observed in normal hematopoietic progenitors and mature myeloid cells. Our data on CD34+ cells differ from those of Somerville et al, who reported absence of FOXC1 in murine BM progenitor cells [13]. Using a semi-quantitative PCR assay developed by Omatsu et al. [15], we found that FOXC1 mRNA expression in normal CD34+ progenitor cells was low, but clearly detectable at both the mRNA and protein level. Following in vitro differentiation along the granulocytic lineage, FOXC1 expression was initially downregulated and subsequently restored through a methylation-independent mechanism.
The observed FOXC1 downregulation in APL was however at least in part due to aberrant DNA hypermethylation, identified in CpGs localized next to the TSS (from + 354 to + 368), whose regulatory role has been previously shown by Klajic et al. in breast cancer cells [21]. Our observations are in apparent contrast with the lack of chromatin compaction and FOXC1 methylation in hematopoietic cells shown by Somerville et al. [13], who indeed analyzed a region located in the FOXC1 promoter. Epigenetic regulation of FOXC1 expression in non-hematopoietic cells was also confirmed in a study conducted by Yang et al., in a large cohort of patients with idiopathic pulmonary fibrosis. These authors showed that a single differentially methylated region (DMR) localized close to the FOXC1 TSS was able to drive changes in its expression [19]. Likewise, Zhang et al., recently identified functional DNA methylation changes in midbrain dopaminergic neurons of patients affected by Parkinson disease [20].
We further confirmed the epigenetic modulation of FOXC1 expression using hypomethylating agents. In fact, treatment of NB4 and HL60 cell lines with decitabine, induced a decrease of FOXC1 methylation and a concomitant upregulation of its expression. Similar results were recently reported by Wang et al., in melanoma cell lines, using the hypomethylating agent azacitidine [12]. These investigators found that FOXC1 overexpression was associated with disease progression and poor prognosis, and suggested FOXC1 as a potential prognostic biomarker to predict outcome [12].
Using in vitro models mimicking the process of normal granulocytic differentiation, we found that FOXC1 expression was initially downmodulated, and subsequently upregulated, independently of DNA methylation. In NB4 and HL-60 leukemic cell lines, differentiation along the granulocytic lineage using ATRA was associated to marked FOXC1 upregulation, without any changes in DNA methylation, suggesting the contribution of an ATRA-dependent mechanism to FOXC1 modulation. Using an ATRA-resistant APL cell line [22], we confirmed that FOXC1 binds to the RARA receptor.
Following these observations, we explored the effects of the PML-RARA fusion gene on FOXC1 expression using the PR9 inducible cell line. Induction of PML-RARA expression down-regulated FOXC1 expression, clearly showing the pivotal role of this fusion gene in FOXC1 regulation in APL cells and in non-hematopoietic cell line. We then showed that FOXC1 downregulation in APL is due to binding of PML/RARA to a specific motif localized in the FOXC1 promoter region (from –398 to –391), and that ATRA addition decreases PML-RARA binding and unlocks FOXC1 in both NB4 and PR9 cell lines. This mechanism may, at list in part, explain the silencing of FOXC1 expression in APL samples and the restoration of its expression in vivo after ATRA/ATO or ATRA and chemotherapy treatment. The lack of synergism between ATRA and decitabine in vitro may be due to the primary differentiating effect of ATRA in APL, which may limit the incorporation of decitabine in the DNA.
In conclusion, our data show that down-modulation of the transcription factor FOXC1 is a consistent feature of APL, occurring as a consequence of binding of the oncogenic protein PML-RARA to the FOXC1 promoter, and to FOXC1 hypermethylation. Further studies in mice models are needed to explore the pathogenetic and therapeutic implications of these observations. The potential role of hypomethylating agents in advanced APL, alone or in combination with other agents (e.g. ATRA and/or ATO) remains to be established.
MATERIALS AND METHODS
Cell line culture and in vitro treatment
NB4, an APL-derived t(15;17)-positive cell line, was purchased from DSMZ (Braunschweig, Germany). The ATRA-resistant cell line, NB4-R4, was kindly donated by Clara Nervi (La Sapienza University, Rome, Italy). The myeloid cell lines HL60, U937, and PR9, a zinc-inducible PML/RARA model derived from U937 cells, were kindly provided by Emanuela Colombo (European Institute of Oncology, Milan, Italy). Hek293T (HEK), a human embryonic kidney cell line, was kindly provided by Corinna Giorgi (European Brain Research Institute, EBRI, Rome, Italy).
All cell lines, but HEK, were grown at 37°C in a humidified atmosphere of 5% CO2 in air, in RPMI medium (GIBCO-BRL, Grand Island, NY, USA), supplemented with 10% fetal bovine serum (FBS) (GIBCO-BRL), 20 mM Hepes, 100 U/mL penicillin and 100 μg/mL streptomycin (GIBCO-BRL). HEK cells were grown in DMEM (GIBCO-BRL, Grand Island, NY, USA).
All-trans retinoic acids (ATRA), decitabine, ZnSO4 and Arsenic trioxide (all from Sigma-Aldrich, Steinheim, Germany), were dissolved in DMSO (10 mM stock solution, SS), Acetic Acid 50% (10mM SS), water (1M SS) and PBS (1x), respectively. DAC was added to the culture medium at 1 μM for 3 days, whereas ATO and ATRA were added to the culture medium at 1 μM for 1 day, as previously reported [3, 23]. ZnSO4 was added to the culture medium at 100 μM for 1 day [3]. Acetic Acid 50% and DMSO were used as control.
Patient and controls
The study population included 54 patients (29 females and 25 males, median age: 48.7 years, range: 14–87 years), with newly diagnosed AML (27 APL and 27 consecutively admitted other AML subtypes), whose BM samples were collected at the time of initial diagnosis. In 11 of the 27 patients with APL, BM samples were also studied at the time of remission following consolidation treatment using ATRA and chemotherapy or ATRA/arsenic trioxide or ATRA alone (n = 19, n = 7 and n = 1, respectively), according to the AIDA2000 and APL0406 studies [17–18]. The diagnosis was established according to standard morphologic, immunophenotypic and genetic criteria, according to the World Health Organization (WHO) classification [24]. Main patients demographic and clinical features are detailed in Table 1.
Table 1: Patient characteristics
AML (n: 27) |
APL (n: 27) |
|
|---|---|---|
Age (median, range) |
56 (15–87) |
41 (14–82) |
Sex (F/M) |
14/13 |
15/12 |
Karyotype (n = 18) |
7 |
na |
Normal |
2 |
|
t(8;21)(q22;q22.1) |
4 |
|
inv(16)(p13.1q22) or t(16;16)(p13.1;q22) Complex |
4 |
|
Hyperdiploid |
1 |
|
Molecular genetics |
||
FLT3-ITD |
6 |
|
NMPM1-mut |
3 |
|
PML/RARA breakpoint |
||
Bcr1 |
18 |
|
Bcr2 |
2 |
|
Bcr3 |
7 |
|
Hb (g/dl) |
9.4 |
9.5 |
WBC 109/L (median, range) |
29.8 (0.4–122) |
6.7 (5.3–45) |
PLTS 109/L (median, range) |
43 (5.5–79) |
53 (0.4–180) |
Sanz Risk score [16] |
||
Low/intermediate |
24 |
|
High |
3 |
na: not available
Mononuclear cells (MNC) were obtained by Ficoll gradient centrifugation using Lympholyte-H (Cedarlane, Ontario, Canada). Hematopoietic CD34+ progenitor cells isolated from 2 cord blood (CB) obtained from healthy full-term placentas, and 5 BM-MNC harvested from healthy donors, monocytes (n = 9), or neutrophils (n = 3), isolated from peripheral blood (PB), were used as controls. CD34+ cells were purified from CB and BM by positive selection using the midi-MACS immunomagnetic separation system (Miltenyi Biotec, Bergisch Gladabach, Germany), according to the manufacturer’s instructions. The purity of CD34+ cells was assessed by flow cytometry using a monoclonal PE-conjugated anti-CD34 antibody and resulted over 95% (range 92–98%). Purified human hematopoietic progenitor cells were grown in serum-free medium containing BSA (10 mg/ml), pure human transferrin (1 mg/ml), human low-density lipoproteins (40 μg/ml), insulin (10 μg/ml), sodium pyruvate (10–4 M), L-glutamine (2 × 10⁻³ M), rare inorganic elements (Sn, Ni, Va, Mo and Mn) supplemented with iron sulphate (4 × 10⁻⁸ M) and nucleosides (10 μg/ml each). CD34+ cells were induced into granulocytic differentiation by addition of IL-3 (1 unit/ml), granulocyte/monocyte CSF (0.1 ng/ml) and saturating amounts of G-CSF (500 units/ml); megakaryocytic differentiation with Thrombopoietin (TPO) (50 ng/ml); monocytic differentiation with M-CSF (10 ng/ml), FLT3 Ligand (50 ng/ml) and IL-6 (10 ng/ml); erythroid differentiation with erythropoietin (Epo) 3U/ml, IL-3 (0.01 unit/ml) and GM-CSF (0.01 ng/ml). The differentiation stage was evaluated by May Grunwald-Giemsa staining (Sigma-Aldrich, St. Louis, Mo, USA) and cytologic analysis (data not shown).
The study was approved by the Ethics committee of Tor Vergata University (Rome, Italy), and informed consent was obtained from all patients and controls, according to the Declaration of Helsinki.
Nucleic acid isolation and reverse transcription qPCR
DNA was extracted using the QIAamp DNA Mini Kit (Qiagen AG, Milan, Italy), following the manufacturer’s instructions. Total RNA was extracted using the RNeasy Mini Kit (Qiagen AG, Milan, Italy). Complementary DNA used for reverse transcription quantitative PCR (RT-qPCR) was synthesized using the QuantiTect Reverse Transcription Kit (Qiagen AG, Milan, Italy), in accordance with the manufacturer’s instructions. Expression levels of FOXC1 mRNA were analysed through a semi-quantitative PCR assay [15] (iQ SYBR Green Supermix, Bio-Rad), using GAPDH as reference gene. A melting curve (62°C–95°C) was generated at the end of each run to verify specificity of the reactions. Specific gene expression values, used to compare APL and AML samples, were expressed as 2–ΔCt, where ΔCt = Ct (test gene) - Ct (reference gene). Specific gene expression values, used to compare in vitro treatment, were expressed as 2–ΔΔCt, where ΔΔCt = ΔCt (test gene) - ΔCt (reference gene).
FOXC1 methylation
Bisulfite treatment and specific-pyrosequencing assays were performed to analyze the methylation status of FOXC1. Briefly, genomic DNA (1 μg) was bisulfite-converted using the EZ DNA Methylation-Gold KitTM (Zymo Research, Freiburg, Germany). Specific primers and annealing conditions have been previously reported by Muggerud et al. [25] The target region spans from +354 to +568 (nt 65513-65727, EMBL: AL034344) from the transcription start site (TSS). Reagents and protocols used for quantitative DNA methylation analysis were as recommended by manufacturers (PyroMark Q96 ID, Diatech Pharmacogenetics, Jesi, Italy).
Western blot analysis
Cell pellets were re-suspended in lysis buffer containing 10 mM Tris-HCl (pH 7.4), 5 mM EDTA, 150 mM NaCl, 1% Triton X-100, 250 μM orthovanadate, 20 mM β-glycerophosphate and protease inhibitors (Sigma-Aldrich, Steinheim, Germany). Lysates were centrifuged at 10000 g for 15 minutes at 4°C and supernatants were stored at −80°C. Protein concentration was measured by the Bradford Assay (#500––0006; Bio-Rad, München, Germany). Thirty microgram aliquots of proteins were re-suspended in a reducing Laemmli Buffer (with β-mercaptoethanol), loaded onto a 10% polyacrylamide gel, and then transferred to nitrocellulose membrane. After blocking with 5% milk (Fluka, Sigma-Aldrich, Saint Louis, USA), the membranes were incubated with anti-FOXC1 antibody code 8758S, cloneD8A6 (Cell Signalling Technology, Beverley, MA, USA). Horseradish peroxidase-conjugated IgG preparations were used as secondary antibodies, and the immunoreactivity was determined by the enhanced chemiluminescence (ECL) method (Amersham, Buckinghamshire, UK). The autoradiograms were scanned and exported for densitometry analysis. Protein signal intensities were measured using the Quantity One Software (Bio-Rad Laboratories, Hercules, CA, USA). Signal quantity was normalized using the unrelated proteins β-actin (Cell Signaling Technology, Beverley, MA, USA).
ChIP assay
ChIP assays were performed as previously described by Simone et al., with some modifications [26]. Briefly, DNA was double-crosslinked to proteins with 1% formaldehyde (Sigma, St Louis, USA). After incubation for 10 minutes at room temperature, glycine was added to a final concentration of 0.125 M, for 5 minutes. The cells were washed twice with PBS 1×, cell lysis buffer (10 mM Tris pH 8.0, 100 mM NaCl and 0.2% NP40) was then added to the samples and incubated on ice for 30 minutes. Nuclei were pelleted by microfuge at 1500 RPM at 4°C, and after addition of the nuclear lysis buffer (50 mM Tris 8.1, 10 mM EDTA and 1% SDS) were incubated on ice for 30 minutes. Chromatin fragments of around 200–300 bp were obtained by sonication, using a Branson Sonifier 450 Analog Cell Disruptor (30″ ON, 45″ OFF, for a total time of 10 minutes at output 2). For each immunoprecipitation, 2 mg of antibodies were conjugated to magnetic beads (G-protein magnetic Beads, Invitrogen, Dynal, Oslo). The following antibodies were used in the ChIP assays: anti-RARA (C-20, sc-551X, Santa Cruz Biotechnology, Inc. Dallas, USA), anti PML (H-238, sc5621, Santa Cruz Biotechnology, Inc. Dallas, USA), and a rabbit polyclonal IgG (#2729, Cell Signaling Inc. Massachusetts, USA). After extensive washing, bound DNA fragments were eluted and analyzed by quantitative PCR using the SYBR Green Master Mix (Applied Biosystems, Warrington, UK). ChIP signals were normalized against the input and expressed as relative enrichment of the material, precipitated by the indicated antibody binding to the FOXC1 promoter [relative quantification using the comparative Ct method (2−(Ct sample−Ct input)]. Chip primers were: CHIP-Foxc1-F: 5′-CGCCTGCTTGTTCTTTCTTT-3′, CHIP-Foxc1-R: 5′-CCGCCTTGCAGGAACTC-3′. The BLNK gene was used as a negative control; BLNK-F: 5′- GGCCCTGACTGATGGAAATTAC -3′ and BLNK-R: 5′- CAGCAGGTGACCATCCCTTTAG -3′.
Analysis of TCGA data
Gene expression analysis data from AML samples deriving from the The Cancer Genome Atlas Research Network 2008 were directly obtained from the public access data portal (http://cancergenome.nih.gov/dataportal/data/about). In this analysis, 179 AML samples stratified by the French American British morphology classification (FAB) and a total of 20319 genes with expression values in the RPKM format were included. Expression of FOXC1 in the 179 AML samples was plotted according to 5 FAB categories (Supplementary Figure 1). Data sets were cross-referenced using tumor-specific identification numbers.
Statistical analysis
The GraphPad Prism Statistical PC program (GraphPad Software, San Diego, CA) was used for statistical analysis. Data are presented as mean ± SD or median and range. Grouped data were compared using the non-parametric Mann–Whitney U test. p-values ≤ 0.05 were considered statistically significant. Prediction of transcription factor binding sites was performed using the LASAGNA-Search 2.0 Software (http://biogrid.engr.uconn.edu/lasagna_search/).
Author contributions
E.F. designed the study, performed experiments, analyzed the data and wrote the manuscript; G.F. designed the study, performed experiments, analyzed the data and wrote the manuscript; N.I.N. performed experiments and analyzed the data; E.S. performed experiments and analyzed the data; L.C. Collected patients’ clinical data; M.D.M. collected primary AML and APL samples; C.B. performed experiments; A.P. collected primary BM-MNC from normal individuals; A.M.C. performed experiments; L.B. performed experiments; M.S. performed experiments; E.P. performed experiments; U.T. designed the study, interpreted data and contributed to manuscript writing; F.L.C. designed the study, interpreted data and contributed to manuscript writing; M.T.V. designed the study, interpreted data and wrote the manuscript; All authors critically revised the work, provided substantial input, and gave final approval to the version to be published.
ACKNOWLEDGMENTS
This study was supported by Associazione Italiana Ricerca sul Cancro (AIRC, IG N. 5916 to FLC and N. 16952 to MTV), by Beat Leukemia Foundation Milano and Società Italiana Ematologia Sperimentale, SIES (to GF).
CONFLICTS OF INTEREST
All authors declared no conflicts of interest.
REFERENCES
1. Martens JH, Brinkman AB, Simmer F, Francoijs KJ, Nebbioso A, Ferrara F, Altucci L, Stunnenberg HG. PML-RARalpha/RXR Alters the Epigenetic Landscape in Acute Promyelocytic Leukemia. Cancer Cell. 2010; 17:173–85. https://doi.org/10.1016/j.ccr.2009.12.042.
2. Yang XW, Wang P, Liu JQ, Zhang H, Xi WD, Jia XH, Wang KK. Coordinated regulation of the immunoproteasome subunits by PML/RARalpha and PU.1 in acute promyelocytic leukemia. Oncogene. 2014; 33:2700–8. https://doi.org/10.1038/onc.2013.224.
3. Noguera NI, Piredda ML, Taulli R, Catalano G, Angelini G, Gaur G, Nervi C, Voso MT, Lunardi A, Pandolfi PP, Lo-Coco F. PML/RARa inhibits PTEN expression in hematopoietic cells by competing with PU.1 transcriptional activity. Oncotarget. 2016; 7:66386–66397. https://doi.org/10.18632/oncotarget.11964.
4. Coltella N, Percio S, Valsecchi R, Cuttano R, Guarnerio J, Ponzoni M, Pandolfi PP, Melillo G, Pattini L, Bernardi R. HIF factors cooperate with PML-RARalpha to promote acute promyelocytic leukemia progression and relapse. EMBO Mol Med. 2014; 6:640–50. https://doi.org/10.1002/emmm.201303065.
5. Ablain J, Rice K, Soilihi H, de Reynies A, Minucci S, de The H. Activation of a promyelocytic leukemia-tumor protein 53 axis underlies acute promyelocytic leukemia cure. Nat Med. 2014; 20:167–74. https://doi.org/10.1038/nm.3441.
6. Lehmann OJ, Sowden JC, Carlsson P, Jordan T, Bhattacharya SS. Fox’s in development and disease. Trends Genet. 2003; 19:339–44.
7. Hannenhalli S, Kaestner KH. The evolution of Fox genes and their role in development and disease. Nat Rev Genet. 2009; 10:233–40. https://doi.org/10.1038/nrg2523.
8. Wei LX, Zhou RS, Xu HF, Wang JY, Yuan MH. High expression of FOXC1 is associated with poor clinical outcome in non-small cell lung cancer patients. Tumour Biol. 2013; 34:941–6. https://doi.org/10.1007/s13277-012-0629-3.
9. Wang L, Gu F, Liu CY, Wang RJ, Li J, Xu JY. High level of FOXC1 expression is associated with poor prognosis in pancreatic ductal adenocarcinoma. Tumour Biol. 2013; 34:853–8. https://doi.org/10.1007/s13277-012-0617-7.
10. Xu Y, Shao QS, Yao HB, Jin Y, Ma YY, Jia LH. Overexpression of FOXC1 correlates with poor prognosis in gastric cancer patients. Histopathology. 2014; 64:963–70. https://doi.org/10.1111/his.12347.
11. Nagel S, Meyer C, Kaufmann M, Drexler HG, MacLeod RA. Deregulated FOX Genes in Hodgkin Lymphoma. Genes Chromosomes Cancer. 2014; 53:917–33. https://doi.org/10.1002/gcc.22204.
12. Wang J, Li L, Liu S, Zhao Y, Wang L, Du G. FOXC1 promotes melanoma by activating MST1R/PI3K/AKT. Oncotarget. 2016; 7:84375–84387. https://doi.org/10.18632/oncotarget.11224.
13. Somerville TD, Wiseman DH, Spencer GJ, Huang X, Lynch JT, Leong HS, Williams EL, Cheesman E, Somervaille TC. Frequent Derepression of the Mesenchymal Transcription Factor Gene FOXC1 in Acute Myeloid Leukemia. Cancer Cell. 2015; 28:329–42. https://doi.org/10.1016/j.ccell.2015.07.017.
14. Li S, Garrett-Bakelman FE, Chung SS, Sanders MA, Hricik T, Rapaport F, Patel J, Dillon R, Vijay P, Brown AL, Perl AE, Cannon J, Bullinger L, et al. Distinct evolution and dynamics of epigenetic and genetic heterogeneity in acute myeloid leukemia. Nat Med. 2016; 22:792–9. https://doi.org/10.1038/nm.4125.
15. Omatsu Y, Seike M, Sugiyama T, Kume T, Nagasawa T. Foxc1 is a critical regulator of haematopoietic stem/progenitor cell niche formation. Nature. 2014; 508:536–40. https://doi.org/10.1038/nature13071.
16. Sanz MA, Lo Coco F, Martín G, Avvisati G, Rayón C, Barbui T, Díaz-Mediavilla J, Fioritoni G, González JD, Liso V, Esteve J, Ferrara F, Bolufer P, et al. Definition of relapse risk and role of nonanthracycline drugs for consolidation in patients with acute promyelocytic leukemia: a joint study of the PETHEMA and GIMEMA cooperative groups. Blood. 2000; 96:1247–53.
17. Lo-Coco F, Avvisati G, Vignetti M, Breccia M, Gallo E, Rambaldi A, Paoloni F, Fioritoni G, Ferrara F, Specchia G, Cimino G, Diverio D, Borlenghi E, et al, and Italian GIMEMA Cooperative Group. Front-line treatment of acute promyelocytic leukemia with AIDA induction followed by risk-adapted consolidation for adults younger than 61 years: results of the AIDA-2000 trial of the GIMEMA Group. Blood. 2010; 116:3171–9. https://doi.org/10.1182/blood-2010-03-276196.
18. Lo-Coco F, Avvisati G, Vignetti M, Thiede C, Orlando SM, Iacobelli S, Ferrara F, Fazi P, Cicconi L, Di Bona E, Specchia G, Sica S, Divona M, et al, and Gruppo Italiano Malattie Ematologiche dell’Adulto, and German-Austrian Acute Myeloid Leukemia Study Group, and Study Alliance Leukemia. Retinoic acid and arsenic trioxide for acute promyelocytic leukemia. N Engl J Med. 2013; 369:111–21. https://doi.org/10.1056/NEJMoa1300874.
19. Yang IV, Pedersen BS, Rabinovich E, Hennessy CE, Davidson EJ, Murphy E, Guardela BJ, Tedrow JR, Zhang Y, Singh MK, Correll M, Schwarz MI, Geraci M, et al. Relationship of DNA Methylation and Gene Expression in Idiopathic Pulmonary Fibrosis. Am J Respir Crit Care Med. 2014; 190:1263–72. https://doi.org/10.1164/rccm.201408-1452OC.
20. Zhang L, Deng J, Pan Q, Zhan Y, Fan JB, Zhang K, Zhang Z. Targeted methylation sequencing reveals dysregulated Wnt signaling in Parkinson disease. J Genet Genomics. 2016; 43:587–592. https://doi.org/10.1016/j.jgg.2016.05.002.
21. Klajic J, Fleischer T, Dejeux E, Edvardsen H, Warnberg F, Bukholm I, Lønning PE, Solvang H, Børresen-Dale AL, Tost J, Kristensen VN. Quantitative DNA methylation analyses reveal stage dependent DNA methylation and association to clinico-pathological factors in breast tumors. BMC Cancer. 2013;13:456. https://doi.org/10.1186/1471-2407-13-456.
22. Shao W, Benedetti L, Lamph WW, Nervi C, Miller WH Jr. A retinoid-resistant acute promyelocytic leukemia subclone expresses a dominant negative PML-RAR α mutation. Blood. 1997; 89:4282–89.
23. Fabiani E, Leone G, Giachelia M, D’alo’ F, Greco M, Criscuolo M, Guidi F, Rutella S, Hohaus S, Voso MT. Analysis of genome-wide methylation and gene expression induced by 5-aza-2′-deoxycytidine identifies BCL2L10 as a frequent methylation target in acute myeloid leukemia. Leuk Lymphoma. 2010; 51:2275–84. https://doi.org/10.3109/10428194.2010.528093.
24. Vardiman JW, Harris NL, Brunning RD. The World Health Organization (WHO) classification of the myeloid neoplasms. Blood. 2002; 100:2292–302.
25. Muggerud AA, Rønneberg JA, Wärnberg F, Botling J, Busato F, Jovanovic J, Solvang H, Bukholm I, Børresen-Dale AL, Kristensen VN, Sørlie T, Tost J. Frequent aberrant DNA methylation of ABCB1, FOXC1, PPP2R2B and PTEN in ductal carcinoma in situ and early invasive breast cancer. Breast Cancer Res. 2010;12:R3. https://doi.org/10.1186/bcr2466.
26. Simone C, Forcales SV, Hill DA, Imbalzano AN, Latella L, Puri PL. p38 pathway targets SWI-SNF chromatin-remodeling complex to muscle-specific loci. Nat Genet. 2004; 36:738–43.