
INTRODUCTION
Acute-on-chronic liver failure (ACLF) is characterized by a precipitating event in patients with underlying chronic liver disease, leading to acute deterioration of liver function and often ending in multi-organ system failure [1]. About 650,000 people worldwide die from liver failure, cirrhosis, and hepatocellular carcinoma, which are caused by hepatitis B virus (HBV) infection each year [2]. HBV has been the major cause of ACLF in the developing countries in Asia. Up to now, the most effective treatment method of ACLF is liver transplantation (LT), but the shortage of liver donors prohibits the widely application of LT. Therefore, careful selection of patients is important for efficient organ allocation. Early identification of patients with poor prognosis can reduce mortality of this disease [3]. Thus, a model that can predict short-term mortality in ACLF patients is necessary for clinicians.
There are many prognostic models for ACLF, such as Child-Turcotte-Pugh(CTP), the model for end-stage liver disease (MELD) score, MELD-Na, sequential organ failure assessment. These prognostic models are based on clinical symptoms and biochemical parameters, not volume of the liver. The majority of acute-on-chronic hepatitis B liver failure (ACHBLF) had underlying liver cirrhosis, which could lead to the changes of liver morphology. Imaging evaluation is an important part of the evaluation of liver function. Saygili et al. [4] found that computed tomography (CT) could assess severity of liver cirrhosis. It was reported that CT-derived liver volume could be used as a prognostic factor for acute liver failure [5, 6]. In those studies, the liver volume was measured by manual measurement or semiautomated measurement. Semiautomated volumetry was convenient but required some special software, which restricted its use. Manual volumetry was time-consuming [7], and also affected by the evaluator’s experience. In contrast, the liver to abdominal area ratio (LAAR) on cross-sectional imaging, which is simply based on CT, could accurately predict mortality in end-stage liver disease [8]. We found that lower LAAR was related to better prognosis in alcoholic ACLF [9]. Inspired by this idea, the aim of the present study was to explore that whether LAAR alone or LAAR combining with currently prognostic methods such as MELD score would provide a more precise and powerful predicting ability on ACHBLF patients. Nomograms have been acknowledged to be accurate in prognostic predictions and been applied in area of cancer researches [10, 11]. So, this study would establish a prognostic nomogram for ACHBLF based on LAAR and MELD score.
Ethics
The study protocol has been approved by the Institutional Ethics Committee of the First Affiliated Hospital of Fujian Medical University and Meng Chao Hepatobiliary Hospital of Fujian Medical University, and were in compliance with the Declaration of Helsinki.
MATERIALS AND METHODS
Patients and treatment
We retrospectively reviewed data on patients who were diagnosed with ACLF, at the First Affiliated Hospital of Fujian Medical University between January 2009 and December 2014 and Meng Chao Hepatobiliary Hospital of Fujian Medical University between January 2015 and December 2015. The diagnosis of ACLF was fulfilled under the guideline of the Asian Pacific Association for the Study of the Liver (2014): the development of jaundice (total serum bilirubin [TBIL] ≥ 5 mg/dl) and coagulopathy (international normalized ration[INR] ≥ 1.5 or prothrombin activity ≤ 40%) was complicated within 4 weeks due to ascites and/or encephalopathy in patients with previously diagnosed or undiagnosed chronic liver disease [12]. We excluded patients with acute liver failure, chronic liver failure, alcoholic liver disease, fatty liver, human immunodeficiency virus, hepatocellular carcinoma, hemolytic jaundice, obstructive jaundice, hematologic neoplasms and coinfection with hepatitis A, C, D, or E viruses. Non-contrast CT was performed in every new diagnosed ACLF, and regular clinical and biochemical data were recorded during follow-up until the death or transplantation.
All qualified patients at the First Affiliated Hospital of Fujian Medical University were randomly assigned at a 2:1 ratio into the training cohort to develop the prognostic nomogram and the internal validation cohort to validate the established predictive models. All qualified patients from Meng Chao Hepatobiliary Hospital of Fujian Medical University served as the external validation cohort. The primary outcome was death or LT. All patients were classified into two groups: survival group and non-survival group who died or received LT within 3 months.
All the patients received supportive measures, including resting, albumin, nutritional supporting treatment, maintaining of electrolyte balance, antibiotics for infection, terlipressin for hepatorenal syndrome and lactulose for hepatic encephalopathy. All patents got antiviral therapy such as entecavir when they were initially diagnosed the ACHBLF.
Data collection
The clinical and laboratory data were collected on the day of admission, including the presence of infection or hepatic encephalopathy (HE), upper gastrointestinal bleeding (UGIB), TBIL, albumin (ALB), serum sodium (Na), serum creatinine (Cr), INR, alanine aminotransferase (ALT), aspartate transaminase(AST), hepatitis B surface antigen(HBsAg) levels and hepatitis B virus-deoxyribonucleic acid (HBV DNA) levels.
Infection was diagnosed based on the following criteria [13]: (a) spontaneous bacteremia: positive blood cultures without a source of infection; (b) spontaneous bacterial peritonitis: ascitic fluid polymorphonuclear cells > 250/μL; (c) lower respiratory tract infections: new pulmonary infiltrate in the presence of: (i) at least one respiratory symptom (cough, sputum production, dyspnea, pleuritic pain) with (ii) at least one finding on auscultation (rales or crepitation) or one sign of infection (core body temperature > 38°C or less than 36°C, shivering or leucocyte count > 10,000/mm3 or < 4,000/mm3) in the absence of antibiotics; (d) Clostridium difficile Infection: diarrhea with a positive C. difficile assay; (e) bacterial entero-colitis: diarrhea or dysentery with a positive stool culture for Salmonella, Shigella, Yersinia, Campylobacter, or pathogenic E. coli; (f) soft-tissue/skin Infection: fever with cellulitis; (g) urinary tract infection: urine white blood cell > 15/high power field with either positive urine gram stain or culture; (h) intra-abdominal infections: diverticulitis, appendicitis, cholangitis etc; (i) other infections not covered above, and (j) fungal infections as a separate category.
Follow-up
All patients were followed-up for at least 3 months after diagnosis of ACHBLF. Laboratory tests were monitored every 3–5 days in the hospital and then every 1–2 weeks when patients were discharged. The primary outcome was death or LT. The exact time of death of patients was collected through medical records, telephone follow-up and the household registration system queries.
Calculation of the MELD and MELD-Na
The MELD score was calculated according to the modified Malinchoc [14] formula: R = 9.57 × log e (Cr [mg/dl]) + 3.78 × log e(bilirubin [mg/dl]) + 11.2 × loge (INR) + 6.43 × (etiology: 0 if cholestatic or alcoholic, otherwise 1).
MELD-Na = MELD + 1.59 × (135 - Na), with maximum and minimum Na values of 135 and 120 mEq/L, respectively [15].
Measurement of LAAR
The whole LAAR of the patients were measured by using the CT films and the method described by Cross et al. [8]. The plain scans were performed on a 320-slice CT scanner (Aquilion One, Toshiba Medical Systems, Otawara, Japan) within 3 days after admission. According to Cross [8], LAAR = liver area (cm2)/abdominal area (cm2) ×100. The area was calculated by drawing an ellipse which approximates liver area or abdominal area (Figure 1A). We improved the calculation method of area to make it more precise. The liver and abdominal area, which were visualized with plots when the maximum liver area of slice was selected and traced with a cursor, would be calculated by computer automatically (Figure 1B). LAAR was measured by two doctors. The means of LAAR from two different observers were used in final analysis.
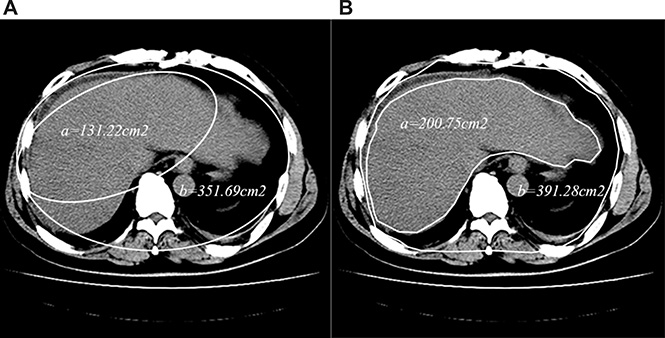
Figure 1: The difference between LAAR (A) and developed-LAAR (B) calculation schematic diagram. (A) The liver or abdominal area was calculated by drawing a ‘best-fit’ ellipsoid instead of maximum liver or abdominal area, the area was got by calculating the ellipsoid area. (B) The liver or abdominal area was measured by tracing the edge of the liver or the abdomen with a cursor, and then the area would be calculated by the computer automatically.
Statistical analysis
All statistical analyses were carried out using SPSS version 13 and R 3.2.2 (http://www.r-project.org/). Baseline comparisons between the two cohorts were performed using student’s t-test or Mann-Whitney test for continuous variables where appropriate and chi-square tests for categorical variables. Univariate and multivariable Cox proportional hazard analysis were used to recognize independent prognostic factors. Independent prognostic factors were identified through stepwise selection in a multivariable Cox proportional hazard analysis. Nomogram was established based on the results of multivariable analysis [16]. The discriminative ability of the nomogram was measured by area under the receiver-operating characteristic (ROC) curve(AUC) and calibration curve by comparing the predicted nomogram to actual observed Kaplan-Meier estimates of survival probability. ROC curve was drawn to determine the optimal threshold of nomogram. Kaplan-Meier survival curve was used in survival analysis. A P-value < 0.05 was considered statistically significant.
RESULTS
The baseline characteristics of the patients
From January 2009 to December 2014, 527 patients were diagnosed with ACLF at the First Affiliated Hospital of Fujian Medical University. A total of 304 patients were included in this study after excluding 223 patients (Figure 2). Those patients were randomly assigned into a training cohort (n = 203) and an internal validation cohort (n = 101). At a median of 494 days (range 2–2454 days) of follow-up, there were 128 patients died and 3 patients underwent LT. The baseline characteristics between the training cohort and the internal validation cohort were not significantly different (Table 1). In the training cohort, the median age was 44 years old, 168 (82.8%) were male, of which 42.4% patients (n = 86) died at the end of the follow-up. In the internal validation cohort, the median age also was 44 years old, 85 (84.2%) were male, of which 44.6% patients (n = 45) died at the end of the follow-up. The most common complication of ACHBLF was ascites.
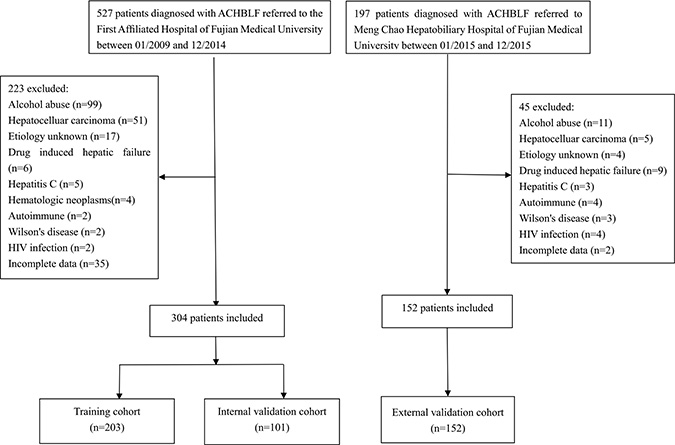
Figure 2: Flow chart of patient selection.
Table 1: Baseline characteristics of the training and validation sets
Variable |
Training (n = 203) |
Internal validation (n = 101) |
External validation (n=152) |
P value* |
P value† |
|---|---|---|---|---|---|
Sex, Male n, % |
168 (82.8) |
85 (84.2) |
130 (85.5) |
0.758 |
0.527 |
Age, years |
44 (35–54) |
44 (35–55) |
43 (34–52) |
0.932 |
0.736 |
Ascites n, % |
91 (44.8) |
53 (52.5) |
84 (55.2) |
0.208 |
0.112 |
HE n, % |
18 (8.9) |
7 (6.9) |
21 (13.8) |
0.563 |
0.062 |
Infection n, % |
82 (40.4) |
35 (34.7) |
67 (44.1) |
0.333 |
0.251 |
UGIB n, % |
14 (6.9) |
8 (7.9) |
5 (3.3) |
0.745 |
0.092 |
Artificial liver support system n, % |
55 (27.1) |
32 (31.7) |
55 (56.7) |
0.404 |
0.100 |
TBIL (mmol/L) |
303.4 (215.8–427.2) |
295.9 (205.1–416.1) |
297.8 (226.8–436.3) |
0.306 |
0.583 |
Sodium (mmol/L) |
138.0 (135.0–140.0) |
138.0 (135.0–139.2) |
137 (134.3–139.7) |
0.444 |
0.181 |
INR |
1.9 (1.6–2.4) |
2.0 (1.7–2.5) |
2.0 (1.7–2.6) |
0.382 |
0.054 |
Creatinine (umol/L) |
61.7 (54.2–71.9) |
60.8 (50.3–71.2) |
61.2 (55.8–67.5) |
0.257 |
0.898 |
Platelet count (109/L) |
111 (77–151) |
108 (76–139) |
114 (81–148.5) |
0.711 |
0.514 |
MELD score |
21.1 (18.5–24.9) |
21.3 (18.2–24.7) |
21.8 (19.3–25.5) |
0.515 |
0.230 |
MELD-Na score |
21.7 (18.9–26.8) |
22.3 (18.3–26.2) |
22.7 (19.7–27.5) |
0.590 |
0.186 |
CTP |
10 (9–11) |
10 (9–12) |
11 (9–12) |
0.193 |
0.115 |
LAAR |
39.9 (35.3–45.4) |
38.9 (34.7–44.1) |
38.8 (34.7–43.7) |
0.306 |
0.268 |
Values are expressed as medians (interquartile range).
Abbreviations: HE, hepatic encephalopathy; TBIL, total bilirubin; UGIB, upper gastrointestinal bleeding; INR, international normalized ratio; MELD , model for end-stage liver; CTP, Child-Turcotte-Pugh, LAAR: liver to abdominal area ratio.
*Comparison between the training cohort and the internal validation cohort from the First Affiliated Hospital of Fujian Medical University.
†Comparison between the external validation cohort from Meng Chao Hepatobiliary Hospital of Fujian Medical University and all patients in the training and internal validation cohorts from the First Affiliated Hospital of Fujian Medical University.
From January 2015 to December 2015, 197 patients were diagnosed with ACLF at Meng Chao Hepatobiliary Hospital of Fujian Medical University. 152 patients were included to serve as the external validation cohort after excluding 45 patients (Figure 2). In the external validation, the median age was 43 years old, 130(85.5%) were male, of which 33.6% patients (n = 51) died at the end of the follow-up. The baseline characteristics between two hospitals were not significantly different (Table 1).
Prognosis analysis in the training cohort
Univariate analysis showed that age, TBIL, Na, INR, ALB, Cr, ascites, infection, HE, UGIB, LAAR and MELD score differed significantly between survivors and those who died within three months (Table 2). Since TBIL, Cr and INR had linear correlation with MELD score, these three parameters were not taken into multivariate cox regression analysis. On the cox regression analysis, age (hazards ratio [HR] 1.023; 95% confidence interval [CI] 1.006–1.041), LAAR (HR 0.917; 95% CI 0.884–0.951) and MELD score (HR 1.131; 95% CI 1.092–1.171) were independent risk factors for 3-months mortality.
Table 2: Baseline characteristics of survival and non-survival patients in training group
Variables |
survival group (n = 117) |
non-survival group (n = 86) |
Univariate analysis |
Multivariate analysis |
||
|---|---|---|---|---|---|---|
P-value |
HR |
P |
95% CI |
|||
Age, years |
41 (34–49) |
48 (39–59) |
< 0.001 |
1.023 |
0.008 |
1.006–1.041 |
Male n, % |
98 (83.8) |
70 (81.4) |
0.525 |
|||
TBIL(umol/L) |
258.4 (197.2–389.1) |
331.1 (262.4–473.0) |
< 0.001 |
|||
ALT(U/L) |
332.0 (120.5–826.0) |
269.5 (106.5–751.5) |
0.690 |
|||
AST(U/L) |
297.0 (131.0–586.5) |
268.5 (106.5–586.5) |
0.797 |
|||
ALB(g/L) |
30.7 (28.5–34.3) |
29.8 (27.0–33.1) |
0.035 |
|||
Cr (umol/L) |
61.0 (54.7–68.4) |
63.0 (53.7–84.7) |
< 0.001 |
|||
Platelet count (109/L) |
115.0 (81.5–154.0) |
107.5 (64.75–150.0) |
0.205 |
|||
Na (mmol/L) |
139.0 (136.0–141.0) |
136.0 (132.1–139.0) |
< 0.001 |
|||
INR |
1.7 (1.6–2.0) |
2.2 (1.8–3.0) |
< 0.001 |
|||
HBsAg (IU/ml) |
2675.2 (557.3–10515.0) |
1555.0 (418.7–7167.3) |
0.100 |
|||
HBV DNA (log10[IU/ml]) |
4.5 (3.3–6.0) |
4.74 (3.4–6.0) |
0.754 |
|||
Artificial liver support system n, % |
26 (22.2) |
29 (33.7) |
0.064 |
|||
Ascites n, % |
38 (32.5) |
53 (61.6) |
< 0.001 |
|||
HE n, % |
2 (1.7) |
16 (18.6) |
< 0.001 |
|||
Infection n, % |
34 (29.1) |
48 (55.8) |
< 0.001 |
|||
UGIB n, % |
4 (3.4) |
10 (11.6) |
0.010 |
|||
LAAR |
43.2 (38.9–47.7) |
35.8 (32.1–39.5) |
< 0.001 |
0.917 |
< 0.001 |
0.884–0.951 |
MELD |
19.9 (17.6–21.9) |
24.9 (20.9–29.2) |
< 0.001 |
1.131 |
< 0.001 |
1.092–1.171 |
Abbreviations: TBIL, total bilirubin; ALT, alanine aminotransferase; AST, aspartate transaminase; ALB, albumin; Cr, serum creatinine; Na, serum sodium; INR, international normalized ratio; HBsAg, hepatitis B surface antigen; HBV-DNA, hepatitis B virus -deoxyribonucleic acid; HE, hepatic encephalopathy; UGIB, upper gastrointestinal bleeding; LAAR: liver to abdominal area ratio; MELD, model for end-stage liver disease; HR, hazards ratio; CI, confidence interval.
Prognostic Nomogram for survival in training cohort
The independent risk factors for prognosis of ACHBLF, age, LAAR and MELD score were incorporated into the nomogram (Figure 3). The AUC of the nomogram for survival prediction was 0.877 (95% CI 0.831–0.923), while the AUC was 0.783 (95% CI 0.719–0.848) for MELD score, 0.782 (95% CI 0.717–0.847) for MELD-Na and 0.731 (95% CI 0.660–0.801) respectively (Figure 4A). The difference was statistically significant between nomogram and MELD score (P = 0.001), between nomogram and MELD-Na (P = 0.001) or between nomogram and CTP (P < 0.001). The calibration plot for the probability of overall survival at 3-month demonstrated good agreement between the prediction by nomogram and actual observation (Figure 5A).
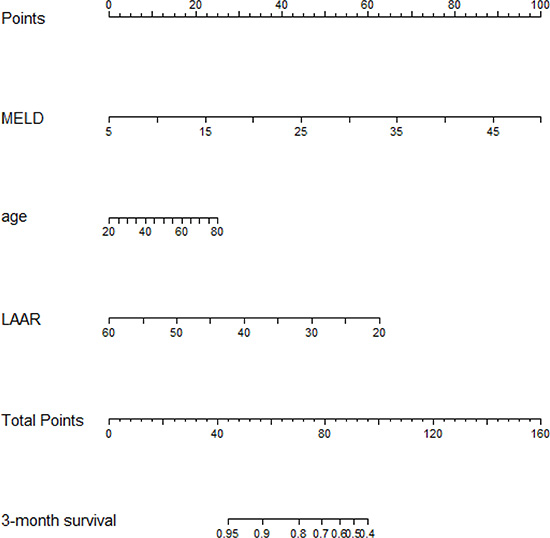
Figure 3: Nomogram to predict overall survival in ACHBLF patients. Draw an upward vertical line from each variable axis to the points bar to get points of each variable. Based on the sum of each variable points, draw a downward vertical line from Total Points axis to calculate 3-month overall survival.
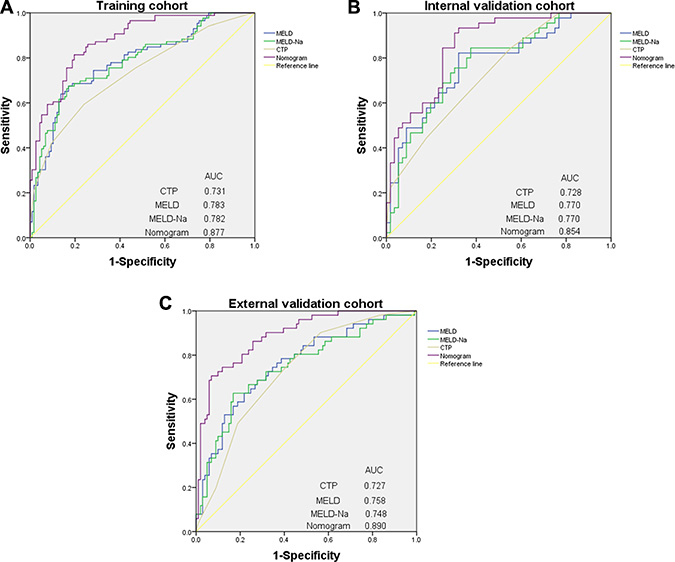
Figure 4: ROC curve of nomogram and other models to predict morbidity of patients with ACHBLF. (A) ROC curve in training cohort. (B) ROC curve in internal validation cohort. (C) ROC curve in external validation cohort.
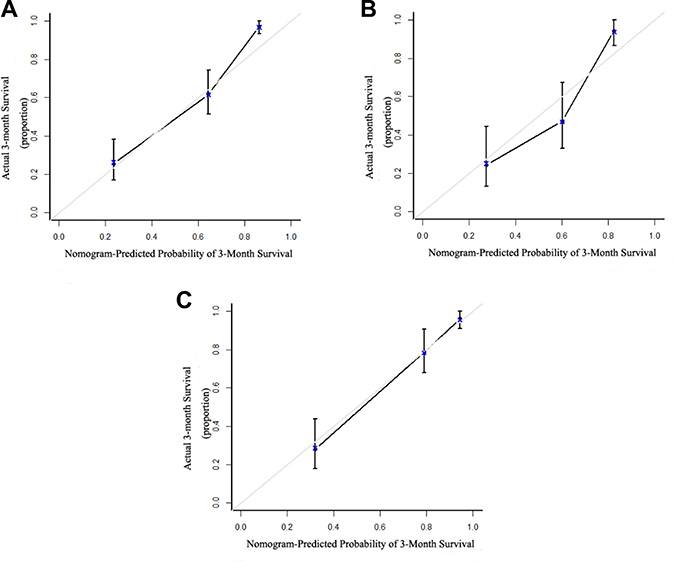
Figure 5: The calibration curve for predicting patient survival. (A) Calibration curves for predicting 3-month overall survival rate in the training cohort. (B) Calibration curves for predicting 3-month overall survival rate in the internal validation cohort. (C) Calibration curves for predicting 3-month overall survival rate in the external validation cohort. X axis is the nomogram-predicted probability of overall survival; y axis is the actual overall survival in the calibration curves.
Nomogram for overall survival prediction in internal validation cohort
Using 3-month mortality as the end point, the AUC was 0.854 (95% CI 0.782–0.926) for the nomogram, 0.770 (95% CI 0.677–0.863) for the MELD score, 0.770 (95% CI 0.678–0.862) for MELD-Na, 0.728 (95% CI0.632–0.824) for CTP, respectively. The difference was statistically significant between nomogram and MELD score (P = 0.027), between nomogram and MELD-Na (P = 0.028) or between nomogram and CTP (P = 0.003) (Figure 4B). The calibration plot showed good agreement between prediction and observation in the probability of 3-month survival (Figure 5B).
Nomogram for overall survival prediction in external validation cohort
Using 3-month mortality as the end point, the AUC was 0.890 (95% CI 0.836–0.943) for the nomogram, 0.758 (95% CI 0.676–0.840) for the MELD score, 0.748(95% CI 0.663–0.833) for MELD-Na, 0.727 (95% CI 0.645–0.803) for CTP, respectively. The difference was statistically significant between nomogram and MELD score (P < 0.001), between nomogram and MELD-Na (P < 0.001) or between nomogram and CTP (P <0.001) (Figure 4C). The calibration plot showed good agreement between prediction and observation in the probability of 3-month survival (Figure 5C).
Performance of the Nomogram in Stratifying Risk of Patients
Kaplan-Meier survival curve was used for survival analysis. The cutoff point about the total score of nomogram was 80.6 in the training cohort. The Kaplan-Meier survival curves with the optimal cutoff was shown in Figure 6A. The 3-month survival rates were 85.32% in the low nomogram score group (nomogram score < 80.6) and 25.53% in the high nomogram score group (nomogram score ≥ 80.6), respectively. The 3-month survival rate was significantly decreased when the total score of nomogram > 80.6. Log-rank survival analysis showed a significant difference (P < 0.001).
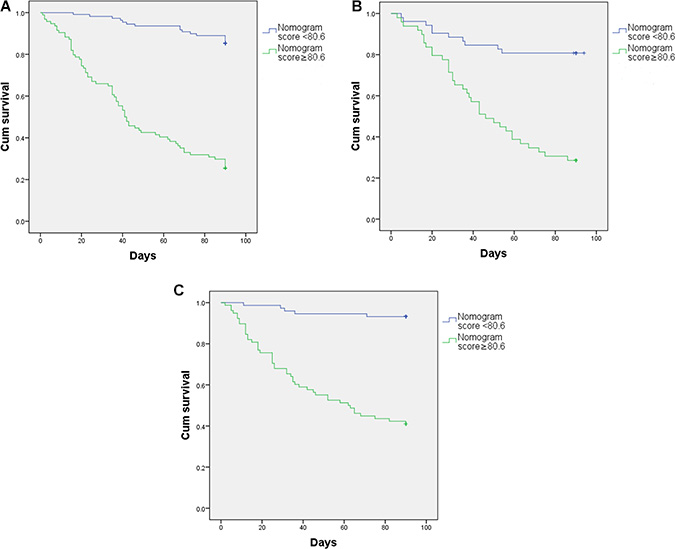
Figure 6: Kaplan-Meier survival curve. (A) training cohort. (B) internal validation cohort. (C) external validation cohort.
After applying the cutoff value to group patients in internal cohort (Figure 6B) and external cohort (Figure 6C), Log-rank survival analysis showed a significant difference (P < 0.001).
Usage of nomogram
For example, if a patient gets the MELD score = 20, drawing an upward vertical line from MELD variable axis to the point bar to get point of MELD variable is 33. If LAAR of this patient is 50, the point corresponding to LAAR variable is 16. If the age of a patient is 70, the corresponding point is 21. The total points equal to 70 (33 + 16 + 21). So, 3-month overall survival is 80% when we draw a straight line from Total Points axis to 3-month overall survival axis (Figure 3).
DISCUSSION
ACLF is a life-threatening event with high mortality. In our study, three-month mortality of ACHBLF was 40.0%, which was similar to other literature data [17–19]. We developed ACHBLF nomogram which could predict the short-term prognosis of liver failure. In the nomogram, the AUC for survival prediction were 0.877, 0.854 and 0.890 in the training, internal validation cohorts and external validation cohorts, respectively, and were significantly higher than those of MELD scores, MELD-Na and CTP, suggesting a favorable prediction ability. Survival was significantly decreased when the total score of nomogram > 80.6.
Death of a large number of hepatocyte plays a crucial role in the development of liver failure. The liver volume could partially reflect the quantity liver cells. Liver volume has been reported to have a significant correlation with the liver function [4, 20] and be closely related to the prognosis of acute liver failure [5, 6, 21]. However, the method of liver volume calculation is complicated, which limits its use. Therefore, Cross et al. [8] developed a simple, convenient and easy parameter, LAAR, to replace CT-derived liver volume. The LAAR has already been demonstrated to have an excellent ability in predicting the prognosis of liver cirrhotic patients [8]. In our study, lower LAAR also showed a significant relationship with poor outcome of ACHBLF.
In COX regression analysis, LAAR and MELD scores were independent prognostic factors for ACHBLF. MELD score was proposed by Kamath, composed of Cr, TBIL, INR and etiology of liver failure. MELD score could reflect multiple organ functions, such as liver, kidney and blood coagulation function, which closely related to liver failure. Many researches [22, 23] indicated that MELD score had good predictive capacity about ACLF prognosis. However, MELD score had many shortcomings, such as the variation of INR by different laboratory methodologies; Cr would be influenced by age, gender and body mass index of the patients [24]. The validation of MELD score in predicting outcome of ACHBLF was still controversial. Angermayr et al. [25] found that the efficiency of MELD score in predicting 1-year survival depends the etiology of cirrhosis: viral cirrhosis patients with MELD ≥ 16 would have significantly lower survival rates than alcoholic patients with same MELD scores. The ACHBLF nomogram contained MELD score and LAAR, reflecting both liver function and liver volume, which could complement each other perfectly. The AUC of ACHBLF nomogram were 0.877, which was higher than that of MELD score (AUC 0.783, P = 0.001), indicating that this new model had a better predictive power.
In our research, age was an independent prognostic factor for ACHBLF, which was consistent with the previous studies [22, 26]. Xie et al. [27] found that the mortality of HBV related liver failure increased markedly with increasing age ≥ 35 years in males and ≥ 55 years in females. In patients with chronic liver disease, liver function deteriorates with age and the regenerative capacity of the liver declines [28]. The older patients are more easily combined with complications because of low immunity.
After all, the ACHBLF nomogram consists of 3 components: age, LAAR and MELD score. This model predicts the prognosis of liver failure from several aspects: imaging and biochemistry. It is a convenient and clearly straightforward method to get probability.
There are several limitations to this study. We only included HBV-induced ACLF. The common etiologies of ACLF were alcohol, hepatitis B, hepatitis C, and non-alcoholic fatty liver disease [12]. In Asia, chronic hepatitis B accounts for 80% population developing ACLF [29], but alcoholic liver disease only accounts for 13% [30]. The LAAR in alcoholic ACLF were relatively larger than ACHBLF, and the larger LAAR in alcoholic patients were associated with higher mortality in our previous study [9]. This conflict results made it impossible to combine two different cause of ACLF into one predictive model. Hepatitis C, autoimmune hepatitis and Wilson’s disease were less common causes of ACLF in our department. The data were not enough for analysis. So, we were not able to incorporate cases except for HBV into new model due to the insufficient sample size and different physiopathological status. Although this nomogram was developed based on ACHBLF, it did not contain any specific serological markers of hepatitis B virus. The validation of this nomogram in other causes of liver failure is worth of further investigation.
CONCLUSIONS
In conclusion, we have developed ACHBLF nomogram that could predict short-term prognosis of ACHBLF patients.
Abbreviations
ACLF, acute-on-chronic liver failure; HBV, hepatitis B virus; LT, liver transplantation; CTP, Child-Turcotte-Pugh; MELD, model for end-stage liver disease; ACHBLF, acute-on-chronic hepatitis B liver failure; CT, computed tomography; LAAR: liver to abdominal area ratio; TBIL, total bilirubin; INR, international normalized ratio; HE, hepatic encephalopathy; UGIB, upper gastrointestinal bleeding; ALB, albumin; Na, serum sodium; Cr, serum creatinine; ALT, alanine aminotransferase; AST, aspartate transaminase; HBsAg, hepatitis B surface antigen; HBV-DNA, hepatitis B virus-deoxyribonucleic acid; AUC, area under the receiver-operating characteristic curve; ROC, receiver-operating characteristic; HR, hazards ratio; CI, confidence interval.
Author contributions
Guarantor of the article: Yueyong Zhu. Su Lin contributed to the study concept and design. Juan Chen, Lifen Han, Mingfang Wang, Haoyang Zhang and Dawu Zeng contributed to collection and analysis of data. Juan Chen and Su Lin contributed to interpretation of data, statistical analysis and drafting of the manuscript. Jing Dong, Jiaji Jiang and Yueyong Zhu contributed to critical revision of the manuscript for important intellectual content. All authors approved the latest version of the manuscript prior to submission.
ACKNOWLEDGMENTS
We are grateful to the patients for their help and willingness to participate in the study, and acknowledge Dr Yuntong Li for his guidance about R software.
CONFLICTS OF INTEREST
None.
FUNDING
This study was financially supported by Fujian Medical Innovation Project (2016-cx-033) and Fujian Natural Science Foundation (2017J01187).
REFERENCES
1. Asrani SK, O’Leary JG. Acute-on-chronic liver failure. Clin Liver Dis. 2014; 18:561–74.
2. Lozano R, Naghavi M, Foreman K, Lim S, Shibuya K, Aboyans V, Abraham J, Adair T, Aggarwal R, Ahn SY, Alvarado M, Anderson HR, Anderson LM, et al. Global and regional mortality from 235 causes of death for 20 age groups in 1990 and 2010: a systematic analysis for the Global Burden of Disease Study 2010. Lancet. 2012; 380:2095–128.
3. Gao FY, Liu Y, Li XS, Ye XQ, Sun L, Geng MF, Wang R, Liu HM, Zhou XB, Gu LL, Liu YM, Wan G, Wang XB. Score model for predicting acute-on-chronic liver failure risk in chronic hepatitis B. World J Gastroenterol. 2015; 21:8373–81.
4. Saygili OB, Tarhan NC, Yildirim T, Serin E, Ozer B, Agildere AM. Value of computed tomography and magnetic resonance imaging for assessing severity of liver cirrhosis secondary to viral hepatitis. Eur J Radiol. 2005; 54:400–07.
5. Perkins JD. Another formula to determine the prognosis of patients with acute liver failure. Liver Transpl. 2009; 15:986–91.
6. Yamagishi Y, Saito H, Ebinuma H, Kikuchi M, Ojiro K, Kanamori H, Tada S, Horie Y, Kato S, Hibi T. A new prognostic formula for adult acute liver failure using computer tomography-derived hepatic volumetric analysis. J Gastroenterol. 2009; 44:615–23.
7. Nakayama Y, Li Q, Katsuragawa S, Ikeda R, Hiai Y, Awai K, Kusunoki S, Yamashita Y, Okajima H, Inomata Y, Doi K. Automated hepatic volumetry for living related liver transplantation at multisection CT. Radiology. 2006; 240:743–48.
8. Cross TJ, Joseph M, Fernando RA, Farrell C, Mitchell JD. The liver to abdominal area ratio (LAAR): a novel imaging score for prognostication in cirrhosis. Aliment Pharmacol Ther. 2013; 38:1385–94.
9. Chen J, Patel SK, Lin S, Zhu YY. Letter: the liver to abdominal area ratio –a novel imaging score for prognostication in cirrhosis. Aliment Pharmacol Ther. 2016.
10. Li Y, Xia Y, Li J, Wu D, Wan X, Wang K, Wu M, Liu J, Lau WY, Shen F. Prognostic Nomograms for Pre- and Postoperative Predictions of Long-Term Survival for Patients Who Underwent Liver Resection for Huge Hepatocellular Carcinoma. Journal of the American College of Surgeons. 2015; 221:962–974 e964.
11. Wang Y, Li J, Xia Y, Gong R, Wang K, Yan Z, Wan X, Liu G, Wu D, Shi L, Lau W, Wu M, Shen F. Prognostic nomogram for intrahepatic cholangiocarcinoma after partial hepatectomy. J Clin Oncol. 2013; 31:1188–95.
12. Sarin SK, Kedarisetty CK, Abbas Z, Amarapurkar D, Bihari C, Chan AC, Chawla YK, Dokmeci AK, Garg H, Ghazinyan H, Hamid S, Kim DJ, Komolmit P, et al, and APASL ACLF Working Party. Acute-on-chronic liver failure: consensus recommendations of the Asian Pacific Association for the Study of the Liver (APASL) 2014. Hepatol Int. 2014; 8:453–71.
13. Bajaj JS, O’Leary JG, Reddy KR, Wong F, Olson JC, Subramanian RM, Brown G, Noble NA, Thacker LR, Kamath PS, and NACSELD. Second infections independently increase mortality in hospitalized patients with cirrhosis: the North American consortium for the study of end-stage liver disease (NACSELD) experience. Hepatology. 2012; 56:2328–35.
14. Kamath PS, Wiesner RH, Malinchoc M, Kremers W, Therneau TM, Kosberg CL, D’Amico G, Dickson ER, Kim WR. A model to predict survival in patients with end-stage liver disease. Hepatology. 2001; 33:464–70.
15. Biggins SW, Kim WR, Terrault NA, Saab S, Balan V, Schiano T, Benson J, Therneau T, Kremers W, Wiesner R, Kamath P, Klintmalm G. Evidence-based incorporation of serum sodium concentration into MELD. Gastroenterology. 2006; 130:1652–60.
16. Zhang Z, Kattan MW. Drawing Nomograms with R: applications to categorical outcome and survival data. Ann Transl Med. 2017; 5:211.
17. Wu SJ, Yan HD, Zheng ZX, Shi KQ, Wu FL, Xie YY, Fan YC, Ye BZ, Huang WJ, Chen YP, Zheng MH. Establishment and validation of ALPH-Q score to predict mortality risk in patients with acute-on-chronic hepatitis B liver failure: a prospective cohort study. Medicine (Baltimore). 2015; 94:e403.
18. Gustot T, Fernandez J, Garcia E, Morando F, Caraceni P, Alessandria C, Laleman W, Trebicka J, Elkrief L, Hopf C, Solís-Munoz P, Saliba F, Zeuzem S, et al, and CANONIC Study Investigators of the EASL-CLIF Consortium. Clinical Course of acute-on-chronic liver failure syndrome and effects on prognosis. Hepatology. 2015; 62:243–52.
19. Zheng MH, Wu SJ, Shi KQ, Yan HD, Li H, Zhu GQ, Xie YY, Wu FL, Chen YP. Conditional survival estimate of acute-on-chronic hepatitis B liver failure: a dynamic prediction based on a multicenter cohort.Oncotarget. 2015; 6:23261–71. https://doi.org/10.18632/oncotarget.4666.
20. Tong C, Xu X, Liu C, Zhang T, Qu K. Assessment of liver volume variation to evaluate liver function. Front Med. 2012; 6:421–27.
21. Sekiyama K, Yoshiba M, Inoue K, Sugata F. Prognostic value of hepatic volumetry in fulminant hepatic failure. Dig Dis Sci. 1994; 39:240–44.
22. Chen JF, Wang KW, Zhang SQ, Lei ZY, Xie JQ, Zhu JY, Weng WZ, Gao ZL, Lin BL. Dexamethasone in outcome of patients with hepatitis B virus-related acute-on-chronic liver failure. J Gastroenterol Hepatol. 2014; 29:800–06.
23. Garg H, Kumar A, Garg V, Sharma P, Sharma BC, Sarin SK. Clinical profile and predictors of mortality in patients of acute-on-chronic liver failure. Dig Liver Dis. 2012; 44:166–71.
24. Yeh HC, Lin YS, Kuo CC, Weidemann D, Weaver V, Fadrowski J, Neu A, Navas-Acien A. Urine osmolality in the US population: implications for environmental biomonitoring. Environ Res. 2015; 136:482–90.
25. Angermayr B, Luca A, König F, Bertolini G, Ploner M, Gridelli B, Ulbrich G, Reiberger T, Bosch J, Peck-Radosavljevic M. Aetiology of cirrhosis of the liver has an impact on survival predicted by the Model of End-stage Liver Disease score. Eur J Clin Invest. 2009; 39:65–71.
26. Zheng MH, Shi KQ, Lin XF, Xiao DD, Chen LL, Liu WY, Fan YC, Chen YP. A model to predict 3-month mortality risk of acute-on-chronic hepatitis B liver failure using artificial neural network. J Viral Hepat. 2013; 20:248–55.
27. Xie GJ, Zhang HY, Chen Q, Liu HM, You JP, Yang S, Mao Q, Zhang XQ. Changing etiologies and outcome of liver failure in Southwest China. Virol J. 2016; 13:89.
28. Cieslak KP, Baur O, Verheij J, Bennink RJ, van Gulik TM. Liver function declines with increased age. HPB. 2016; 18:691–96.
29. Seto WK, Lai CL, Yuen MF. Acute-on-chronic liver failure in chronic hepatitis B. J Gastroenterol Hepatol. 2012; 27:662–69.
30. Du WB, Li LJ, Huang JR, Yang Q, Liu XL, Li J, Chen YM, Cao HC, Xu W, Fu SZ, Chen YG. Effects of artificial liver support system on patients with acute or chronic liver failure. Transplant Proc. 2005; 37:4359–64.