
INTRODUCTION
Glioma is the most common primary brain tumor, with about 20000 new cases per year in the United States [1–3]. It has been verified that gliomas are correlated with a low survival rate, with a median overall survival (OS) of 8–15 months [4].
It is generally believed that glioma is very difficult to be cured because many currently available drugs that are effective against systemic cancers are unable to cross the blood-brain barrier [5]. To prevent and cure this devastating disease, it is therefore necessary to identify relative risk factors and the exact etiology of glioma, knowing that the etiology of glioma invloves several multiple factors [6–10] and and the actual pathogenesis remains unclear [11].
In recent years, more and more attentions have been paid to the roles of genetic factors (genes and gene polymorphisms) in the etiology, pathogenesis and complexity of glioma. Researchers attempt to explore new revolutionary therapeutic approaches based on these molecular genetics [1, 12]. Several gene polymorphisms, such as EGF-containing fibulin-like extracellular matrix protein 1 (EFEMP1) and cocaine-amphetamine-regulated transcript (CART) [13–15], have been identified to be significantly correlated with the etiology, development and progression of glioma.
Single-nucleotide polymorphisms (SNPs) in EGFR gene are getting increasingly recognition of importance in the etiology, development and progression of glioma, as it has been verified in many studies that EGFR gene plays a key role in human tumors by regulating cellular processes [10]. Wang et al. [10] reported that two polymorphisms (rs730437 and rs1468727) in EGFR gene were associated with etiology of giloma and its risk in Chinese populations, which was consistent with the study of Yan et al. [11]. Hou et al. [16] found EGFR haplotype ‘AATT’ was significantly associated with the decreased risk of glioma, while constrast results were observed in glioma patients carrying haplotype ‘CGTC’. In addition, genome-wide association studies (GWAS) [17–19] have also been performed and the results suggested that SNPs at two loci of EGFR gene (rs11979158 and rs2252586) were associated with glioma risk. Although an increasing number of EGFR gene polymorphisms have been identified to play an important role in etiology of glioma and be significantly associated with glioma risk [10, 11, 16–24], no comprehensive study has been performed to detect the associations between these EGFR gene polymorphisms and glioma risk, and give us conclusive results. The objective of this systematic review and meta-analysis is to determinate the associations of EGFR gene polymorphisms with glioma risk based on GWAS and case-control studies.
MATERIALS AND METHODS
Literature search
A systematic online search was conducted to find out all the eligibile studies. Databases including ‘PubMed’, ‘EMBASE’, ‘Web of Science’, ‘Cochrane Library’ and ‘China WeiPu Library’ were searched. All the studies recruited in our meta-analysis should investigate associations between EGFR gene polymorphisms and glioma risk. We used the following search terms to identify all the relevant studies: (‘EGFR’ OR ‘epidermal growth factor receptor’) AND (‘glioma’) AND (‘SNP’ OR ‘polymorphism’ OR ‘single nucleotide polymorphism’ OR ‘variation’). There were no language restrictions in our searching procedure. The reference lists of the recruited studies, reviews or conference reports were also searched to find out other eligible studies that might be omitted in databases. Furthermore, we examined the reviews and comments to further search out eligible studies so that no possible studies would be missed.
Inclusion and exclusion criteria
The inclusion criteria of were as follows: (1) case-control studies that explored the relationships between EGFR gene polymorphisms and glioma risk or GWAS; (2) cases: patients diagnosed as glioma; controls: cancer-free subjects (Hospital-based or Healthy-Based); (3) evaluation of glioma risk and at least one EGFR gene polymorphism was analyzed and reported; (4) reporting detailed numbers or frequencies of alleles or genotypes in at least one EGFR gene polymorphism in both cases and controls subjects. The exclusion criteria were as follows: (1) case reports or reviews; (2) no currently available or sufficient data; (3) duplicated studies.
Data extraction
Two authors extracted the general information and data in each study. If there was any disagreement, a third author would extract them, which was solved by consensus. The following data were collected: authors, publication year, types of article, number of studies in eligibile references, population ethnicities, sample size, source of controls, Hardy-Weinberg equilibrium (HWE) and SNPs studied in articles. We would contact the corresponding authors if there were incomplete data in recruited studies. In addition, whether the genotype distributions followed the HWE in controls was also explored.
Data synthesis and statistical analysis
We calculated the odds ratio (OR) and 95% confidence interval (CI) to evaluate the associations between EGFR gene polymorphisms and glioma risk. We used allele contrast model to assess the main results of the strength of associations between EGFR gene polymorphisms and glioma susceptibility. Other genetic models were also calculated to evaluate the relationships between EGFR gene polymorphisms and glioma risk. We examined the heterogeneity of included studies using Q statistical test and I2 metric value. If I2 value was > 50% or P < 0.10, OR was pooled by random effects models; otherwise, OR was pooled by the fixed effects model. We also assessed the HWE for the control group in each article; a P value > 0.05 suggested that the controls followed a HWE balance. Furthermore, we also performed a sensitivity analysis to detect whether each study has a great impact on pooled results. Besides, subgroup analysis was also performed according to the ethnicity. Stata 14.0 software was used to calculate the pooled results, and a P < 0.05 was considered as statistically significant.
RESULTS
Study selection and characteristics
A total of 11 studies [10, 11, 16–24] including four GWAS [17–19, 21] and seven case-control studies [10, 11, 16, 20, 22–24] were finally recruited in our study, as shown in Figure 1. GWAS by Rajaraman et al. [18], Di Stefano et al. [17], Melin et al. [21], and Sanson et al. [19] included 18, 7, 6 and 4 studies, respectively. Five studies [10, 11, 16, 20, 24] were performed in Asian populations, and the other six studies [17–19, 21–23] were conducted in Caucasian populations. Alleles and genotypes of 11 SNPs were finally collected and analyzed in our study, including rs730437, rs1468727, rs11506105, rs845552, rs12718945, rs17172432, rs3752651, rs4947492, rs9642393, rs11979158 and rs2252586. Four studies [11, 16, 20, 24] focused on the association between EGFR rs730437, rs1468727, rs11506105, rs845552, rs12718945, rs17172432, rs3752651, rs4947492 polymorphisms and glioma risk, among which two studies [16, 20] also reported the alleles and genotypes of EGFR rs9642393 in patients with glioma and controls. Wang et al. [10] studied the relationships between EGFR rs730437 and rs1468727 polymorphisms and glioma risk, and Andersson et al.’s study [22] explored the relationships between EGFR rs730437, rs1468727, rs9642393, rs11506105, rs845552, rs3752651 polymorphisms and glioma risk. In addition, four GWAS [17–19, 21] and one nested case-control study [23] were searched out and recruited in the pooled analysis of associations between EGFR rs11979158 and rs2252586 polymorphisms and glioma susceptibility. Controls in two studies were hospital-based [19, 20], and the remaining nine studies were population-based [10, 11, 16–18, 21–24]. All the controls in these studies complied with HWE. The general characteristics of recurited studies were shown in Table 1.
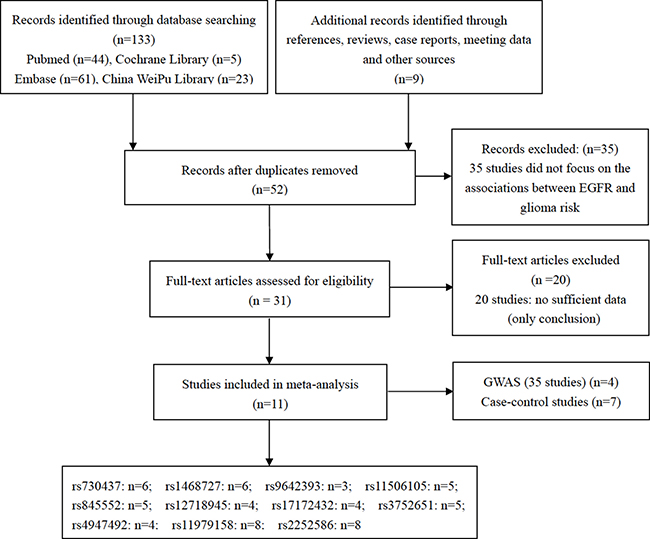
Figure 1: Flow chart showing the process of selection.
Table 1: Characteristics of studies selected in the meta-analysis
Author |
Year |
Type of article |
Number of studies in article |
Ethnicity |
Sample Size |
Source of controls |
HWE |
SNPs |
|
|---|---|---|---|---|---|---|---|---|---|
Case |
Control |
||||||||
Yan et al. [11] |
2017 |
Case-control study |
- |
Asian |
394 |
298 |
Population-Based |
0.87 |
rs730437, rs1468727, rs11506105, rs845552, rs12718945, rs17172432, rs3752651, rs4947492 |
Wang et al. [10] |
2015 |
Case-control study |
- |
Asian |
300 |
300 |
Population-Based |
0.78 |
rs730437, rs1468727 |
Du et al. [24] |
2015 |
Case-control study |
- |
Asian |
423 |
302 |
Population-Based |
0.52 |
rs730437, rs1468727, rs11506105, rs845552, rs12718945, rs17172432, rs3752651, rs4947492 |
Wibom et al. [23] |
2015 |
Nested case–control study |
- |
Caucasian |
598 |
595 |
Population-Based |
0.34 |
rs11979158, rs2252586 |
Rajaraman et al. [18] |
2013 |
GWAS |
18 |
Caucasian |
1856 |
4955 |
Population-Based |
0.27 |
rs11979158, rs2252586 |
Stefano et al. [17] |
2013 |
GWAS |
7 |
Caucasian |
1372 |
1190 |
Population-Based |
0.10 |
rs11979158, rs2252586 |
Melin et al. [21] |
2013 |
GWAS |
6 |
Caucasian |
1431 |
2868 |
Population-Based |
0.33 |
rs11979158, rs2252586 |
Jin et al. [20] |
2013 |
Case-control study |
- |
Asian |
72 |
302 |
Hospital-Based |
0.46 |
rs730437, rs1468727, rs9642393, rs11506105 rs845552, rs12718945, rs17172432, rs3752651, rs4947492 |
Hou et al. [16] |
2012 |
Case-control study |
- |
Asian |
301 |
302 |
Population-Based |
0.95 |
rs730437, rs1468727, rs9642393, rs11506105, rs845552, rs12718945, rs17172432, rs3752651, rs4947492 |
Sanson et al. [19] |
2011 |
GWAS |
4 |
Caucasian |
6416 |
9935 |
Hospital-Based |
0.07 |
rs11979158, rs2252586 |
Andersson et al. [22] |
2010 |
Case-control study |
- |
Caucasian |
725 |
1610 |
Population-Based |
0.74 |
rs730437, rs1468727, rs9642393, rs11506105, rs845552, rs3752651 |
Meta-analysis results
rs730437 was significantly associated with the increased risk of glioma (CC vs. CA/AA: OR = 1.38, 95% CI = 1.18–1.61, P < 0.001) in the overall populations, as shown in Table 3. Our subgroup analysis showed that there was a significant association between EGFR rs730437 polymorphism and susceptibility to glioma in Asian populations (C vs. A: OR = 1.33, 95% CI = 1.19-1.48, P < 0.001; CA vs. AA: OR = 1.36, 95% CI = 1.15-1.62, P < 0.001; CC vs. AA: OR = 1.82, 95% CI = 1.44-2.31, P < 0.001; CC/CA vs. AA: OR = 1.47, 95% CI = 1.25-1.72, P < 0.001; CC vs. CA/AA: OR = 1.52, 95% CI = 1.23-1.89, P < 0.001), while there was no significant association between EGFR rs730437 polymorphism and glioma risk in Caucasians (CC vs. CA/AA: OR = 1.24, 95% CI = 0.99-1.54, P = 0.058), as indicated in Table 2 and Table 3.
Table 2: Main results of meta-analysis of EGFR gene polymorphisms and risk of glioma
SNP |
Major/Minor |
Ethnicity |
MAF |
Test of association |
Model |
Test of heterogeneity |
|||
|---|---|---|---|---|---|---|---|---|---|
Cases |
Controls |
OR (95% CI) |
P value |
I2 |
P value |
||||
rs730437 |
A/C |
Asian |
0.43 |
0.36 |
1.33 (1.19–1.48) |
< 0.001 |
F |
0.0 |
0.874 |
rs1468727 |
T/C |
Asian |
0.49 |
0.42 |
1.30 (1.17–1.45) |
< 0.001 |
F |
0.0 |
0.851 |
rs9642393 |
C/T |
Asian |
0.43 |
0.38 |
1.24 (1.02–1.51) |
0.030 |
F |
0.0 |
0.541 |
rs11506105 |
A/G |
Asian |
0.41 |
0.36 |
1.23 (1.09–1.39) |
0.001 |
F |
0.0 |
0.868 |
rs845552 |
G/A |
Asian |
0.41 |
0.36 |
1.24 (1.10–1.40) |
0.001 |
F |
0.0 |
0.997 |
rs12718945 |
G/T |
Asian |
0.35 |
0.36 |
0.94 (0.83–1.06) |
0.316 |
F |
28.9 |
0.239 |
rs17172432 |
T/C |
Asian |
0.10 |
0.11 |
0.89 (0.73–1.08) |
0.229 |
F |
0.0 |
1.000 |
rs3752651 |
T/C |
Asian |
0.08 |
0.07 |
1.12 (0.90–1.40) |
0.310 |
F |
0.0 |
1.000 |
rs4947492 |
A/G |
Asian |
0.36 |
0.35 |
1.03 (0.91–1.16) |
0.661 |
F |
0.0 |
0.804 |
rs11979158 |
A/G |
Caucasian |
0.14 |
0.18 |
0.81 (0.76–0.86) |
< 0.001 |
F |
12.9 |
0.329 |
rs2252586 |
G/A |
Caucasian |
0.32 |
0.29 |
1.10 (0.98–1.23) |
0.092 |
R |
82.0 |
< 0.001 |
MAF: Minor Allele Frequency.
R: Random Effect Model.
F: Fixed Effect Model.
Table 3: Associations between SNPs in EGFR gene and risk of glioma in other genetic models
Genetic Models |
Ethnicity |
Test of association |
Model |
Test of heterogeneity |
|||
|---|---|---|---|---|---|---|---|
OR |
95% CI |
P value |
I2 (%) |
P value |
|||
rs730437 A/C |
|||||||
Heterozygote model (CA vs. AA) |
Asian |
1.36 |
1.15–1.62 |
< 0.001 |
F |
0.0 |
0.961 |
Homozygote model (CC vs. AA) |
Asian |
1.82 |
1.44–2.31 |
< 0.001 |
F |
0.0 |
0.981 |
Dominant model (CC/CA vs. AA) |
Asian |
1.47 |
1.25–1.72 |
< 0.001 |
F |
0.0 |
0.950 |
Recessive model (CC vs. CA/AA) |
Overall |
1.38 |
1.18–1.61 |
< 0.001 |
F |
0.0 |
0.779 |
Asian |
1.52 |
1.23–1.89 |
< 0.001 |
F |
0.0 |
0.998 |
|
Caucasian |
1.24 |
0.99–1.54 |
0.058 |
F |
- |
- |
|
rs1468727 T/C |
|||||||
Heterozygote model (CT vs. TT) |
Asian |
1.15 |
0.96–1.38 |
0.124 |
F |
0.0 |
0.810 |
Homozygote model (CC vs. TT) |
Asian |
1.81 |
1.44–2.28 |
< 0.001 |
F |
0.0 |
0.994 |
Dominant model (CC/CT vs. TT) |
Asian |
1.32 |
1.11–1.56 |
0.002 |
F |
0.0 |
0.875 |
Recessive model (CC vs. CT/TT) |
Overall |
1.34 |
0.91–2.00 |
0.142 |
R |
78.8 |
0.001 |
Asian |
1.66 |
1.36–2.02 |
< 0.001 |
R |
0.0 |
0.998 |
|
Caucasian |
0.55 |
0.34–0.87 |
0.010 |
R |
- |
- |
|
rs9642393 C/T |
|||||||
Heterozygote model (CT vs. CC) |
Asian |
1.35 |
0.79–2.30 |
0.274 |
R |
58.6 |
0.120 |
Homozygote model (TT vs. CC) |
Asian |
1.55 |
1.02–2.33 |
0.039 |
F |
0.0 |
0.729 |
Dominant model (TT/CT vs. CC) |
Asian |
1.32 |
0.99–1.77 |
0.057 |
F |
43.5 |
0.184 |
Recessive model (TT vs. CT/CC) |
Overall |
1.00 |
0.57–1.75 |
0.999 |
R |
74.4 |
0.020 |
Asian |
1.35 |
0.93–1.95 |
0.112 |
R |
0.0 |
0.653 |
|
Caucasian |
0.64 |
0.43–0.94 |
0.022 |
R |
- |
- |
|
rs11506105 A/G |
|||||||
Heterozygote model (AG vs. AA) |
Asian |
1.24 |
1.02–1.50 |
0.032 |
F |
0.0 |
0.945 |
Homozygote model (GG vs. AA) |
Asian |
1.58 |
1.20–2.09 |
0.001 |
F |
0.0 |
0.997 |
Dominant model (GG/AG vs. AA) |
Asian |
1.31 |
1.09–1.57 |
0.004 |
F |
0.0 |
0.959 |
Recessive model (GG vs. AG/AA) |
Overall |
1.35 |
1.13–1.60 |
0.001 |
F |
0.0 |
0.975 |
Asian |
1.40 |
1.09–1.82 |
0.010 |
F |
0.0 |
0.998 |
|
Caucasian |
1.29 |
1.02–1.64 |
0.035 |
F |
- |
- |
|
rs845552 G/A |
|||||||
Heterozygote model (AG vs. GG) |
Asian |
1.24 |
1.02–1.51 |
0.033 |
F |
0.0 |
0.969 |
Homozygote model (AA vs. GG) |
Asian |
1.48 |
1.14–1.93 |
0.004 |
F |
0.0 |
0.999 |
Dominant model (AA/AG vs. GG) |
Asian |
1.30 |
1.08–1.56 |
0.005 |
F |
0.0 |
0.987 |
Recessive model (AA vs. AG/GG) |
Overall |
1.12 |
0.82–1.54 |
0.462 |
R |
65.7 |
0.033 |
Asian |
1.32 |
1.04–1.69 |
0.025 |
R |
0.0 |
0.986 |
|
Caucasian |
0.80 |
0.63–1.00 |
0.054 |
R |
- |
- |
|
rs3752651 T/C |
|||||||
Recessive model (CC vs. CT/TT) |
Overall |
1.34 |
0.81–2.23 |
0.252 |
F |
0.0 |
0.741 |
Asian |
1.99 |
0.18–22.10 |
0.574 |
F |
- |
- |
|
Caucasian |
1.32 |
0.78–2.21 |
0.298 |
F |
- |
- |
|
rs11979158 A/G |
|||||||
Heterozygote model (AG vs. AA) |
Caucasian |
0.81 |
0.74–0.88 |
< 0.001 |
F |
29.8 |
0.223 |
Homozygote model (GG vs. AA) |
Caucasian |
0.71 |
0.55–0.91 |
0.006 |
F |
0.0 |
0.643 |
Dominant model (GG/AG vs. AA) |
Caucasian |
0.80 |
0.74–0.87 |
< 0.001 |
F |
24.1 |
0.261 |
Recessive model (GG vs. AG/AA) |
Caucasian |
0.75 |
0.58–0.96 |
0.022 |
F |
0.0 |
0.623 |
rs2252586 G/A |
|||||||
Heterozygote model (AG vs. GG) |
Caucasian |
1.08 |
0.91–1.28 |
0.395 |
R |
79.1 |
0.001 |
Homozygote model (AA vs. GG) |
Caucasian |
1.21 |
0.89–1.65 |
0.231 |
R |
83.7 |
< 0.001 |
Dominant model (AA/AG vs. GG) |
Caucasian |
1.10 |
0.90–1.34 |
0.342 |
R |
86.0 |
< 0.001 |
Recessive model (AA vs. AG/GG) |
Caucasian |
1.17 |
0.93–1.47 |
0.171 |
R |
72.2 |
0.006 |
rs1468727 was a risk contributor to glioma susceptibility in Asians (C vs. T: OR = 1.30, 95% CI = 1.17-1.45, P < 0.001; CC vs. TT: OR = 1.81, 95% CI = 1.44-2.28, P < 0.001; CC/CT vs. TT: OR = 1.32, 95% CI = 1.11-1.56, P = 0.002; CC vs. CT/TT: OR = 1.66, 95% CI = 1.36-2.02, P < 0.001), and a protective contributor in Caucasians (CC vs. CT/TT: OR = 0.55, 95% CI = 0.34-0.87, P = 0.010). However, there was no significant association between rs1468727 and glioma risk in the overall populations (CC vs. CT/TT: OR = 1.34, 95% CI = 0.91-2.00, P = 0.142). All the data are shown in Table 2 and Table 3.
As shown in Table 2 and Table 3, although no significant association was observed between rs9642393 and glioma risk in the overall populations (TT vs. CT/CC: OR = 1.00, 95% CI = 0.57-1.75, P = 0.999), rs9642393 might increase the risk of glioma in Asian populations (T vs. C: OR = 1.24, 95% CI = 1.02-1.51, P = 0.030; TT vs. CC: OR = 1.55, 95% CI = 1.02-2.33, P = 0.039), and decrease the risk of glioma in Caucasian populations (TT vs. CT/CC: OR = 0.64, 95% CI = 0.43-0.94, P = 0.022).
Our results also illustrated a significant association between rs11506105 and glioma risk in either overall populations (GG vs. AG/AA: OR = 1.35, 95% CI = 1.13-1.60, P = 0.001), Asian populations (G vs. A: OR = 1.23, 95% CI = 1.09-1.39, P = 0.001; AG vs. AA: OR = 1.24, 95% CI = 1.02-1.50, P = 0.032; GG vs. AA: OR = 1.58, 95% CI = 1.20-2.09, P = 0.001; GG/AG vs. AA: OR = 1.31, 95% CI = 1.09-1.57, P = 0.004; GG vs. AG/AA: OR = 1.40, 95% CI = 1.09-1.82, P = 0.010) or Caucasian populations (GG vs. AG/AA: OR = 1.29, 95% CI = 1.02-1.64, P = 0.035).
We also found that rs845552 was significantly associated with increased risk of glioma in Asian populations (A vs. G: OR = 1.24, 95% CI = 1.10-1.40, P = 0.001; AG vs. GG: OR = 1.24, 95% CI = 1.02-1.51, P = 0.033; AA vs. GG: OR = 1.48, 95% CI = 1.14-1.93, P = 0.004; AA/AG vs. GG: OR = 1.30, 95% CI = 1.08-1.56, P = 0.005; AA vs. AG/GG: OR = 1.32, 95% CI = 1.04-1.69, P = 0.025); while no significant association between rs845552 and glioma risk was observed in either Caucasian populations or overall populations (all, P > 0.05, Table 2 and Table 3).
rs11979158 was found to play a protective role in etiology and risk of glioma in Caucasians (G vs. A: OR = 0.81, 95% CI = 0.76-0.86, P < 0.001; AG vs. AA: OR = 0.81, 95% CI = 0.74-0.88, P < 0.001; GG vs. AA: OR = 0.71, 95% CI = 0.55-0.91, P = 0.006; GG/AG vs. AA: OR = 0.80, 95% CI = 0.74-0.87, P < 0.001; GG vs. AG/AA: OR = 0.75, 95% CI = 0.58-0.96, P = 0.022), although no study was performed to detect the relationship between rs11979158 and glioma risk in Asian and overall populations (Table 2 and Table 3).
We failed to find any significant association between rs12718945, rs17172432 and rs4947492 and glioma risk in Asian populations, and between rs2252586 and glioma risk in Caucasians (all, P > 0.05), as shown in Table 2 and Table 3. We could not find a definite relationships between rs12718945, rs17172432 and rs4947492 and glioma susceptibility in Caucasians, and between rs2252586 and giloma risk in Asians. In addition, rs3752651 was not significantly associated with glioma risk in either overall populations, Caucasians or Asians (all, P > 0.05). All the data were shown in Table 2 and Table 3.
Sensitivity analysis and publication bias
Furthermore, we also performed the sensitivity analysis. Omission of any study did not affect the previous results, suggesting that our results were relatively stable. However, we did not conduct the publication bias because it was not suitable to assess publication bias when the number of included studies was relatively small.
DISCUSSION
EGFR is a transmembrane tyrosine kinase in 7p11.2, which has been verified as an important contributor to multiple cellular processes, such as cell division, migration, adhesion, differentiation and apoptosis [19]. EGFR is one of the critical oncogenes for several cancers [25], such as non-small cell lung cancer (NSCLC) [26] and urinary bladder cancer (BC) [27].
EGFR is a highly variable gene, which is thought as the fourth most highly mutated gene in a compendium of common cancer genes [28]. Recently, researchers have realized the importance of EGFR gene polymorphims in cancer therapy. EGFR yrosine kinase inhibitors (TKIs) have been verified to be effective in treating EGFR-mutant NSCLC, which are also considered as first-line treatment options in these patients [29]. Railkar et al. [27] described a targeted form of photo-therapy called photoimmunotherapy (PIT) that targets EGFR-expressing BC in their study, and found that anti-EGFR antibody panitumumab (Pan) IR700-induced PIT selectively killed EGFR-expressing BC cells in vitro and in vivo, and therefore warrants further therapeutic study in orthotopic xenografts of BC and ultimately in patients.
Many tumors, including glioma, show high resistance to conventional chemotherapy and/or radiotherapy. Ghotme et al. [1] thought that these conventional therapies did not take into account the unique molecular features of different subtypes of glioma. In recent years, it is widely believed that molecular genetics provide new insights in new revolutionary therapeutic approaches instead of conventional treatments [1]. Therefore, the associations between EGFR gene polymorphisms and susceptibility to glioma in different ethnicities have been widely studies [10, 11, 16–24], aiming to find new insights into treatment with a target-oriented approach in glioma.
Yan et al. [11] successfully genotyped 8 tSNPs in EGFR and found some evidence of association at two SNPs (rs730437 and rs1468727) that played a key role in glioma risk, which was consistent with some other studies [10, 16, 20, 24]. However, inconsistent findings were reported in Liu et al.’s study [30], indicating that the C allele of rs730437 was associated with decreased risk of glioma. Different genetic backgrounds, insufficient sample size, genotyping techniques or different environments may all contribute to these controversial results. In our study, rs730437, rs1468727 and rs11506105 were found to be significantly associated with the increased risk of glioma in Asians. Although these results are inconsistent with Liu et al.’s study [30], they might be more creditable than their study because more studies have been found out, and data of these studies were collected and analyzed in our meta-analysis. Furthermore, our results also showed EGFR rs730437 was not significantly associated with glioma risk in Caucasians, while we observed controversial results in the overall populations, suggesting that different genetic backgrounds might have significant impacts on the role of rs730437 in the etiology of glioma. As only one study [22] was performed in Caucasians and recruited in our meta-analysis, we could not make a definite conclusion about the role of rs730437 in giloma risk. Therefore, more studies with large sample size should be conducted to investigate the association between rs730437 and glioma risk in Caucasian populations. What’s more, the combination of different original data in each included study might lead to the changes of distribution of each genotype in different ethnicities. Therefore, it is easily for us to understand why there are significant differences in the pooled results in different ethnicities. Interestingly, our results suggested that rs1468727 was significantly associated with decreased risk of glioma in Caucasians, which was contrary to the case in Asian populations. Our findings were consistent with Liu et al.’s study [30], in which they observed that the rs1468727 T allele was significantly correlated with decreased glioma risk. The exact mechanism about how rs1468727 plays a key role in EGFR function, and why it plays a different role even contrast role in glioma risk in various ethnicities remain unclear. Therefore, more studies should be performed to investigate the exact mechanism of rs1468727 in etiology of glioma.
rs9642393 is another SNP in EGFR. Jin et al. [20] found that SNP rs9642393 in EGFR was associated with increased risk of glioma, while Hou et al. [16] did not find any significant association. Our subgroup analysis also indicated that rs9642393 played a key role in etiology and risk of glioma. Our results were more credible than each individual study. The distribution of alleles and genotypes might be changed when we put these origional data together. In our opinion, the changed distribution of alleles and genotypes might be the most important resason for the difference between our study and Jin et al. and Hou et al.’s studies [16, 20]. In addition, we also observed that rs9642393 was a protective factor to the risk of glioma in Caucasians, which is consistent with the study of Andersson et al. [22]. Different genetic backgrounds might constitute an important contributor to the difference between Caucasians and Asians, while other factors such as sample size, measurement errors or genotyping technologies also should not be ignored.
According to allele G association analysis and other genetic models, rs11506105 might play a key role in glioma risk in both overall, Caucasian and Asian populations, which was consistent with Yan et al.’s study [11]. However, Andersson et al. [22] reported that the rs11506105 A allele was associated with increased risk of glioma in Caucasian populations. In our opinion, rs11506105 might have different influences on etiology and risk of glioma in different ethnicities. However, what we could not neglect is that some other factors such as the sample size in different studies, different genotyping techniques, and the relationships between environment factors and genetic polymorphisms might also play play an imoprtant role in glioma risk.
The association between SNP rs845552 and glioma risk was discussed in five studie [11, 16, 20, 22, 24], and our pooled analysis showed that rs845552 was significantly correlated with glioma risk in Asians; however, rs845552 might not be an important contributor to the risk of risk in either overall or Caucasian populations. Our results are inconsistent with some other studies [11, 16, 20, 24], in which no statistical association with aglioma risk was observed, suggesting that either there was no such an effect, or the small sample size after stratified analysis limited the statistical power [11]. Another important reason why controversial results were found in our study and theirs [11, 16, 20, 24] was the re-distribution of numbers or frequencies of alleles and genotypes in glioma patients and control subjects. Therefore, it may easily understand why a significant association was observed in pooled results. In addition, our study showed that rs845552 did not play a key role in glioma risk in Caucasians. The different results between Asians and Caucasians might result from the different genetic backgrounds, sample size, measurement errors, genotyping technologies and the relationships between gene polymorphisms and environmental factors. Therefore, whether rs845552 was associated with glioma risk remains elusive and needs further investigation. In addition, rs12718945, rs17172432, rs3752651 and rs4947492 might not be important contributors to the etiology, risk and progression of glioma.
Four GWAS [17–19, 21] containing 35 studies and one case-control study [23] were finally recruited in our mat-analysis to explore the associations between rs11979158 and rs2252586 and glioma risk. Previously, Sanson et al. [19] conducted GWAS in UK and US glioma patients. Their analysis identified rs11979158 and rs2252586 in EGFR gene played an important role in risk and development of glioma. Rajaraman et al. [18] and Stefano et al. [17] conducted new independent GWAS of glioma to explore the association between rs11979158 and rs2252586 and glioma risk, and their results were consistent with Sanson et al. [19] However, Melin et al. [21] and Wibom et al. [23] failed to find any significant association between rs11979158 and rs2252586 and glioma risk. Wibom et al. [23] thought that it might be attributable to the relatively limited statistical power of their study. We observed that rs11979158 was significantly associated with glioma risk, which is consistent with Wu et al.’s study [31]. Although the same result was observed in our and Wu et al.’s study, our study is more credible than theirs because other two studies [18, 23] were searched out and included in our meta-analysis. Our study provides new insights into mechanisms of pathogenesis, development or progression, indicating that rs11979158 might be a candidate locus of the target-oriented approach. However, we did not find any study performed in Asians. Whether rs11979158 was correlated with glioma risk in Asian populations needs further investigation, knowing that different genetic backgrounds might have great impacts on the role of EGFR gene polymorphisms in glioma etiology. Wu et al.’s study [31] showed that rs2252586 had significant impact on glioma risk, which was inconsistent with our findings. Compared with Wu et al.’s study [31], our study had a larger sample size and more statistical power to detect the association. Therefore, in our opinion, rs2252586 might not be a candidate target for new therapies.
More attention should be paid to the implications of our results in clinical practice. First, rs2252586 could be considered as a useful markerfor glioma screening in certain ethnicities as we have found that the significant association between rs2252586 and glioma risk in different ethnicitie. Second, our study indicated that glioma is a monogenic disorder, and it is most probably associated with multiple genes. Third, screening of these EGFR gene polymorphisms may be useful for early identification of risk groups so that treatment effectiveness could be improved, surgical related complications could be avoided. In addition, these significant findings could also be helpful to cut down surgical and conventional treatment costs in patients with glioma.
Our study is the first meta-analysis to determinate the roles of 11 SNPs of EGFR in etiology and risk of glioma, which could offer new insights into treatment with a target-oriented approach. Furthermore, four GWAS containing 35 studies and 7 case-control studies were recruited and analyzed, which could provide sufficient statistical power to explore thees associations. However, some limitations should also not be ignored. First, no study was performed to detect the association between two important EGFR SNPs (rs11979158 and rs2252586) and glioma risk in Asians. Therefore whether rs11979158 and rs2252586 may be contributors to glioma in Asians needs more investigations. Second, we did not explore the association between EGFR gene polymorphisms and different subtypes of glioma such as astrocytoma, oligoastrocytoma and GBM due to the insufficient original data. As the biological characteristics may vary in different subtypes, whether EGFR gene polymorphisms play different roles in different subtypes of gliomas needs further investigation. Third, some other EGFR gene polymorphisms such as rs7809394, rs10225877 and rs917881 were not analyzed in our study, because only one study reported the relationships between these polymorphisms and glioma risk. Therefore, more larger-scale studies with sufficient origional data should be further performed.
CONCLUSIONS
Different SNPs in EGFR gene might have different impact on the risk of glioma in various ethnicities. These EGFR gene polymorphisms provide new insights in treating glioma.
CONFLICTS OF INTEREST
None.
REFERENCES
1. Ghotme KA, Barreto GE, Echeverria V, Gonzalez J, Bustos RH, Sanchez M, Leszek J, Yarla NS, Gomez RM, Tarasov VV, Ashraf GM, Aliev G. Gliomas: New Perspectives in Diagnosis, Treatment and Prognosis. Curr Top Med Chem. 2017; 17:1438–47. https://doi.org/10.2174/1568026617666170103162639.
2. Modrek AS, Bayin NS, Placantonakis DG. Brain stem cells as the cell of origin in glioma. World J Stem Cells. 2014; 6:43–52. https://doi.org/10.4252/wjsc.v6.i1.43.
3. Siegel RL, Miller KD, Jemal A. Cancer Statistics, 2017. CA Cancer J Clin. 2017; 67:7–30. https://doi.org/10.3322/caac.21387.
4. Anjum K, Shagufta BI, Abbas SQ, Patel S, Khan I, Shah SAA, Akhter N, Hassan SSU. Current status and future therapeutic perspectives of glioblastoma multiforme (GBM) therapy: A review. Biomed Pharmacother. 2017; 92:681–9. https://doi.org/10.1016/j.biopha.2017.05.125.
5. Lawson HC, Sampath P, Bohan E, Park MC, Hussain N, Olivi A, Weingart J, Kleinberg L, Brem H. Interstitial chemotherapy for malignant gliomas: the Johns Hopkins experience. J Neurooncol. 2007; 83:61–70. https://doi.org/10.1007/s11060-006-9303-1.
6. Preusser M, Haberler C, Hainfellner JA. Malignant glioma: neuropathology and neurobiology. Wien Med Wochenschr. 2006; 156:332–7. https://doi.org/10.1007/s10354-006-0304-7.
7. Wiedmann MK, Brunborg C, Di Ieva A, Lindemann K, Johannesen TB, Vatten L, Helseth E, Zwart JA. The impact of body mass index and height on the risk for glioblastoma and other glioma subgroups: a large prospective cohort study. Neuro Oncol. 2017; 19:976–985. https://doi.org/10.1093/neuonc/now272.
8. Lehrer S, Green S, Rendo A, Rosenzweig KE. Measles may be a Risk Factor for Malignant Brain Tumors. Brain Tumor Res Treat. 2015; 3:65–7. https://doi.org/10.14791/btrt.2015.3.2.65.
9. Saneei P, Willett W, Esmaillzadeh A. Red and processed meat consumption and risk of glioma in adults: A systematic review and meta-analysis of observational studies. J Res Med Sci. 2015; 20:602–12. https://doi.org/10.4103/1735-1995.165970.
10. Wang X, Zhang H, Wang D, Li X. Association of genetic polymorphisms of EGFR with glioma in a Chinese population. Genet Test Mol Biomarkers. 2015; 19:59–62. https://doi.org/10.1089/gtmb.2014.0228.
11. Yan M, Li J, He N, Shi X, Du S, Li B, Jin T. A case-control study of the association between the EGFR gene and glioma risk in a Chinese Han population. Oncotarget. 2017; 8:59823–59830. https://doi.org/10.18632/oncotarget.16946.
12. Goodenberger ML, Jenkins RB. Genetics of adult glioma. Cancer Genet. 2012; 205:613–21. https://doi.org/10.1016/j.cancergen.2012.10.009.
13. Jiang N, Peng YP, Wang XY, Dou CW, He WM. Assessing the association between EFEMP1 rs3791679 polymorphism and risk of glioma in a Chinese Han population. Genet Mol Res. 2016; 15. https://doi.org/10.4238/gmr.15038279.
14. Wang L, Li G, Liu N, Wang Z, Xu X, Qi J, Ren D, Zhang P, Zhang Y, Tu Y. Association of genetic variants in the CART gene with glioma susceptibility in a Chinese population. Oncotarget. 2016. https://doi.org/10.18632/oncotarget.11763. [Epub Ahead of Print].
15. Fisher JL, Schwartzbaum JA, Wrensch M, Wiemels JL. Epidemiology of brain tumors. Neurol Clin. 2007; 25:867–90.
16. Hou WG, Ai WB, Bai XG, Dong HL, Li Z, Zhang YQ, Xiong LZ. Genetic variation in the EGFR gene and the risk of glioma in a Chinese Han population. PLoS One. 2012; 7: e37531. https://doi.org/10.1371/journal.pone.0037531.
17. Di Stefano AL, Enciso-Mora V, Marie Y, Desestret V, Labussiere M, Boisselier B, Mokhtari K, Idbaih A, Hoang-Xuan K, Delattre JY, Houlston RS, Sanson M. Association between glioma susceptibility loci and tumour pathology defines specific molecular etiologies. Neuro-oncol. 2013; 15:542–7. https://doi.org/10.1093/neuonc/nos284.
18. Rajaraman P, Melin BS, Wang Z, McKean-Cowdin R, Michaud DS, Wang SS, Bondy M, Houlston R, Jenkins RB, Wrensch M, Yeager M, Ahlbom A, Albanes D, et al. Genome-wide association study of glioma and meta-analysis. Hum Genet. 2012; 131:1877–88. https://doi.org/10.1007/s00439-012-1212-0.
19. Sanson M, Hosking FJ, Shete S, Zelenika D, Dobbins SE, Ma Y, Enciso-Mora V, Idbaih A, Delattre JY, Hoang-Xuan K, Marie Y, Boisselier B, Carpentier C, et al. Chromosome 7p11.2 (EGFR) variation influences glioma risk. Hum Mol Genet. 2011; 20:2897–904. https://doi.org/10.1093/hmg/ddr192.
20. Jin TB, Li XL, Yang H, Jiri M, Shi XG, Yuan DY, Kang LL, Li SQ. Association of polymorphisms in FLT3, EGFR, ALOX5, and NEIL3 with glioblastoma in the Han Chinese population. Med Oncol. 2013; 30: 718. https://doi.org/10.1007/s12032-013-0718-1.
21. Melin B, Dahlin AM, Andersson U, Wang Z, Henriksson R, Hallmans G, Bondy ML, Johansen C, Feychting M, Ahlbom A, Kitahara CM, Wang SS, Ruder AM, et al. Known glioma risk loci are associated with glioma with a family history of brain tumours—a case-control gene association study. Int J Cancer. 2013; 132:2464–8. https://doi.org/10.1002/ijc.27922.
22. Andersson U, Schwartzbaum J, Wiklund F, Sjostrom S, Liu Y, Tsavachidis S, Ahlbom A, Auvinen A, Collatz-Laier H, Feychting M, Johansen C, Kiuru A, Lonn S, et al. A comprehensive study of the association between the EGFR and ERBB2 genes and glioma risk. Acta Oncol. 2010; 49:767–75. https://doi.org/10.3109/0284186x.2010.480980.
23. Wibom C, Spath F, Dahlin AM, Langseth H, Hovig E, Rajaraman P, Johannesen TB, Andersson U, Melin B. Investigation of established genetic risk variants for glioma in prediagnostic samples from a population-based nested case-control study. Cancer Epidemiol Biomarkers Prev. 2015; 24:810–6. https://doi.org/10.1158/1055-9965.epi-14-1106.
24. Du SL. The study of associations between gene polymorphisms and glioma risk in Chinese Xian Han populations. Northwest University. 2012.
25. Menezes SV, Sahni S, Kovacevic Z, Richardson DR. Interplay of the iron-regulated metastasis suppressor NDRG1 with epidermal growth factor receptor (EGFR) and oncogenic signaling. J Biol Chem. 2017. https://doi.org/10.1074/jbc.R117.776393.
26. Arora R, Krishnan V. Selective Targeting of the L858R Mutation (EGFR) in Non-Small Cell Lung Cancer: A Mechanism for Advancing Targeted Chemotherapy. Front Oncol. 2017; 7:104. https://doi.org/10.3389/fonc.2017.00104.
27. Railkar R, Krane LS, Li QQ, Sanford T, Siddiqui MR, Haines D, Vourganti S, Brancato SJ, Choyke PL, Kobayashi H, Agarwal PK. Epidermal Growth Factor Receptor (EGFR) Targeted Photoimmunotherapy (PIT) for the Treatment of EGFR expressing Bladder Cancer. Mol Cancer Ther. 2017 Jun 15. doi: 10.1158/1535-7163.MCT-16-0924. [Epub ahead of print].
28. Cancer Genome Atlas Research Network. Comprehensive genomic characterization defines human glioblastoma genes and core pathways. Nature. 2008; 455:1061–68.
29. Barnes TA, O’Kane GM, Vincent MD, Leighl NB. Third-Generation Tyrosine Kinase Inhibitors Targeting Epidermal Growth Factor Receptor Mutations in Non-Small Cell Lung Cancer. Front Oncol. 2017; 7:113. https://doi.org/10.3389/fonc.2017.00113.
30. Liu HB, Peng YP, Dou CW, Su XL, Gao NK, Tian FM, Bai J. Comprehensive study on associations between nine SNPs and glioma risk. Asian Pac J Cancer Prev. 2012; 13:4905–8.
31. Wu Q, Peng Y, Zhao X. An Updated and Comprehensive Meta-Analysis of Association Between Seven Hot Loci Polymorphisms from Eight GWAS and Glioma Risk. Mol Neurobiol. 2016; 53:4397–405. https://doi.org/10.1007/s12035-015-9346-4.