
INTRODUCTION
Diffuse large B-cell lymphomas (DLBCL) are a heterogeneous group of non-Hodgkin’s lymphomas (NHL) accounting for 30-40% of newly diagnosed lymphoma cases with clinical outcome strongly dependent upon subtype and risk factors at diagnosis [1]. Activated B-cell (ABC) DLBCL, known to be ‘addicted’ to NF-kappaB (NF-κB) signaling, may have a poorer therapeutic prognosis than germinal center B-cell (GCB) lymphomas expressing genes normally found in germinal center B-cells [2]. Unlike GCB DLBCL it is established that ABC DLBCL frequently rely upon B-cell receptor (BCR) signaling for sustained survival [3]. It is generally recognized that BCR signaling is antigen independent (tonic) or antigen dependent (active). In ABC DLBCL the BCR signaling mode has been more specifically described as ‘chronic active’, being qualitatively similar to the signaling of the antigen exposed B-cell [4]. The predominant pathway activations include CARD11 NF-κB-dependent activation in ~10% of cases [5] and Myd88 mutations observed in ~39% of cases [6], both contributing to constitutive NF-κB activity in ABC DLBCL.
A variety of drugs have been developed to address these different BCR signaling subtypes [7], however due to relapse following DLBCL therapy and the emergence of mutational resistance a number of small molecule inhibitors have been developed. As an example the Bruton’s tryosine kinase (BTK) inhibitor ibrutinib irreversibly binds BTK and elicits a potent effect, with ~40% of DLBCL patients responsive to therapy [8]. Alternatively, idelalisib (also CAL-101 or GS-1101) targets the phosphoinositide 3-kinase (PI3K) pathway acting to disrupt key cellular processes including metabolism and cell growth [9]. Despite idelalisib being established in the treatment of chronic lymphocytic leukaemia (CLL) and other indolent B-cell NHL [10], its utility is still under investigation in the context of aggressive lymphoma [11].
It is known that variability in DLBCL treatment response can be reflected by mutation status across subtypes, characterized by mutations targeting genes for specific subunits of the BCR signaling pathway such CD79a/b [8, 12, 13]. Previously histopathology has been used to define DLBCL and next generation sequencing has been instrumental in identifying novel characteristic mutations, despite this tumors can exhibit further heterogeneity in protein expression and post translational modifications (PTMs) profiles [14] contributing to the complexity of such disease. Despite established imaging methods such as 18F-FDG-PET facilitating assessment of therapy response and prediction of disease-free survival [15, 16], emerging molecular imaging methods such as matrix-assisted laser desorption ionization imaging mass spectrometry (MALDI IMS) are now able to identify proteins, metabolites and also small molecule drugs in situ [17]. Application of an acidic matrix to a tissue section, followed by laser desorption to ionize proteins that are then detected using mass spectrometry, provides in-depth spatial information of the whole tissue surface. Examples of MALDI IMS application in tissue studies extends from breast cancer classification [18] to markers of metastatic melanoma recurrence [19] and drug detection [20, 21].
In light of the reported promise of the BCR inhibitors ibrutinib and possibly also idelalisib in treatment of molecularly selected DLBCL, we address herein the question of whether an early response to BCR-directed therapy can be observed using a combination of molecular imaging techniques and mutational status in DLBCL.
RESULTS
The mutation status of specific BCR pathway components predicts the in vitro response to BCR inhibition
It is established that the mutational status of DLBCL can be predictive of therapy outcome when addressed using specific treatment regimens [8, 12, 13]. In order to establish whether mutational status of lymphoma cells in vitro is predictive of response to the BCR inhibitors ibrutinib and idelalisib, we tested their effect on the ABC DLBCL cell lines OCI-LY10, U-2932 and also on the GBC DLBCL line SU-DHL-6 that is not anticipated to be affected by the BTK inhibitor ibrutinib, but potentially by PI3K inhibition using idelalisib. As OCI-LY10 and U-2932 cells carry BCR pathway mutations – in CD79A ITAM/Myd88b and TAK1 respectively - it was hypothesized that differences in ability of the inhibitors to affect cell viability would be observed. Indeed, OCI-LY10 cells carrying the upstream mutation was responsive to both inhibitors demonstrating a significant drop in cell viability upon treatment with all concentrations of ibrutinib and idelalisib compared to controls (Figure 1A). SU-DHL-6 cells also responded significantly to both ibrutinib and idelalisib treatment at all higher doses. In the case of idelalisib treatment U-2932 cells basically did not respond to inhibition as compared to OCI-LY10 cells, whereas SU-DHL-6 demonstrated a similar reduction in viability upon idelalisib treatment (Figure 1A). Cell cycle analysis indicated that idelalisib treatment had no significant effect on cell cycle status of OCI-LY10 cells, however a significant increase of sub-G0 phase and a significant decrease in G1 phase to the highest dose of ibrutinib could be observed (Figure 1B) indicating a reduction in cell growth. Furthermore ibrutinib treatment induced a significant decrease in S and G2M phase activity in response to treatment (Figure 1B). Growth curve analysis of OCI-LY10 cells revealed a modest but significant response to idelalisib treatment at the highest dose, and significant decreases in growth in response to ibrutinib treatment (Figure 1C). Conversely U-2932 demonstrated no significant response to either ibrutinib or idelalisib upon treatment (Figure 1D). Together these data support that mutational status can in part be used to predict therapy response to BCR pathway inhibition in vitro.
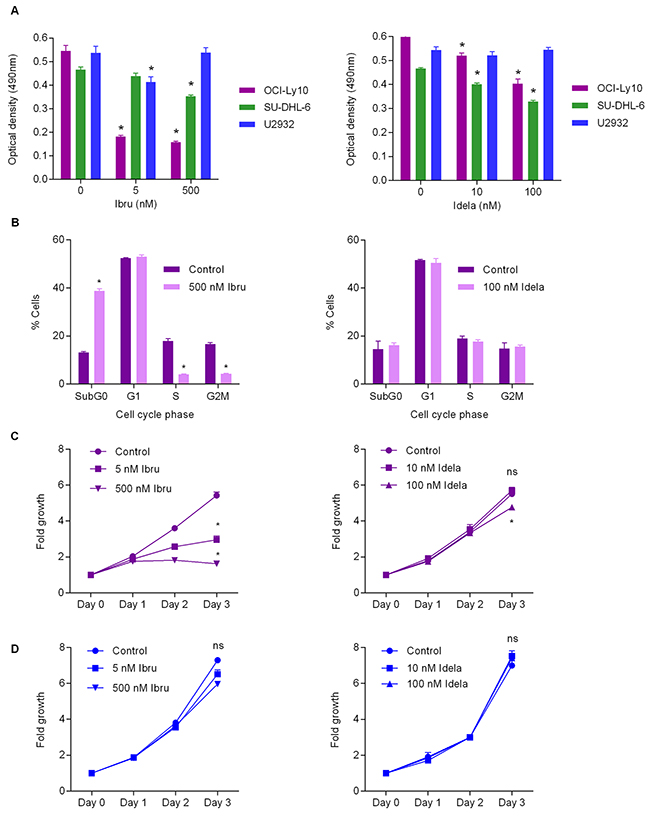
Figure 1: Mutational status predicts BCR inhibition response in vitro. (A) Optical density for OCI-LY10, U-2932 and SU-DHL-6 cells following ibrutinib (left) and idelalisib (right) treatment as measured by MTT assay. Values reported as optical density adjusted for background, error bars represent standard deviation (SD) (n=4). Student’s t-test was used to compare treated values versus control cells. Asterisks indicate statistical significance (p < 0.05). (B) Cell cycle analysis of ibrutinib treated OCI-LY10 (left) and idelalisib treated OCI-LY10 (right). Values reported as percentage of cells analyzed, error bars represent SD (n=3). Asterisks indicate statistical significance (p < 0.05). (C) Growth curve analysis of OCI-LY10 cells in response to ibrutinib (left) or idelalisib (right). Error bars represent SD (n=4). Asterisks indicate statistical significance (p < 0.05). (D) Growth curve analysis of U2932 cells in response to ibrutinib (left) or idelalisib (right). Error bars represent SD (n=3). Asterisks indicate statistical significance (p < 0.05).
Early therapy response is observed following BCR inhibition via 18F-FDG-PET and 18F-FLT-PET imaging
Following the observation of the effect of mutation status upon in vitro treatment response to BCR pathway inhibitors, we next aimed to establish whether 18F-FDG-PET imaging of lymphoma xenografts could be used to predict therapy response to BCR inhibition in vivo (Figure 2A). Results demonstrated that tumour-background ratios (TBRs) of OCI-LY10 xenografts in mice were reduced following both ibrutinib and idelalisib treatment (Figure 2B, left panel), indicating a reduction in tumour growth and glucose metabolism. Unexpectedly, U-2932 xenografts also displayed a reduction in TBR following treatment with both inhibitors compared to controls (Figure 2B, middle panel), however SU-DHL-6 xenografts were affected by neither ibrutinib nor idelalisib (Figure 2B, right panel), reflecting their reported lack of dependence upon BCR pathway signaling. Furthermore the reduction in TBR of OCI-LY-10 xenografts upon 18F-FDG-PET imaging was supported by a reduction in 18F-FLT signal (Figure 2C) and calculated TBR values (Figure 2D) following treatment with both inhibitors, indicating a reduced proliferation also. Immunohistochemistry of ibrutinib treated xenografts confirmed that treatment response reflects mutational status (Figure 3) with a strong trend towards an increase in apoptosis in ibrutinib treated OCI-LY10 xenografts.
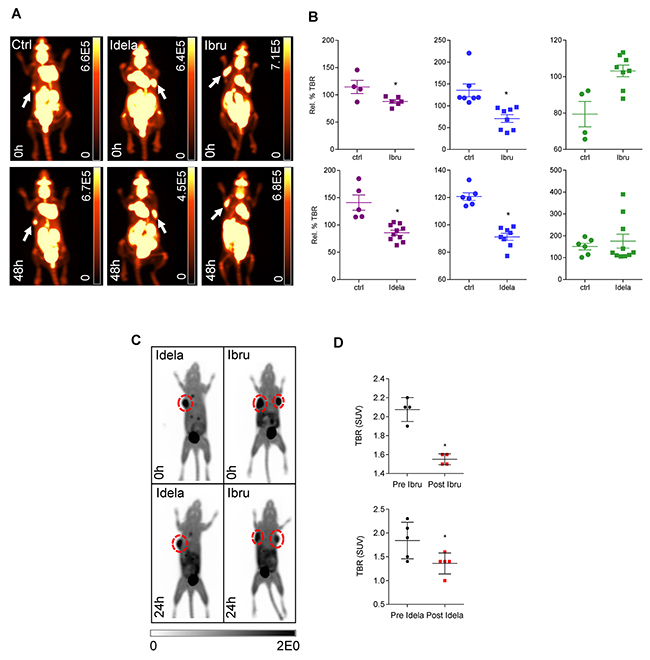
Figure 2: Therapeutic response to idelalisib or ibrutinib can be observed at an early time point in vivo. (A) 18F-FDG-PETimages of OCI-LY10 xenografts in NOD SCID mice without treatment (left) idelalisib treatment (middle) or ibrutinib treatment (right). All images 48 hours post treatment. Scale bars: Bq/ml. (B) Response of OCI-LY10 (left) U-2932 (middle) and SU-DHL-6 (right) xenografts to ibrutinib (upper panel) or idelalisib treatment (lower panel) in vivo as measured by relative percentage tumour to background (Rel. % TBR) ratio at 48 hours post treatment. Student’s t-test, *p < 0.05. (C) 18F-FLT-PET imaging of OCI-LY10 xenografts demonstrated reduced 18F-FLT uptake following BCR inhibition. Mice were imaged, treated with ibrutinib or idelalisib for 48 hours and imaged post-treatment. Scale bars standard uptake values (SUV). (D) TBR derived from standard uptake values (SUV) for OCI-LY10 xenografts following ibrutinib (n = 4) and idelalisib treatment (n = 5) treatment. Student’s t-test, *p < 0.05.
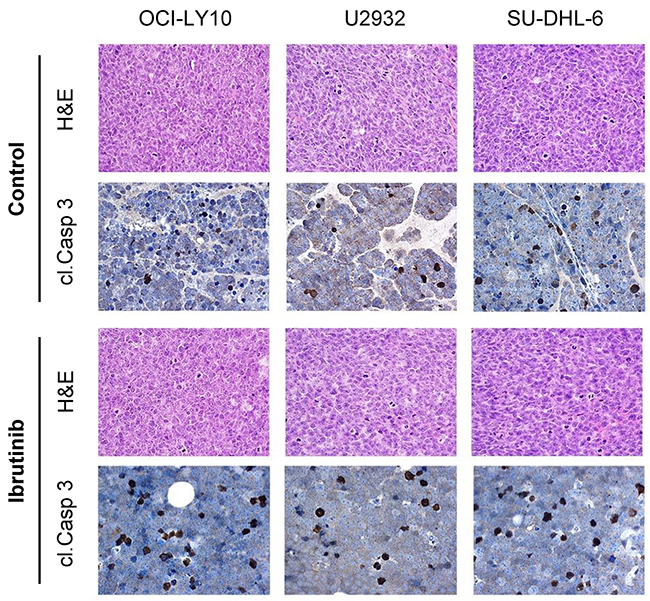
Figure 3: Tumour response to ibrutinib treatment reflects mutational status. Representative H&E stains of tumour xenografts including cleaved caspase-3 (cl. Casp 3) are shown for each cell line (OCI-LY10, U2932, SU-DHL-6) in the untreated and ibrutinib treated state (magnification 200x).
To further explore early treatment response to idelalisib in vivo, the syngeneic transplantation model Eμ-Myc/BCRHEL/sHEL representing tonic BCR signaling with PI3K activation was used [22]. Mice were imaged with 18F-FDG-PET before and after treatment with idelalisib (Figure 4A). As observed for the DLBCL xenografts an early treatment response was reported with a significant reduction in splenic TBR at 48 hours post therapy (Figure 4B), supporting that the PI3K inhibitor idelalisib can be an effective treatment in the treatment of tonic B-cell receptor signaling.
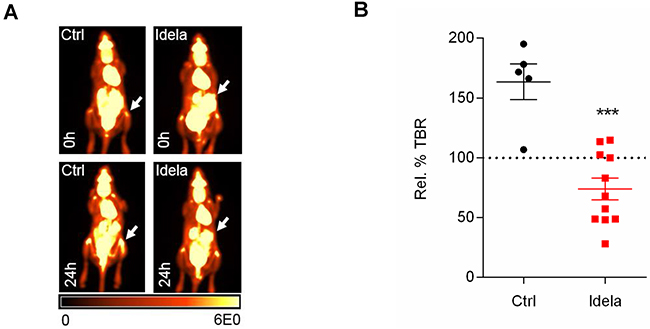
Figure 4: Tonic BCR signaling in lymphoma. (A) Idelalisib treatment in Eμ-Myc/BCRHEL/sHEL syngeneic transplantation model demonstrates early splenic treatment response in vivo. Representative 18F-FDG-PET images of mice pre and 48 hours post treatment. Values reported as percentage injected dose per gram body weight (%ID/g). (B) Percentage relative TBRs of Eμ-Myc/BCRHEL/sHEL spleens following idelalisib treatment (n = 5-11).
MALDI IMS proteomic analysis of BCR inhibition response
Upon establishing that 18F-FDG-PET imaging can be used to monitor BCR therapy response at very early time points and noting the key role of BCR signaling in DLBCL survival, we postulated that a distinctive protein profile may manifest in tumours following treatment with different BCR pathway inhibitors. Using a MALDI IMS proteomics approach we profiled the tumours treated with ibrutinib and idelalisib in vivo. As the mutational status of the OCI-LY10 cell line lends itself to response to both inhibitors we performed proteomic analysis on xenografts derived from these cells.
Upon treatment with ibrutinib an overall deregulation of proteins could be observed between treated and untreated xenografts (Figure 5A). The same proteomic approach was used following idelalisib treatment and resulted in fewer deregulation events upon treatment (Figure 5B), however alterations in the expression profile of proteins detected in treated compared to untreated tumours were still observed. Thus, protein clustering using MALDI IMS reflects effective treatment in DLBCL xenografts in vivo.
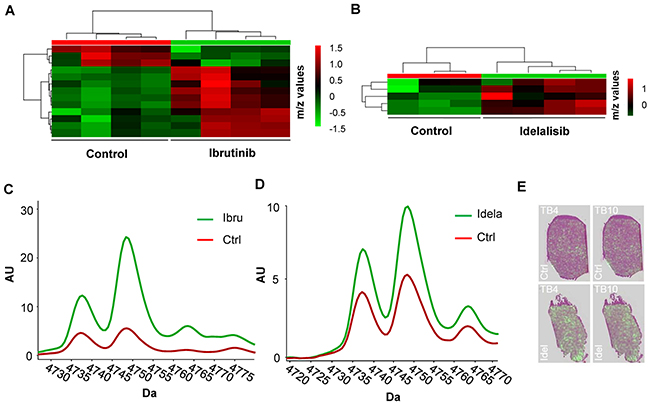
Figure 5: MALDI proteomic analysis of OCI-LY10 xenografts treated with ibrutinib and idelalisib. (A) Proteomic heatmap of control versus ibrutinib treated OCI-LY10 tumours displays clustering (n= 4). (B) Proteomic heatmap of control versus idelalisib treated OCI-LY10 tumours displays clustering (n= 3-4). (C) Profiles of thymosin beta-4 and thymosin beta-10 levels in OCI-LY10 xenografts treated with ibrutinib postulated peak identities; m/z 4738 = Thymosin beta-10, m/z 4749 = Thymosin beta-4 (-2 AA’s, cleaved to seraspenide), n = 6. (D) Profiles of thymosin beta-4 and thymosin beta-10 levels in OCI-LY10 xenografts treated with idelalisib postulated peak identities; m/z 4738 = Thymosin beta-10, m/z 4749 = Thymosin beta-4 (-2 AA’s, cleaved to seraspenide), n = 6. (E) Representative overlays of distribution of thymosin beta-4 and thymosin beta-10 proteins on H & E sections in control and idelalisib treated OCI-LY10 xenografts.
Identification of putative protein candidates from the MALDI data was performed using an approach whereby the significantly deregulated m/z ratios reported were matched to m/z values from published validated datasets [23], resulting in the list of putatively deregulated proteins reported in Table 1. The results of the proteomic analysis of ibrutinib treated OCI-LY10 tumours demonstrated a significant increase in the levels of a number of proteins inlcuding dermicidin, a pro-survival factor previously linked to an oncogenic function in breast cancer [24], as well a reduction in NEDD8, a small molecule akin to ubiquitin and required in the process of neddylation [25]. Deregulated proteins common to both ibrutinib and idelalisib treatments were members of the thymosin protein family. Thymosin beta-4 (- 2 AA’s, cleaved to seraspenide) and thymosin beta-10, previously implicated as a prognostic marker [26] and determinant of drug sensitivity respectively [27], were found to be significantly upregulated in treated OCI-LY10 xenografts (Figure 5C and 5D). A major advantage of MALDI IMS in situ proteomics is the ability to visualize protein distribution in the tissue. Investigation of the proteins thymosin beta-4 and thymosin beta-10 in idelalisib treated OCI-LY10 xenografts demonstrated an increase in the amount of these candidates in the tissue compared to controls (Figure 5E). The overall pattern of distribution within the tumors appeared homogeneous between control and treated samples.
Table 1: MALDI IMS proteomics of OCI-LY10 xenografts treated with idelalisib or ibrutinib
Idelalisib |
||||
|---|---|---|---|---|
m/z |
Fold change |
Protein |
Uniprot ID |
Pubmed ID |
4749,71 |
1,57 |
Thymosin beta-4 [Cleaved to Seraspenide] |
P62328 |
21549228 |
4738,51 |
1,42 |
Thymosin beta-10 |
P63313 |
21549228 |
4965,71 |
1,41 |
Thymosin beta-4 [Cleaved to Seraspenide] |
P20065 |
15604278 |
Ibrutinib |
||||
|---|---|---|---|---|
m/z |
Fold change |
Protein |
Uniprot ID |
Pubmed ID |
4748,85 |
3,59 |
Thymosin beta-4 [Cleaved to Seraspenide] |
P62328 |
21549228 |
4737,87 |
2,27 |
Thymosin beta-10 |
P63313 |
21549228 |
2792,49 |
1,71 |
Serum Albumin |
P02768 |
22761793 |
6649,58 |
1,55 |
Cytochrome c oxidase subunit 2 |
P00403 |
22994484 |
9263,55 |
1,51 |
Dermcidin [Cleaved to DCD-1] |
P81605 |
21549228 |
8604,43 |
0,77 |
NEDD8 |
Q15843 |
21549228 |
8566,42 |
0,68 |
Ubiquitin-40S ribosomal protein S27a |
P62979 |
22994484 |
Protein candidates identified by MALDI IMS as significantly deregulated in OCI-LY10 xenografts following idelalisib or ibrutinib treatment compared to untreated controls (p <0.05).
DISCUSSION
The potential for early therapy response assessment by combining mutational status with emerging molecular imaging techniques is of great clinical value. Due to the common relapse of DLBCL development of new treatment regimens and improved understanding of their complex cellular effects is required. Herein we have demonstrated that molecular imaging can contribute to very early response assessment to small molecule therapies targeting BCR signaling. Furthermore we demonstrate that molecular imaging allows identification of specific proteomic changes that occur in the lymphoma proteome in response to ibrutinib and idelalisib treatment. The BTK inhibitor ibrutinib has been approved for lymphomas such as CLL [28], mantle cell lymphoma [29] and Waldenström’s disease [30, 31] that critically depend on constitutively activated BCR signaling. Results from a phase 2 study of ibrutinib have furthermore revealed promising results in a subgroup of ABC DLBCL, where the mutational status of pathways involved in NF-κB activation may be useful for predicting response to BTK inhibition. However, as outlined by these data, sequencing analysis alone may not be sufficient to adequately predict response to ibrutinib [8]. It is furthermore established that resistance to ibrutinib can occur, for example in the case of upregulation of the catalytic subunit CD79B, leading to over activation of AKT/MAPK signaling [32]. Activation of CARMA1 has been shown to regulate key signaling processes in ABC DLBCL, including NF-κB, β-catenin and AP-1 complex activation [33, 34]. Accordingly, mutations in the CARMA1 component of the BCR pathway can lead to ibrutinib resistance in ABC DLBCL [35] requiring the application of combination therapies to overcome resistance to treatment [36]. Determination of such mechanisms conferring therapeutic resistance highlights the importance in better defining mutational subtypes to predict patient response and consequently tailor therapy. Alternatively idelalisib, a specific PI3Kδ inhibitor, has also been approved for use in CLL [37] in combination with rituximab and also as a monotherapy in the treatment of both relapsed follicular lymphoma and small lymphocytic lymphoma [11]. To date however, there is no published data regarding treatment of DLBCL with idelalisib.
The established and routine clinical imaging modality18F-FDG-PET and additionally 18F-FLT-PET are able to provide both response monitoring and survival prediction in vivo [38, 39] and were used herein to assess the response of DLBCL xenografts to ibrutinib or idelalisib treatment. As anticipated based on mutation status TBRs of OCI-LY10 xenografts demonstrated significant reductions in response to both BTK and PI3K inhibition. We however observed somewhat discordantly with the mutation status of U2932 xenografts a significant reduction in TBR in response to both inhibitors, therefore it must be considered that additional factors beyond BCR signaling may also play a role in therapy response. We furthermore discovered that SU-DHL-6 cells, serving as an alternative GCB DLBCL cell line, exhibited a change in cell viability upon idelalisib treatment, suggesting that in fact GCB DLBCL may have partial reliance upon BCR signaling. Despite the general consensus that BCR signaling is predominantly a requirement for ABC DLBCL as opposed to GCB DLBCL, GCB cell lines have been shown to rely upon spleen tyrosine kinase (SYK) [40] and cell lines including SU-DHL-16 have previously exhibited significant reductions in cell viability upon ibrutinib treatment [41]. Together these results therefore confirm the utility and importance of mutation status to anticipate therapy response and also outline a potential role of BCR signaling in GCB DLBCL. Additionally, the predictive value added by 18F-FDG-PET in this study highlights the advantage of combining a non-invasive established imaging modality with mutation status to predict tumor response very early after treatment initiation.
In addition to the predictive value of early 18F-FDG-PET imaging we also postulated that a distinct proteomic profile would manifest in tumors following either BTK or PI3K inhibition. Elucidating the protein profiles of DLBCL subtypes is of significant value with the potential for biomarker discovery, complimenting current methods such as the International Prognostic Index (IPI) that assigns risk but is unable to predict the relapse or refractory nature of DLBCL. Previous DLBCL proteomic studies have used either fixed or frozen tissue samples [42, 43] or employed serum and plasma profiling methods [44-47]. In order to conduct a proteomic investigation of BCR inhibition we have used the in situ imaging technique MALDI IMS as an additional imaging method to identify deregulated proteins. Indeed, MALDI IMS has been used to identify biomarker panels, for example in the case of prediction of Paclitaxel response in breast cancer [48] and also in the context of lymphoma to identify biomarkers allowing the distinction of Hodgkin’s cells from those of lymphadenitis [49]. Herein, upon ibrutinib treatment, NEDD8 expression was reduced in OCI-LY10 xenografts. NEDD8 has previously been implicated in DLBCL whereby inhibition of NEDD8-activating enzyme with the inhibitor MLN4924 induced an apoptotic response in preclinical models of ABC and GCB DLBCL [25]. Furthermore, in CLL, treatment utilizing MLN4924 combined with either idelalisib or ibrutinib led to increased cell death, whereas treatment with idelalisib or ibrutinib alone was unable to exert an effect upon cells [50]. Indeed, to overcome the resistance to ibrutinib treatment reported in clinical trials [8] combination therapies have been shown to exert complimentary effects resulting in apoptosis [51, 52]. The known link between the targets identified with DLBCL in the literature confirms that the proteins identified in the MALDI IMS screen are indeed relevant to BCR pathway inhibition and may present novel options for combination therapies and pathway targeting. Proteins that were deregulated in OCI-LY10 xenografts common to both ibrutinib and idelalisib treatment included thymosin beta-4 and thymosin beta-10 that have been established as mediating a variety of cellular processes including angiogenesis [53], inflammation [54], apoptosis [55] and carcinogenesis [56]. The presence of these markers in the context of BCR function is unclear, however they have been shown to have involvement in NF-κB signaling [57] and consequently potentially represent novel molecules of interest in BCR signaling or DLBCL therapy response.
Herein we have demonstrated that changes in the proteomic profile of lymphoma xenografts treated with the BCR pathway inhibitors ibrutinib and idelalisib can be identified using the in situ mass spectrometry technique MALDI IMS. We have also demonstrated using PET imaging that a very early treatment response to both BTK and PI3K inhibition can be measured in vivo, not only in DLBCL xenograft models, but also in a syngeneic Eμ-Myc/BCRHEL/sHEL model. We propose that in addition to the indication that mutational status of critical pathogenic pathways provides, that molecular imaging techniques including 18F-FDG-PET and MALDI IMS can be used to aid prediction and characterization of therapy response in vivo very early upon treatment initiation.
MATERIALS AND METHODS
Cell lines
The following cell lines were used: OCI-LY10 (ABC DLBCL), U2932 (ABC DLBCL), SU-DHL-6 (GCB DLBCL) and Eμ-Myc/BCRHEL/sHEL cells [22] were obtained from DMSZ or ATCC. U2932 and SU-DHL-6 were cultured in RPMI 1640 medium containing 10% fetal bovine serum and OCI-LY10 in IMDM with 20% human serum. Eμ-Myc/BCRHEL/sHEL cells were grown in RPMI 1640 medium containing 20% fetal bovine serum [22].
Mice and tumour xenograft experiments
Animal studies were performed in agreement with the Guide for Care and Use of Laboratory Animals published by the US National Institutes of Health (NIH Publication No. 85-23, revised 1996), in compliance with the German law on the protection of animals, and with approval of the responsible regional authorities (Regierung von Oberbayern). 6-8 week old female CB-17 SCID, NOD SCID or C57BL/6 were obtained from Charles River Laboratories. For induction of xenograft tumours 10 × 106 U2932 and OCI-LY10 or 3 × 10⁶ SU-DHL-6 cells suspended in sterile PBS were injected subcutaneously into the left and right shoulder region. The Eμ-Myc/BCRHEL/sHEL cell line [22] was injected into sub lethally irradiated C57BL/6 mice via tail vein injection.
Tumour volume and therapeutic regimens
Lymphoma bearing animals were treated daily with idelalisib (3mg/kg p.o.), ibrutinib (25mg/kg p.o.) or carrier (PBS p.o.). Treatment was performed when the xenotransplants reached a size of approximately 500mm3.
Immunohistochemistry
Tumour xenografts were removed, fixed in formalin and embedded in paraffin. For immunohistochemistry 2-μm sections were deparaffinized and antigen retrieval was performed by pressure cooking in citrate buffer (pH 6) for 7 minutes. Antibody detection of cleaved caspase-3 (Cell Signalling, #9664) was performed using the Dako REAL detection kit (Dako, Glostrup, Denmark) according to the manufacturer’s protocol.
MTT assay
MTT assays were performed according to manufacturer’s instructions (Promega). Briefly, 104 cells per well (96-well plate) were incubated at 37°C with different concentrations of inhibitors for 48hr. 20μl of MTT dilution (3-(4,5-dimethylthiazol-2-yl)-2,5-diphenyltetrazoliumbromide in PBS) was added per well and cells were incubated for 90 minutes. Absorbance was measured at 490nm using a BioTek ELx800™ Series Universal Microplate Reader (BioTek, VT, USA).
Flow cytometry for cell cycle analysis
Lymphoma cells were incubated with inhibitors at 37°C. After 48 hours cells were harvested and stored in 70% ethanol at −20°C. On the day of analysis cells were resuspended in PBS. After RNA digestion by ribonuclease A (Sigma-Aldrich 95%), propidium iodide (Sigma-Aldrich) was added in a 50ng/ml dilution. Following incubation for 30 minutes at 37°C cells were analyzed by flow cytometry using a Cyan LXTM flow cytometer (DakoCytomation, CO, USA).
Cell growth analysis
For growth analysis cells were seeded at 0.5 × 10⁶ cells/ml in 6-well plates and ibrutinib or idelalisib were applied at the doses indicated. Each day the cell concentration was re-adjusted to the original seeding density. Fold growth was calculated as the cumulative growth factor during the course of the experiment.
PET imaging studies in mice
2-deoxy-2-[18F]fluoro-D-glucose (18F-FDG) and 3’-deoxy-3’[18F]-fluorothymidine (18F-FLT) was synthesized by the Radiopharmacy Unit, TU München. Imaging was performed using a micro PET system (Inveon, SIEMENS Preclinical Solutions, TN, USA), 18F-FDG or 18F-FLT was administered via tail vein injection at an activity dose of 5-10MBq per mouse. The accumulation of radiotracer in the tumour was allowed for 60 minutes. Mice were then imaged for a 15 minute static acquisition.
PET data analysis
Analysis was performed using the Inveon Research Workplace (Siemens Healthineers, USA) to semi-quantitatively assess the accumulation of tracer in the tumour. To determine tumour-background ratios (TBRs) three dimensional regions of interest (ROIs) were drawn manually around xenograft tumours and a threshold algorithm (50% maximum intensity – minimum intensity) was applied to each ROI to obtain an intensity value from the area with the highest tumour activity. Background activity was determined by establishing two identically sized 3D ROIs in the spinal muscles below the kidneys.
MALDI IMS
Xenografts were excised, immediately snap frozen and stored at −80°C. Indium tin oxide glass slides (Bruker Daltonik, 237001) were coated with 20μl 1:1 Poly-Lysine (Sigma, P8920) solution in dH20 with 1μl Nonidet P-40 (Sigma, 74385). Tissue sections were cut at a thickness of 12μm in a pre-cooled cryotome taking extreme care not to thaw samples.
For MSI of tumour cryosections, tissue sections were dried and scanned using a flatbed scanner to acquire digital images for coregistration. Subsequently, the slices were coated with matrix composed of 7 g/l CHCA (Sigma-Aldrich, Taufkirchen, Germany) in 70% methanol, 0.2% trifluoroacetic acid (TFA, Applied Biosystems, Darmstadt, Germany) using an ImagePrep spray device (Bruker Daltonik GmbH, Bremen, Germany) according to the instructions of the manufacturer.
MALDI MSI measurements were carried out on an Ultraflex III mass spectrometer (Bruker Daltonik GmbH, Bremen, Germany) at a spatial resolution of 70 μm in positive reflectron mode with a sampling rate of 1.0 GS/s. For each position measured, a total of 200 laser shots were accumulated. For data generation, the software packages FlexImaging 3.0 and FlexControl 3.0 (Bruker Daltonik GmbH, Bremen, Germany) were used.
In order to assign protein identities to the significantly deregulated candidates identified by MALDI proteomics deregulated m/z ratios reported were matched to m/z values from published validated datasets [23]. Heatmaps were generated using Metaboanalyst 3.0 using the following settings: mass tolerance 0.025, relative time tolerance 30, log transformation, distance measure: Euclidian, clustering algorithm: Ward.
Statistical analysis
All statistical tests were performed using GraphPad Prism (GraphPad Software, CA, USA). P-values < 0.05 were considered statistically significant. Quantitative values were expressed as mean ± standard deviation (SD).
Abbreviations
AA – Amino acid
ABC – Activated B-cell type
BCR – B-cell receptor
BTK – Bruton’s tyrosine kinase
CLL – Chronic lymphocytic leukaemia
DLBCL – Diffuse large B-cell lymphoma
GCB – Germinal center B-cell
H&E – Hematoxylin and Eosin
IMS – Imaging mass spectrometry
FDG - 2-deoxy-2-[18F]fluoro-D-glucose
FLT - 3’-deoxy-3’[18F]-fluorothymidine
MALDI – Matrix assisted laser desorption ionization
MTT - 3-(4,5-dimethylthiazol-2-yl)-2,5-diphenyltetrazoliumbromide
m/z – mass-to-charge ratio
NHL – Non-Hodgkin lymphoma
PET – Positron emission tomography
PBS – Phosphate buffered saline
p.o. – Per oral
PTM – Post-translational modification
ROI - Region of interest
SD – Standard deviation
TBR – Tumour-to-background ratio
Author contributions
LJ and SH wrote the manuscript. LJ, SH, JS, EH and ZL performed experiments. LJ, SH and ZL performed analysis. KH and AW provided use and support of the MALDI IMS and YR support and use of the BCRHEL cell line. MS and UK supervised the project.
ACKNOWLEDGMENTS
We would like to kindly thank Sybille Reder and her team for performing PET imaging at the Nuclear Medicine Department, Technische Universität München.
CONFLICTS OF INTEREST
The authors declare no conflicts of interest.
FUNDING
UK, MS and AW received support from the Deutsche Forschungsgemeinschaft (DFG, SFB824). This work received support from the German Cancer Consortium (DKTK).
REFERENCES
1. Lenz G, Staudt LM. Aggressive lymphomas. N Engl J Med. 2010; 362:1417–29. https://doi.org/10.1056/NEJMra0807082.
2. Young RM, Shaffer AL 3rd, Phelan JD, Staudt LM. B-cell receptor signaling in diffuse large B-cell lymphoma. Semin Hematol. 2015; 52:77–85. https://doi.org/10.1053/j.seminhematol.2015.01.008.
3. Davis RE, Ngo VN, Lenz G, Tolar P, Young RM, Romesser PB, Kohlhammer H, Lamy L, Zhao H, Yang Y, Xu W, Shaffer AL, Wright G, et al. Chronic active B-cell-receptor signalling in diffuse large B-cell lymphoma. Nature. 2010; 463:88–92. https://doi.org/10.1038/nature08638.
4. Alizadeh AA, Eisen MB, Davis RE, Ma C, Lossos IS, Rosenwald A, Boldrick JC, Sabet H, Tran T, Yu X, Powell JI, Yang L, Marti GE, et al. Distinct types of diffuse large B-cell lymphoma identified by gene expression profiling. Nature. 2000; 403:503–11. https://doi.org/10.1038/35000501.
5. Davis RE, Brown KD, Siebenlist U, Staudt LM. Constitutive nuclear factor kappaB activity is required for survival of activated B cell-like diffuse large B cell lymphoma cells. J Exp Med. 2001; 194:1861–74. https://doi.org/10.1084/jem.194.12.1861.
6. Ngo VN, Young RM, Schmitz R, Jhavar S, Xiao W, Lim KH, Kohlhammer H, Xu W, Yang Y, Zhao H, Shaffer AL, Romesser P, Wright G, et al. Oncogenically active MYD88 mutations in human lymphoma. Nature. 2011; 470:115–19. https://doi.org/10.1038/nature09671.
7. Young RM, Staudt LM. Targeting pathological B cell receptor signalling in lymphoid malignancies. Nat Rev Drug Discov. 2013; 12:229–43. https://doi.org/10.1038/nrd3937.
8. Wilson WH, Young RM, Schmitz R, Yang Y, Pittaluga S, Wright G, Lih CJ, Williams PM, Shaffer AL, Gerecitano J, de Vos S, Goy A, Kenkre VP, et al. Targeting B cell receptor signaling with ibrutinib in diffuse large B cell lymphoma. Nat Med. 2015; 21:922–26. https://doi.org/10.1038/nm.3884.
9. Brown JR, Byrd JC, Coutre SE, Benson DM, Flinn IW, Wagner-Johnston ND, Spurgeon SE, Kahl BS, Bello C, Webb HK, Johnson DM, Peterman S, Li D, et al. Idelalisib, an inhibitor of phosphatidylinositol 3-kinase p110δ, for relapsed/refractory chronic lymphocytic leukemia. Blood. 2014; 123:3390–97. https://doi.org/10.1182/blood-2013-11-535047.
10. O’Brien SM, Lamanna N, Kipps TJ, Flinn I, Zelenetz AD, Burger JA, Keating M, Mitra S, Holes L, Yu AS, Johnson DM, Miller LL, Kim Y, et al. A phase 2 study of idelalisib plus rituximab in treatment-naïve older patients with chronic lymphocytic leukemia. Blood. 2015; 126:2686–94. https://doi.org/10.1182/blood-2015-03-630947.
11. Gopal AK, Kahl BS, de Vos S, Wagner-Johnston ND, Schuster SJ, Jurczak WJ, Flinn IW, Flowers CR, Martin P, Viardot A, Blum KA, Goy AH, Davies AJ, et al. PI3Kδ inhibition by idelalisib in patients with relapsed indolent lymphoma. N Engl J Med. 2014; 370:1008–18. https://doi.org/10.1056/NEJMoa1314583.
12. Dunleavy K, Grant C, Wilson WH. Using biologic predictive factors to direct therapy of diffuse large B-cell lymphoma. Ther Adv Hematol. 2013; 4:43–57. https://doi.org/10.1177/2040620712464508.
13. Xu-Monette ZY, Wu L, Visco C, Tai YC, Tzankov A, Liu WM, Montes-Moreno S, Dybkaer K, Chiu A, Orazi A, Zu Y, Bhagat G, Richards KL, et al. Mutational profile and prognostic significance of TP53 in diffuse large B-cell lymphoma patients treated with R-CHOP: report from an International DLBCL Rituximab-CHOP Consortium Program Study. Blood. 2012; 120:3986–96. https://doi.org/10.1182/blood-2012-05-433334.
14. Deeb SJ, D’Souza RC, Cox J, Schmidt-Supprian M, Mann M. Super-SILAC allows classification of diffuse large B-cell lymphoma subtypes by their protein expression profiles. Mol Cell Proteomics. 2012; 11:77–89. https://doi.org/10.1074/mcp.M111.015362.
15. Dörr JR, Yu Y, Milanovic M, Beuster G, Zasada C, Däbritz JH, Lisec J, Lenze D, Gerhardt A, Schleicher K, Kratzat S, Purfürst B, Walenta S, et al. Synthetic lethal metabolic targeting of cellular senescence in cancer therapy. Nature. 2013; 501:421–25. https://doi.org/10.1038/nature12437.
16. Hoellein A, Fallahi M, Schoeffmann S, Steidle S, Schaub FX, Rudelius M, Laitinen I, Nilsson L, Goga A, Peschel C, Nilsson JA, Cleveland JL, Keller U. Myc-induced SUMOylation is a therapeutic vulnerability for B-cell lymphoma. Blood. 2014; 124:2081–90. https://doi.org/10.1182/blood-2014-06-584524.
17. Walch A, Rauser S, Deininger SO, Höfler H. MALDI imaging mass spectrometry for direct tissue analysis: a new frontier for molecular histology. Histochem Cell Biol. 2008; 130:421–34. https://doi.org/10.1007/s00418-008-0469-9.
18. Rauser S, Marquardt C, Balluff B, Deininger SO, Albers C, Belau E, Hartmer R, Suckau D, Specht K, Ebert MP, Schmitt M, Aubele M, Höfler H, Walch A. Classification of HER2 receptor status in breast cancer tissues by MALDI imaging mass spectrometry. J Proteome Res. 2010; 9:1854–63. https://doi.org/10.1021/pr901008d.
19. Hardesty WM, Kelley MC, Mi D, Low RL, Caprioli RM. Protein signatures for survival and recurrence in metastatic melanoma. J Proteomics. 2011; 74:1002–14. https://doi.org/10.1016/j.jprot.2011.04.013.
20. Huber K, Aichler M, Sun N, Buck A, Li Z, Fernandez IE, Hauck SM, Zitzelsberger H, Eickelberg O, Janssen KP, Keller U, Walch A. A rapid ex vivo tissue model for optimising drug detection and ionisation in MALDI imaging studies. Histochem Cell Biol. 2014; 142:361–71. https://doi.org/10.1007/s00418-014-1223-0.
21. Huber K, Feuchtinger A, Borgmann DM, Li Z, Aichler M, Hauck SM, Zitzelsberger H, Schwaiger M, Keller U, Walch A. Novel approach of MALDI drug imaging, immunohistochemistry, and digital image analysis for drug distribution studies in tissues. Anal Chem. 2014; 86:10568–75. https://doi.org/10.1021/ac502177y.
22. Refaeli Y, Young RM, Turner BC, Duda J, Field KA, Bishop JM. The B cell antigen receptor and overexpression of MYC can cooperate in the genesis of B cell lymphomas. PLoS Biol. 2008; 6:e152. https://doi.org/10.1371/journal.pbio.0060152.
23. Maier SK, Hahne H, Gholami AM, Balluff B, Meding S, Schoene C, Walch AK, Kuster B. Comprehensive identification of proteins from MALDI imaging. Mol Cell Proteomics. 2013; 12:2901–10. https://doi.org/10.1074/mcp.M113.027599.
24. Bancovik J, Moreira DF, Carrasco D, Yao J, Porter D, Moura R, Camargo A, Fontes-Oliveira CC, Malpartida MG, Carambula S, Vannier E, Strauss BE, Wakamatsu A, et al. Dermcidin exerts its oncogenic effects in breast cancer via modulation of ERBB signaling. BMC Cancer. 2015; 15:70. https://doi.org/10.1186/s12885-015-1022-6.
25. Milhollen MA, Traore T, Adams-Duffy J, Thomas MP, Berger AJ, Dang L, Dick LR, Garnsey JJ, Koenig E, Langston SP, Manfredi M, Narayanan U, Rolfe M, et al. MLN4924, a NEDD8-activating enzyme inhibitor, is active in diffuse large B-cell lymphoma models: rationale for treatment of NF-kappaB-dependent lymphoma. Blood. 2010; 116:1515–23. https://doi.org/10.1182/blood-2010-03-272567.
26. Gemoll T, Strohkamp S, Schillo K, Thorns C, Habermann JK. MALDI-imaging reveals thymosin beta-4 as an independent prognostic marker for colorectal cancer. Oncotarget. 2015; 6:43869–80. https://doi.org/10.18632/oncotarget.6103.
27. Cheung BB, Tan O, Koach J, Liu B, Shum MS, Carter DR, Sutton S, Po’uha ST, Chesler L, Haber M, Norris MD, Kavallaris M, Liu T, et al. Thymosin-β4 is a determinant of drug sensitivity for Fenretinide and Vorinostat combination therapy in neuroblastoma. Mol Oncol. 2015; 9:1484–500. https://doi.org/10.1016/j.molonc.2015.04.005.
28. Advani RH, Buggy JJ, Sharman JP, Smith SM, Boyd TE, Grant B, Kolibaba KS, Furman RR, Rodriguez S, Chang BY, Sukbuntherng J, Izumi R, Hamdy A, et al. Bruton tyrosine kinase inhibitor ibrutinib (PCI-32765) has significant activity in patients with relapsed/refractory B-cell malignancies. J Clin Oncol. 2013; 31:88–94. https://doi.org/10.1200/JCO.2012.42.7906.
29. Rahal R, Frick M, Romero R, Korn JM, Kridel R, Chan FC, Meissner B, Bhang HE, Ruddy D, Kauffmann A, Farsidjani A, Derti A, Rakiec D, et al. Pharmacological and genomic profiling identifies NF-κB-targeted treatment strategies for mantle cell lymphoma. Nat Med. 2014; 20:87–92. https://doi.org/10.1038/nm.3435.
30. Treon SP, Tripsas CK, Meid K, Warren D, Varma G, Green R, Argyropoulos KV, Yang G, Cao Y, Xu L, Patterson CJ, Rodig S, Zehnder JL, et al. Ibrutinib in previously treated Waldenström’s macroglobulinemia. N Engl J Med. 2015; 372:1430–40. https://doi.org/10.1056/NEJMoa1501548.
31. Treon SP, Xu L, Hunter Z. MYD88 Mutations and Response to Ibrutinib in Waldenström’s Macroglobulinemia. N Engl J Med. 2015; 373:584–86. https://doi.org/10.1056/NEJMc1506192.
32. Kim JH, Kim WS, Ryu K, Kim SJ, Park C. CD79B limits response of diffuse large B cell lymphoma to ibrutinib. Leuk Lymphoma. 2016; 57:1413–22. https://doi.org/10.3109/10428194.2015.1113276.
33. Bognar MK, Vincendeau M, Erdmann T, Seeholzer T, Grau M, Linnemann JR, Ruland J, Scheel CH, Lenz P, Ott G, Lenz G, Hauck SM, Krappmann D. Oncogenic CARMA1 couples NF-κB and β-catenin signaling in diffuse large B-cell lymphomas. Oncogene. 2016; 35:4269–81. https://doi.org/10.1038/onc.2015.493.
34. Juilland M, Gonzalez M, Erdmann T, Banz Y, Jevnikar Z, Hailfinger S, Tzankov A, Grau M, Lenz G, Novak U, Thome M. CARMA1- and MyD88-dependent activation of Jun/ATF-type AP-1 complexes is a hallmark of ABC diffuse large B-cell lymphomas. Blood. 2016; 127:1780–89. https://doi.org/10.1182/blood-2015-07-655647.
35. Knies N, Alankus B, Weilemann A, Tzankov A, Brunner K, Ruff T, Kremer M, Keller UB, Lenz G, Ruland J. Lymphomagenic CARD11/BCL10/MALT1 signaling drives malignant B-cell proliferation via cooperative NF-κB and JNK activation. Proc Natl Acad Sci USA. 2015; 112:E7230–38. https://doi.org/10.1073/pnas.1507459112.
36. Nagel D, Bognar M, Eitelhuber AC, Kutzner K, Vincendeau M, Krappmann D. Combinatorial BTK and MALT1 inhibition augments killing of CD79 mutant diffuse large B cell lymphoma. Oncotarget. 2015; 6:42232–42. https://doi.org/10.18632/oncotarget.6273.
37. Furman RR, Sharman JP, Coutre SE, Cheson BD, Pagel JM, Hillmen P, Barrientos JC, Zelenetz AD, Kipps TJ, Flinn I, Ghia P, Eradat H, Ervin T, et al. Idelalisib and rituximab in relapsed chronic lymphocytic leukemia. N Engl J Med. 2014; 370:997–1007. https://doi.org/10.1056/NEJMoa1315226.
38. Li Z, Herrmann K, Pirsig S, Philipp-Abbrederis K, Henninger M, Aichler M, Feuchtinger A, Walch A, Beer AJ, Ringshausen I, Pomykala KL, Scheidhauer K, Schwaiger M, et al. Molecular imaging for early prediction of response to Sorafenib treatment in sarcoma. Am J Nucl Med Mol Imaging. 2013; 4:70–79.
39. Graf N, Li Z, Herrmann K, Weh D, Aichler M, Slawska J, Walch A, Peschel C, Schwaiger M, Buck AK, Dechow T, Keller U. Positron emission tomographic monitoring of dual phosphatidylinositol-3-kinase and mTOR inhibition in anaplastic large cell lymphoma. Onco Targets Ther. 2014; 7:789–98.
40. Chen L, Monti S, Juszczynski P, Daley J, Chen W, Witzig TE, Habermann TM, Kutok JL, Shipp MA. SYK-dependent tonic B-cell receptor signaling is a rational treatment target in diffuse large B-cell lymphoma. Blood. 2008; 111:2230–37. https://doi.org/10.1182/blood-2007-07-100115.
41. Zheng X, Ding N, Song Y, Feng L, Zhu J. Different sensitivity of germinal center B cell-like diffuse large B cell lymphoma cells towards ibrutinib treatment. Cancer Cell Int. 2014; 14:32. https://doi.org/10.1186/1475-2867-14-32.
42. Deeb SJ, Tyanova S, Hummel M, Schmidt-Supprian M, Cox J, Mann M. Machine Learning-based Classification of Diffuse Large B-cell Lymphoma Patients by Their Protein Expression Profiles. Mol Cell Proteomics. 2015; 14:2947–60. https://doi.org/10.1074/mcp.M115.050245.
43. Rüetschi U, Stenson M, Hasselblom S, Nilsson-Ehle H, Hansson U, Fagman H, Andersson PO. SILAC-Based Quantitative Proteomic Analysis of Diffuse Large B-Cell Lymphoma Patients. Int J Proteomics. 2015; 2015:841769. https://doi.org/10.1155/2015/841769.
44. Zhang X, Wang B, Zhang XS, Li ZM, Guan ZZ, Jiang WQ. Serum diagnosis of diffuse large B-cell lymphomas and further identification of response to therapy using SELDI-TOF-MS and tree analysis patterning. BMC Cancer. 2007; 7:235. https://doi.org/10.1186/1471-2407-7-235.
45. Xu W, Hu Y, He X, Li J, Pan T, Liu H, Wu X, He H, Ge W, Yu J, Wei Q, Zheng S, Zhang S, Chen Y. Serum profiling by mass spectrometry combined with bioinformatics for the biomarkers discovery in diffuse large B-cell lymphoma. Tumour Biol. 2015; 36:2193–99. https://doi.org/10.1007/s13277-014-2830-z.
46. Pauly F, Smedby KE, Jerkeman M, Hjalgrim H, Ohlsson M, Rosenquist R, Borrebaeck CA, Wingren C. Identification of B-cell lymphoma subsets by plasma protein profiling using recombinant antibody microarrays. Leuk Res. 2014; 38:682–90. https://doi.org/10.1016/j.leukres.2014.03.010.
47. Schröder C, Srinivasan H, Sill M, Linseisen J, Fellenberg K, Becker N, Nieters A, Hoheisel JD. Plasma protein analysis of patients with different B-cell lymphomas using high-content antibody microarrays. Proteomics Clin Appl. 2013; 7:802–12. https://doi.org/10.1002/prca.201300048.
48. Bauer JA, Chakravarthy AB, Rosenbluth JM, Mi D, Seeley EH, De Matos Granja-Ingram N, Olivares MG, Kelley MC, Mayer IA, Meszoely IM, Means-Powell JA, Johnson KN, Tsai CJ, et al. Identification of markers of taxane sensitivity using proteomic and genomic analyses of breast tumors from patients receiving neoadjuvant paclitaxel and radiation. Clin Cancer Res. 2010; 16:681–90. https://doi.org/10.1158/1078-0432.CCR-09-1091.
49. Schwamborn K, Krieg RC, Jirak P, Ott G, Knüchel R, Rosenwald A, Wellmann A. Application of MALDI imaging for the diagnosis of classical Hodgkin lymphoma. J Cancer Res Clin Oncol. 2010; 136:1651–55. https://doi.org/10.1007/s00432-010-0823-x.
50. Godbersen JC, Humphries LA, Danilova OV, Kebbekus PE, Brown JR, Eastman A, Danilov AV. The Nedd8-activating enzyme inhibitor MLN4924 thwarts microenvironment-driven NF-κB activation and induces apoptosis in chronic lymphocytic leukemia B cells. Clin Cancer Res. 2014; 20:1576–89. https://doi.org/10.1158/1078-0432.CCR-13-0987.
51. Ezell SA, Mayo M, Bihani T, Tepsuporn S, Wang S, Passino M, Grosskurth SE, Collins M, Parmentier J, Reimer C, Byth KF. Synergistic induction of apoptosis by combination of BTK and dual mTORC1/2 inhibitors in diffuse large B cell lymphoma. Oncotarget. 2014; 5:4990–5001. https://doi.org/10.18632/oncotarget.2071.
52. Yang Y, Shaffer AL 3rd, Emre NC, Ceribelli M, Zhang M, Wright G, Xiao W, Powell J, Platig J, Kohlhammer H, Young RM, Zhao H, Yang Y, et al. Exploiting synthetic lethality for the therapy of ABC diffuse large B cell lymphoma. Cancer Cell. 2012; 21:723–37. https://doi.org/10.1016/j.ccr.2012.05.024.
53. Cha HJ, Jeong MJ, Kleinman HK. Role of thymosin beta4 in tumor metastasis and angiogenesis. J Natl Cancer Inst. 2003; 95:1674–80. https://doi.org/10.1093/jnci/djg100.
54. Young JD, Lawrence AJ, MacLean AG, Leung BP, McInnes IB, Canas B, Pappin DJ, Stevenson RD. Thymosin beta 4 sulfoxide is an anti-inflammatory agent generated by monocytes in the presence of glucocorticoids. Nat Med. 1999; 5:1424–27. https://doi.org/10.1038/71002.
55. Lee SH, Zhang W, Choi JJ, Cho YS, Oh SH, Kim JW, Hu L, Xu J, Liu J, Lee JH. Overexpression of the thymosin beta-10 gene in human ovarian cancer cells disrupts F-actin stress fiber and leads to apoptosis. Oncogene. 2001; 20:6700–06. https://doi.org/10.1038/sj.onc.1204683.
56. Santelli G, Califano D, Chiappetta G, Vento MT, Bartoli PC, Zullo F, Trapasso F, Viglietto G, Fusco A. Thymosin beta-10 gene overexpression is a general event in human carcinogenesis. Am J Pathol. 1999; 155:799–804. https://doi.org/10.1016/S0002-9440(10)65178-4.
57. Qiu P, Wheater MK, Qiu Y, Sosne G. Thymosin beta4 inhibits TNF-alpha-induced NF-kappaB activation, IL-8 expression, and the sensitizing effects by its partners PINCH-1 and ILK. FASEB J. 2011; 25:1815–26. https://doi.org/10.1096/fj.10-167940.