
INTRODUCTION
The intestinal epithelium is the most important internal barrier against the invasion of pathogenic bacteria [1], and functions as an important part of the first line of defense [2]. In swine production, weaning stress has been demonstrated to be associated with gastrointestinal disorders such as changes in intestinal barrier function and absorption, leading to diarrhea and increased disease susceptibility [3, 4]. In addition, a recent study indicated that weaning can induce oxidative stress [5]. Accordingly, one mechanism linking weaning stress to intestinal disease may be oxidative stress. Oxidative stress refers to the imbalance of oxidation and antioxidation, which leading to accumulation of oxidation intermediates including superoxide ion (O2-), hydroxyl radical (OH) and H2O2 [6]. It causes intestinal disorders possibly via [2, 7, 8] : 1) disrupting the structures of the intestinal barrier, 2) influencing mitosis or apoptosis of intestinal epithelial cells, or 3) distorting the differentiation potential of epithelial cells. Therefore, maintaining a balanced redox status is essential for ensuring intestinal health [9].
Alpha-ketoglutarate (AKG) is a gut nutrient and may be used directly in the intestinal mucosa as an energy resource without elevating the nitrogen load [10, 11]. Dietary supplementation of 1% AKG has been found to alleviate mucosal damage and improve the absorptive function of the small intestine in the endotoxin-challenged piglets [12]. In addition, AKG is an intermediate in the tricarboxylic acid (TCA) cycle, and can be transformed to succinyl-CoA by AKG dehydrogenase. AKG dehydrogenase is sensitive to ROS, and inhibition of this enzyme induced by oxidative stress may be malignant to the normal metabolism of mitochondria [13]. In addition, AKG is a natural ubiquitous collector of amino groups in tissues, and is thus, a potent detoxifying agent [14]. For instance, AKG can function as an antidote to cyanide poisoning, wherein it reacts with cyanide molecules to form cyanohydrin, a reaction product [15]. In this regard, it is far more powerful than natural antioxidants such as vitamin C [14]. Thus, AKG may function as a strong ammonia- and phosphate-binding factor and indirectly stabilize redox state in organisms [11]. In support of this view, previous studies show that administration of AKG can improve serum redox homeostasis, thus conferring protection to arteries from vascular damage caused by free radicals [16]. Other studies have also demonstrated the antioxidative effects of AKG in cultured hepatoblastoma cells [17, 18]. These interesting observations concerning the effects of AKG on intestinal disease and oxidative stress prompted us to further investigate the effects of AKG on oxidative stress-induced intestinal damage in vitro, with an emphasis on identifying the possible mechanisms involved.
Intestinal porcine epithelial cell lines including IPEC-1, IPI-2I and IPEC-J2 are commonly used in the past research [19]. IPI-2I is a plasmid transformed cell line isolated from the ileum, whereas IPEC-1 and IPEC-J2 are normal cell lines, and IPEC-1 cell line was isolated from a mixture of ileal and jejunal tissue, while IPEC-J2 cell line was isolated from the jejunum [20, 21]. In the present study, oxidative stress was induced by hydrogen peroxide (H2O2), the IPEC-J2 cell line was used as the in vitro model of the porcine intestinal epithelium and to investigate the effects of AKG on the oxidative stress responsive intestine, aiming to reveal the mechanisms underlying the regeneration and repair of the small-intestinal mucosa. Compared with transformed cell lines, two major advantages favor IPEC-J2 cells as in vitro model of intestine: 1) differentiative potential and proliferation profiles are similar to primary intestinal epithelial cells, and 2) some glycocalyx-bound mucus proteins, cytokines, chemokine, and display Toll-like receptors can be regularly produced or activated, highly resembling the in vivo milieu and modeling the gastrointestinal tract [21–24]. Our results strongly indicate a protective role of AKG against H2O2-induced enterocyte damage via improved mitochondrial function and mitochondrial-dependent pathway.
RESULTS
Effects of H2O2 and AKG on the viability of IPEC-J2 cells
The viability assay of IPEC-J2 cells was performed by first treating the cells with different concentrations of H2O2 (0, 50, 100, 200, 250, 300, 400, or 500 μM) for 4 h. The results indicated that H2O2 decreased IPEC-J2 cell viability in a dose-dependent manner; and when itsconcentration was increased to 100 μM, H2O2 showed significant inhibitory effects on cell viability (P < 0.05) (Figure 1A). We then chose this concentration of H2O2 (100 μM) for further experiments. To examine the effects of AKG on the viability of H2O2-treated IPEC-J2 cells, different concentrations of AKG (0, 0.5, 1, or 2 mM) were added to the cells pretreated with 100 μM H2O2. Additionally, IPEC-J2 cells were treated without AKG (blank control) or with 2 mM AKG (positive control), without being subjected to oxidative stress (100 μM H2O2). AKG enhanced the viability of H2O2-pretreated IPEC-J2 cells in a dose-dependent manner, and the combination of 2 mM AKG + 100 μM H2O2 showed the maximum effect in comparison with the positive control (P < 0.05) (Figure 1B). Additionally, we determined the content of EdU in IPEC-J2 cells, as illustrated in Figure 2. Our results showed that the percentages of EdU-positive cells decreased in response to H2O2 treatment (P < 0.05) (Figure 2A). However, the addition of AKG (2 mM) to cells pretreated with 100 μM H2O2 resulted in an increase in the number of EdU-positive cells. Moreover, the EdU content was the highest in cells treated only with AKG (2 mM) (P < 0.05). Based on these results, we employed 100 μM H2O2 and 2 mM AKG in further experiments.
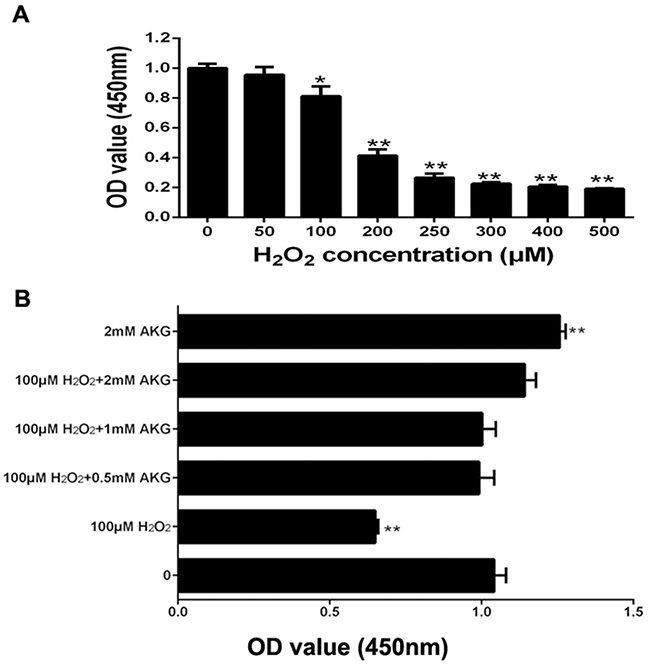
Figure 1: Cell proliferation in IPEC-J2 cells. (A) Effects of increasing concentrations of H2O2 for 4h on cell proliferation; (B) Effects of addition of increasing concentrations of AKG from 0 to 2 mM to 100 μM H2O2 for 2 days on cell proliferation. Cell viability was quantified by CCK-8 assay. Data are expressed as means ± SEM of at least three independent experiments. *P < 0.05 and **P < 0.01.
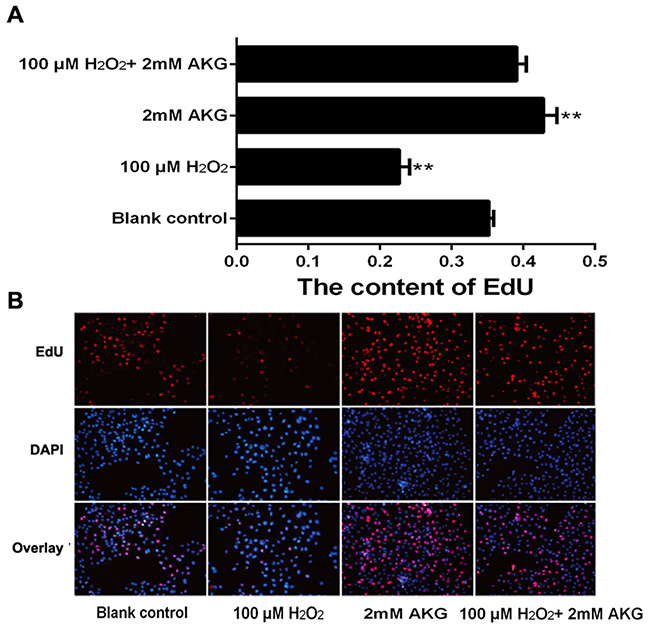
Figure 2: DNA synthesis in IPEC-J2 cells. DNA synthesis during the proliferation of IPEC-J2 cells was quantified by EdU incorporation (red color) using Cell-LightTM EdU Kit (Rui Bo Biotechnology Limited Company, Guangzhou, China). Nuclei are shown in blue color. Cells were treated without (Blank control) or with 100 μM H2O2, 2 mM AKG, or 100 μM H2O2 plus 2 mM AKG, respectively. (A) The percentage of EdU-positive cells (the number of red nuclei versus the number of blue nuclei in at least five different microscopic fields of vision). (B) Representative images of EdU staining (magnification × 200) of cells. Data are expressed as means ± SEM of at least three independent experiments. *P < 0.05 and **P < 0.01.
Cell cycle arrest and apoptosis
Flow cytometry analysis was performed to provide further evidence that inhibition of cell cycle progression by H2O2 was responsible for its anti-cell proliferative effect, and that AKG could attenuate this effect of H2O2. IPEC-J2 cells were treated without H2O2 (blank control) or with H2O2 (100 μM), AKG (2 mM), and H2O2 (100 μM) + AKG (2 mM). As shown in Figure 3, cell cycle distribution patterns of IPEC-J2 differed in response to different treatments. When compared with the blank control, 100 μM H2O2 induced a significant G0/G1 cell cycle arrest along with decreased number of cells in S phase (P < 0.05). In contrast, 2 mM AKG significantly decreased the cell cycle arrest at the G0/G1 phase and increased the number of cells in S phase (P < 0.05). As expected, the addition of 2 mM AKG to IPEC-J2 cells pretreated with 100 μM H2O2 resulted in a decrease in the number of cells in G0/G1 phase and an increase in the number of cells in S phase. However, no difference was observed in the G2/M phase cells among the groups (Figure 3B). Additionally, cell apoptosis was analyzed by Annexin V-FITC/PI staining. The results showed that when compared with the blank control group, 100 μM H2O2 increased the percentages of both early and late apoptotic cells (P < 0.05), while the addition of 2 mM AKG alone or with 100 μM H2O2 to cells decreased the above parameters (P < 0.05) (Figure 4).
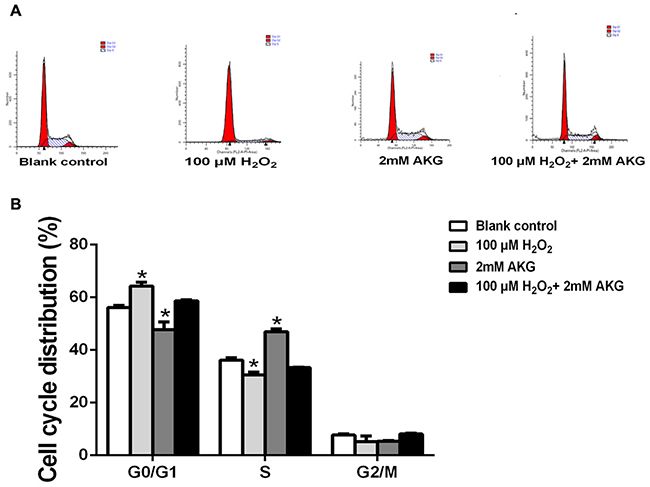
Figure 3: Cell cycle of IPEC-J2 cells analyzed using flow cytometry. (A) Cells were treated without (Blank control) or with 100 μM H2O2, 2 mM AKG, or 100 μM H2O2 plus 2 mM AKG, respectively. Then, cells were analyzed by flow cytometry for the cell cycle. G0/G1, S, G2/M phase cells presented as percentages. (B) Data are expressed as means ± SEM of at least three independent experiments. *P < 0.05 and **P < 0.01.
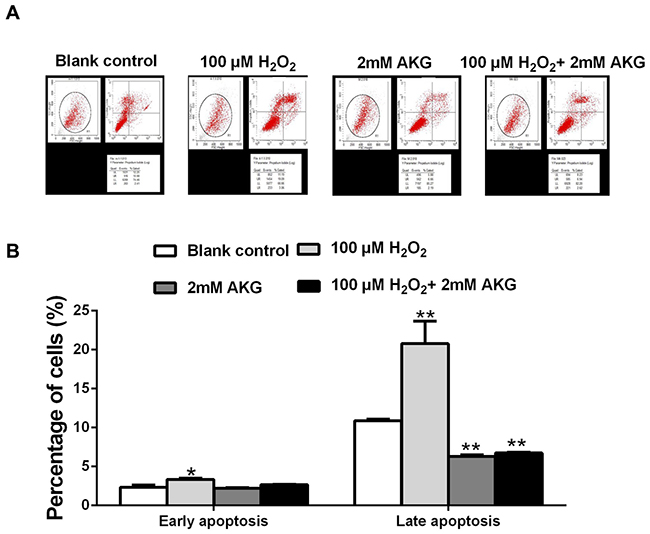
Figure 4: Cell apoptosis in the IPEC-J2 cells. (A) Cells were treated without (Blank control) or with 100 μM H2O2, 2 mM AKG, or 100 μM H2O2 plus 2 mM AKG, respectively. Then, cells were analyzed by flow cytometry for the cell apoptosis. (B) Data are expressed as means ± SEM of at least three independent experiments. *P < 0.05 and **P < 0.01.
Intracellular ROS levels
Flow cytometry technique was employed to evaluate the alteration of intracellular or mitochondrial ROS in the treated IPEC-J2 cells. As presented in Figure 5A, B, H2O2-induced oxidative stress significantly enhanced the ROS content of the cells (P < 0.05). However, the addition of 2 mM AKG to cells pretreated with 100 μM H2O2 reduced the ROS overload, although it was still higher than in the control group (P < 0.05).
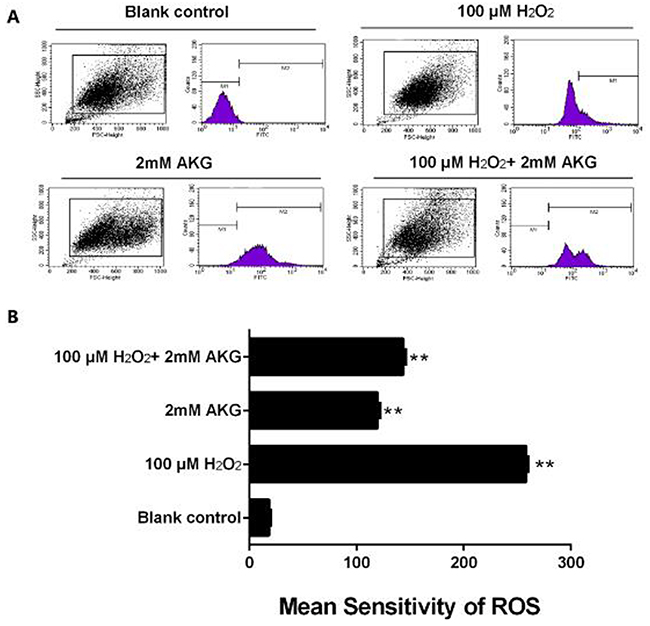
Figure 5: ROS content in IPEC-J2 cells. (A) Graphical representation of ROS content analyzed using flow cytometry. (B) Representation of analyzed mean sensitivity of ROS. Data are expressed as means ± SEM of at least three independent experiments. *P < 0.05 and **P < 0.01.
Mitochondrial bioenergetics
The effects of H2O2 and AKG on mitochondrial respiration in IPEC-J2 cells are shown in Figure 6. A general scheme of mitochondrial stress test is shown in Figure 6A. For this section, basal respiration, ATP production, proton leak, maximal respiration, spare respiratory capacity, and non-mitochondrial respiration of treated cell were determined. OCR was the lowest in the H2O2 group and highest in the AKG group, with intermediate values in the blank control group and the H2O2 + AKG group, as shown in Figure 6B. Mitochondrial function damage was induced by H2O2 (100 μM), with a decrease in the basal respiration, proton leak, maximal respiration, spare respiratory capacity, non-mitochondrial respiration, and ATP production (Figure 6C). Conversely, the addition of 2 mM AKG to cells pretreated with 100 μM H2O2 elevated the rate of mitochondrial respiration when compared with the group treated with 100 μM H2O2 (P < 0.05) (Figure 6C).
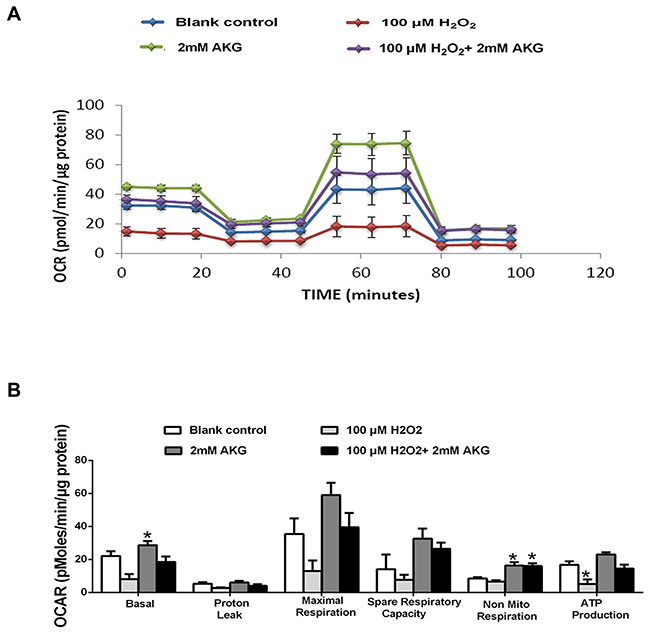
Figure 6: Mitochondrial respiration of IPEC-J2 cells. Schematic (A) and oxygen consumption rate (OCR) (B) assessed by extracellular flux analysis. OCR was measured under basal conditions followed by the sequential addition of oligomycin (0.5 μM), FCCP (4 μM), rotenone (1 μM) or antimycin A (1 μM). Each data point represents an OCR measurement. (C) Individual parameters for basal respiration, proton leak, maximal respiration, respiratory capacity, non-mitochondrial respiration and ATP production were determined. Cells were treated without (Blank control) or with 100 μM H2O2, 2 mM AKG, or 100 μM H2O2 plus 2 mM AKG, respectively. Data are expressed as means ± SEM of at least three independent experiments. *P < 0.05 and **P < 0.01.
TCA cycle intermediates
The relative contents of pyruvic acid, lactic acid, and TCA cycle intermediates (citric acid, AKG, succinic acid, fumaric acid, and malic acid) of IPEC-J2 are illustrated in Figure 7. The addition of 2 mM AKG increased the concentrations of succinic acid in the cells (P < 0.05), while decreased the concentrations of pyruvic acid and lactic acid (P < 0.05). However, there was no difference in fumaric acid, malic acid, and citric acid levels among the groups (P > 0.05).
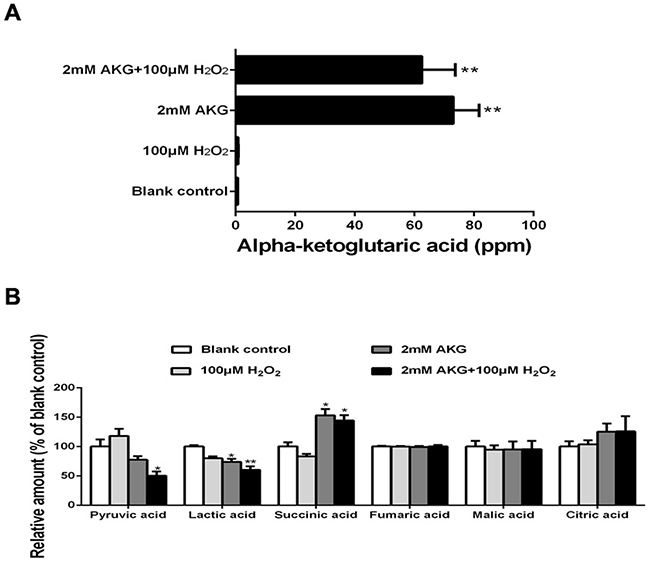
Figure 7: The TCA cycle intermediates, pyruvic acid, and lactic acid of IPEC-J2 cells. Cells were treated without (Blank control) or with 100 μM H2O2, 2 mM AKG, or 100 μM H2O2 plus 2 mM AKG, respectively. (A) Cellular AKG was determined. (B) Concentrations of pyruvic acid, lactic acid, and the TCA cycle intermediates (succinic acid, fumaric acid, malic acid, and citric acid) were determined. Data are expressed as means ± SEM of at least three independent experiments. *P < 0.05 and **P < 0.01.
Antioxidant capacity
The T-AOC and GPx activity analyses are presented in Figure 8. When compared with the blank control, cells in the 100 μM H2O2 group exhibited a significant decrease in the T-AOC and GPx activities (P < 0.05). However, the addition of AKG to cells pretreated with H2O2 tended to increase these parameters.
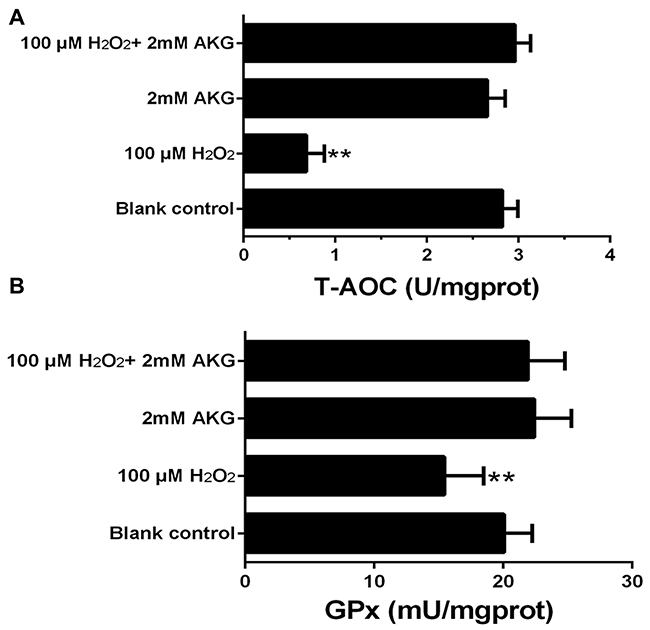
Figure 8: Concentrations of T-AOC and GPx in the IPEC-J2 cells. Cells were treated without (Blank control) or with 100 μM H2O2, 2 mM AKG, or 100 μM H2O2 plus 2 mM AKG, respectively. (A) T-AOC content was determined. (B) GPx content was determined. Data are expressed as means ± SEM of at least three independent experiments. *P < 0.05 and **P < 0.01.
Mitochondrial membrane potential (MMP) and cytochrome c release in cells
To furtherly verify whether alpha-ketoglutarate protected H2O2-induced apoptosis in IPEC-J2 via a mitochondrial dependent pathway, we determined the profiles of MMP and release of mitochondrial cytochrome c in treated cells. For this JC-1 fluorescence staining, lower intensity of red fluorescence along with the increase of green fluorescence indicate a decrease of MMP and the mitochondrial dependent apoptotic process. Figure 9 showed an increase in green/red fluorescence ratio induced by H2O2 was counteracted by AKG addition. Treatment with H2O2 for 4 h may induce the damage of mitochondria, thereby resulting in the release of mitochondrial cytochrome c to the cytoplasm. As shown in Figure 10, the release of cytochrome c was elevated (P < 0.05) by H2O2 treatment and was decreased by AKG. These results indicate that AKG inhibits H2O2-induced apoptosis via maintaining MMP stabilization, and decreasing the release of mitochondrial cytochrome c.
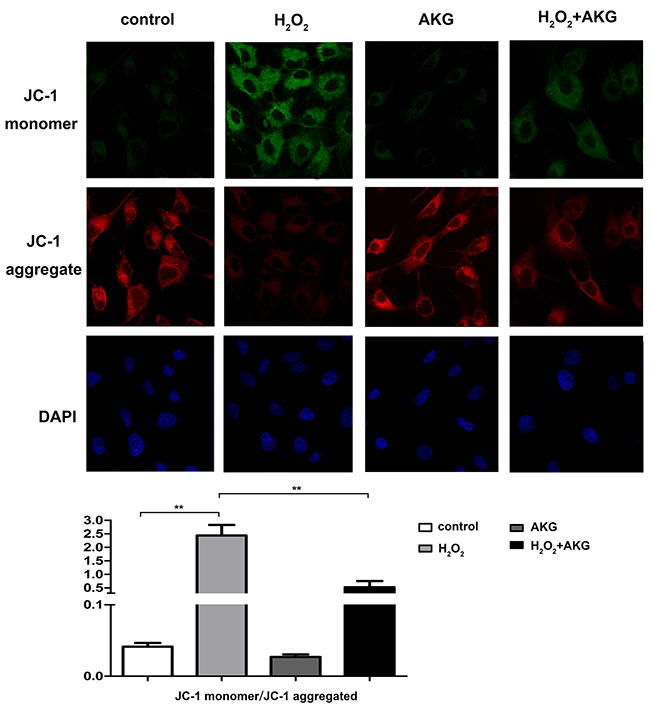
Figure 9: Mitochondrial membrane potential (MMP) of treated cells. Cells were treated without (Blank control) or with 100 μM H2O2, 2 mM AKG, or 100 μM H2O2 plus 2 mM AKG, respectively. Representative images of JC-1 derived fluorescence in IPEC-J2 with different treatment (400×). The JC-1 monomer was represented with green fluorescence; the JC-1 aggregate image was represented with red fluorescence; the merged images were the combined of the green and red images; The nucleus was stained with DAPI working solution before the photos capture; (A) Captured photos are shown. (B) Relative ratio of green fluorescence to red fluorescence. Mitochondrial depolarization is indicated by an increase in the green/red fluorescence intensity ratio. Data are expressed as means ± SEM of at least three independent experiments. *P < 0.05 and **P < 0.01.
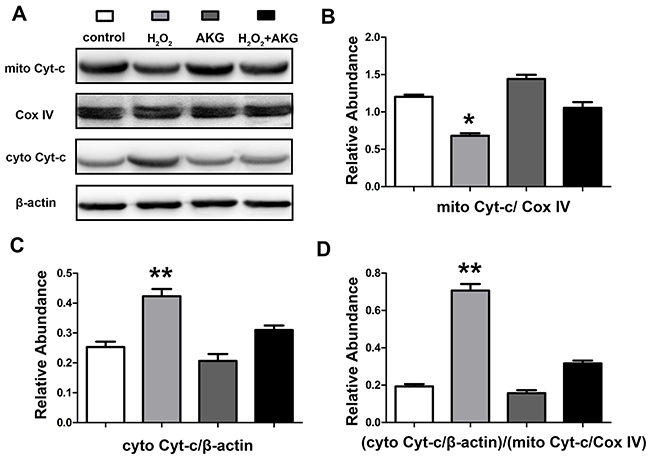
Figure 10: Cytochrome c release of cells. After the treatments and mitochondria isolation, protein levels of cytochrome c in the cytoplasm (cyto) and mitochondria (mito) were determined by western blot. β-actin or Cox IV is used as the loading control protein of cytoplasm or mitochondrial. (A) Protein bands of mitochondrial cytochrome c, cytoplasmic cytochrome c, β-actin and Cox IV are shown. (B) Relative abundance of mitochondrial cytochrome c. (C) Relative abundance of cytoplasmic cytochrome c. (D) Relative cytochrome c release level was shown. Data are expressed as means ± SEM of at least three independent experiments. *P < 0.05 and **P < 0.01.
Protein abundances of Bcl-2/Bax and caspase-3 activation in treated IPEC-J2
In the process of mitochondrial-dependent apoptosis, apoptotic proteins (e.g. caspase-3 and Bax) were activated by the released cytochrome c. The abundances of caspase-3, Bcl-2 and Bax in treated IPEC-J2 cells were determined by western blot. As shown in Figure 11, the ratio of Bcl-2/Bax was the highest in cells treated with 2 mM AKG (P < 0.05). The addition of 2 mM AKG to cells pretreated with 100 μM H2O2 elevated the ratio of Bcl-2/Bax protein when compared with the cells treated with only 100 μM H2O2 (P < 0.05). The abundance of cleaved caspase-3 was highly (P < 0.05) upregulated by H2O2, but significantly (P < 0.05) counteracted by AKG.
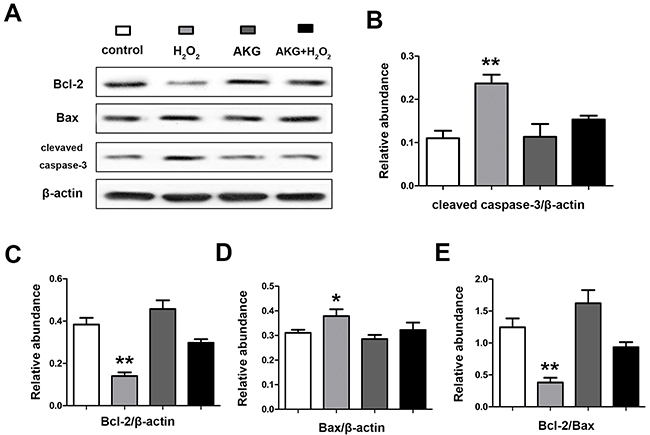
Figure 11: Abundances of apoptosis associated proteins in IPEC-J2 cells determined by western blot analysis. Cells were treated without (Blank control) or with 100 μM H2O2, 2 mM AKG, or 100 μM H2O2 plus 2 mM AKG, respectively. Protein levels of Bcal-2, Bax, cleaved caspase-3 were determined by western blot. (A) Protein bands of Bcl-2, Bax, cleaved capase-3 and β-actin are shown. (B) Relative abundance of cleaved caspase-3. (C) Relative abundance of Bcl-2. (D) Relative abundance of Bax. (E) The relative ratio of Bcal-2 to Bax protein is shown. Data are expressed as means ± SEM of at least three independent experiments. *P < 0.05 and **P < 0.01.
DISCUSSION
In swine production, early weaning enhances the serum H2O2 concentrations in post-weaning piglets, leading to reduced antioxidant capacity and increased free radicals in the body [5]. Although H2O2 is a weak oxidant and can be easily scavenged by cellular catalase and Gpx, it can severely damage the cultured cells even at lower concentrations [25, 26]. H2O2 can lead to membrane damage by promoting the release of arachidonic acid from the cell membrane, which may be responsible for the prolonged damage induced by H2O2 even after being scavenged [27]. Moreover, after rapidly penetrating the cell membrane, H2O2 can react with intracellular metal ions (such as copper or iron) to generate highly toxic hydroxyl radicals, leading to DNA alterations [25]. Previous studies showed that treatment of SH-SY5Y cells with H2O2 (400 μM) for 2 h decreased cell survival and viability [28]. In line with these results, our experiments also showed that when IPEC-J2 cells were incubated with H2O2 (100 μM) for 4 h, cell viability decreased when compared with the blank control. Additionally, the percentages of EdU-positive cells and cells arrested in the S phase significantly reduced in response to the H2O2 treatment. Moreover, the intracellular ROS content significantly increased in response to 100 μM H2O2 treatment. These results indicate that H2O2 induces mitochondrial ROS production, thereby leading to DNA damage in IPEC-J2 cells.
In response to LPS induced damage, DNA cleavage was induced and the proliferation was inhibited by arresting cells in G1/S phase [29]. Increased DNA synthesis may indicate the repair or proliferation of enterocytes for the initial damage [30, 31]. In the present study, an increase in EdU incorporation, cell viability, and cells in the S phase was observed when 2 mM AKG was added to the culture medium. These data indicate that AKG could improve DNA synthesis and promote the progression of 100 μM H2O2-pretreated IPEC-J2 cells from G0/G1 phase to S phase, ultimately enhancing cell proliferation. The cell cycle is a highly regulated process consisting of three phases, namely, G1/G0, S, and G2/M phase [32]. Cell cycle slows during the G0/G1 phase and does not progress to the S phase until DNA is correctly encoded [33]. Additionally, cell survival and apoptosis are closely related to the cell cycle. Cell apoptosis has periodic characteristics and often occurs during cell cycle arrest. Moreover, apoptosis plays a role in regulating the number of cells. There are potential correlations between apoptosis and cell proliferation [34, 35]. Results of our flow cytometry analysis indicated that 100 μM H2O2 induced cell apoptosis, while AKG could attenuate this effect. Overall, AKG has the ability to regulate cell proliferation by promoting cell viability and cell cycle progression and concomitantly inhibiting cell apoptosis at both early and late stages.
AKG regulates cellular redox status and plays a role in oxidative defenses [36–38]. Increasing evidence supports this notion. Elevated levels of AKG might confer protection against oxidative damage via its participation in the non-enzymatic oxidative decarboxylation during H2O2 decomposition [39]. Many studies have reported that AKG inhibits oxidative stress induced by H2O2 in cultured neurons and erythrocytes [39, 40]. Further evidence showed that AKG improved serum redox homeostasis and conferred protection to arteries against free radical-induced vascular damage. The presence of antioxidant enzymes, such as GPx and superoxide dismutase, prevented the oxidative damage in cells [16]. Consistent with our in vitro mechanistic studies, dietary supplementation of AKG (1%) ameliorated intestinal injury caused by oxidative damage in LPS-challenged piglets [12]. In line with these observations, our study also found that H2O2 exposure induced oxidative stress, as evidenced by decreases in cell survival and viability, while AKG treatment markedly improved the antioxidant function. Thus, AKG may protect porcine small intestinal epithelial cells against oxidative injury via the induction of antioxidant cellular defenses.
Endogenous ROS is mainly produced by the respiratory chain of the mitochondria [6]. In our previous report, mitochondrial dysfunction was observed with a decrease in basal respiration, maximal respiration, and non-mitochondrial respiration after LPS treatment [1]. Our current results support this notion by providing data on basal respiration, maximal respiration, respiratory capacity, non-mitochondrial respiration, and ATP production in IPEC-J2 cells. The mitochondrion is responsible for the generating ATP, maintaining biological functions and meeting higher demands for energy when cell responded to various stress [41]. In this regard, our current finding reveals AKG enhanced mitochondrial bioenergetics, when cell responded to oxidative stress.
Consisted with the positive effect of AKG on mitochondrial bioenergetics, it is evident from our study that an increase in AKG concentration can stimulate the TCA cycle. AKG is an intermediate of the TCA cycle and may affect ATP production [42]. We further determined the content of TCA cycle intermediates (citric acid, AKG, succinic acid, fumaric acid, and malic acid), as well as those of pyruvic acid and lactic acid pathways, in IPEC-J2 cells after AKG treatment. Our results showed that AKG treatment increased cellular concentrations of succinic acid. Previous studies have demonstrated an increase in ROS production at sub-saturating succinate concentrations (0–0.1 mM), while a decline in ROS production was observed at higher succinate concentrations (0.1–5.0 mM) [43]. Other TCA cycle intermediates, namely, fumarate, malate, citrate, and, especially, oxaloacetate that binds competitively to the dicarboxylate binding site of complex II also attenuated ROS production [43]. Additionally, succinate provides higher yields of ATP in a dose-dependent manner, (0-15mM) [44]. Along with these previous reports, our results show that AKG treatment increases the concentration of TCA cycle intermediates, especially succinic acid, contributing to mitochondrial redox homeostasis and ATP production. Thus, we speculate that AKG may regulate the mitochondrial respiratory chain via the TCA cycle intermediates.
Furthermore, AKG supplementation increased the T-AOC and GPx in H2O2-treated IPEC-J2 cells. The T-AOC is an integrative index used to reflect the antioxidant capacity of the cells [36]. Collectively, our results indicated that AKG treatment resulted in decreased enterocyte apoptosis with a concomitant increase in antioxidant ability. Therefore, AKG may attenuate the cytotoxicity by maintaining the balance of ROS in stress responsive cells.
The extrinsic death receptor-mediated pathway and the intrinsic mitochondrial pathway have been known as the major signal pathways involved in the apoptotic process [45]. The apoptotic process is composed of a proteolytic cascade involving a family of caspase proteases [46]. Expression of Bcl-2 and Bax in cells is usually associated with this apoptosis process. [47]. Increased level of Bax leads to the combination of Bcl-2, low concentration of Bcl-2 in the cell, and activation of cell apoptosis [48]. During the apoptotic process, Bax forms oligomers and transfers from cytoplasm to mitochondrial membrane [49], then Bax oligomer interacts with pore protein of mitochondrial membrane, results in increased membrane permeability, and induces release of cytochrome c from mitochondria to cytosol, finally actives the caspase [50], leading to mitochondrial electron transport, DNA fracture and furtherly deterioration, thereby caused apoptosis [51]. To furtherly verify the anti-apoptotic mechanism of alpha-ketoglutarate, MMP and apoptotic proteins of mitochondrial pathway were determined. In this study, it was demonstrated that AKG treatment increased Bcl-2/Bax ratio and MMP, and decreased cytochrome c release from mitochondria into the cytoplasm when intestinal cell responded to H2O2-induced stress milieu. Combining with the results described in early part, we proposed that mitochondria-dependent pathway is involved in the anti-apoptosis effect of AKG on oxidative stress-responsive intestinal cells.
In summary, H2O2 induced mitochondrial dysfunction and cell-cycle impairment, while AKG promoted DNA synthesis and mitochondrial bioenergetics in intestinal epithelial cells. Further results suggest that this protective effect partly attributes to the attenuation of mitochondrial-dependent apoptosis. Possible anti-apoptotic mechanisms involve the following steps: improvements in TCA cycle and ATP production, decreased cellular ROS content, enhanced the expression of Bcl-2, stabilization of MMP, decreased release of mitochondrial cytochrome c, and inhibition of caspase-3 activation. These novel results provide reference to support the use of AKG as a potential nutrient on attenuating some disease symptoms induced by mitochondrial dysfunction or oxidative stress.
MATERIALS AND METHODS
Reagents
Dulbecco’s modified Eagle’s medium, high glucose (DMEM-H), fetal bovine serum (FBS), and antibiotics were purchased from Invitrogen (Grand Island, NY, USA). Plastic culture plates were manufactured by Corning Inc. (Corning, NY, USA). Unless indicated, all other chemicals were purchased from Sigma-Aldrich (St. Louis, MO, USA).
Cell culture
IPEC-J2 cells were cultured in the plastic culture flasks (25 cm2) with DMEM-H containing 10% FBS, 5 mM L-glutamine, 100 U/mL penicillin, and 100 μg/mL streptomycin. At reached to 80% confluence, cells were trypsinized and seeded in 6-well culture plates with 8 × 10³ cells per well and kept in a 5% CO2 humidified incubator at 37 °C. After overnight incubation, the culture medium was replaced by basal medium (blank control, groups 1 and 3) and basal medium + 100 μM H2O2 (groups 2 and 4) for 4 h. Thereafter, 2 mM AKG was added to groups 3 and 4, and the medium was changed as described above. The cells were collected for subsequent analysis after culturing for 2 days.
Cell viability assay
Cell counting kit-8 (CCK-8, Dojindo, JPN) was used to determine the cell viability, according to the protocol. Initially, IPEC-J2 cells were incubated in media containing different treatments. Then, the culture media were replaced with 100 μL of fresh media containing 10 μL reagent from the kit. After incubation for 45 min at 37 °C, the absorbance of each well at 450 nm was determined with an ELISA plate reader (Bio-Tek, Winooski, VT, USA). The results of cell viability were shown as OD450 values. The optimum concentration of H2O2 or AKG obtained from the cell viability assay was used in further analyses.
Measurement of DNA synthesis
After the treatments, DNA synthesis rate of the treated cells was measured by incorporating 5-ethynyl-2′-deoxyuridine (Invitrogen, USA) Cell-lightTM EdU Kit (Rui Bo Biotechnology, CHN), as described in our previous studies [1]. After the incubation process of EdU staining according to the product manual, an Olympus B × 51 microscope (Olympus, JPN) was used to capture the image of EdU-positive cells counter-stained with Apollo® 567 Hoechst 33342. Five more different microscopic fields were randomly selected for the capture at 200× magnification.
Profiles of the cell cycle and apoptosis analyzed by flow cytometry
About 1 × 10⁶ treated cells were collected and centrifuged at 1 000 ×g for 5 min. The supernatant was discarded, then washed cells once with ice-cold PBS and resuspended in 1 mL of the staining reagent containing 50 mg/mL propidium iodide (PI) and 100 mg/mL RNase for 30 min in the dark. To assess apoptosis, the pretreated cells were stained with PI/Annexin-V-FITC (KeyGEN, CHN) according to the manufacturer’s instructions. Cell cycle arrest and apoptosis were analyzed by flow cytometry (BD FACSCalibur, USA). Fluorescence intensities of cells stained with PI and Annexin-V-FITC were monitored at 630 and 525 nm, respectively.
Metabolic assays
The effects of AKG addition on mitochondrial respiration in H2O2-induced cells was determined by an XF-24 Extracellular Flux Analyzer and a Cell Mito Stress Test Kit (Seahorse Biosciences, USA), as described previously [1]. Briefly, after the treatment, the culture medium was replaced by the specific test medium. During the process of test, the specific concentration of oligomycin, carbonyl cyanide-p-trifluoromethoxyphenylhydrazone (FCCP) as well as rotenone and antimycin A were regularly and automatic injected into the test medium. ATP production, proton leak, basic respiration and maximal respiration capacity was assessed by the data obtained from the specific probes. In addition, the cellular total protein was determined for the final normalization.
Mitochondrial membrane potential determination
A kit of membrane permeability dye JC-1 (Beyotime, CHN) was used for this test. JC-1 is an indicator of mitochondrial membrane potential loss. The dye of JC-1 enters the mitochondria of normal cells, emits red fluorescence, and the dye enters the cytoplasm of apoptotic cells as a monomer that emits green fluorescence. Fluorescence measurement using a confocal microscopy (Leica, GER). The proportion of green fluorescence and red fluorescence showed the change of mitochondrial membrane potential. Five more different microscopic fields were randomly selected for the capture.
Mitochondria isolation
Mitochondria were isolated from cultured cells using Mitochondria Isolation Kit for Cultured Cells (TransGen Biotech, CHN). For the isolation, about 1 x 10⁷ cells per sample were used. During the process, 800 μL of mitochondrial separation reagent A, 10 μL mitochondrial separation reagent B and 500 μL mitochondrial separation reagent C was used, the specific procedures were strictly abided by the protocol manual. In addition, all the operation was kept on the ice, and protease inhibitor and phosphatase inhibitors were extra added into the regents before the isolation process. Cytoplasmic and mitochondrial fractions were separated for western blot analyze. Cox IV (Abcam, Cambridge, UK) was used as a loading control for mitochondrial proteins.
ROS analysis by flow cytometry
Flow cytometry was used for intracellular ROS level determination, as described in our previous study [52]. Briefly, after the indicated treatments, IPEC-J2 cells were incubated with 20 μM 2,7-dichlorodihydroflurescein diacetate for 30 min at 37 °C and washed twice with PBS. Fluorescence intensities of 10,000 cells were analyzed using CELLQuestTM software in FACScaliburTM (Becton Dickinson, San Jose, CA).
Detection of TCA cycle intermediates by GC-MS
Treated cells were fixed for detection of metabolites by GC-MS, the procedure was referred as its described previously [53]. The cells were washed with PBS twice and treated with 0.25% trypsin. They were then centrifuged at 1000 ×g for 5 min. After being quenched by 500 μL of pre-chilled 50% (v/v) methanol, cells were centrifuged again at 1000 ×g for 5 min and the supernatant was discarded, followed by addition of 500 μL of pre-chilled 100% (v/v) methanol. The metabolites were detected using an Agilent 7890B-5977A GC-MS equipped with a HP-5ms (30m × 250μm × 0.25 μm) capillary column (Agilent J&W, Santa Clara, CA, USA). All metabolites were previously validated using authentic standards (Sigma).
Detection of anti-oxidant capacity
Total antioxidant capacity (T-AOC) and glutathione peroxidase (GPx) assay kits (Nanjing Jiancheng, CHN) were used for the determination. The procedures strictly abided by the manufacturer’s instructions. A UV/visible spectrophotometer-UV-2450 (SHIMADZU, Kyoto, Japan) was used for the data output.
Western blotting analysis
After the treatments, cells or isolated mitochondrial fractions were lysed in RIPA buffer (Beyotime, CHN), along with the protease inhibitor and phosphatase inhibitors. Protein concentrations of the lysis were measured BCA kit (Beyotime, CHN), as described in a previous study [31]. All samples were diluted to an equal protein concentration in each sample. Samples of protein lysis were high-temperature pre-denaturized and subjected to SDS-PAGE, then transferred to polyvinylidene difluoride membranes, which were blotted with 5% nonfat milk in TBS-with 0.05% Tween-20 for 1 h and incubated overnight with a primary antibody, followed by horseradish peroxidase-linked secondary antibody. The protein bands were visualized using chemiluminescence reagents. The densities of the protein bands were determined by Imager 2200 software (Alpha Innotech Corporation), and the relative level of target proteins was shown as the density percentage of the control loading protein (e.g. β-actin, Cox IV).
Statistical analysis
All results are expressed as mean ± SEM. The statistical analysis was performed using one-way ANOVA, SAS 8.2. Differences among group means were compared using the Duncan multiple comparison tests. Probability values less than 0.05 were considered as statistically significant. All the experiments were repeated independently at least three times.
Author contributions
Q.J, G.L, XQ. W, YQ.H, K.Y, YH.D, YL.Y and GY.W designed the study; YY.H and G.L compiled and analyzed the data. Q.J and G.L discussed and wrote the manuscript. All authors have reviewed the manuscript.
ACKNOWLEDGMENTS
To whom correspondence should be addressed. Kang Yao, [email protected].
CONFLICTS OF INTEREST
The authors declare no competing financial interests.
FUNDING
This study was jointly supported by the National Science Foundation for Distinguished Young Scholars of Hunan Province (2016JJ1015), Key Programs of frontier scientific research of the Chinese Academy of Sciences, the National Basic Research Program of China (2013CB127306), the Open Foundation of Key Laboratory of Agro-ecological Processes in Subtropical Region, Institute of Subtropical Agriculture, Chinese Academy of Sciences (ISA2016101), the Chinese Academy of Sciences “Hundred Talent” award and the National Natural Science Foundation Project (31472107).
REFERENCES
1. Tan B, Xiao H, Xiong X, Wang J, Li GR, Yin YL, Huang B, Hou YQ, Wu GY. L-Arginine improves DNA synthesis in LPS-challenged enterocytes. Front Biosci-Landmark. 2015; 20:989-1003.
2. Vergauwen H, Tambuyzer B, Jennes K, Degroote J, Wang W, De Smet S, Michiels J, Van Ginneken C. Trolox and ascorbic acid reduce direct and indirect oxidative stress in the IPEC-J2 cells, an in vitro model for the porcine gastrointestinal tract. PLoS One. 2015; 10:e0120485.
3. Boudry G, Peron V, Le Huerou-Luron I, Lalles JP, Seve B. Weaning induces both transient and long-lasting modifications of absorptive, secretory, and barrier properties of piglet intestine. J Nutr. 2004; 134:2256-2262.
4. Wijtten PJA, van der Meulen J, Verstegen MWA. Intestinal barrier function and absorption in pigs after weaning: a review. Br J Nutr 2011; 105:967-981.
5. Zhu LH, Zhao KL, Chen XL, Xu JX. Impact of weaning and an antioxidant blend on intestinal barrier function and antioxidant status in pigs. J Anim Sci. 2012; 90:2581-89.
6. Xiao H, Tan BE, Wu MM, Yin YL, Li TJ, Yuan DX, Li L. Effects of composite antimicrobial peptides in weanling piglets challenged with deoxynivalenol: II. Intestinal morphology and function. J Anim Sci. 2013; 91:4750-4756.
7. Circu ML, Aw TY. Intestinal redox biology and oxidative stress. Semin Cell Dev Biol. 2012; 23:729-737.
8. Herring TA, Cuppett SL, Zempleni J. Genomic implications of H2O2 for cell proliferation and growth of Caco-2 cells. Digest Dis Sci. 2007; 52:3005-3015.
9. Blikslager AT, Moeser AJ, Gookin JL, Jones SL, Odle J. Restoration of barrier function in injured intestinal mucosa. Physiol Rev. 2007; 87:545-564.
10. Xiao D, Zeng L, Yao K, Kong X, Wu G, Yin Y. The glutamine-alpha-ketoglutarate (AKG) metabolism and its nutritional implications. Amino Acids. 2016; 48:2067-2080.
11. He LQ, Xu ZQ, Yao K, Wu GA, Yin YL, Nyachoti CM, Kim SW. The physiological basis and nutritional function of alpha-ketoglutarate. Curr Protein Pept Sci. 2015; 16:576-581.
12. Hou YQ, Wang L, Ding BY, Liu YL, Zhu HL, Liu JA, Li YT, Wu X, Yin YL, Wu GY. Dietary alpha-ketoglutarate supplementation ameliorates intestinal injury in lipopolysaccharide-challenged piglets. Amino Acids. 2010; 39:555-564.
13. McLain AL, Szweda PA, Szweda LI. Alpha-ketoglutarate dehydrogenase: a mitochondrial redox sensor. Free Radical Res. 2011; 45:29-36.
14. Velvizhi S, Nagalashmi T, Essa MM, Dakshayani KB, Subramanian P. Effects of alpha-ketoglutarate on lipid peroxidation and antioxidant status during chronic ethanol administration in Wistar rats. Pol J Pharmacol. 2002; 54:231-236.
15. Dulaney MD Jr, Brumley M, Willis JT, Hume AS. Protection against cyanide toxicity by oral alpha-ketoglutaric acid. Vet Hum Toxicol. 1991; 33:571-575.
16. Valdivia A, Perez-Alvarez S, Aroca-Aguilar JD, Ikuta I, Jordan J. Superoxide dismutases: a physiopharmacological update. J Physiol Biochem. 2009; 65:195-208.
17. Mailloux RJ, Puiseux-Dao S, Appanna VD. alpha-Ketoglutarate abrogates the nuclear localization of HIF-1 alpha in aluminum-exposed hepatocytes. Biochimie. 2009; 91:408-415.
18. Mailloux RJ, Lemire J, Appanna VD. Hepatic response to aluminum toxicity: dyslipidemia and liver diseases. Exp Cell Res. 2011; 317:2231-2238.
19. Arce C, Ramirez-Boo M, Lucena C. Garrido JJ. Innate immune activation of swine intestinal epithelial cell lines (IPEC-J2 and IPI-2I) in response to LPS from Salmonella typhimurium. Comp Immunol Microbiol Infect Dis. 2010; 33:161-174.
20. Vergauwen H. (2015). The IPEC-J2 cell line. In: Verhoeckx K, Cotter P, Kleiveland C, Mackie A, Swiatecka D and Wichers H, eds. The impact of food bio-actives on gut health: in vitro and ex vivo models. (New York: SpringerLink), pp. 125-134.
21. Schierack P, Nordhoff M, Pollmann M, Weyrauch KD, Amasheh S, Lodemann U, Jores J, Tachu B, Kleta S, Blikslager A, Tedin K, Wieler LH. Characterization of a porcine intestinal epithelial cell line for in vitro studies of microbial pathogenesis in swine. Histochem Cell Biol. 2006; 125:293-305.
22. Geens MM, Niewold TA. Optimizing culture conditions of a porcine epithelial cell line IPEC-J2 through a histological and physiological characterization. Cytotechnology. 2011; 63:415-423.
23. Mariani V, Palermo S, Fiorentini S, Lanubile A, Giuffra E. Gene expression study of two widely used pig intestinal epithelial cell lines: IPEC-J2 and IPI-2I. Vet Immunol Immunop. 2009; 131:278-284.
24. Brosnahan AJ, Brown DR. Porcine IPEC-J2 intestinal epithelial cells in microbiological investigations. Vet Microbiol. 2012; 156:229-237.
25. Gille JJ, Joenje H. Cell culture models for oxidative stress: superoxide and hygen peroxide versus normobaric hyperoxia. Mutat Res. 1992; 275:405-414.
26. Wink DA, Cook JA, Pacelli R, DeGraff W, Gamson J, Liebmann J, Krishna MC, Mitchell JB. The effect of various nitric oxide-donor agents on hydrogen peroxide-mediated toxicity: a direct correlation between nitric oxide formation and protection. Arch Biochem Biophys. 1996; 331:241-248.
27. Cantoni O, Cattabeni F, Stocchi V, Meyn RE, Cerutti P, Murray D. Hydrogen-peroxide insult in cultured mammalian-cells -relationships between DNA single-strand breakage, poly(Adp-ribose) metabolism and cell killing. BBA. 1989; 1014:1-7.
28. Gao Z, Huang K, Xu H. Protective effects of flavonoids in the roots of Scutellaria baicalensis Georgi against hydrogen peroxide-induced oxidative stress in HS-SY5Y cells. Pharmacol Res. 2001; 43:173-178.
29. Sancar A, Lindsey-Boltz LA, Unsal-Kacmaz K, Linn S. Molecular mechanisms of mammalian DNA repair and the DNA damage checkpoints. Annu Rev Biochem. 2004; 73:39-85.
30. Zhang XJ, Chinkes DL, Wu ZP, Herndon DN. Enternal arginine supplementation stimulates DNA synthesis in skin donor wound. Clin Nutr. 2011; 30:391-396.
31. Tan B, Yin YL, Kong XF, Li P, Li XL, Gao HJ, Li XG, Huang RL, Wu GY. l-Arginine stimulates proliferation and prevents endotoxin-induced death of intestinal cells. Amino Acids. 2010; 38:1227-1235.
32. Johnson DG, Walker CL. Cyclins and cell cycle checkpoints: Cell cycle review. Annu Rev Pharmacol Toxicol. 1999; 39:295-312.
33. Filhiol TM. (2012). The effects of leucine on mitochondrial biogenesis and cell cycle in A-375 melanoma cells. The University of Tennessee, Knoxville.
34. Yan YY, Bai JP, Xie Y, Yu JZ, Ma CG. The triterpenoid pristimerin induces U87 glioma cell apoptosis through reactive oxygen species-mediated mitochondrial dysfunction. Oncol Lett. 2013; 5:242-248.
35. Zhang L, Liang P, Zhang R. Impact of mitochondria-mediated apoptosis in U251 cell cycle arrest in G1 stage and caspase activation. Med Sci Monit. 2015; 21:3629-3633.
36. Puntel RL, Roos DH, Grotto D, Garcia SC, Nogucira CW, Teixeira Rocha JB. Antioxidant properties of Krebs cycle intermediates against malonate pro-oxidant activity in vitro: a comparative study using the colorimetric method and HPLC analysis to determine malondialdehyde in rat. Life Sci. 2007; 81:51-62.
37. Velvizhi S, Nagalashmi T, Essa MM, Dakshayani KB, Subramanian P. Effects of alpha-ketoglutarate on lipid peroxidation and antioxidant status during chronic ethanol administration in Wistar rats. Pol J Pharmacol. 2002; 54:231-236.
38. Velvizhi S, Dakshayani KB, Subramanian P. Effects of alpha-ketoglutarate on antioxidants and lipid peroxidation products in rats treated with ammonium acetate. Nutrition. 2002; 18:747-750.
39. Sokolowska M, Oleszek A, Wlodek L. Protective effect of alpha-keto acids on the oxidative hemolysis. Pol J Pharmacol. 1999; 51:429-434.
40. Desagher S, Glowinski J, Premont J. Pyruvate protects neurons against hydrogen peroxide-induced toxicity. J Neurosci. 1997; 17:9060-9067.
41. Turrens JF. Mitochondrial formation of reactive oxygen species. J Physiol-London. 2003; 552:335-344.
42. Wu G, Bazer FW, Johnson GA, Knabe DA, Burghardt RC, Spencer TE, Li XL, Wang JJ. Important roles for L-glutamine in swine nutrition and production. J Anim Sci. 2011; 89:2017-2030.
43. Siebels I, Drose S. Q-site inhibitor induced ROS production of mitochondrial complex II is attenuated by TCA cycle dicarboxylates. BBA-Bioenergetics. 2013; 1827:1156-1164.
44. Jagendor AT, Uribe E. ATP formation caused by acid-base transition of spinach chloroplasts. PNAS. 1966; 55:170-177.
45. Yang LJ, Rong ZJ, Zeng MJ, Cao YL, Gong XM, Lin LJ, Chen Y, Cao W, Zhu LX, Dong WR. Pyrroloquinoline quinone protects nucleus pulposus cells from hydrogen peroxide-induced apoptosis by inhibiting the mitochondria-mediated pathway. Eur Spine J. 2015; 24:1702-1710.
46. Liu S, Li JL, Tao YG, Xiao XZ. Small heat shock protein alpha B-crystallin binds to p53 to sequester its translocation to mitochondria during hydrogen peroxide-induced apoptosis. Biochem Biophys Res Commun. 2007; 354:109-114.
47. Lee K, Tome ME, Jaramillo MC, Briehl MM. Mitochondria are the primary source of the hydrogen peroxide signal in glucocorticoid-induced lymphoma cell apoptosis. Free Radical Bio Med. 2009; 47:S172-S172.
48. Li RT, Yan GJ, Li QL, Sun HX, Hu YL, Sun JX, Xu BA. MicroRNA-145 protects cardiomyocytes against hydrogen peroxide (H2O2)-induced apoptosis through targeting the mitochondria apoptotic pathway. PLoS One. 2012; 7:e44907.
49. Viola HM, Arthur PG, Hool LC. Transient exposure to hydrogen peroxide causes an increase in mitochondria-derived superoxide as a result of sustained alteration in L-type Ca2+ channel function in the absence of apoptosis in ventricular myocytes. Circ Res. 2007; 100:1036-1044.
50. Viola HM, Arthur PG, Hool LC. Transient exposure to extracellular hydrogen peroxide is associated with a persistent increase in intracellular calcium and superoxide release from the mitochondria in ventricular myocytes without apoptosis. Circ Res. 2006; 99:E24-E24.
51. Li L, Couty L, Fournier B, Lemitre M, Durand E, Gogly B, Lafont A, Coulomb B. Mitochondrial pathway of apoptosis is involved in the regulation of cell density within aorta. Wound Repair Regen. 2009; 17:A72-A72.
52. Liu YM, Shen SN, Li ZY, Jiang YM, Si JY, Chang Q, Liu XM, Pan RL. Cajaninstilbene acid protects corticosterone-induced injury in PC12 cells by inhibiting oxidative and endoplasmic reticulum stress-mediated apoptosis. Neurochem Int. 2014; 78:43-52.
53. Morita M, Gravel SP, Chenard V, Sikstrom K, Zheng L, Alain T, Gandin V, Avizonis D, Arguello M, Zakaria C, McLaughlan S, Nouet Y, Pause A, et al. mTORC1 controls mitochondrial activity and biogenesis through 4E-BP-dependent translational regulation. Cell Metab. 2013; 18:698-711.