
Introduction
Cytosolic Ca2+ activity participates in the regulation of a variety of fundamental cellular mechanisms including excitation, exocytosis, migration, cell proliferation and cell death [1-5]. Mechanisms contributing to the regulation of cytosolic Ca2+ concentration include Ca2+ release from intracellular stores and subsequent activation of store operated Ca2+ entry (SOCE) or Ca2+ release activated Ca2+ channel ICRAC, which are accomplished by the pore forming Ca2+ channel subunits Orai1, Orai2 and/or Orai3 [6-10] as well as their regulators STIM1 and/or STIM2 [11-15]. Orai1 and STIM1 are expressed in tumor cells and may well contribute to the survival of therapy resistant cells [16-20].
STIM1 and Orai1 upregulate SOCE via activation of Akt/mTOR in human pulmonary arterial smooth muscle cells [21]. In addition Orai1 and thus SOCE is up-regulated in both mast cells [22] and platelets [23] by the serum & glucocorticoid inducible kinase SGK1, which counteracts Orai1 degradation by the ubiquitin ligase Nedd4-2 [22] and stimulates NF-κB dependent Orai1 transcription [24]. SGK1 targets are in large part shared by PKB/Akt isoforms [25]. Thus, it is feasible that Orai1 is similarly regulated by PKB/Akt isoforms.
The present study explored whether Orai1 and STIM1 are expressed in ovary carcinoma cells and whether their expression and function differs between therapy resistant and therapy sensitive ovary carcinoma cells. To this end, Orai1 and STIM1 transcript and protein expression, SOCE as well as apoptosis following cisplatin treatment were determined in therapy resistant and therapy sensitive ovary carcinoma cells.
Results
RT-PCR was employed to explore whether ovary carcinoma cells transcribe Orai1 and/or STIM1 and whether the transcript levels are different between therapy sensitive A2780 and therapy resistant A2780cis ovary carcinoma cells. As illustrated in Fig.1, both cell lines express Orai1 and STIM1. The transcript levels were, however, significantly higher in therapy resistant A2780cis than in therapy sensitive A2780 ovary carcinoma cells.
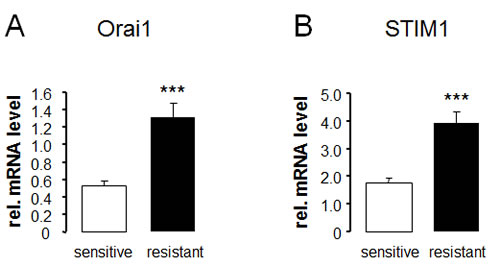
Fig. 1: Transcript levels of Orai1 and STIM1 in therapy sensitive and therapy resistant ovary carcinoma cells. Arithmetic means ± SEM (n = 9) of Orai1 (A) and STIM1 (B) transcript levels in therapy sensitive (white bars) and therapy resistant (black bars) ovary carcinoma cells. *** (p<0.001) indicates statistically significant difference from therapy sensitive ovary carcinoma cells (ANOVA).
In line with the differences in Orai1 and STIM1 transcript levels, Western blotting analysis revealed similar differences in protein abundance. Indeed, as illustrated in Fig. 2, the Orai1 and STIM1 protein expression was significantly higher in therapy resistant A2780cis than in therapy sensitive A2780 ovary carcinoma cells.
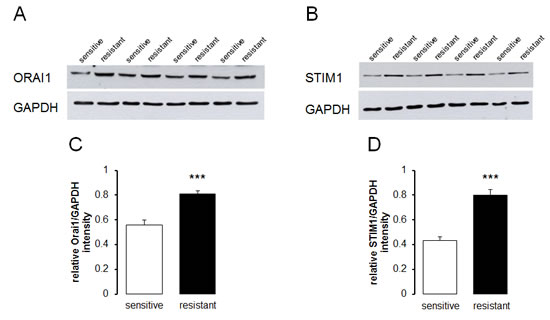
Fig. 2: Protein abundance of Orai1 and STIM1 in therapy sensitive and therapy resistant ovary carcinoma cells. A,B. Original Western blot of whole tissue lysate protein of Orai1 (A) and STIM1 (B) as well as GAPDH in therapy sensitive and therapy resistant ovary carcinoma cells. C,D. Arithmetic means ± SEM (n = 4) of the Orai1/GAPDH (C) and STIM1/GAPDH (D) protein abundance ratios in therapy sensitive (white bars) and therapy resistant (black bars) ovary carcinoma cells. *** (p<0.001) indicates statistically significant difference from therapy sensitive ovary carcinoma cells (ANOVA).
Fura-2-fluorescence was employed in order to test whether the differences in Orai1 and STIM1 transcript levels and protein abundance were paralleled by corresponding differences in store operated Ca2+ entry. The Fura-2-fluorescence ratio prior to extracellular Ca2+ removal was similar in therapy sensitive A2780 (0.298 ± 0.003 a.u., n = 7) and therapy resistant A2780cis (0.309 ± 0.003 a.u., n = 7) ovary carcinoma cells. Addition of the store-depleting sarco-/endoplasmic reticulum Ca2+-ATPase (SERCA) inhibitor thapsigargin (1 µM) triggered release of Ca2+ from intracellular stores, leading to rapid, transient increase in cytosolic Ca2+ activity. The increase of intracellular Ca2+ concentration following thapsigargin treatment was again similar in therapy sensitive A2780 and therapy resistant A2780cis ovary carcinoma cells (Fig. 3). As illustrated in Fig. 3, the subsequent addition of extracellular Ca2+ was followed by a rapid increase of Fura-2-fluorescence in both cell types reflecting store operated Ca2+ entry (SOCE). Both, peak and slope of SOCE were significantly higher in therapy resistant A2780cis than in therapy sensitive A2780 ovary carcinoma cells. The Orai1 inhibitor 2-APB (50 µM) decreased the peak Ca2+ increase from 0.19 ± 0.02 arbitrary units (n = 6) to 0.07 ± 0.01 arbitrary units (n = 5) in A2780 ovary carcinoma cells and from 0.49 ± 0.03 arbitrary units (n = 6) to 0.04 ± 0.01 arbitrary units (n = 5) A2780cis ovary carcinoma cells (Fig. 4).
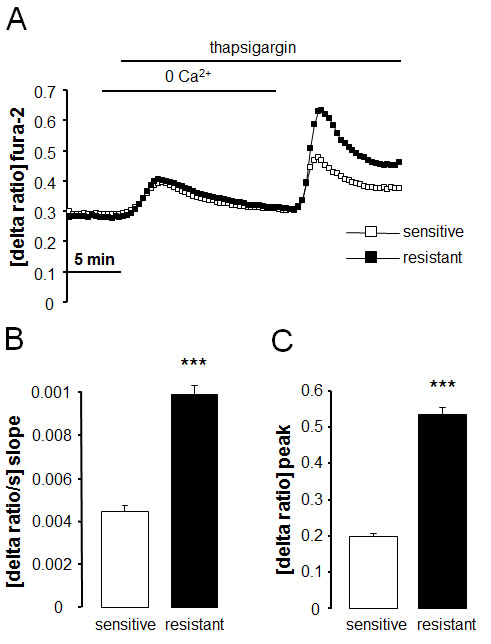
Fig. 3: Intracellular Ca2+ release and store operated Ca2+ entry (SOCE) in therapy sensitive and therapy resistant ovary carcinoma cells. A. Representative tracings of fura-2-fluorescence-ratio in fluorescence spectrometry before, during and after Ca2+ depletion with subsequent addition of thapsigargin (1 µM) in therapy sensitive (white squares) and therapy resistant (black squares) ovary carcinoma cells.. B,C. Arithmetic means (± SEM, n = 7, each experiment 10-30 cells) of slope (B) and peak (C) increase of fura-2-fluorescence-ratio following readdition of extracellular Ca2+ in therapy sensitive (white bars) and therapy resistant (black bars) ovary carcinoma cells. *** (p<0.001) indicates statistically significant difference from therapy sensitive ovary carcinoma cells (ANOVA).
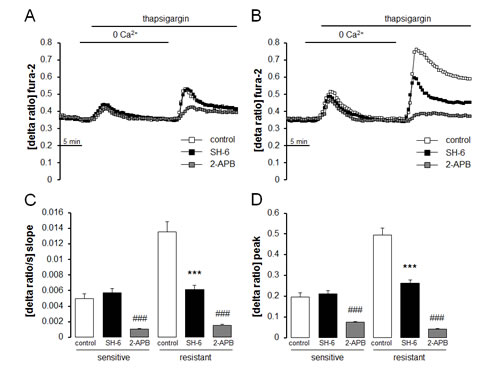
Fig. 4: Effect of Akt inhibitor SH-6 and Orai1 inhibitor 2-APB on intracellular Ca2+ release and store operated Ca2+ entry (SOCE) in therapy sensitive and therapy resistant ovary carcinoma cells. A,B. Representative tracings of fura-2- fluorescence-ratio in fluorescence spectrometry during and after Ca2+ depletion with subsequent thapsigargin (1 µM) addition in therapy sensitive (A) and therapy resistant (B) ovary carcinoma cells without (white squares) and with presence of Akt inhibitor SH-6 (10 µM, black squares) or Orai1 inhibitor 2-APB (50µM, gray squares). C,D. Arithmetic means (± SEM, n = 5-6, each experiment 10-30 cells) of slope (C) and peak (D) increase of fura-2-fluorescence-ratio following Ca2+ readdition in therapy sensitive (left bars) and therapy resistant (right bars) ovary carcinoma cells in the absence (white bars) and presence of Akt inhibitor SH-6 (10 µM, black bars) or Orai1 inhibitor 2-APB (50µM, gray bars). *** and ###(p<0.001) indicate statistically significant difference from absence of inhibitors(ANOVA).
Additional experiments attempted to elucidate mechanisms accounting for the differences in Orai1 and STIM1 abundance as well as SOCE between therapy resistant A2780cis and therapy sensitive A2780 ovary carcinoma cells. A candidate kinase was Akt. Thus, Western blotting analysis was employed to test whether Akt and p-Akt are differentially expressed in therapy resistant A2780cis and in therapy sensitive A2780 ovary carcinoma cells. As a result, the protein abundance of p-Akt/Akt was indeed significantly higher in therapy resistant A2780cis than in therapy sensitive A2780 ovary carcinoma cells (Fig. 5). To further analyze whether Akt activity was required for the differences in SOCE, Fura-2-fluorescence experiments were performed in the absence and presence of Akt inhibitor III (SH-6) (Fig. 4). Pretreatment with SH-6 (10 µM) did not significantly modify the Fura-2-fluorescence of therapy sensitive A2780 (0.35 ± 0.01 a.u., n = 6) and therapy resistant A2780cis (0.35 ± 0.01 a.u., n = 6) ovary carcinoma cells prior to triggering of SOCE. Moreover, the increase in cytosolic Ca2+ activity following addition of thapsigargin (1 µM) was in both cell types similar in the absence and presence of SH-6 (Fig. 4). However, the rapid increase of Fura-2-fluorescence following subsequent addition of extracellular Ca2+ was in therapy resistant A2780cis but not in therapy sensitive A2780 cells significantly blunted by SH-6 (Fig. 4). In the presence of SH-6 no statistically significant difference was observed in SOCE between therapy sensitive A2780 and therapy resistant A2780cis ovary carcinoma cells.
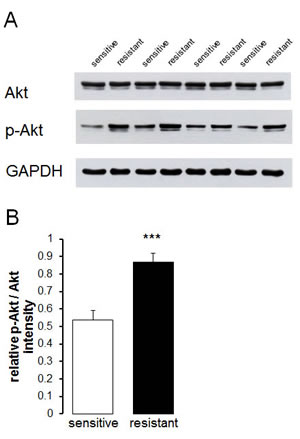
Fig. 5: Protein abundance of Akt and p-Akt in therapy sensitive and therapy resistant ovary carcinoma cells. A. Original Western blot of whole tissue lysate protein of total Akt and phosphorylated p-Akt as well as GAPDH in therapy sensitive and therapy resistant ovary carcinoma cells. B. Arithmetic means ± SEM (n = 4) of the p-Akt/Akt protein abundance ratios in therapy sensitive (white bars) and therapy resistant (black bars) ovary carcinoma cells. *** (p<0.001) indicates statistically significant difference from therapy sensitive ovary carcinoma cells (ANOVA).
In order to further explore the influence of Akt on SOCE, intracellular Ca2+ release and SOCE were determined in therapy sensitive ovary carcinoma cells transfected with constitutively active Akt or inactive Akt. As illustrated in Fig. 6, SOCE was significantly higher following transfection with constitutively active (T308DS473D) Akt than following transfection with inactive (T308AS473A) Akt.
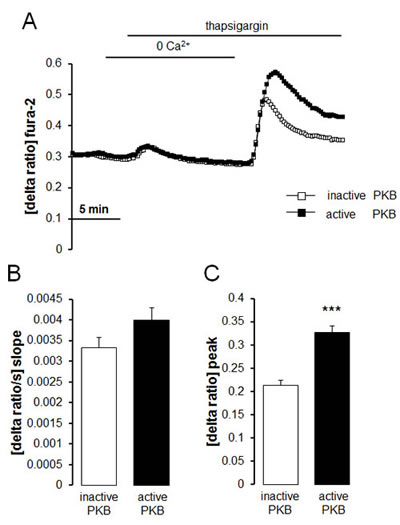
Fig. 6: Intracellular Ca2+ release and store operated Ca2+ entry (SOCE) in therapy sensitive ovary carcinoma cells transfected with constitutively active Akt or inactive Akt. A. Representative tracings of fura-2 fluorescence-ratio in fluorescence spectrometry during and after Ca2+ depletion with subsequent thapsigargin (1 µM) addition in therapy sensitive ovary carcinoma cells transfected with constitutively active (T308DS473D) Akt (black squares) or inactive (T308AS473A) Akt (white squares). B,C. Arithmetic means (± SEM, n = 5, each experiment 10-30 cells) of slope (B) and peak (C) increase of fura-2-fluorescence-ratio in therapy sensitive ovary carcinoma cells transfected with constitutively active (T308DS473D) Akt (black bars) or inactive (T308AS473A) Akt (white bars). *** (p<0.001) indicates statistically significant difference from therapy sensitive ovary carcinoma cells (ANOVA).
In order to test whether Akt sensitive regulation of Orai1 influenced the sensitivity of the ovary carcinoma cells to therapy, the effect of cisplatin on apoptosis of therapy sensitive A2780 and therapy resistant A2780cis cells was tested in the absence and presence of either Akt inhibitor SH-6 or Orai1 inhibitor 2-aminoethoxydiphenyl borate (2-APB). As illustrated in Fig. 7 and Fig. 8, A2780cis cells were resistant to apoptosis induced by cisplatin when compared with sensitive cells. Both SH-6 (10 µM) and 2-ABP (50 µM) restored cisplatin sensitivity of resistant cells significantly to levels comparable with those observed in sensitive cells.
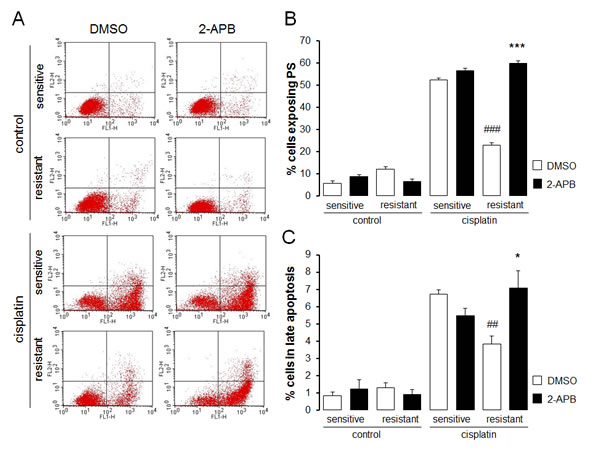
Fig. 7: Effect of SOCE inhibitor 2-APB on cisplatin induced apoptosis of therapy sensitive and therapy resistant ovary carcinoma cells A. Original dot plots of a representative experiment of annexin V binding plotted against propidium iodide staining of therapy sensitive cells (sensitive) and therapy resistant ovary carcinoma cells (resistant) without (left panels) and with (right panels) a 24 h exposure to 50 µM 2-APB and with (cisplatin) and without (control) cisplatin (100 µM, 24 h) treatment. The cells without loss of membrane integrity and externalized phosphatidylserine at the cell surface appear on the lower left quadrant of the dot plot. B. Arithmetic means (± SEM, n =5-6) of the percentage of therapy sensitive (sensitive) and therapy resistant (resistant) ovary carcinoma cells binding Annexin V following 24 h exposure to DMSO (1‰, white bars) or 2-APB (50 µM, black bars) prior to (control) and following (cisplatin) treatment with cisplatin (100 µM, 24 h). *** (p<0.001) indicates statistically significant difference from respective value without 2-APB exposure, ### (p<0.001) indicates statistical difference from therapy sensitive cells following exposure to DMSO (ANOVA). C. Arithmetic means (± SEM, n =5-6) of the percentage of therapy sensitive (sensitive) and therapy resistant (resistant) ovary carcinoma cells undergoing late apoptosis following 24 h exposure to DMSO (1‰, white bars) or 2-APB (50 µM, black bars) prior to (control) and following (cisplatin) treatment with cisplatin (100 µM, 24 h). * (p<0.05) indicates statistically significant difference from respective value without 2-APB exposure, # (p<0.05) indicates statistical difference from therapy sensitive cells following exposure to DMSO (ANOVA).
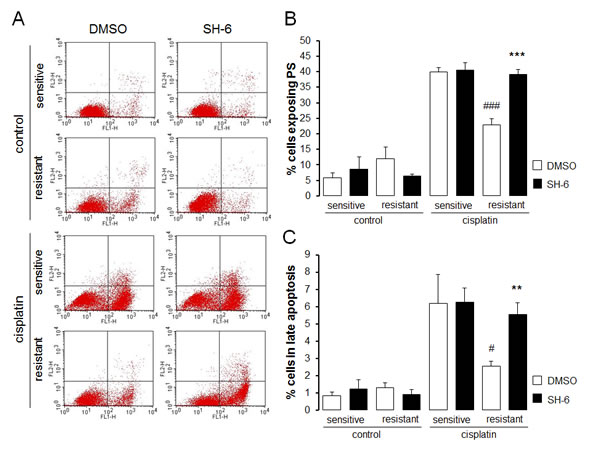
Fig. 8: Effect of Akt inhibitor SH-6 on cisplatin induced apoptosis of therapy sensitive and therapy resistant ovary carcinoma cells A. Original dot plots of annexin V binding plotted against propidium iodide in therapy sensitive cells (sensitive) and therapy resistant (resistant) ovary carcinoma cells without (left panels) and with (right panels) a 24 h exposure to 10 µM SH-6 and without (control) and with (cisplatin) treatment with cisplatin (100 µM, 24 h). The cells without loss of membrane integrity and externalized phosphatidylserine at the cell surface appear on the lower left quadrant of the dot plot. B. Arithmetic means (± SEM, n = 6) of the percentage of therapy sensitive (sensitive) and therapy resistant (resistant) ovary carcinoma cells binding Annexin V following 24 h exposure to DMSO (1‰, white bars) or SH-6 (10 µM, black bars) prior to (control) and following treatment with cisplatin (100 µM, 24 h) (cisplatin). *** (p<0.001) indicates statistically significant difference from respective value without SH-6 exposure, ### (p<0.001) indicates statistical difference from therapy sensitive cells following exposure to DMSO (ANOVA). C. Arithmetic means (± SEM, n = 6) of the percentage of therapy sensitive (sensitive) and therapy resistant (resistant) ovary carcinoma cells undergoing late apoptosis following 24 h exposure to DMSO (1‰, white bars) or SH-6 (10 µM, black bars) prior to (control) and following (cisplatin) treatment with cisplatin (100 µM, 24 h). ** (p<0.01) indicates statistically significant difference from respective value without SH-6 exposure, # (p<0.05) indicates statistical difference from therapy sensitive cells following exposure to DMSO (ANOVA).
Discussion
The present study disclosed the expression of Orai1 and STIM1 in both, therapy sensitive A2780 and therapy resistant A2780cis ovary carcinoma cells. More importantly, the present observations revealed that expression of both, Orai1 and STIM1, was significantly higher in therapy resistant A2780cis than in therapy sensitive A2780 ovary carcinoma cells. The increased expression of Orai1 and STIM1 was paralleled by corresponding differences in store operated Ca2+ entry (SOCE) in those cells. The enhanced Orai1/STIM1 expression and activity was paralleled by enhanced p-Akt protein abundance and abrogated by the Akt inhibitor SH-6. Along those lines, transfection with active Akt was followed by increase of SOCE. Most importantly, pharmacological inhibition of either Akt or Orai1 augmented cisplatin induced apoptosis of therapy resistant A2780cis ovary carcinoma cells and virtually abrogated the differences in cisplatin sensitivity between therapy sensitive A2780 and therapy resistant A2780cis ovary carcinoma cells.
The Ca2+ channel units Orai1, 2, or 3 [6-9] and their regulators STIM 1 or 2 [12, 13, 15] have been implicated in the resistance to apoptosis, in proliferation, and in migration of tumor cells [16-20, 26-34]. In cervical cancer cells STIM1 silencing abrogates proliferation and induces cell cycle arrest at the S and G2/M phase [32]. SOCE may trigger Ca2+ oscillations [35] which regulate a wide variety of cellular functions [36-40] including entering into the S and the M phase of the cell cycle [41, 42] and confering tumor cell survival [43, 44].
In contrast to oscillating cytosolic Ca2+ activity, a sustained increase of cytosolic Ca2+ activity leads to apoptosis [38, 40, 45-53]. Thus, survival of tumor cells may depend on the delicate machinery underlying oscillating cytosolic Ca2+ activity.
Ample evidence has previously been gathered on a role of Akt1 in stimulation of proliferation, inhibition of apoptosis and establishment of therapy resistance [54-62]. Interestingly, Akt1 phosphorylation has previously been shown to be suppressed by SOCE and to be up-regulated by inhibition of Orai1 expression [63]. Thus, the mutual regulation of Akt1 and Orai1 may be part of a negative feedback.
Orai1/STIM1 is known to be up-regulated by the related serum & glucocorticoid inducible kinase [22, 24]. Similar to Akt1, SGK1 is highly expressed in a wide variety of tumor cells [64-67]. SGK1 stimulates cell proliferation and confers cell survival [68-72] and thus actively participates in regulation of tumor growth [65, 73-75]. However, we did not observe significant differences in SGK1 protein abundance between therapy sensitive A2780 and therapy resistant A2780cis ovary carcinoma cells (Suppl. Fig.1). Moreover, the specific SGK1 inhibitor EMD638683 [76] did not significantly affect SOCE in therapy resistant A2780cis ovary carcinoma cells and did not abrogate the differences in SOCE between therapy sensitive A2780 and therapy resistant A2780cis ovary carcinoma cells (Suppl. Fig.2). Thus, under the experimental conditions chosen, Akt1 rather than SGK1 contributes to the therapy resistance of A2780cis ovary carcinoma cells.
The present observations reveal that Akt1 sensitive up-regulation of Orai1 contributes to or even accounts for cisplatin resistance of ovary carcinoma cells. The combined application of cisplatin with Akt1 inhibitors or Orai1 inhibitors may thus overcome therapy resistance of ovary carcinoma. Moreover, the same or similar mechanisms may be operative in other tumor cell types. Different Akt isoforms [77-79], SGK isoforms [65, 80], Orai/STIM isoforms [81-83] or other Ca2+ channels [84-89] may confer survival and thus establish therapy resistance of other tumor cell types. The combination of cytostatic therapy or radiation with the respective kinase or channel inhibitors may thus be a novel therapeutic approach to overcome therapy resistance of tumors.
In conclusion, Orai1 is expressed in therapy sensitive A2780 and therapy resistant A2780cis ovary carcinoma cells. Orai1 transcript levels, Orai1 protein abundance and store operated Ca2+ entry are all higher in therapy resistant A2780cis than in therapy sensitive A2780 ovary carcinoma cells. The difference in SOCE between therapy resistant and therapy sensitive ovary carcinoma cells is paralleled by and at least partially due to upregulation of Orai1 by Akt. Akt dependent upregulation of SOCE contributes to or even accounts for the therapy resistance.
Methods
Ethics Statement
Investigation has been conducted in accordance with the ethical standards and according to the Declaration of Helsinki and according to national and international guidelines and has been approved by the authors’ institutional review board.
Cell culture
Experiments were performed in cisplatin-resistant cells (A2780cis) and their therapy sensitive parent cell (A2780) (ECACC catalogue no. 93112519). A2780cis has been generated by exposure to increasing concentrations of cisplatin and is further resistant to melphalan, adriamycin and irradiation [90-92]. The cells were cultured in Dulbecco’s RPMI media, containing 10% fetal calf serum and 1% antibiotic/antimycotic solution.
Real-time PCR
Total RNA was extracted from ovary carcinoma cells in TriFast (Peqlab, Erlangen, Germany) according to the manufacturer’s instructions. After DNAse digestion reverse transcription of total RNA was performed using Transcriptor High Fidelity cDNA Synthesis Kit (Roche Diagnostics, Penzberg, Germany). Real-time polymerase chain reaction (RT-PCR) of the respective genes were set up in a total volume of 20 µl using 40 ng of cDNA, 500 nM forward and reverse primer and 2x GoTaq® qPCR Master Mix (Promega,Hilden, Germany) according to the manufacturer’s protocol. Cycling conditions were as follows: initial denaturation at 95°C for 2 min, followed by 40 cycles of 95°C for 15 sec, 58°C for 15 sec and 68°C for 20 sec. For amplification the following primers were used (5`->3`orientation):
for Orai1:
fw: CGTATCTAGAATGCATCCGGAGCC
rev: CAGCCACTATGCCTAGGTCGACTAGC
for STIM1:
fw: CCTCGGTACCATCCATGTTGTAGCA
rev: GCGAAAGCTTACGCTAAAATGGTGTCT
for Tbp:
fw: GCCCGAAACGCCGAATAT
rev: CCGTGGTTCGTGGCTCTCT
Specificity of PCR products was confirmed by analysis of a melting curve. Real-time PCR amplifications were performed on a CFX96 Real-Time System (Bio-Rad) and all experiments were done in duplicate. The house-keeping gene Tbp (TATA binding protein) was amplified to standardize the amount of sample RNA. Relative quantification of gene expression was achieved using the ΔCT method as described earlier [93, 94].
Western blotting
For total protein analysis, cells were harvested with lysis buffer (50 mM Tris, 150 mM NaCl, 1% Triton X-100, 0.5% Na-deoxycholate, 0.4% β-Mercaptoethanol, Proteinase-Inhibitor Cocktail, Roche, Mannheim, Germany). Clarified protein lysate was applied to a polyacrylamide gel and analyzed by western blotting [95, 96]. To this end, 30-50 µg protein of whole cell lysate was incubated with primary antibody for Orai1 (1:1000, Millipore, Bedford, MA, USA, [22]), STIM1 (1:1000, cell signaling, Danvers, MA, USA, [97]), Akt (1:1000, cell signaling, Danvers, MA, USA, [93], Phospho-Akt (Thr308) (1:1000, cell signaling, Danvers, MA, USA, [93]and GAPDH (1:1000, cell signaling, Danvers, MA, USA, [98]). For detection secondary antibody conjugated with horseradish peroxidase (HRP) (1:2000, Cell Signaling, Danvers, MA, USA) was used. Antibody binding was identified with ECL detection reagent (Amersham, Freiburg, Germany). Bands were quantified with Quantity One Software (Biorad, München, Germany [22]). The appropriate band has been defined by using Orai1 overexpressing cells [22, 24].
Ca2+ measurements
Fura-2 fluorescence was utilized to determine intracellular Ca2+ concentrations [97]. Cells were loaded with Fura-2/AM (2 µM, Invitrogen, Goettingen, Germany) for 20 min at 37°C. Cells were excited alternatively at 340 nm and 380 nm through an objective (Fluor 40×/1.30 oil) built in an inverted phase-contrast microscope (Axiovert 100, Zeiss, Oberkochen, Germany). Emitted fluorescence intensity was recorded at 505 nm. Data were acquired using specialized computer software (Metafluor, Universal Imaging, Downingtown, USA). Cytosolic Ca2+ activity was estimated from the 340 nm/380 nm ratio. SOCE was determined by extracellular Ca2+ removal and subsequent Ca2+ readdition in the presence of thapsigargin (1 µM, Invitrogen) [99]. For quantification of Ca2+ entry, the slope (delta ratio/s) and peak (delta ratio) were calculated following readdition of Ca2+.
Experiments were performed with Ringer solution containing (in mM): 125 NaCl, 5 KCl, 1.2 MgSO4, 2 CaCl2, 2 Na2HPO4, 32 HEPES, 5 glucose, pH 7.4. To reach nominally Ca2+-free conditions, experiments were performed using Ca2+-free Ringer solution containing (in mM): 125 NaCl, 5 KCl, 1.2 MgSO4, 2 Na2HPO4, 32 HEPES, 0.5 EGTA, 5 glucose, pH 7.4.
Determination of apoptosis
To determine apoptosis, 105 cells/100μl in complete DMEM were incubated in 70% ethanol (molecular grade, Sigma) on ice for 30 minutes, centrifuged at 1600 RPM for 3 minutes at 4oC, added to 200μl of hypotonic buffer (0.1% sodium citrate, 0.1% triton X-100, 2mM CaCl2, 20U/ml RNAse A in deionized water) together with 24μl/ml Annexin V FITC (Mabtag, Germany) and 50 μg/ml propidium iodide (Mabtag, Germany) as well as incubated on ice in the dark for 60 minutes. The cells were washed once at 1600 RPM for 3 minutes, resuspended in PBS-1% BSA and measured immediately with an excitation wavelength of 488 nm and an emission wavelength of 530 nm (FL-1) versus 585 nm (FL-2) with flow cytometry [100] utilizing a FACS Calibur (BD, Heidelberg, Germany).
Statistical ananlysis
Data are provided as means ± SEM; n represents the number of independent experiments. All data were tested for significance using Student’s unpaired two-tailed t-test, one sample t-test or ANOVA (Dunnett’s test), where applicable. Results with p<0.05 were considered statistically significant.
Acknowledgements
The authors acknowledge the meticulous preparation of the manuscript by Ali Soleimanpour and the technical support by Elfriede Faber.
This study was supported by the Deutsche Forschungsgemeinschaft, GRK 1302, SFB 773 and the Open Access Publishing Fund of Tuebingen University.
The authors of this manuscript declare that they have no conflicts of interests
Author’s role
S.Sch., Gui.L., Guo.L., W.Y., S.H., and S.P. executed the experiments, S.Sch. and C.S. analyzed the data, F.L. designed the study, drafted the manuscript and critically discussed the observations. All authors read and approved the manuscript.
Reference List
1. Becchetti A and Arcangeli A. Integrins and ion channels in cell migration: implications for neuronal development, wound healing and metastatic spread. Adv Exp Med Biol. 2010; 674:107-123.
2. Burgoyne RD. Neuronal calcium sensor proteins: generating diversity in neuronal Ca2+ signalling. Nat Rev Neurosci. 2007; 8(3):182-193.
3. Orrenius S, Zhivotovsky B and Nicotera P. Regulation of cell death: the calcium-apoptosis link. Nat Rev Mol Cell Biol. 2003; 4(7):552-565.
4. Roderick HL and Cook SJ. Ca2+ signalling checkpoints in cancer: remodelling Ca2+ for cancer cell proliferation and survival. Nat Rev Cancer. 2008; 8(5):361-375.
5. Salter RD and Watkins SC. Dendritic cell altered states: what role for calcium? Immunol Rev. 2009; 231(1):278-288.
6. Prakriya M, Feske S, Gwack Y, Srikanth S, Rao A and Hogan PG. Orai1 is an essential pore subunit of the CRAC channel. Nature. 2006; 443(7108):230-233.
7. Putney JW, Jr. New molecular players in capacitative Ca2+ entry. J Cell Sci. 2007; 120(Pt 12):1959-1965.
8. Vig M, Peinelt C, Beck A, Koomoa DL, Rabah D, Koblan-Huberson M, Kraft S, Turner H, Fleig A, Penner R and Kinet JP. CRACM1 is a plasma membrane protein essential for store-operated Ca2+ entry. Science. 2006; 312(5777):1220-1223.
9. Yeromin AV, Zhang SL, Jiang W, Yu Y, Safrina O and Cahalan MD. Molecular identification of the CRAC channel by altered ion selectivity in a mutant of Orai. Nature. 2006; 443(7108):226-229.
10. Zhang SL, Kozak JA, Jiang W, Yeromin AV, Chen J, Yu Y, Penna A, Shen W, Chi V and Cahalan MD. Store-dependent and -independent modes regulating Ca2+ release-activated Ca2+ channel activity of human Orai1 and Orai3. J Biol Chem. 2008; 283(25):17662-17671.
11. Fahrner M, Muik M, Derler I, Schindl R, Fritsch R, Frischauf I and Romanin C. Mechanistic view on domains mediating STIM1-Orai coupling. Immunol Rev. 2009; 231(1):99-112.
12. Peinelt C, Vig M, Koomoa DL, Beck A, Nadler MJ, Koblan-Huberson M, Lis A, Fleig A, Penner R and Kinet JP. Amplification of CRAC current by STIM1 and CRACM1 (Orai1). Nat Cell Biol. 2006; 8(7):771-773.
13. Penna A, Demuro A, Yeromin AV, Zhang SL, Safrina O, Parker I and Cahalan MD. The CRAC channel consists of a tetramer formed by Stim-induced dimerization of Orai dimers. Nature. 2008; 456(7218):116-120.
14. Smyth JT, Hwang SY, Tomita T, DeHaven WI, Mercer JC and Putney JW. Activation and regulation of store-operated calcium entry. J Cell Mol Med. 2010; 14(10):2337-2349.
15. Zhang SL, Yu Y, Roos J, Kozak JA, Deerinck TJ, Ellisman MH, Stauderman KA and Cahalan MD. STIM1 is a Ca2+ sensor that activates CRAC channels and migrates from the Ca2+ store to the plasma membrane. Nature. 2005; 437(7060):902-905.
16. Bergmeier W, Weidinger C, Zee I and Feske S. Emerging roles of store-operated Ca ( 2+) entry through STIM and ORAI proteins in immunity, hemostasis and cancer. Channels. 2013; 7(4).
17. Capiod T. The need for calcium channels in cell proliferation. Recent patents on anti-cancer drug discovery. 2013; 8(1):4-17.
18. Courjaret R and Machaca K. STIM and Orai in cellular proliferation and division. Frontiers in bioscience. 2012; 4:331-341.
19. Moccia F, Dragoni S, Lodola F, Bonetti E, Bottino C, Guerra G, Laforenza U, Rosti V and Tanzi F. Store-dependent Ca(2+) entry in endothelial progenitor cells as a perspective tool to enhance cell-based therapy and adverse tumour vascularization. Current medicinal chemistry. 2012; 19(34):5802-5818.
20. Prevarskaya N, Skryma R and Shuba Y. Calcium in tumour metastasis: new roles for known actors. Nat Rev Cancer. 2011; 11(8):609-618.
21. Ogawa A, Firth AL, Smith KA, Maliakal MV and Yuan JX. PDGF enhances store-operated Ca2+ entry by upregulating STIM1/Orai1 via activation of Akt/mTOR in human pulmonary arterial smooth muscle cells. Am J Physiol Cell Physiol. 2012; 302(2):C405-411.
22. Eylenstein A, Gehring EM, Heise N, Shumilina E, Schmidt S, Szteyn K, Munzer P, Nurbaeva MK, Eichenmuller M, Tyan L, Regel I, Foller M, Kuhl D, Soboloff J, Penner R and Lang F. Stimulation of Ca2+-channel Orai1/STIM1 by serum- and glucocorticoid-inducible kinase 1 (SGK1). FASEB J. 2011; 25(6):2012-2021.
23. Borst O, Schmidt EM, Munzer P, Schonberger T, Towhid ST, Elvers M, Leibrock C, Schmid E, Eylenstein A, Kuhl D, May AE, Gawaz M and Lang F. The serum- and glucocorticoid-inducible kinase 1 (SGK1) influences platelet calcium signaling and function by regulation of Orai1 expression in megakaryocytes. Blood. 2012; 119(1):251-261.
24. Eylenstein A, Schmidt S, Gu S, Yang W, Schmid E, Schmidt EM, Alesutan I, Szteyn K, Regel I, Shumilina E and Lang F. Transcription factor NF-kappaB regulates expression of pore-forming Ca2+ channel unit, Orai1, and its activator, STIM1, to control Ca2+ entry and affect cellular functions. J Biol Chem. 2012; 287(4):2719-2730.
25. Lang F, Bohmer C, Palmada M, Seebohm G, Strutz-Seebohm N and Vallon V. (Patho)physiological significance of the serum- and glucocorticoid-inducible kinase isoforms. Physiol Rev. 2006; 86(4):1151-1178.
26. Baryshnikov SG, Pulina MV, Zulian A, Linde CI and Golovina VA. Orai1, a critical component of store-operated Ca2+ entry, is functionally associated with Na+/Ca2+ exchanger and plasma membrane Ca2+ pump in proliferating human arterial myocytes. Am J Physiol Cell Physiol. 2009; 297(5):C1103-C1112.
27. Berra-Romani R, Mazzocco-Spezzia A, Pulina MV and Golovina VA. Ca2+ handling is altered when arterial myocytes progress from a contractile to a proliferative phenotype in culture. Am J Physiol Cell Physiol. 2008; 295(3):C779-C790.
28. Faouzi M, Hague F, Potier M, Ahidouch A, Sevestre H and Ouadid-Ahidouch H. Down-regulation of Orai3 arrests cell-cycle progression and induces apoptosis in breast cancer cells but not in normal breast epithelial cells. J Cell Physiol. 2011; 226(2):542-551.
29. Motiani RK, Abdullaev IF and Trebak M. A novel native store-operated calcium channel encoded by Orai3: selective requirement of Orai3 versus Orai1 in estrogen receptor-positive versus estrogen receptor-negative breast cancer cells. J Biol Chem. 2010; 285(25):19173-19183.
30. Qu B, Al-Ansary D, Kummerow C, Hoth M and Schwarz EC. ORAI-mediated calcium influx in T cell proliferation, apoptosis and tolerance. Cell calcium. 2011; 50(3):261-269.
31. Schmid E, Bhandaru M, Nurbaeva MK, Yang W, Szteyn K, Russo A, Leibrock C, Tyan L, Pearce D, Shumilina E and Lang F. SGK3 regulates Ca(2+) entry and migration of dendritic cells. Cell Physiol Biochem. 2012; 30(6):1423-1435.
32. Chen YF, Chiu WT, Chen YT, Lin PY, Huang HJ, Chou CY, Chang HC, Tang MJ and Shen MR. Calcium store sensor stromal-interaction molecule 1-dependent signaling plays an important role in cervical cancer growth, migration, and angiogenesis. Proceedings of the National Academy of Sciences of the United States of America. 2011; 108(37):15225-15230.
33. Flourakis M, Lehen’kyi V, Beck B, Raphael M, Vandenberghe M, Abeele FV, Roudbaraki M, Lepage G, Mauroy B, Romanin C, Shuba Y, Skryma R and Prevarskaya N. Orai1 contributes to the establishment of an apoptosis-resistant phenotype in prostate cancer cells. Cell death & disease. 2010; 1:e75.
34. Prevarskaya N, Ouadid-Ahidouch H, Skryma R and Shuba Y. Remodelling of Ca2+ transport in cancer: how it contributes to cancer hallmarks? Philosophical transactions of the Royal Society of London Series B, Biological sciences. 2014; 369(1638):20130097.
35. Lang F, Friedrich F, Kahn E, Woll E, Hammerer M, Waldegger S, Maly K and Grunicke H. Bradykinin-induced oscillations of cell membrane potential in cells expressing the Ha-ras oncogene. The Journal of biological chemistry. 1991; 266(8):4938-4942.
36. Berridge MJ, Bootman MD and Lipp P. Calcium--a life and death signal. Nature. 1998; 395(6703):645-648.
37. Berridge MJ, Bootman MD and Roderick HL. Calcium signalling: dynamics, homeostasis and remodelling. Nature reviews Molecular cell biology. 2003; 4(7):517-529.
38. Berridge MJ, Lipp P and Bootman MD. The versatility and universality of calcium signalling. Nature reviews Molecular cell biology. 2000; 1(1):11-21.
39. Lang F, Busch GL, Ritter M, Volkl H, Waldegger S, Gulbins E and Haussinger D. Functional significance of cell volume regulatory mechanisms. Physiological reviews. 1998; 78(1):247-306.
40. Parekh AB and Penner R. Store depletion and calcium influx. Physiological reviews. 1997; 77(4):901-930.
41. Steinhardt RA and Alderton J. Intracellular free calcium rise triggers nuclear envelope breakdown in the sea urchin embryo. Nature. 1988; 332(6162):364-366.
42. Taylor JT, Zeng XB, Pottle JE, Lee K, Wang AR, Yi SG, Scruggs JA, Sikka SS and Li M. Calcium signaling and T-type calcium channels in cancer cell cycling. World journal of gastroenterology : WJG. 2008; 14(32):4984-4991.
43. Heise N, Palme D, Misovic M, Koka S, Rudner J, Lang F, Salih HR, Huber SM and Henke G. Non-selective cation channel-mediated Ca2+-entry and activation of Ca2+/calmodulin-dependent kinase II contribute to G2/M cell cycle arrest and survival of irradiated leukemia cells. Cellular physiology and biochemistry : international journal of experimental cellular physiology, biochemistry, and pharmacology. 2010; 26(4-5):597-608.
44. Parkash J and Asotra K. Calcium wave signaling in cancer cells. Life sciences. 2010; 87(19-22):587-595.
45. Damm TB and Egli M. Calcium’s role in mechanotransduction during muscle development. Cellular physiology and biochemistry : international journal of experimental cellular physiology, biochemistry, and pharmacology. 2014; 33(2):249-272.
46. Fang KM, Chang WL, Wang SM, Su MJ and Wu ML. Arachidonic acid induces both Na+ and Ca2+ entry resulting in apoptosis. Journal of neurochemistry. 2008; 104(5):1177-1189.
47. Green DR and Reed JC. Mitochondria and apoptosis. Science. 1998; 281(5381):1309-1312.
48. Lang F and Hoffmann EK. Role of ion transport in control of apoptotic cell death. Comprehensive Physiology. 2012; 2(3):2037-2061.
49. Liu XH, Kirschenbaum A, Yu K, Yao S and Levine AC. Cyclooxygenase-2 suppresses hypoxia-induced apoptosis via a combination of direct and indirect inhibition of p53 activity in a human prostate cancer cell line. The Journal of biological chemistry. 2005; 280(5):3817-3823.
50. Shaik N, Zbidah M and Lang F. Inhibition of Ca(2+) entry and suicidal erythrocyte death by naringin. Cellular physiology and biochemistry : international journal of experimental cellular physiology, biochemistry, and pharmacology. 2012; 30(3):678-686.
51. Spassova MA, Soboloff J, He LP, Hewavitharana T, Xu W, Venkatachalam K, van Rossum DB, Patterson RL and Gill DL. Calcium entry mediated by SOCs and TRP channels: variations and enigma. Biochimica et biophysica acta. 2004; 1742(1-3):9-20.
52. Svoboda N, Pruetting S, Grissmer S and Kerschbaum HH. cAMP-dependent chloride conductance evokes ammonia-induced blebbing in the microglial cell line, BV-2. Cellular physiology and biochemistry : international journal of experimental cellular physiology, biochemistry, and pharmacology. 2009; 24(1-2):53-64.
53. Towhid ST, Schmidt EM, Tolios A, Munzer P, Schmid E, Borst O, Gawaz M, Stegmann E and Lang F. Stimulation of platelet death by vancomycin. Cellular physiology and biochemistry : international journal of experimental cellular physiology, biochemistry, and pharmacology. 2013; 31(1):102-112.
54. Hers I, Vincent EE and Tavare JM. Akt signalling in health and disease. Cell Signal. 2011; 23(10):1515-1527.
55. Martelli AM, Evangelisti C, Chappell W, Abrams SL, Basecke J, Stivala F, Donia M, Fagone P, Nicoletti F, Libra M, Ruvolo V, Ruvolo P, Kempf CR, Steelman LS and McCubrey JA. Targeting the translational apparatus to improve leukemia therapy: roles of the PI3K/PTEN/Akt/mTOR pathway. Leukemia. 2011; 25(7):1064-1079.
56. Martelli AM, Tabellini G, Bortul R, Tazzari PL, Cappellini A, Billi AM and Cocco L. Involvement of the phosphoinositide 3-kinase/Akt signaling pathway in the resistance to therapeutic treatments of human leukemias. Histol Histopathol. 2005; 20(1):239-252.
57. Michl P and Downward J. Mechanisms of disease: PI3K/AKT signaling in gastrointestinal cancers. Z Gastroenterol. 2005; 43(10):1133-1139.
58. Osaki M, Oshimura M and Ito H. PI3K-Akt pathway: its functions and alterations in human cancer. Apoptosis. 2004; 9(6):667-676.
59. Viglietto G, Amodio N, Malanga D, Scrima M and De Marco C. Contribution of PKB/AKT signaling to thyroid cancer. Front Biosci. 2011; 16:1461-1487.
60. Liu H, Huang Y, Zhang W, Sha Z, Li B, Yang Y, Liu W, Zhang C, Gao F and Cai J. Short-term hyperosmolality pretreatment on cells can reduce the radiosensitivity via RVI and Akt1 activation. Cell Physiol Biochem. 2013; 32(5):1487-1496.
61. Ellis L, Ku SY, Ramakrishnan S, Lasorsa E, Azabdaftari G, Godoy A and Pili R. Combinatorial antitumor effect of HDAC and the PI3K-Akt-mTOR pathway inhibition in a Pten defecient model of prostate cancer. Oncotarget. 2013; 4(12):2225-2236.
62. Saturno G, Valenti M, De Haven Brandon A, Thomas GV, Eccles S, Clarke PA and Workman P. Combining trail with PI3 kinase or HSP90 inhibitors enhances apoptosis in colorectal cancer cells via suppression of survival signaling. Oncotarget. 2013; 4(8):1185-1198.
63. Peng H, Liu J, Sun Q, Chen R, Wang Y, Duan J, Li C, Li B, Jing Y, Chen X, Mao Q, Xu KF, Walker CL, Li J, Wang J and Zhang H. mTORC1 enhancement of STIM1-mediated store-operated Ca(2+) entry constrains tuberous sclerosis complex-related tumor development. Oncogene. 2012.
64. Amato R, Menniti M, Agosti V, Boito R, Costa N, Bond HM, Barbieri V, Tagliaferri P, Venuta S and Perrotti N. IL-2 signals through Sgk1 and inhibits proliferation and apoptosis in kidney cancer cells. J Mol Med (Berl). 2007; 85(7):707-721.
65. Lang F, Perrotti N and Stournaras C. Colorectal carcinoma cells--regulation of survival and growth by SGK1. Int J Biochem Cell Biol. 2010; 42(10):1571-1575.
66. Murakami Y, Hosoi F, Izumi H, Maruyama Y, Ureshino H, Watari K, Kohno K, Kuwano M and Ono M. Identification of sites subjected to serine/threonine phosphorylation by SGK1 affecting N-myc downstream-regulated gene 1 (NDRG1)/Cap43-dependent suppression of angiogenic CXC chemokine expression in human pancreatic cancer cells. Biochem Biophys Res Commun. 2010; 396(2):376-381.
67. Szmulewitz RZ, Chung E, Al Ahmadie H, Daniel S, Kocherginsky M, Razmaria A, Zagaja GP, Brendler CB, Stadler WM and Conzen SD. Serum/glucocorticoid-regulated kinase 1 expression in primary human prostate cancers. Prostate. 2012; 72(2):157-164.
68. Amato R, D’Antona L, Porciatti G, Agosti V, Menniti M, Rinaldo C, Costa N, Bellacchio E, Mattarocci S, Fuiano G, Soddu S, Paggi MG, Lang F and Perrotti N. Sgk1 activates MDM2-dependent p53 degradation and affects cell proliferation, survival, and differentiation. J Mol Med (Berl). 2009; 87(12):1221-1239.
69. Dehner M, Hadjihannas M, Weiske J, Huber O and Behrens J. Wnt signaling inhibits Forkhead box O3a-induced transcription and apoptosis through up-regulation of serum- and glucocorticoid-inducible kinase 1. J Biol Chem. 2008; 283(28):19201-19210.
70. Fagerli UM, Ullrich K, Stuhmer T, Holien T, Kochert K, Holt RU, Bruland O, Chatterjee M, Nogai H, Lenz G, Shaughnessy JD, Jr., Mathas S, Sundan A, Bargou RC, Dorken B, Borset M, et al. Serum/glucocorticoid-regulated kinase 1 (SGK1) is a prominent target gene of the transcriptional response to cytokines in multiple myeloma and supports the growth of myeloma cells. Oncogene. 2011; 30(28):3198-3206.
71. Shanmugam I, Cheng G, Terranova PF, Thrasher JB, Thomas CP and Li B. Serum/glucocorticoid-induced protein kinase-1 facilitates androgen receptor-dependent cell survival. Cell Death Differ. 2007; 14(12):2085-2094.
72. Simon P, Schneck M, Hochstetter T, Koutsouki E, Mittelbronn M, Merseburger A, Weigert C, Niess A and Lang F. Differential regulation of serum- and glucocorticoid-inducible kinase 1 (SGK1) splice variants based on alternative initiation of transcription. Cell Physiol Biochem. 2007; 20(6):715-728.
73. Nasir O, Wang K, Foller M, Gu S, Bhandaru M, Ackermann TF, Boini KM, Mack A, Klingel K, Amato R, Perrotti N, Kuhl D, Behrens J, Stournaras C and Lang F. Relative resistance of SGK1 knockout mice against chemical carcinogenesis. IUBMB Life. 2009; 61(7):768-776.
74. Sherk AB, Frigo DE, Schnackenberg CG, Bray JD, Laping NJ, Trizna W, Hammond M, Patterson JR, Thompson SK, Kazmin D, Norris JD and McDonnell DP. Development of a small-molecule serum- and glucocorticoid-regulated kinase-1 antagonist and its evaluation as a prostate cancer therapeutic. Cancer Res. 2008; 68(18):7475-7483.
75. Wang K, Gu S, Nasir O, Foller M, Ackermann TF, Klingel K, Kandolf R, Kuhl D, Stournaras C and Lang F. SGK1-dependent intestinal tumor growth in APC-deficient mice. Cell Physiol Biochem. 2010; 25(2-3):271-278.
76. Ackermann TF, Boini KM, Beier N, Scholz W, Fuchss T and Lang F. EMD638683, a novel SGK inhibitor with antihypertensive potency. Cell Physiol Biochem. 2011; 28(1):137-146.
77. Agarwal E, Brattain MG and Chowdhury S. Cell survival and metastasis regulation by Akt signaling in colorectal cancer. Cellular signalling. 2013; 25(8):1711-1719.
78. Gonzalez E and McGraw TE. The Akt kinases: isoform specificity in metabolism and cancer. Cell cycle. 2009; 8(16):2502-2508.
79. Yu Z, Xu Z, Disante G, Wright J, Wang M, Li Y, Zhao Q, Ren T, Ju X, Gutman E, Wang G, Addya S, Li T, Xiang Z, Wang C, Yang X, et al. miR-17/20 sensitization of breast cancer cells to chemotherapy-induced apoptosis requires Akt1. Oncotarget. 2014; 5(4):1083-1090.
80. Bruhn MA, Pearson RB, Hannan RD and Sheppard KE. Second AKT: the rise of SGK in cancer signalling. Growth factors. 2010; 28(6):394-408.
81. Faouzi M, Kischel P, Hague F, Ahidouch A, Benzerdjeb N, Sevestre H, Penner R and Ouadid-Ahidouch H. ORAI3 silencing alters cell proliferation and cell cycle progression via c-myc pathway in breast cancer cells. Biochimica et biophysica acta. 2013; 1833(3):752-760.
82. Hoth M and Niemeyer BA. The neglected CRAC proteins: Orai2, Orai3, and STIM2. Current topics in membranes. 2013; 71:237-271.
83. Motiani RK, Hyzinski-Garcia MC, Zhang X, Henkel MM, Abdullaev IF, Kuo YH, Matrougui K, Mongin AA and Trebak M. STIM1 and Orai1 mediate CRAC channel activity and are essential for human glioblastoma invasion. Pflugers Archiv : European journal of physiology. 2013; 465(9):1249-1260.
84. Chen J, Luan Y, Yu R, Zhang Z, Zhang J and Wang W. Transient receptor potential (TRP) channels, promising potential diagnostic and therapeutic tools for cancer. Bioscience trends. 2014; 8(1):1-10.
85. Kondratskyi A, Yassine M, Kondratska K, Skryma R, Slomianny C and Prevarskaya N. Calcium-permeable ion channels in control of autophagy and cancer. Frontiers in physiology. 2013; 4:272.
86. Lang F and Stournaras C. Ion channels in cancer: future perspectives and clinical potential. Philosophical transactions of the Royal Society of London Series B, Biological sciences. 2014; 369(1638):20130108.
87. Loughlin KR. Calcium channel blockers and prostate cancer. Urologic oncology. 2014.
88. Nielsen N, Lindemann O and Schwab A. TRP channels and STIM/ORAI proteins: Sensors and effectors of cancer and stroma cell migration. British journal of pharmacology. 2014.
89. Ohkubo T and Yamazaki J. T-type voltage-activated calcium channel Cav3.1, but not Cav3.2, is involved in the inhibition of proliferation and apoptosis in MCF-7 human breast cancer cells. International journal of oncology. 2012; 41(1):267-275.
90. Behrens BC, Hamilton TC, Masuda H, Grotzinger KR, Whang-Peng J, Louie KG, Knutsen T, McKoy WM, Young RC and Ozols RF. Characterization of a cis-diamminedichloroplatinum(II)-resistant human ovarian cancer cell line and its use in evaluation of platinum analogues. Cancer research. 1987; 47(2):414-418.
91. Louie KG, Behrens BC, Kinsella TJ, Hamilton TC, Grotzinger KR, McKoy WM, Winker MA and Ozols RF. Radiation survival parameters of antineoplastic drug-sensitive and -resistant human ovarian cancer cell lines and their modification by buthionine sulfoximine. Cancer research. 1985; 45(5):2110-2115.
92. Strese S, Fryknas M, Larsson R and Gullbo J. Effects of hypoxia on human cancer cell line chemosensitivity. BMC cancer. 2013; 13:331.
93. Borst O, Munzer P, Gatidis S, Schmidt EM, Schonberger T, Schmid E, Towhid ST, Stellos K, Seizer P, May AE, Lang F and Gawaz M. The inflammatory chemokine CXC motif ligand 16 triggers platelet activation and adhesion via CXC motif receptor 6-dependent phosphatidylinositide 3-kinase/Akt signaling. Circ Res. 2012; 111(10):1297-1307.
94. Feger M, Fajol A, Lebedeva A, Meissner A, Michael D, Voelkl J, Alesutan I, Schleicher E, Reichetzeder C, Hocher B, Qadri SM and Lang F. Effect of carbon monoxide donor CORM-2 on vitamin D3 metabolism. Kidney Blood Press Res. 2013; 37(4-5):496-505.
95. Borst O, Walker B, Munzer P, Russo A, Schmid E, Faggio C, Bigalke B, Laufer S, Gawaz M and Lang F. Skepinone-L, a novel potent and highly selective inhibitor of p38 MAP kinase, effectively impairs platelet activation and thrombus formation. Cell Physiol Biochem. 2013; 31(6):914-924.
96. Voelkl J, Mia S, Meissner A, Ahmed MS, Feger M, Elvira B, Walker B, Alessi DR, Alesutan I and Lang F. PKB/SGK-Resistant GSK-3 Signaling Following Unilateral Ureteral Obstruction. Kidney Blood Press Res. 2013; 38(1):156-164.
97. Bhavsar SK, Schmidt S, Bobbala D, Nurbaeva MK, Hosseinzadeh Z, Merches K, Fajol A, Wilmes J and Lang F. AMPKalpha1-Sensitivity of Orai1 and Ca Entry in T - Lymphocytes. Cell Physiol Biochem. 2013; 32(3):687-698.
98. Lichtenfels R, Rappl G, Hombach AA, Recktenwald CV, Dressler SP, Abken H and Seliger B. A proteomic view at T cell costimulation. PloS one. 2012; 7(4):e32994.
99. Bird GS, DeHaven WI, Smyth JT and Putney JW, Jr. Methods for studying store-operated calcium entry. Methods. 2008; 46(3):204-212.
100. Rotte A, Pasham V, Bhandaru M, Bobbala D, Zelenak C and Lang F. Rapamycin sensitive ROS formation and Na(+)/H(+) exchanger activity in dendritic cells. Cell Physiol Biochem. 2012; 29(3-4):543-550.