
INTRODUCTION
Bladder cancer (BC) is the most common malignancy of the urinary tract, with an estimated 76,960 new cases and 16,390 deaths in the United States of America in 2016 alone [1]. Clinically, BC is classified as non-muscle-invasive BC (NMIBC) and muscle-invasive BC (MIBC). At present, approximately 75% of BC cases are limited to the mucosa or submucosa at first diagnosis; however, about 50%–70% of NMIBC patients have tumor recurrence, and approximately 10%–30% cases progress to MIBC [2]. MIBC is highly aggressive and can rapidly progress and metastasize. Despite the improved therapeutic strategies available nowadays, most MIBC patients still eventually face death [3]. Hence, prediction models that can stratify patients who have an unfavorable prognosis and those who may benefit from early systematic therapy are greatly needed. Until date, tumor stage, grade, and metastasis are regarded as the major prognostic factors for BC. However, the currently used system seems unable to accurately predict the prognosis of BC patients with diverse and complicated tumor backgrounds [4]. Therefore, novel biomarkers that can identify patients at relatively greater risk when used alone, or in combination with other clinicopathological parameters, are required to precisely guide clinical decisions.
E-cadherin is a 120 kDa transmembrane, calcium-dependent cell adhesion protein that mediates cell-to-cell adhesion and maintains structural and functional integrity of epithelial tissues [5]. It also has pivotal barrier functions and maintains the polarity of epithelial cells [6]. Reduced or aberrant E-cadherin expression breaks cell-cell contacts, and thus, cells acquire the ability to migrate [7]. Consequently, aberrant E-cadherin expression promotes the infiltration and metastasis of cancer cells [8]. At present, several studies have reported that reduced E-cadherin expression is correlated with poor prognosis in several types of carcinomas [5, 7, 9–11]. However, the role of E-cadherin in the prognosis of BC remains controversial. Many studies have shown that reduced E-cadherin expression is associated with poor prognosis for BC patients [12–16], but some studies have suggested that there is no relationship between E-cadherin expression and prognosis in BC patients [17–20]. Moreover, numerous studies published in this field are small in size. Therefore, we conducted this systematic review and meta-analysis to quantitatively evaluate the prognostic and clinicopathological significance of E-cadherin expression in BC.
RESULTS
Search results
A total of 851 studies were potentially identified from the initial literature search of the databases [PubMed (n = 144), Embase (n = 255), Cochrane Library (n = 3), and Web of Science (n = 449)], and 528 of these studies were retained after duplicated studies were removed. By reviewing titles and abstracts, 479 studies were excluded because they were non-human studies, letters, case reports, meeting records, reviews, commentaries, and other obvious irrelevant studies. Additionally, to avoid heterogeneity caused by the method used to evaluate E-cadherin expression, studies without immunohistochemistry (IHC)-based evaluation were excluded. The remaining 49 studies were assessed in full text. Subsequently, 30 studies were excluded for various reasons such as without survival data, no data available, without IHC-based evaluation, HR based on multiple proteins, HR based on other proteins, and duplicated publication. Ultimately, a total of 19 studies with 2,089 patients were included in our meta-analysis [12–30]. A flowchart of the literature selection process is shown in Figure 1.
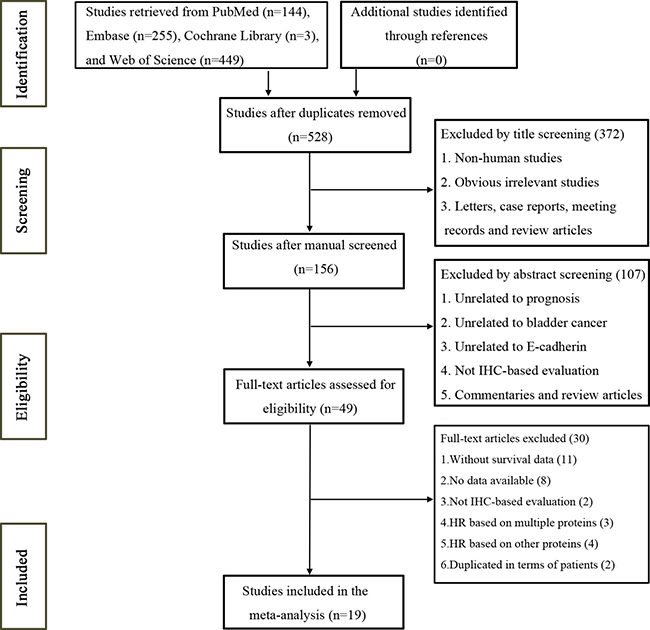
Figure 1: Flow chart of the study selection process.
Characteristics of studies
The fundamental features of the 19 studies are summarized in Table 1. All of these studies were retrospective observational cohort studies and were published between 1995 and 2017. Five studies evaluated patients from the United States, three from China, two from Germany, two from Japan, two from France, one from Italy, one from Sweden, one from Turkey, one from Spain, and one from the United Kingdom. For the prognostic value of reduced E-cadherin expression in BC, 12 studies investigated overall survival (OS), 9 studies investigated progression-free survival (PFS), and 6 studies investigated recurrence-free survival (RFS). Several clinicopathological data were reported in 12 studies (onset age in 4 studies, pathological T stage in 11 studies, metastasis in 4 studies, grade in 12 studies, and carcinoma in situ in 3 studies). All studies applied IHC staining to evaluate E-cadherin expression. Reduced E-cadherin expression was defined using different cut-off values among different studies; thus, we classified all the patients on the basis of their original studies (normal or reduced staining).
Table 1: Characteristics of eligible studies in the meta-analysis
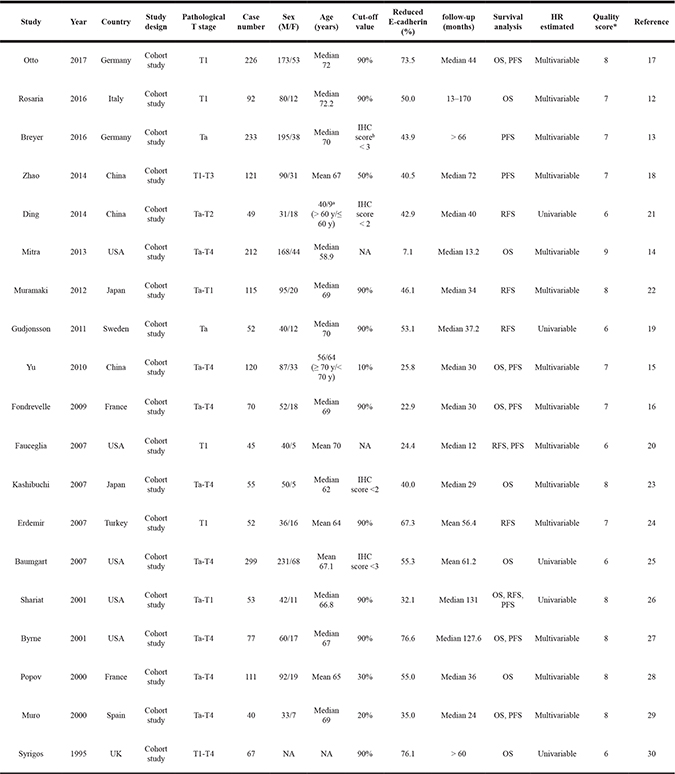
IHC: immunohistochemistry; OS: overall survival; PFS: progression-free survival; RFS: recurrence-free survival; NA: not available.
a40 patients > 60 years, and other 9 patients ≤ 60 years.
bIHC score were evaluated by combining staining intensity and staining distribution.
*The quality of the included studies was evaluated using the Newcastle–Ottawa scale.
Meta-analysis
This meta-analysis showed that reduced E-cadherin expression in BC patients predicted poor OS (a random-effect model, hazard ratio [HR] = 2.73, 95% confidence interval [CI]: 1.74–4.27, p < 0.001; I2 = 65.3%, p = 0.001; Figure 2A), PFS (a random-effect model, HR = 6.39, 95% CI: 3.48–11.73, p < 0.001; I2 = 49.1%, p = 0.047; Figure 2B), and RFS (a fixed-effect model, HR = 2.48, 95% CI: 1.68–3.64, p < 0.001; I2 = 43.3%, p = 0.116; Figure 2C). To explore the source of heterogeneity among these studies, meta-regression analysis and subgroup analysis were performed on the basis of ethnicity, tumor extent, cut-off of staining, HR estimated method, and follow-up time (Table 2). For OS and PFS, meta-regression analysis revealed that cut-off of staining (p = 0.029) might have significant association with OS heterogeneity and ethnicity (p = 0.026) might be a significant contributor to the heterogeneity of PFS. For RFS, meta-regression analysis suggested that ethnicity, tumor extent, cut-off of staining, HR estimated method, and follow-up time were not significant contributors to heterogeneity (p = 0.178–0.862) (Table 2).
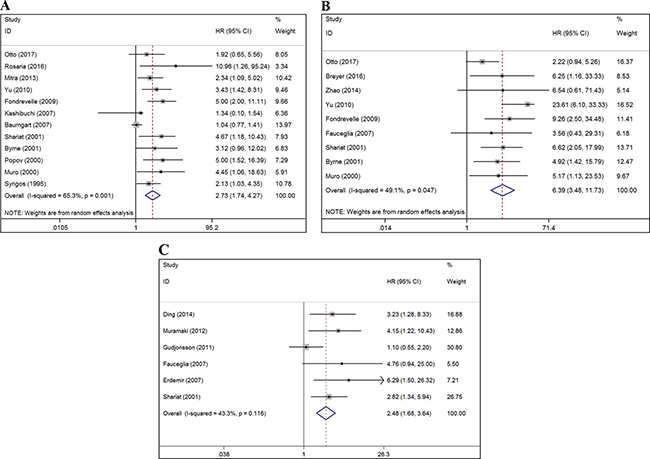
Figure 2: Forest plots of studies evaluating the correlation between E-cadherin expression and the prognostic outcomes of BC patients. (A) Effect of reduced E-cadherin expression on OS. (B) Effect of reduced E-cadherin expression on PFS. (C) Effect of reduced E-cadherin expression on RFS. The red dash-line represents the pooled HR of the included studies. HR: hazard ratio; CI: confidence interval; OS: overall survival; PFS: progression-free survival; RFS: recurrence-free survival; BC: bladder cancer. HR > 1 implies unfavorable prognosis for patients with reduced E-cadherin expression.
Table 2: Subgroup analysis of pooled HR for bladder cancer patients with reduced E-cadherin expression
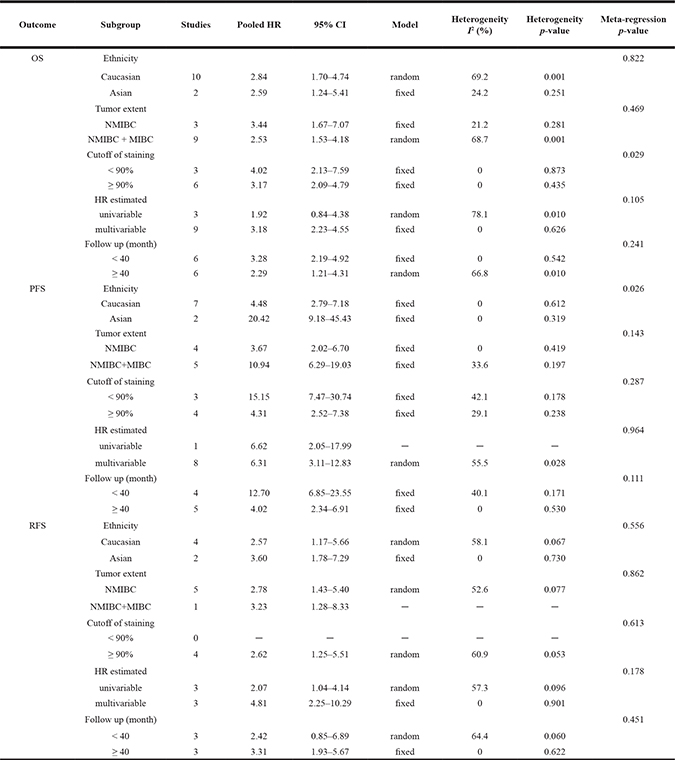
OS: overall survival; PFS: progression-free survival; RFS: recurrence-free survival; HR: hazard ratio; CI: confidence interval; NMIBC: non-muscle-invasive bladder cancer; MIBC: muscle-invasive bladder cancer.
The results of subgroup analysis are detailed in Table 2. With regard to ethnicity, reduced E-cadherin expression was associated with poor OS (HR = 2.84; 95% CI: 1.70–4.74; p < 0.001), PFS (HR = 4.48; 95% CI: 2.79–7.18; p < 0.001), and RFS (HR = 2.57; 95% CI: 1.17–5.66; p = 0.019) in Caucasian patients, and with poor OS (HR = 2.59; 95% CI: 1.24–5.41; p = 0.012), PFS (HR = 20.42; 95% CI: 9.18–45.43; p < 0.001), and RFS (HR = 3.60; 95% CI: 1.78–7.29; p < 0.001) in Asian patients. Regarding tumor extent, reduced E-cadherin expression predicted poor OS (HR = 3.44; 95% CI: 1.67–7.07; p = 0.001), PFS (HR = 3.67; 95% CI: 2.02–6.70; p = 0.003), and RFS (HR = 2.78; 95% CI: 1.43–5.40; p = 0.019) for NMIBC; and with poor OS (HR = 2.53; 95% CI: 1.53–4.18; p < 0.001), PFS (HR = 10.94; 95% CI: 6.29–19.03; p < 0.001), and RFS (HR = 3.23; 95% CI: 1.28–8.33; p = 0.013) for mixed BC (NMIBC + MIBC). For cut-off of staining, reduced E-cadherin expression was associated with poor OS (HR = 4.02; 95% CI: 2.13–7.59; p < 0.001) and PFS (HR = 15.15; 95% CI: 7.47–30.74; p < 0.001) when the cut-off value was less than 90%. Studies with a cut-off value greater than or equal to 90% revealed that reduced E-cadherin expression was correlated with poor OS (HR = 3.17; 95% CI: 2.09–4.79; p < 0.001), PFS (HR = 4.31; 95% CI: 2.52–7.38; p < 0.001), and RFS (HR = 2.62; 95% CI: 1.25–5.51; p = 0.011). With respect to HR estimated method, reduced E-cadherin expression was associated with poor OS (HR = 3.18; 95% CI: 2.23–4.55; p < 0.001), PFS (HR = 6.31; 95% CI: 3.11–12.83; p < 0.001), and RFS (HR = 4.81; 95% CI: 2.25–10.29; p < 0.001) under multivariable analyses and with poor PFS (HR = 6.62; 95% CI: 2.05–17.99; p = 0.002) and RFS (HR = 2.07; 95% CI: 1.04–4.14; p = 0.039) but not with poor OS (HR = 1.92; 95% CI: 0.84–4.38; p = 0.121) under univariable analyses. Moreover, reduced E-cadherin expression predicted poor OS (HR = 2.29; 95% CI: 1.21–4.31; p = 0.011), PFS (HR = 4.02; 95% CI: 2.34–6.91; p < 0.001), and RFS (HR = 3.31; 95% CI: 1.93–5.67; p < 0.001) in BC patients with a follow-up time greater than or equal to 40 months and poor OS (HR = 3.28; 95% CI: 2.19–4.92; p < 0.001) and PFS (HR = 12.70; 95% CI: 6.85–23.55; p < 0.001), but not poor RFS (HR = 2.42; 95% CI: 0.85–6.89; p = 0.098), in BC patients with a follow-up time less than 40 months.
In the comprehensive analyses of the significance of E-cadherin expression as a biomarker for BC, we explored the correlations between reduced E-cadherin expression and various clinicopathological features in patients. As illustrated in Table 3, reduced E-cadherin expression was significantly correlated with pathological T stage (T2–4 vs. Ta-1: risk ratio [RR] = 2.14; 95% CI: 1.70–2.71; p < 0.001), metastasis (yes vs. no: RR = 1.68; 95% CI: 1.17–2.40; p = 0.004), Grade (3 vs. 1/2: RR = 1.58; 95% CI: 1.29–1.93; p < 0.001), and carcinoma in situ (yes vs. no: RR = 1.68; 95% CI: 1.09–2.58; p = 0.018). However, reduced E-cadherin expression was not significantly associated with onset age (> 70 vs. ≤ 70: RR = 1.17; 95% CI: 0.94–1.46; p = 0.153). There was significant inter-study heterogeneity in the analyses of pathological T stage and grade, but no significant heterogeneity was observed in any other parameters (Table 3).
Table 3: Meta-analysis of the association between reduced E-cadherin expression and clinicopathological features of bladder cancer
Variables |
Studies |
Pooled RR |
95% CI |
P Value |
Model |
Heterogeneity I2 (%) |
Heterogeneity p-value |
|---|---|---|---|---|---|---|---|
Age (>70 vs. ≤ 70) |
4 |
1.17 |
0.94–1.46 |
0.153 |
fixed |
4.8 |
0.369 |
pT stage (T2–4 vs. Ta–1) |
11 |
2.14 |
1.70–2.71 |
< 0.001 |
random |
57.0 |
0.010 |
Metastasisa(yes vs. no) |
4 |
1.68 |
1.17–2.40 |
0.004 |
fixed |
33.9 |
0.209 |
Grade (3 vs. 1/2) |
12 |
1.58 |
1.29–1.93 |
< 0.001 |
random |
71.8 |
< 0.001 |
CIS (yes vs. no) |
3 |
1.68 |
1.09–2.58 |
0.018 |
fixed |
45.1 |
0.162 |
aboth lymph node and distant metastases; RR: relative ratio; CI: confidence interval; CIS: carcinoma in situ.
Sensitivity analyses
To validate the stability of our results, we performed a sensitivity analysis by sequentially omitting individual studies. The pooled HR of OS, PFS, and RFS were not significantly influenced, thus indicating the robustness and reliability of our results (Figure 3).
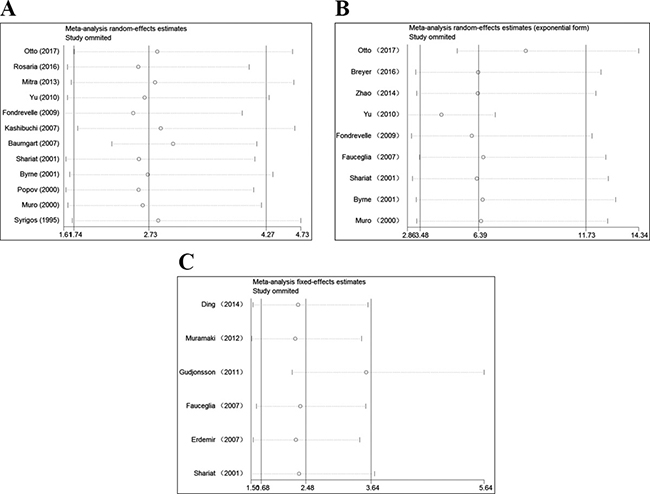
Figure 3: Sensitivity analysis for this meta-analysis. (A) Sensitivity analysis for the reduced E-cadherin expression with OS. (B) Sensitivity analysis for the reduced E-cadherin expression with PFS. (C) Sensitivity analysis for the reduced E-cadherin expression with RFS. OS: overall survival; PFS: progression-free survival; RFS: recurrence-free survival.
Publication bias
Begg’s test (P value) and Egger’s tests (P value, intercept with corresponding 95% CI), as well as funnel plots, were used to assess publication bias in this meta-analysis. As there were limited number of studies (n < 10) for PFS and RFS, publication bias evaluated by Begg’s and Egger’s test was not necessary. As illustrated in Figure 4, the funnel plots for PFS and RFS were symmetrical. However, both of these tests suggested that significant publication bias existed for OS (PBegg’s = 0.451 and PEgger’s = 0.001, intercept 2.63 with 95% CI: 1.48 to 3.79). Trim-and-fill analysis was performed and the results showed that after incorporating two additional studies, the funnel plots were symmetrical and that reduced E-cadherin expression was significantly associated with poor OS (corrected HR = 2.45; 95% CI: 1.62–3.71) (Figure 4).
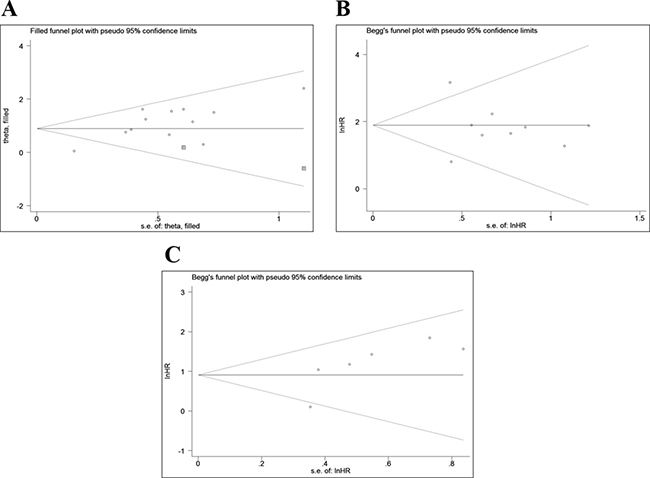
Figure 4: Funnel plots for the assessment of potential publication bias. (A) Funnel plot of trim-and-fill analysis for the reduced E-cadherin expression with OS. (B) Funnel plot for the reduced E-cadherin expression with PFS. (C) Funnel plot for the reduced E-cadherin expression with RFS. OS: overall survival; PFS: progression-free survival; RFS: recurrence-free survival.
DISCUSSION
E-cadherin is an essential intercellular adhesion molecule that correlates with histogenesis and the stabilization and differentiation of epithelial cells [31]. It is generally known that down-regulation of E-cadherin expression is regarded as the most important hallmark of epithelial-to-mesenchymal transformation (EMT), which promotes the progression and metastases of many epithelium-derived carcinomas, including BC [32]. Over recent years, E-cadherin has been attracting increasing attention as a valuable prognostic predictor and potential therapeutic target for carcinomas. Several studies have confirmed that reduced E-cadherin expression is significantly correlated with the poor prognosis of gastric cancer, hepatocellular cancer, lung cancer, head and neck squamous cell carcinoma, and breast cancer [5, 7, 9, 10, 33]. However, the prognostic and clinicopathological roles of reduced E-cadherin expression remain inconsistent for BC. Thus, we performed this meta-analysis to resolve the remaining disagreement and provide valuable evidence on the association between reduced E-cadherin expression and BC prognosis. Additionally, to avoid the heterogeneity caused by the different methods used to evaluate E-cadherin expression, studies without IHC-based evaluation were excluded.
In this study, we focused exclusively on validating E-cadherin IHC-based expression and assessed the prognostic significance of reduced E-cadherin expression in BC patients. Our final analysis involved survival outcomes from 19 eligible studies including 2,089 BC patients. Our results showed that reduced E-cadherin expression significantly predicted unfavorable OS, PFS, and RFS. When we pooled survival data for OS and PFS, there was significant inter-study heterogeneity in our analyses. Consequently, meta-regression analysis and subgroup analysis were performed from five aspects. Meta-regression analysis revealed some significant sources of heterogeneity and suggested that cut-off of staining might have significant association with OS heterogeneity and that ethnicity might be a significant contributor to PFS heterogeneity. Through subgroup analysis, we revealed that reduced E-cadherin expression was significantly correlated with poor OS, PFS, and RFS, regardless of ethnicity, tumor extent, and cut-off of staining. In terms of HR estimated method, reduced E-cadherin expression was associated with poor OS, PFS, and RFS in multivariable analyses, which indicated that reduced E-cadherin might be an independent prognostic factor for survival outcome. Among patients with follow-up time less than 40 months, reduced E-cadherin expression was not significantly associated with poor RFS, even if patients with low-expression of E-cadherin presented with a relatively unfavorable RFS. The absence of a significant correlation in this situation was possibly attributed to the relatively limited number of studies in the subgroups.
Our results also suggested that the down-regulation of E-cadherin expression was associated with a higher pathological T stage, positive metastasis, grade, and carcinoma in situ. The biological mechanism of E-cadherin can partially explain its prognostic and clinicopathological value for BC patients. E-cadherin routinely plays an inhibitory effect on EMT. Reduced E-cadherin expression may therefore induce EMT, which increases tumor cell mesenchymal characteristics and subsequently promotes cell motility and invasive properties [34, 35]. This process accelerates the development and progression of malignant tumors. Furthermore, the low-expression of E-cadherin is very closed associated with the chemoresistance and radioresistance of tumor cells and induces tumor cells to exhibit obvious properties of cancer stem cells [36, 37].
To the best of our knowledge, this study is the first systematic and comprehensive analysis to investigate the associations between E-cadherin expression and prognostic and clinicopathological value in BC patients, although some limitations should be pointed out. First, most of the included studies were retrospective studies that might render our conclusions less reliable. Second, all of the included studies evaluated E-cadherin expression via IHC, although different primary antibody sources and antibody dilution ratios could have resulted in differences in terms of IHC sensitivity. Third, the criteria to define normal or reduced expression of E-cadherin were not uniform across different studies, which may potentially lead to heterogeneity. Thus, a more uniform scoring criteria should be defined in the future. Fourth, relatively limited studies were extracted for some subgroup analyses, which might inevitably increase the risk of random error and contribute to premature results. With more large-scale prospective studies published in the future, an update is necessary to render a more convincing result. Finally, studies with statistically significant results are potentially more likely to be submitted and published, than those with non-significant results, which could generate publication bias [38].
MATERIALS AND METHODS
Search strategy
This meta-analysis was performed in accordance with the guidelines of the Preferred Reporting Items for Systematic Reviews and Meta-Analyses (PRISMA) [39].
A systematic literature search was performed in the electronic databases PubMed, Embase, Cochrane Library, and Web of Science on March 1, 2017, using the following search strategy: (“E-cadherin” or “E-CAD” or “cadherin-1” or “CDH1”) and (“bladder cancer” or “bladder tumor” or “bladder carcinoma” or “bladder neoplasm” or “urothelial cancer” or “urinary tract cancer”) and (“prognosis” or “prognostic” or “survival” or “outcome” or “mortality”). Additionally, we manually searched the references section of all eligible literature.
Selection criteria
Studies were included on the basis of the following criteria: (1) studies that reported the association between E-cadherin expression and its prognostic significance in BC; (2) studies that assessed E-cadherin protein expression using IHC; and (3) studies that described survival outcomes (OS, PFS, or RFS) with HR and 95% CI. Exclusion criteria were as follows: (1) non-English papers; (2) non-human studies; (3) letters, case reports, meeting records, commentaries, or review articles; (4) studies that investigated the survival outcomes of BC based on multiple proteins; (5) studies that did not evaluate E-cadherin protein expression, clinical parameters, and survival outcome; and (6) studies that were unable to provide sufficient data for obtaining HR and 95% CI values. All evaluations were independently conducted by three investigators to ensure the accurate inclusion of studies. For duplicate data, only studies with relatively more details and larger sample sizes were retrieved.
Data extraction
Three individual researchers independently extracted data from the included studies using a predefined form. Discrepancies in data extraction were resolved through negotiation and consultation. The following relevant data were extracted: publication data including author names and the year in which the study was conducted; origin of the studied population; study design; pathological T stage; sample size; sex; patient’s age; cut-off value; follow-up time; and effect estimates, namely, HR of E-cadherin expression for OS, PFS, or RFS, as well as their 95% CI (Table 1).
Quality assessment
The Newcastle–Ottawa scale, which was recommended by the Cochrane Non-Randomized Studies Methods Working Group [40], was used to assess the quality of the included studies. The assessment, with a score ranging from 0 to 9, included three perspectives: selection, comparability, and outcomes. Studies with scores higher than 6 were considered to be of high quality. To assure the quality of this meta-analysis, only high-quality studies included.
Statistical analysis
Pooled HR and RR with 95% CI were used to evaluate the effect of reduced E-cadherin expression on the prognosis and clinicopathological features of BC, respectively. An observed HR > 1 implied a relatively worse prognosis for the group with reduced E-cadherin expression. An observed RR > 1 indicated relatively more advanced clinicopathological features for patients with reduced E-cadherin expression. The heterogeneity of the studies was assessed using Cochran’s Q test and Higgins I-squared statistic. When significant heterogeneity was observed (I2 > 50% or p < 0.05), a random-effect model was used; otherwise, a fixed-effect model was chosen (I2 < 50% and p > 0.05). For additional analysis, subgroup analyses were performed to investigate the association between reduced E-cadherin expression and BC prognosis on the basis of ethnicity, tumor extent, cut-off of staining, HR estimated, and follow-up time. Meta-regression analysis was used to explore the source of inter-study heterogeneity. Potential publication bias was assessed using Begg’s and Egger’s tests. We also performed a sensitivity analysis by sequential omitting individual studies to evaluate the robustness of pooled results. All statistical analyses were performed using Stata 12.0 software (Stata Corporation, College Station, TX, USA), and a two-sided p < 0.05 was considered statistically significant.
CONCLUSIONS
In conclusion, despite these limitations, our meta-analysis suggested the prognostic and clinicopathological significance of E-cadherin expression in patients with BC. Our results revealed that reduced E-cadherin expression predicted poor prognosis and advanced clinicopathological characteristics, which could potentially serve as a risk stratification biomarker, and even a valuable therapeutic target, for BC patients. However, more large-scale prospective studies using uniform criteria and long-term follow-up are required to confirm our findings in the future.
CONFLICTS OF INTEREST
No potential conflicts of interest were disclosed.
FUNDING
None.
REFERENCES
1. Siegel RL, Miller KD, Jemal A. Cancer statistics, 2016. CA Cancer J Clin. 2016; 66:7–30.
2. Kamat AM, Hahn NM, Efstathiou JA, Lerner SP, Malmstrom PU, Choi W, Guo CC, Lotan Y, Kassouf W. Bladder cancer. Lancet. 2016; 388:2796–2810.
3. Chou R, Selph SS, Buckley DI, Gustafson KS, Griffin JC, Grusing SE, Gore JL. Treatment of muscle-invasive bladder cancer: A systematic review. Cancer. 2016; 122:842–851.
4. Luo Y, Zhang X, Mo M, Tan Z, Huang L, Zhou H, Wang C, Wei F, Qiu X, He R, Chen G. High Ki-67 Immunohistochemical Reactivity Correlates With Poor Prognosis in Bladder Carcinoma: A Comprehensive Meta-Analysis with 13,053 Patients Involved. Medicine (Baltimore). 2016; 95:e3337.
5. Li Z, Yin S, Zhang L, Liu W, Chen B. Prognostic value of reduced E-cadherin expression in breast cancer: a meta-analysis. Oncotarget. 2017; 8:16445–16455. http://doi.org/10.18632/oncotarget.14860.
6. Luo SL, Xie YG, Li Z, Ma JH, Xu X. E-cadherin expression and prognosis of oral cancer: a meta-analysis. Tumour Biol. 2014; 35:5533–5537.
7. Ren X, Wang J, Lin X, Wang X. E-cadherin expression and prognosis of head and neck squamous cell carcinoma: evidence from 19 published investigations. Onco Targets Ther. 2016; 9:2447–2453.
8. Deeb G, Wang J, Ramnath N, Slocum HK, Wiseman S, Beck A, Tan D. Altered E-cadherin and epidermal growth factor receptor expressions are associated with patient survival in lung cancer: a study utilizing high-density tissue microarray and immunohistochemistry. Mod Pathol. 2004; 17:430–439.
9. Xing X, Tang YB, Yuan G, Wang Y, Wang J, Yang Y, Chen M. The prognostic value of E-cadherin in gastric cancer: a meta-analysis. Int J Cancer. 2013; 132:2589–2596.
10. Chen J, Zhao J, Ma R, Lin H, Liang X, Cai X. Prognostic significance of E-cadherin expression in hepatocellular carcinoma: a meta-analysis. PLoS One. 2014; 9:e103952.
11. Wang N, He YL, Pang LJ, Zou H, Liu CX, Zhao J, Hu JM, Zhang WJ, Qi Y, Li F. Down-regulated E-cadherin expression is associated with poor five-year overall survival in bone and soft tissue sarcoma: results of a meta-analysis. PLoS One. 2015; 10:e0121448.
12. Raspollini MR, Luque RJ, Menendez CL, Bollito E, Brunelli M, Martignoni G, Montironi R, Cheng L, Blanca A, Baroni G, Minervini A, Lopez-Beltran A. T1 high-grade bladder carcinoma outcome: the role of p16, topoisomerase-IIalpha, survivin, and E-cadherin. Hum Pathol. 2016; 57:78–84.
13. Breyer J, Gierth M, Shalekenov S, Aziz A, Schafer J, Burger M, Denzinger S, Hofstadter F, Giedl C, Otto W. Epithelial-mesenchymal transformation markers E-cadherin and survivin predict progression of stage pTa urothelial bladder carcinoma. World J Urol. 2016; 34:709–716.
14. Mitra AP, Castelao JE, Hawes D, Tsao-Wei DD, Jiang X, Shi SR, Datar RH, Skinner EC, Stein JP, Groshen S, Yu MC, Ross RK, Skinner DG, et al. Combination of molecular alterations and smoking intensity predicts bladder cancer outcome: a report from the Los Angeles Cancer Surveillance Program. Cancer. 2013; 119:756–765.
15. Yu Q, Zhang K, Wang X, Liu X, Zhang Z. Expression of transcription factors snail, slug, and twist in human bladder carcinoma. J Exp Clin Cancer Res. 2010; 29:119.
16. Fondrevelle ME, Kantelip B, Reiter RE, Chopin DK, Thiery JP, Monnien F, Bittard H, Wallerand H. The expression of Twist has an impact on survival in human bladder cancer and is influenced by the smoking status. Urol Oncol. 2009; 27:268–276.
17. Otto W, Breyer J, Herdegen S, Eder F, Bertz S, May M, Mayr R, Lausenmeyer EM, Denzinger S, van Rhijn BW, Burger M, Hartmann A. WHO 1973 grade 3 and infiltrative growth pattern proved, aberrant E-cadherin expression tends to be of predictive value for progression in a series of stage T1 high-grade bladder cancer after organ-sparing approach. Int Urol Nephrol. 2017; 49:431–437.
18. Zhao J, Dong D, Sun L, Zhang G, Sun L. Prognostic significance of the epithelial-to-mesenchymal transition markers e-cadherin, vimentin and twist in bladder cancer. Int Braz J Urol. 2014; 40:179–189.
19. Gudjonsson S, Bendahl PO, Chebil G, Hoglund M, Lindgren D, Lundberg LM, Lovgren K, Ferno M, Mansson W, Liedberg F. Can tissue microarray-based analysis of protein expression predict recurrence of stage Ta bladder cancer? Scand J Urol Nephrol. 2011; 45:270–277.
20. Mhawech-Fauceglia P, Fischer G, Alvarez V, Jr., Ahmed A, Herrmann FR. Predicting outcome in minimally invasive (T1a and T1b) urothelial bladder carcinoma using a panel of biomarkers: a high throughput tissue microarray analysis. BJU Int. 2007; 100:1182–1187.
21. Ding X, Wang Y, Ma X, Guo H, Yan X, Chi Q, Li J, Hou Y, Wang C. Expression of HMGA2 in bladder cancer and its association with epithelial-to-mesenchymal transition. Cell Prolif. 2014; 47:146–151.
22. Muramaki M, Miyake H, Terakawa T, Kumano M, Sakai I, Fujisawa M. Expression profile of E-cadherin and N-cadherin in non-muscle-invasive bladder cancer as a novel predictor of intravesical recurrence following transurethral resection. Urol Oncol. 2012; 30:161–166.
23. Kashibuchi K, Tomita K, Schalken JA, Kume H, Takeuchi T, Kitamura T. The prognostic value of E-cadherin, alpha-, beta- and gamma-catenin in bladder cancer patients who underwent radical cystectomy. Int J Urol. 2007; 14:789–794.
24. Erdemir F, Ozcan F, Kilicaslan I, Parlaktas BS, Uluocak N, Gokce O. The relationship between the expression of E-cadherin and tumor recurrence and progression in high-grade stage T1 bladder urothelial carcinoma. Int Urol Nephrol. 2007; 39:1031–1037.
25. Baumgart E, Cohen MS, Silva Neto B, Jacobs MA, Wotkowicz C, Rieger-Christ KM, Biolo A, Zeheb R, Loda M, Libertino JA, Summerhayes IC. Identification and prognostic significance of an epithelial-mesenchymal transition expression profile in human bladder tumors. Clin Cancer Res. 2007; 13:1685–1694.
26. Shariat SF, Pahlavan S, Baseman AG, Brown RM, Green AE, Wheeler TM, Lerner SP. E-cadherin expression predicts clinical outcome in carcinoma in situ of the urinary bladder. Urology. 2001; 57:60–65.
27. Byrne RR, Shariat SF, Brown R, Kattan MW, Morton RJ, Wheeler TM, Lerner SP. E-cadherin immunostaining of bladder transitional cell carcinoma, carcinoma in situ and lymph node metastases with long-term followup. J Urol. 2001; 165:1473–1479.
28. Popov Z, Gil-Diez de Medina S, Lefrere-Belda MA, Hoznek A, Bastuji-Garin S, Abbou CC, Thiery JP, Radvanyi F, Chopin DK. Low E-cadherin expression in bladder cancer at the transcriptional and protein level provides prognostic information. Br J Cancer. 2000; 83:209–214.
29. Garcia del Muro X, Torregrosa A, Munoz J, Castellsague X, Condom E, Vigues F, Arance A, Fabra A, Germa JR. Prognostic value of the expression of E-cadherin and beta-catenin in bladder cancer. Eur J Cancer. 2000; 36:357–362.
30. Syrigos KN, Krausz T, Waxman J, Pandha H, Rowlinson-Busza G, Verne J, Epenetos AA, Pignatelli M. E-cadherin expression in bladder cancer using formalin-fixed, paraffin-embedded tissues: correlation with histopathological grade, tumour stage and survival. Int J Cancer. 1995; 64:367–370.
31. Berx G, van Roy F. Involvement of members of the cadherin superfamily in cancer. Cold Spring Harb Perspect Biol. 2009; 1:a003129.
32. Bryan RT, Tselepis C. Cadherin switching and bladder cancer. J Urol. 2010; 184:423–431.
33. Yang YL, Chen MW, Xian L. Prognostic and clinicopathological significance of downregulated E-cadherin expression in patients with non-small cell lung cancer (NSCLC): a meta-analysis. PLoS One. 2014; 9:e99763.
34. Kalluri R, Weinberg RA. The basics of epithelial-mesenchymal transition. J Clin Invest. 2009; 119:1420–1428.
35. van der Horst G, Bos L, van der Pluijm G. Epithelial plasticity, cancer stem cells, and the tumor-supportive stroma in bladder carcinoma. Mol Cancer Res. 2012; 10:995–1009.
36. Nantajit D, Lin D, Li JJ. The network of epithelial-mesenchymal transition: potential new targets for tumor resistance. J Cancer Res Clin Oncol. 2015; 141:1697–1713.
37. Kong D, Li Y, Wang Z, Sarkar FH. Cancer Stem Cells and Epithelial-to-Mesenchymal Transition (EMT)-Phenotypic Cells: Are They Cousins or Twins? Cancers (Basel). 2011; 3:716–729.
38. Sutton AJ, Song F, Gilbody SM, Abrams KR. Modelling publication bias in meta-analysis: a review. Stat Methods Med Res. 2000; 9:421–445.
39. Moher D, Liberati A, Tetzlaff J, Altman DG, Group P. Preferred reporting items for systematic reviews and meta-analyses: the PRISMA statement. PLoS Med. 2009; 6:e1000097.
40. Stang A. Critical evaluation of the Newcastle-Ottawa scale for the assessment of the quality of nonrandomized studies in meta-analyses. Eur J Epidemiol. 2010; 25:603–605.